


Effect of Ultrasonication Parameters on the Structural, Morphological, and Electrical Properties of Polypyrrole Nanoparticles and Optimization by Response Surface Methodology

 ,
,  , ,
, ,
Abstract
1. Introduction
2. Materials and Methods
2.1. Materials
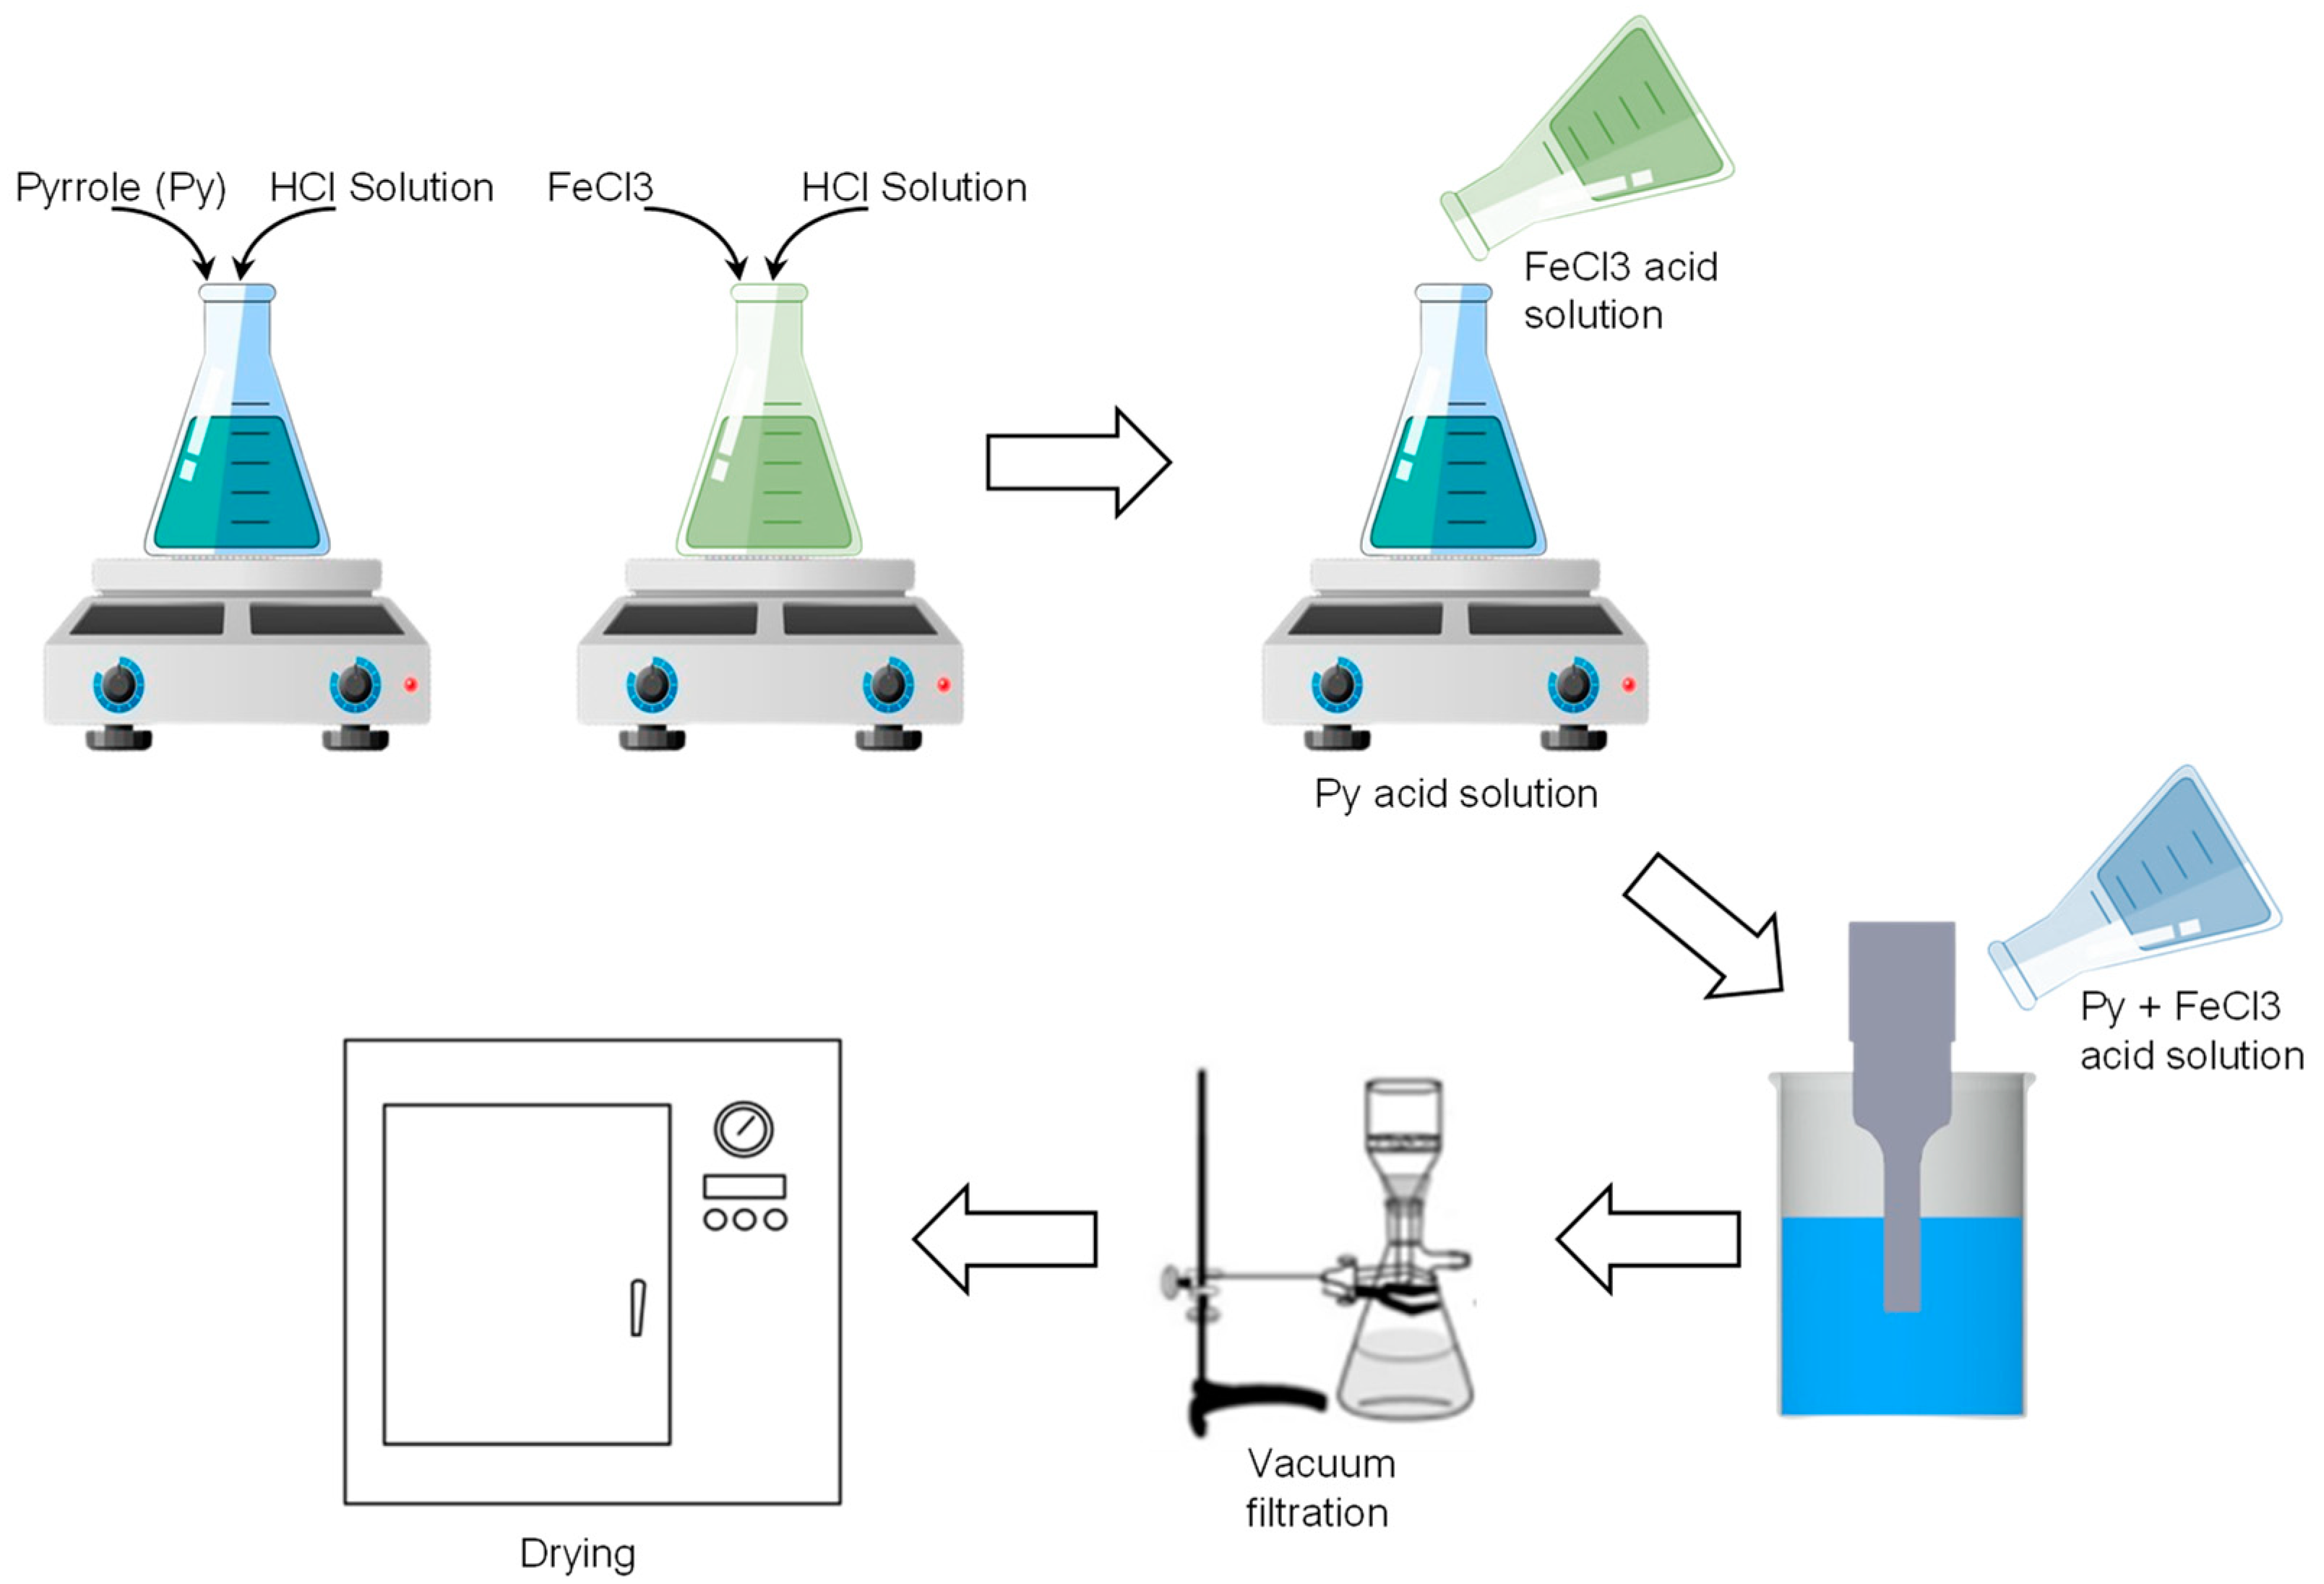
2.2. PPy Nanoparticle Preparations
2.3. Experimental Design and Optimization
2.4. Characterization
3. Results and Discussion
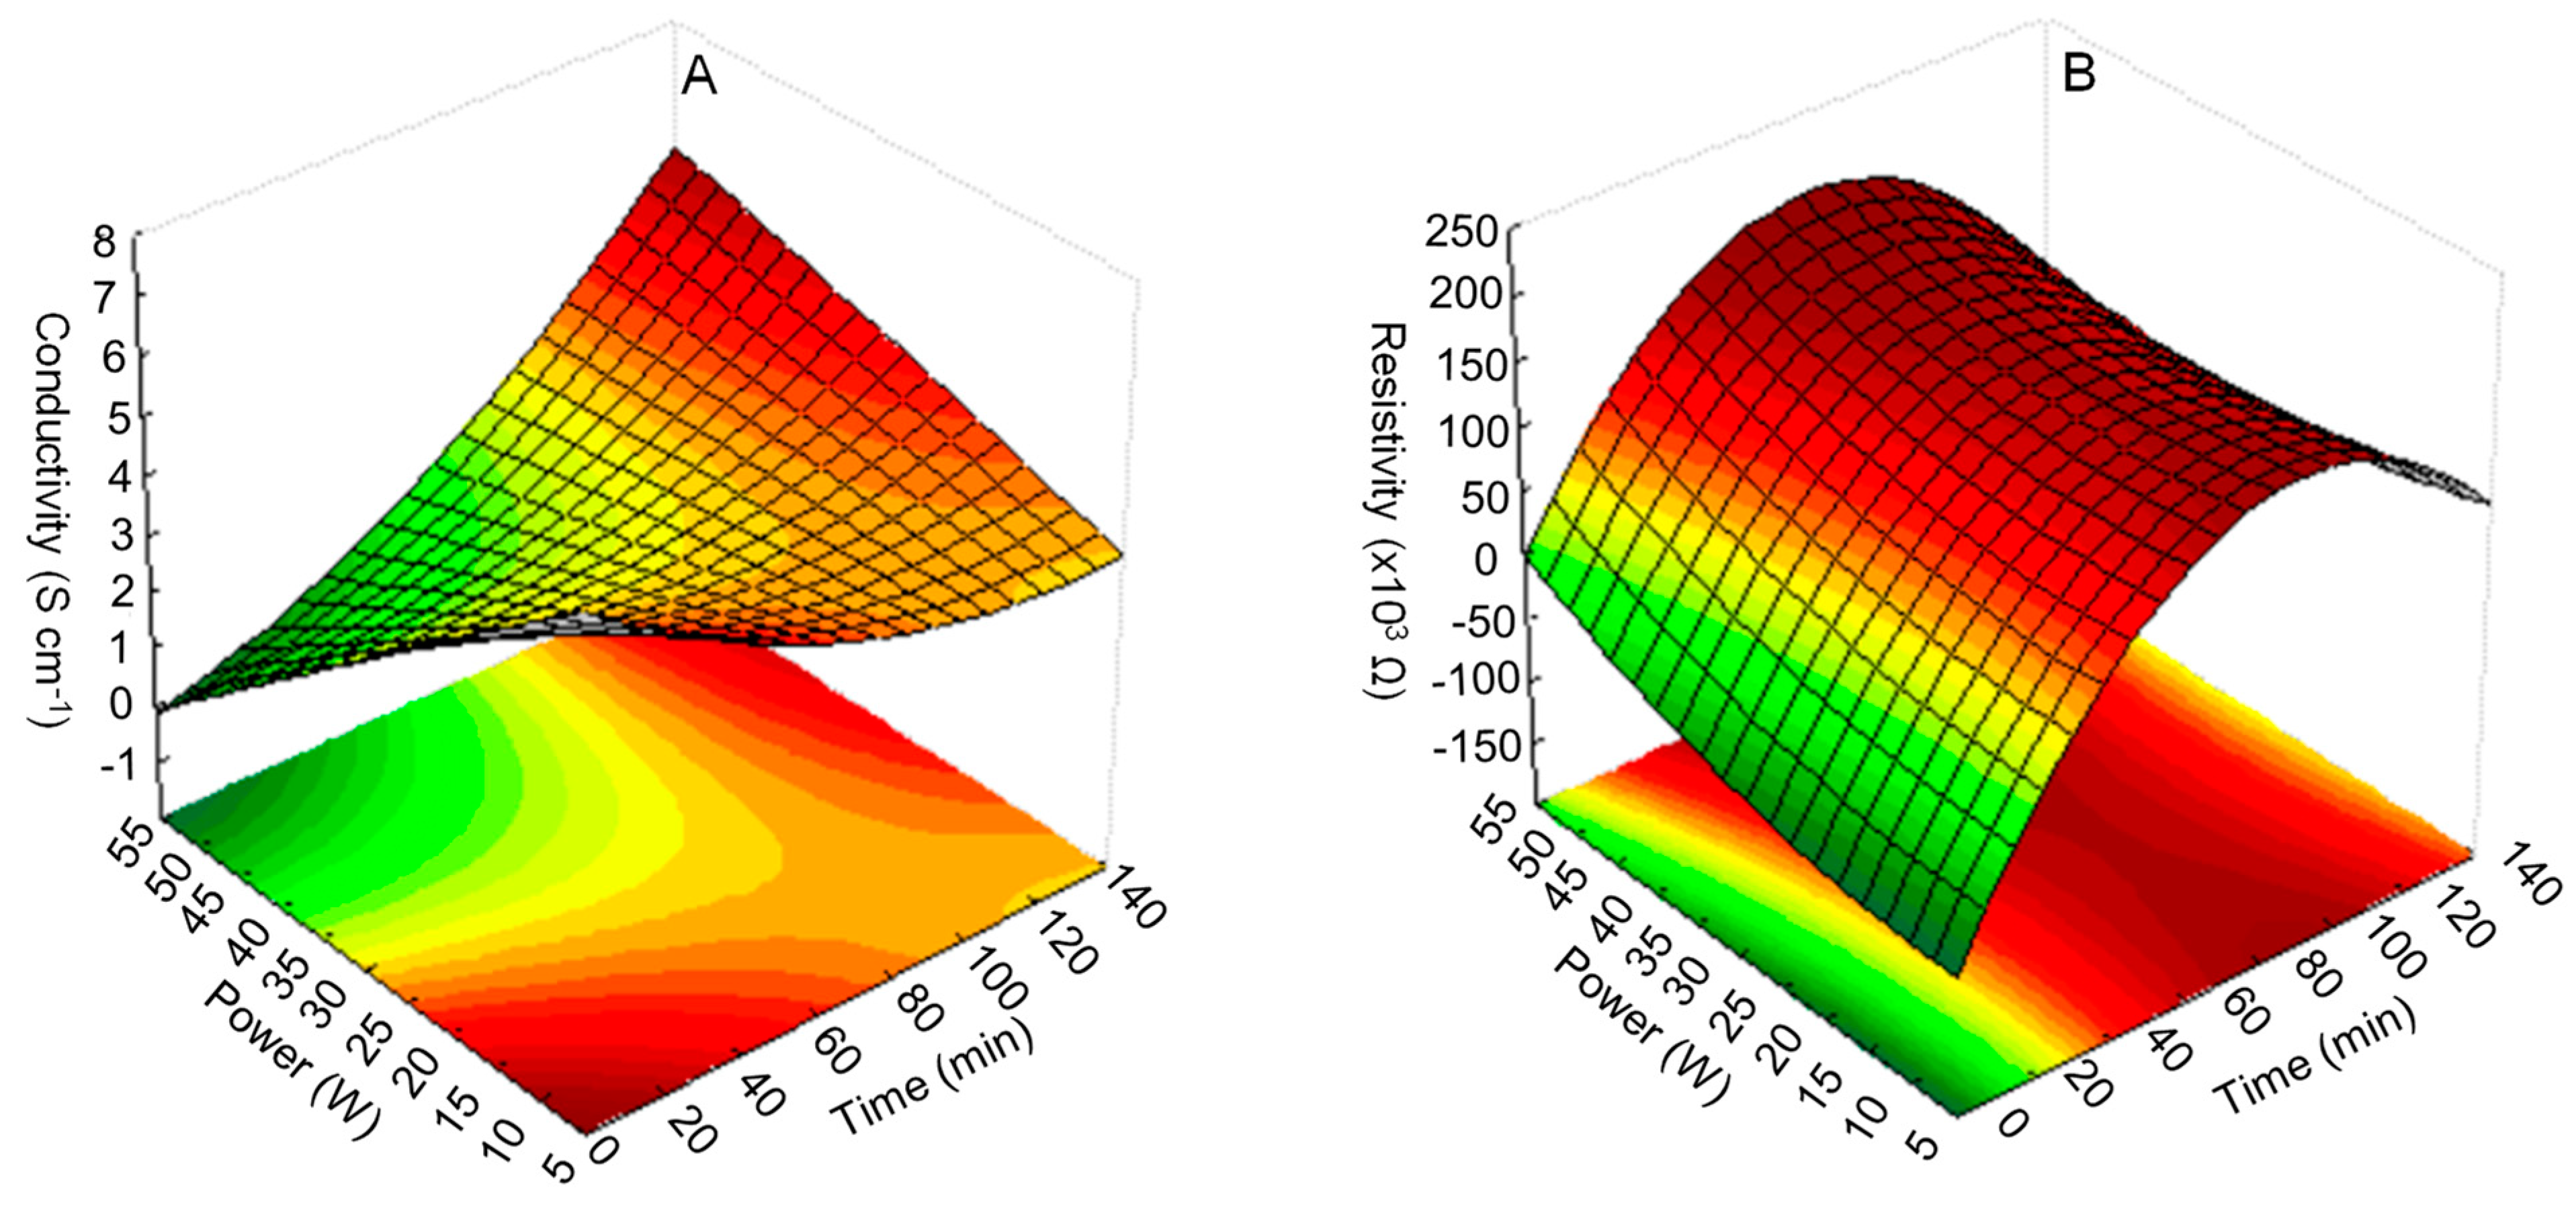
3.1. RSM Analysis
3.2. Characterization of PPy
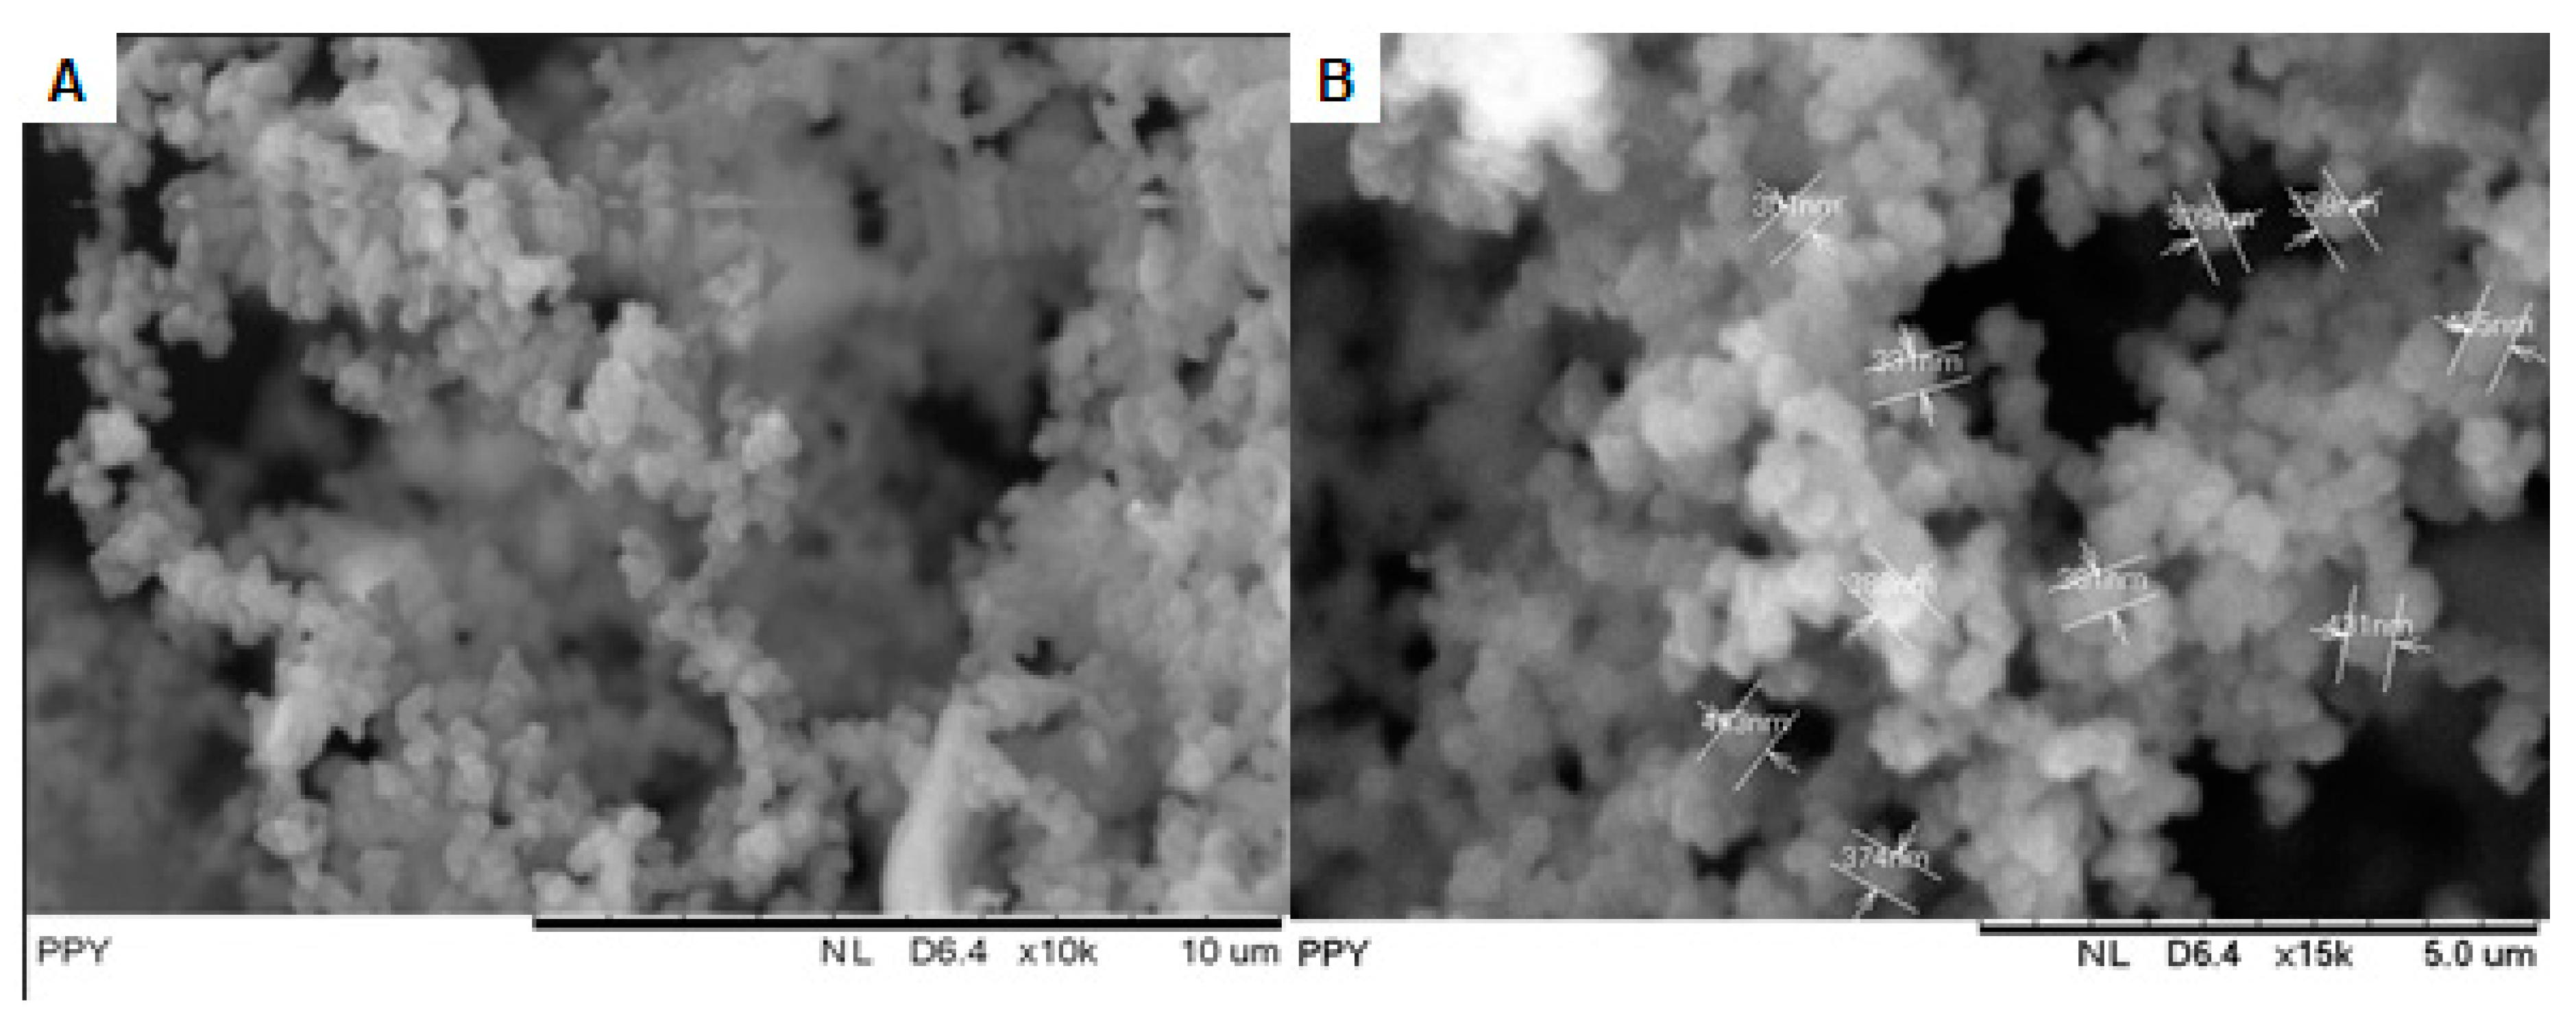
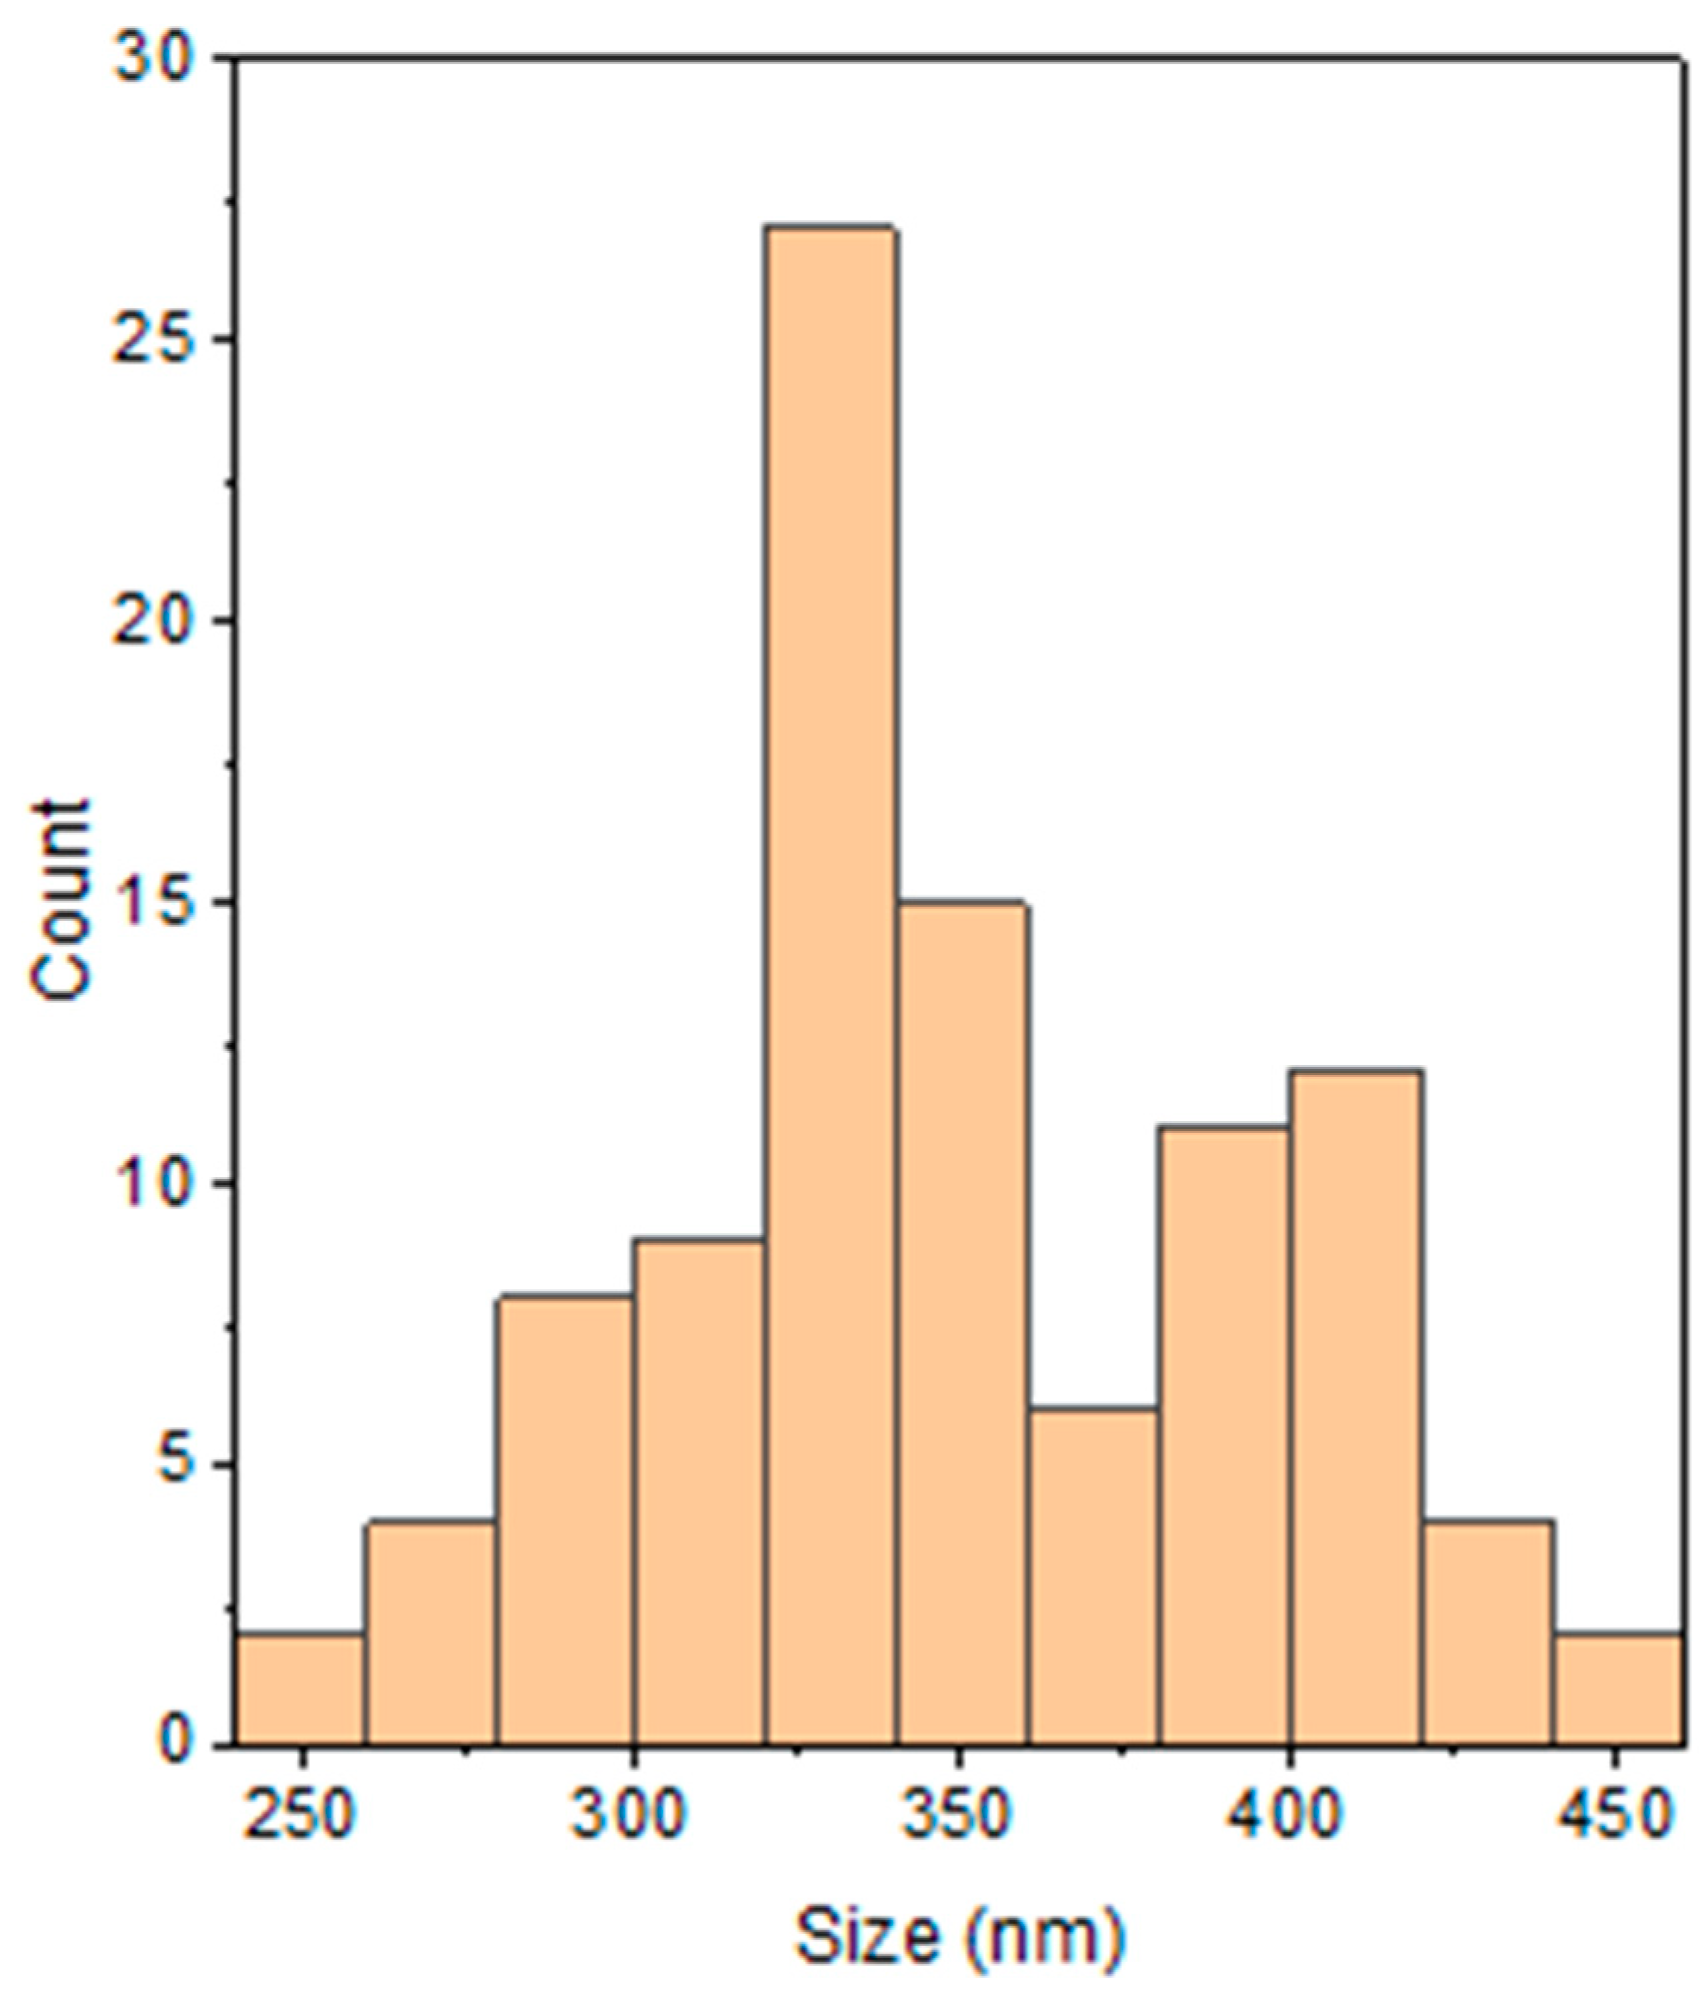
3.2.1. Morphological Studies
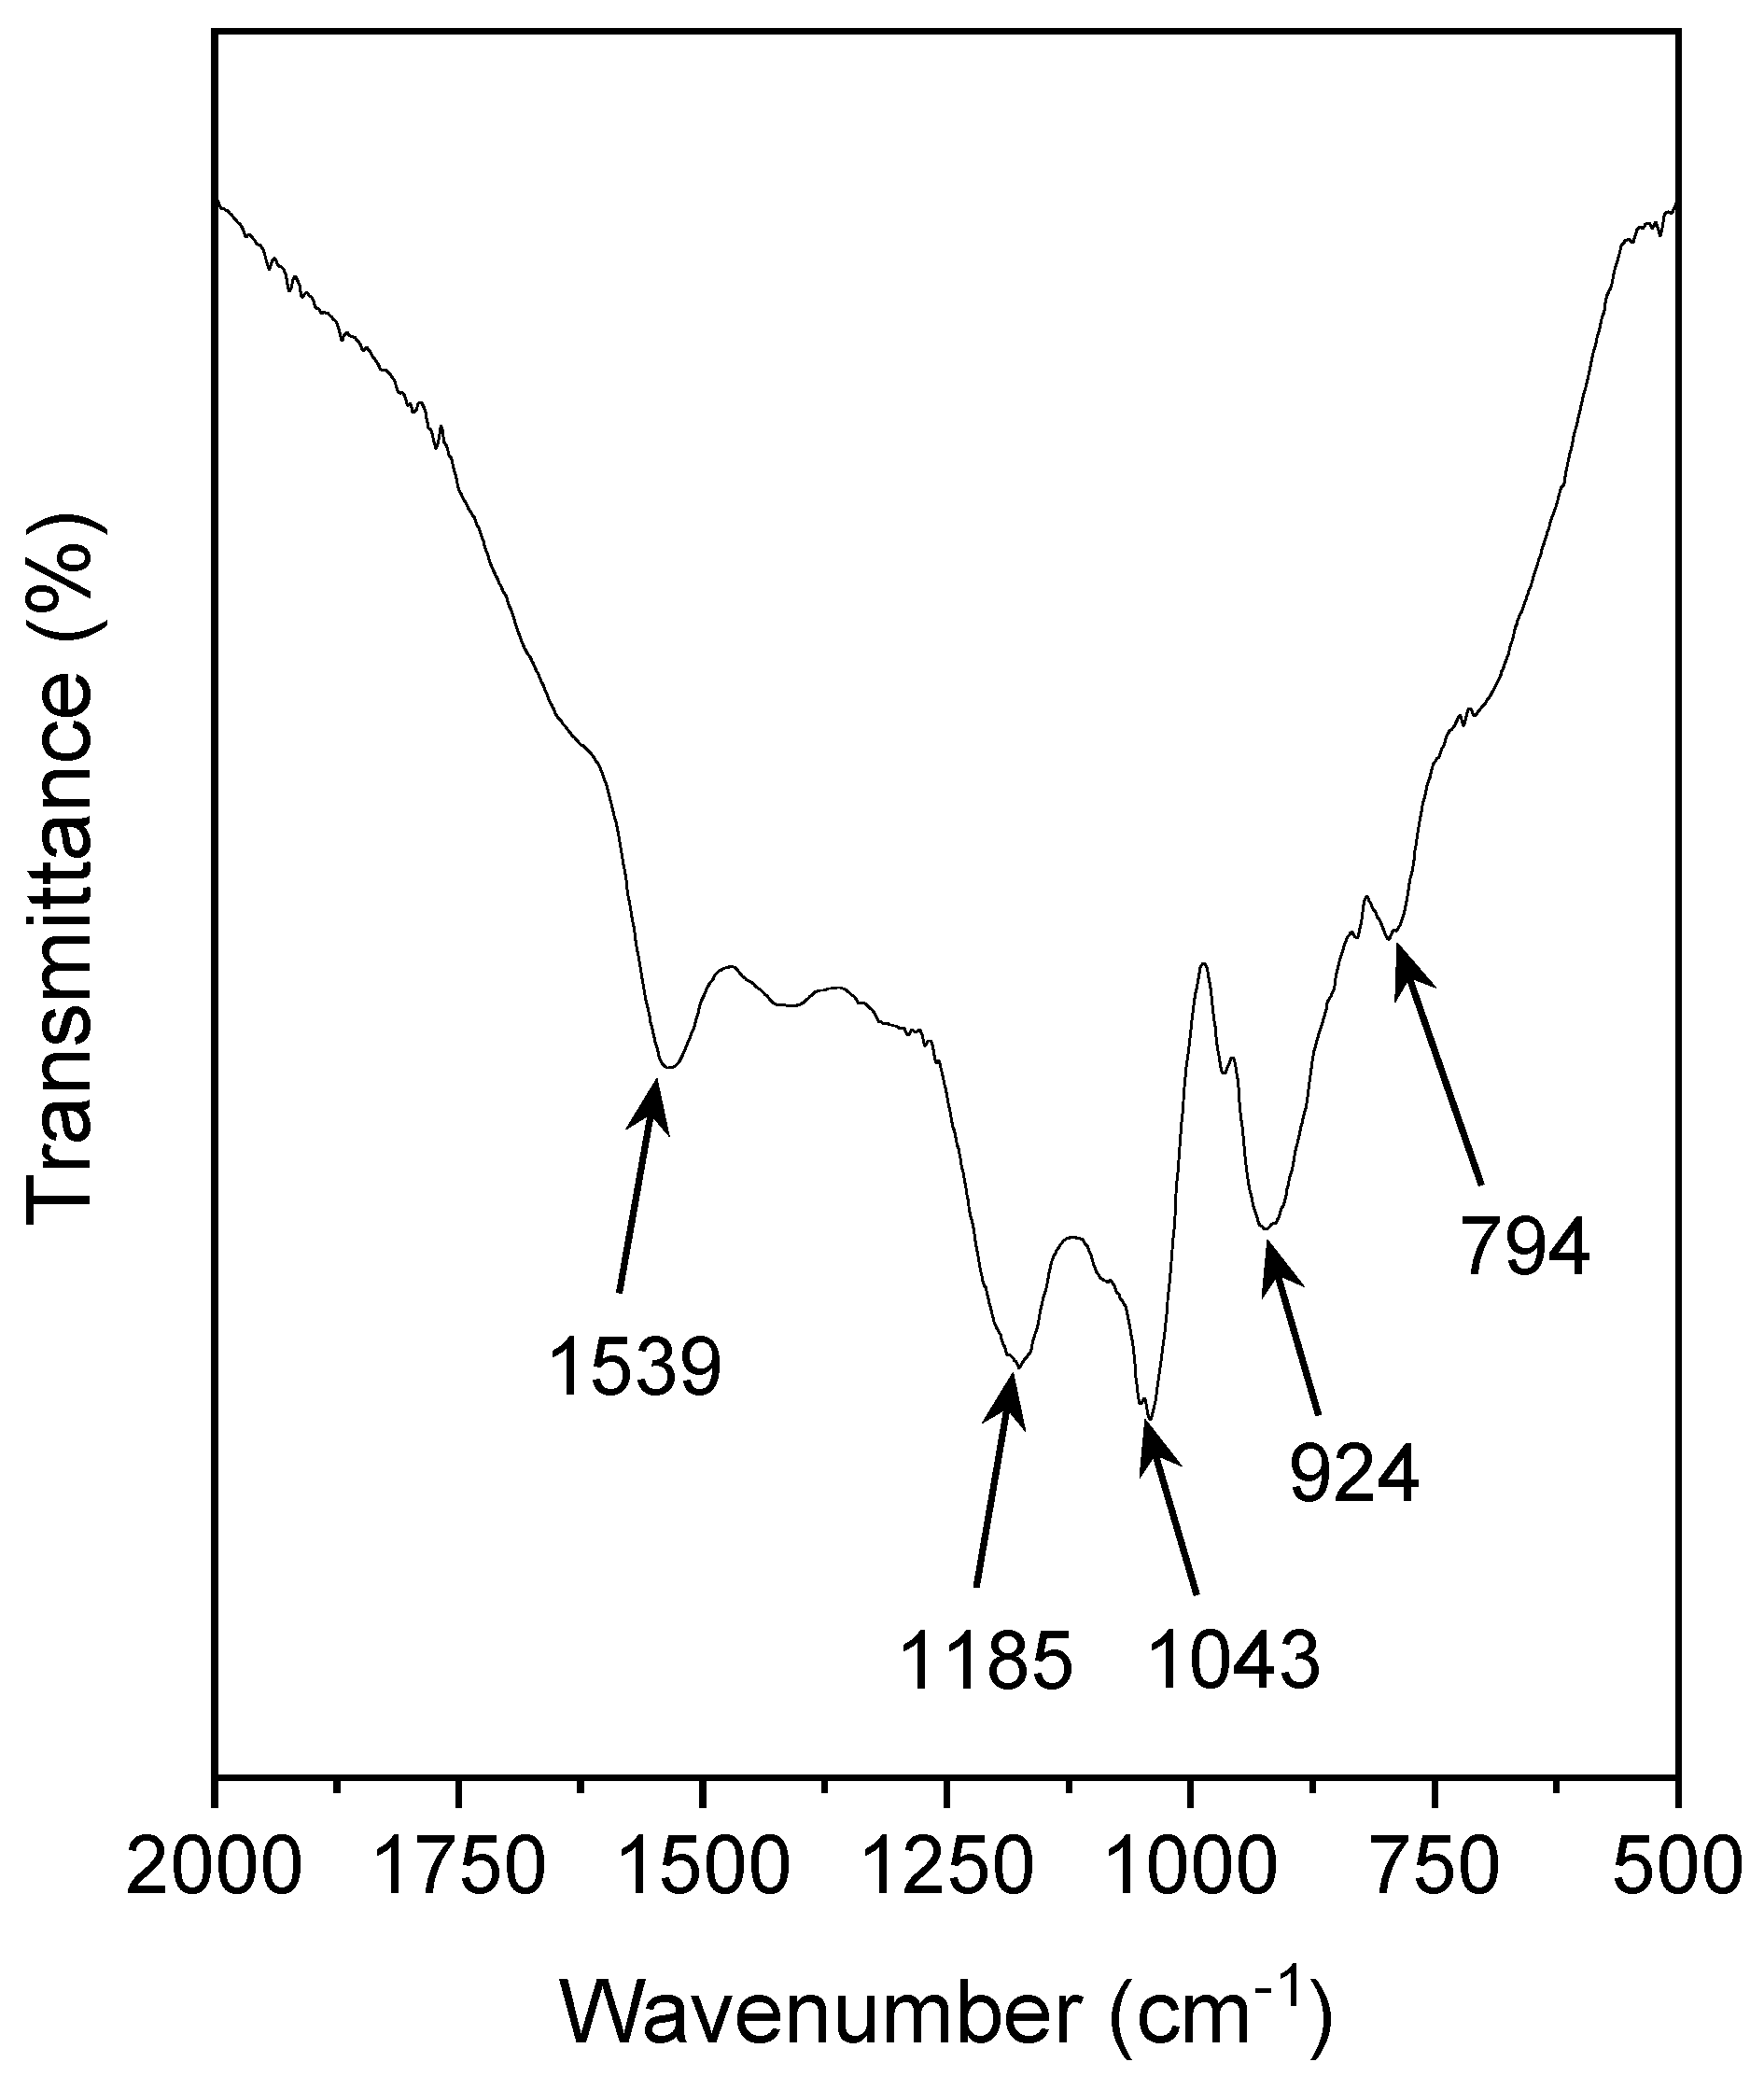
3.2.2. FTIR Studies
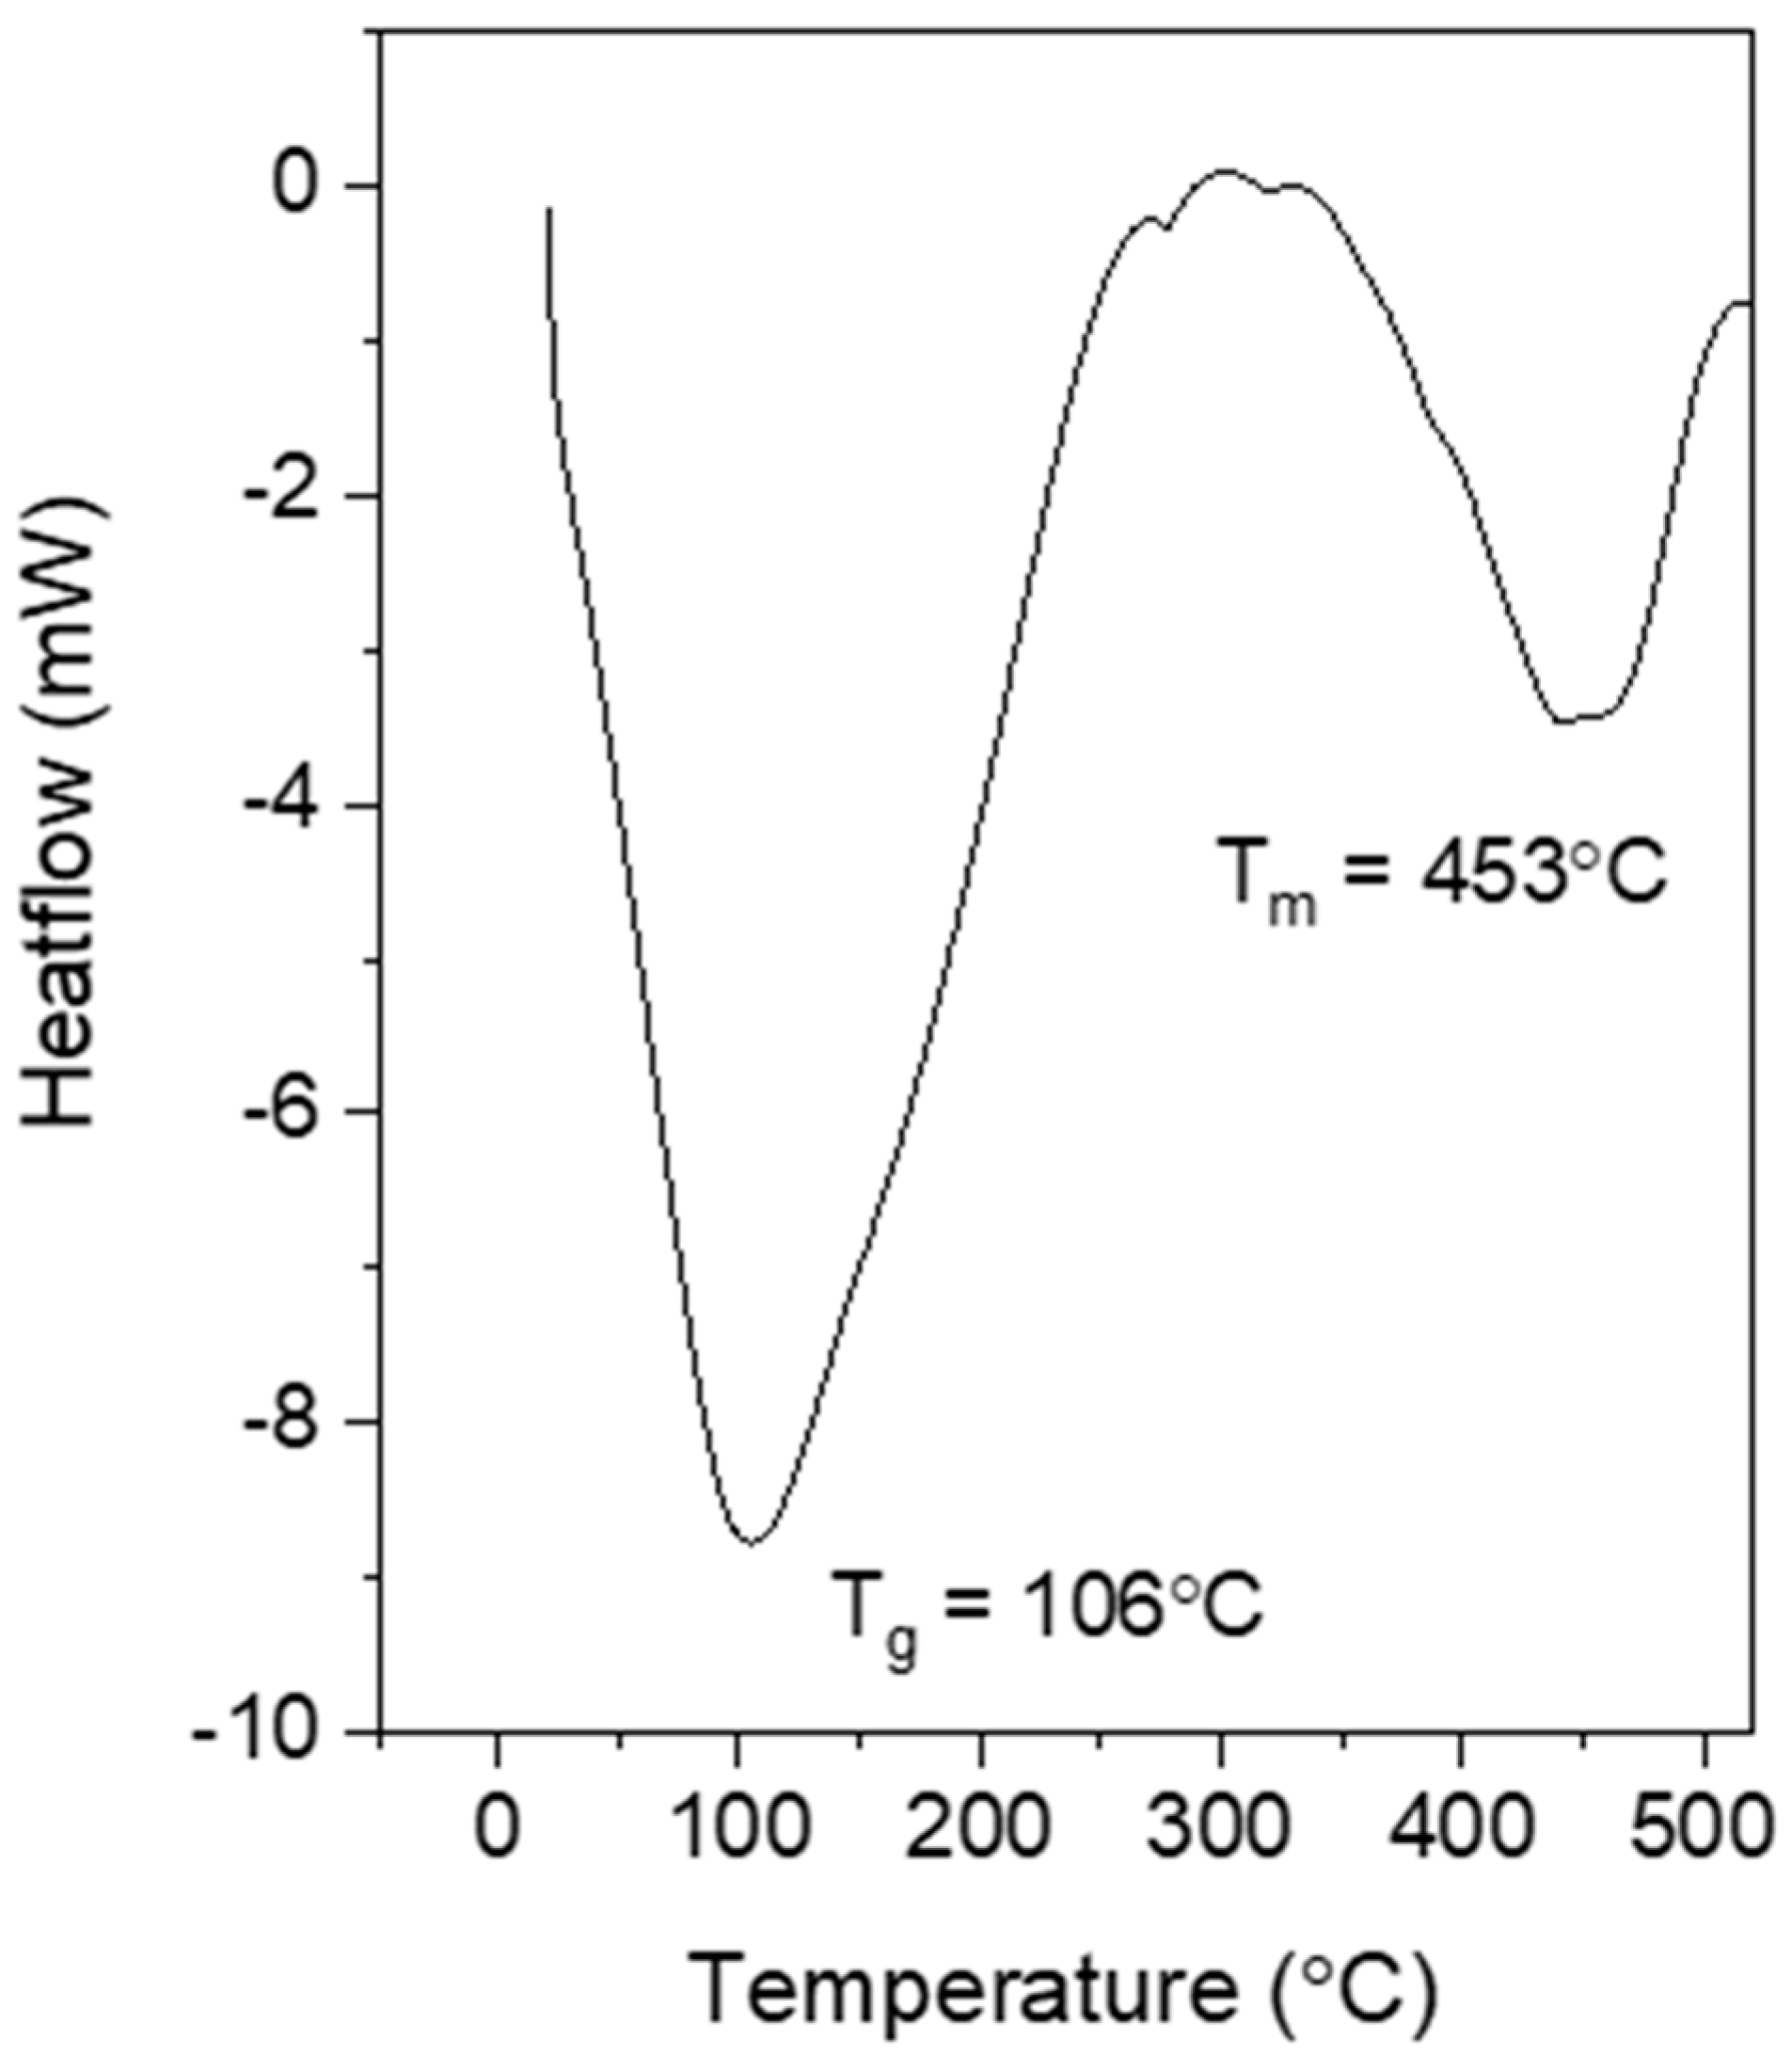
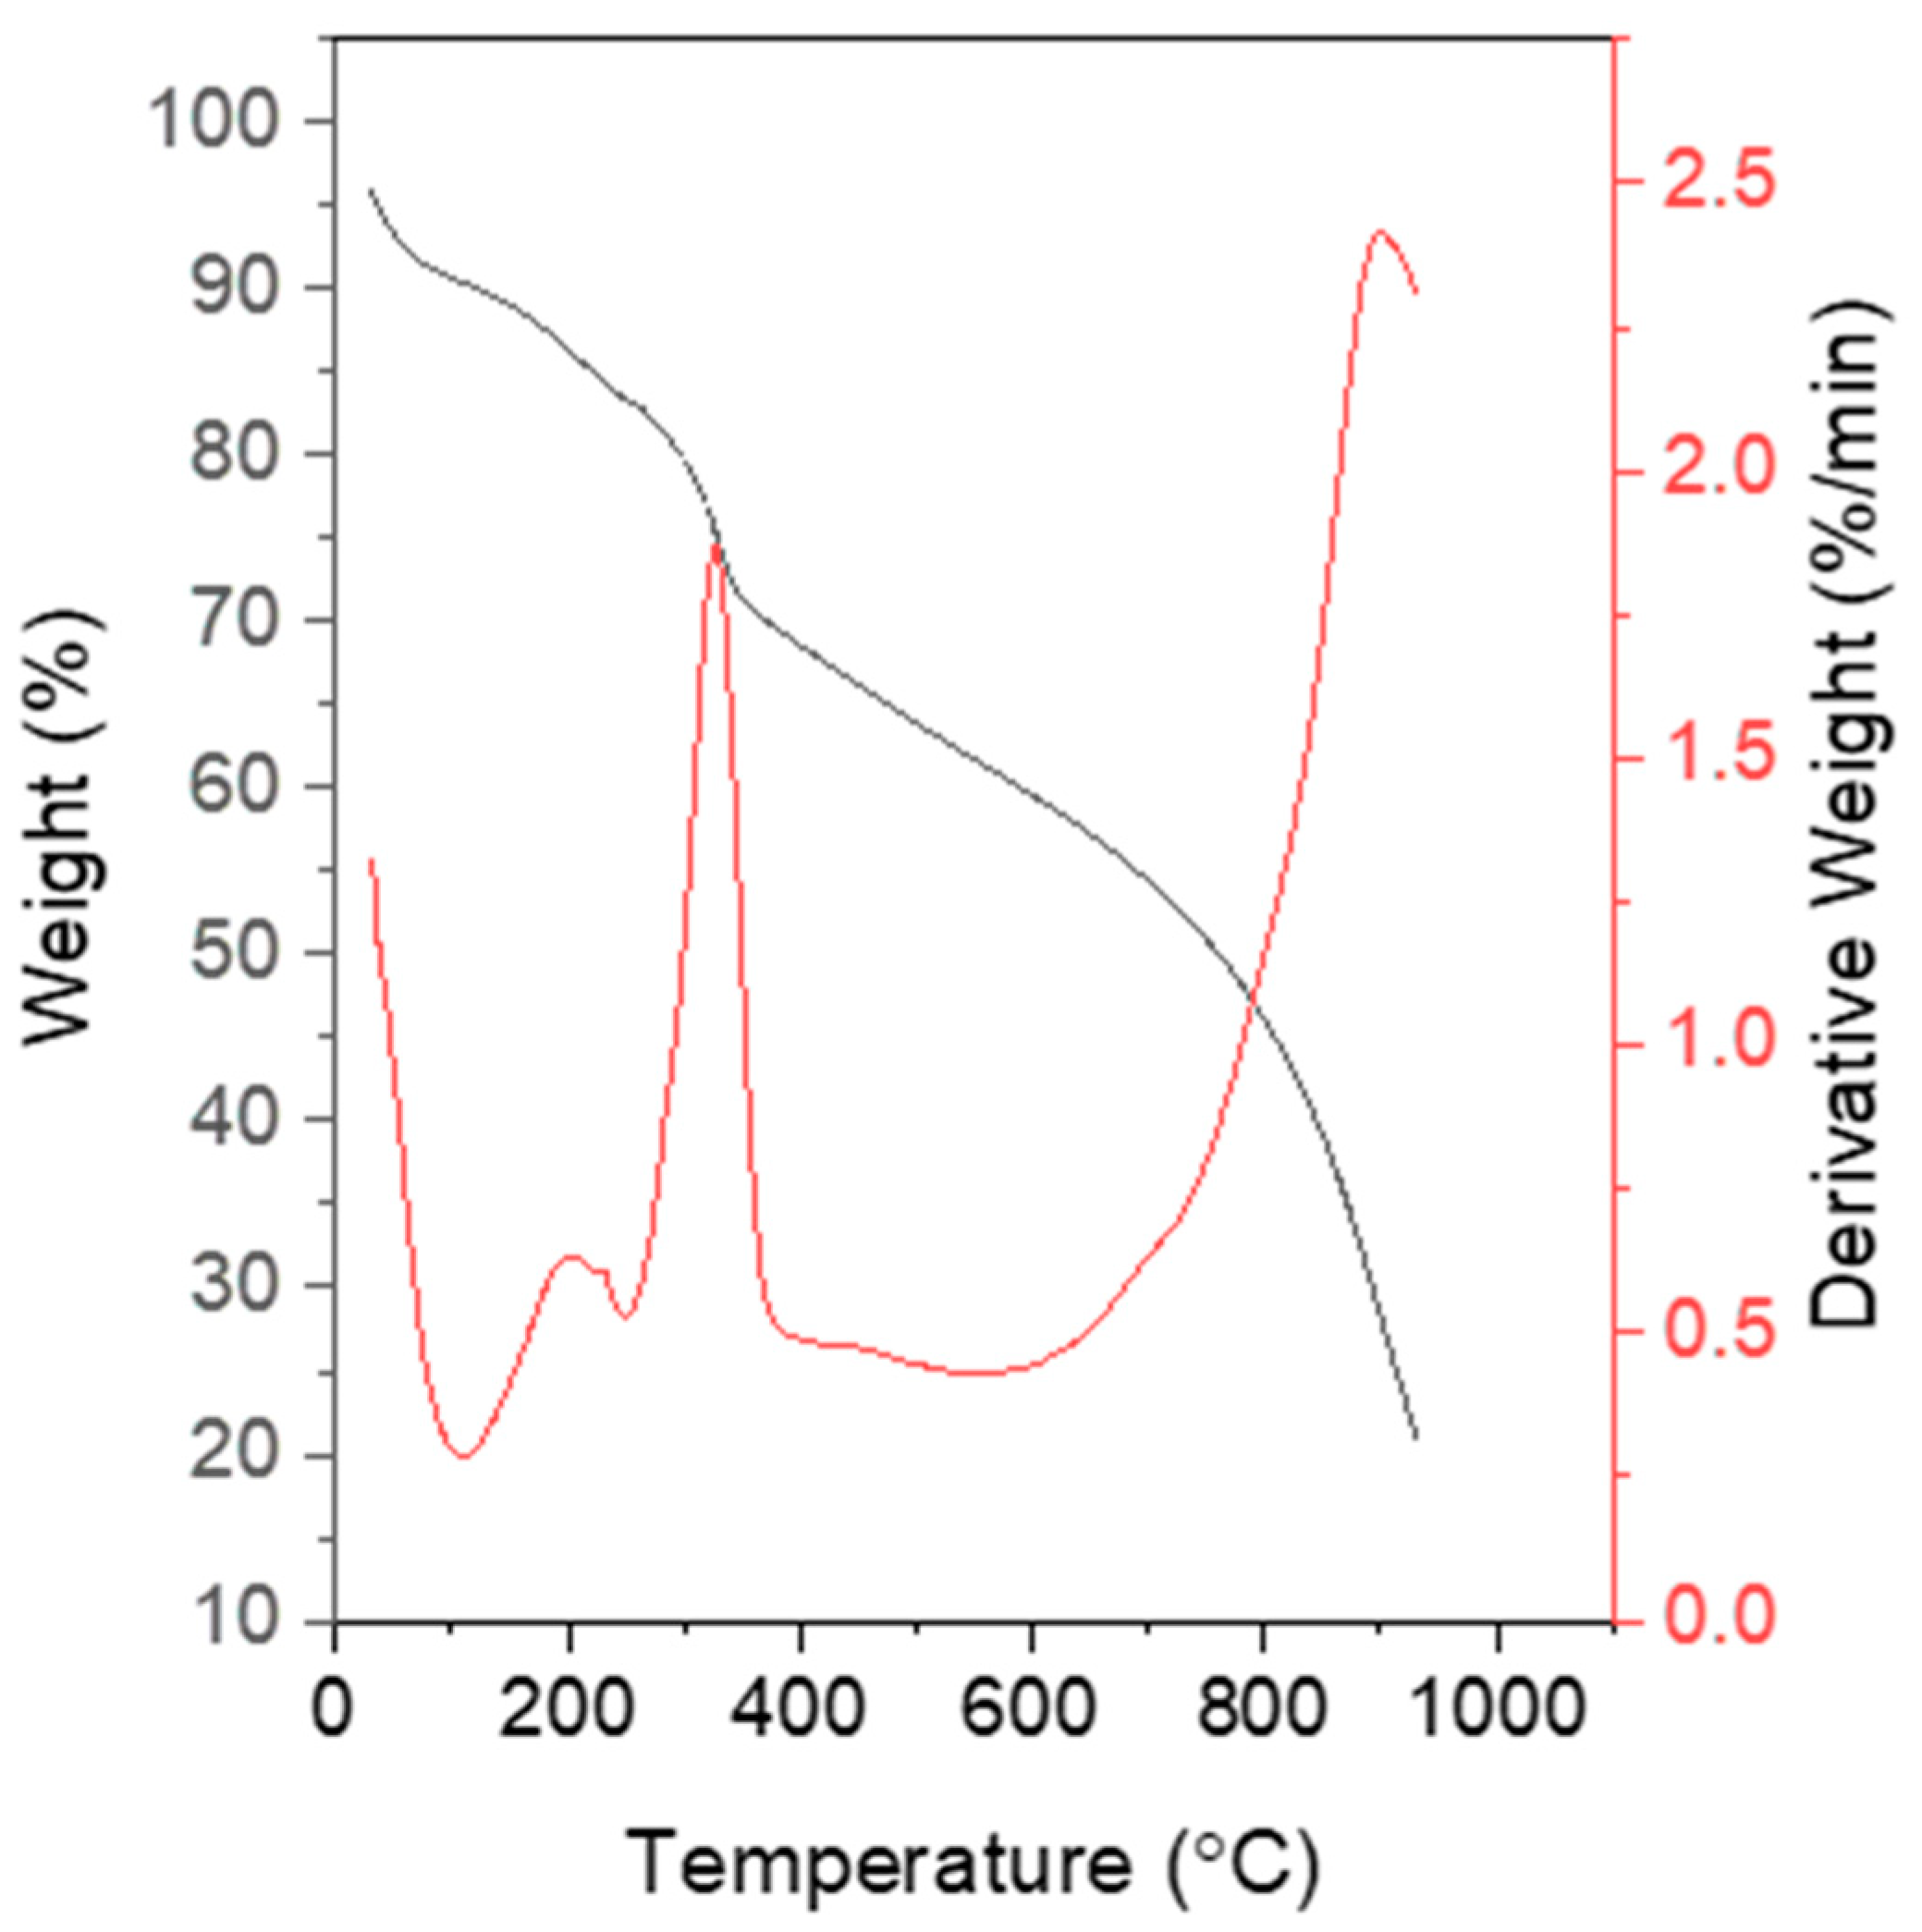
3.2.3. Thermal Analysis
4. Conclusions
Author Contributions
Funding
Institutional Review Board Statement
Data Availability Statement
Acknowledgments
Conflicts of Interest
References
- Wilczewska, P.; Breczko, J.; Bobrowska, D.M.; Wysocka-Żołopa, M.; Goclon, J.; Basa, A.; Winkler, K. Enhancement of Polypyrrole Electrochemical Performance with Graphene Quantum Dots in Polypyrrole Nanoparticle/Graphene Quantum Dot Composites. J. Electroanal. Chem. 2022, 923, 116767. [Google Scholar] [CrossRef]
- Zhao, G.; Shi, L.; Yang, G.; Zhuang, X.; Cheng, B. 3D Fibrous Aerogels from 1D Polymer Nanofibers for Energy and Environmental Applications. J. Mater. Chem. A 2023, 11, 512–547. [Google Scholar] [CrossRef]
- Chitra, P.; Muthusamy, A.; Jayaprakash, R.; Ranjith Kumar, E. Effect of Ultrasonication on Particle Size and Magnetic Properties of Polyaniline NiCoFe2O4 Nanocomposites. J. Magn. Magn. Mater. 2014, 366, 55–63. [Google Scholar] [CrossRef]
- Hujjatul Islam, M.; Paul, M.T.Y.; Burheim, O.S.; Pollet, B.G. Recent Developments in the Sonoelectrochemical Synthesis of Nanomaterials. Ultrason. Sonochem. 2019, 59, 104711. [Google Scholar] [CrossRef] [PubMed]
- Parit, M.; Du, H.; Zhang, X.; Prather, C.; Adams, M.; Jiang, Z. Polypyrrole and Cellulose Nanofiber Based Composite Films with Improved Physical and Electrical Properties for Electromagnetic Shielding Applications. Carbohydr. Polym. 2020, 240, 116304. [Google Scholar] [CrossRef]
- Azadmanjiri, J.; Hojati-Talemi, P.; Simon, G.P.; Suzuki, K.; Selomulya, C. Synthesis and Electromagnetic Interference Shielding Properties of Iron Oxide/Polypyrrole Nanocomposites. Polym. Eng. Sci. 2011, 51, 247–253. [Google Scholar] [CrossRef]
- Chen, Y.; Wang, F.; Dong, L.; Li, Z.; Chen, L.; He, X.; Gong, J.; Zhang, J.; Li, Q. Design and Optimization of Flexible Polypyrrole/Bacterial Cellulose Conductive Nanocomposites Using Response Surface Methodology. Polymers 2019, 11, 960. [Google Scholar] [CrossRef]
- Li, Y.; Bober, P.; Trchová, M.; Stejskal, J. Polypyrrole Prepared in the Presence of Methyl Orange and Ethyl Orange: Nanotubes versus Globules in Conductivity Enhancement. J. Mater. Chem. C 2017, 5, 4236–4245. [Google Scholar] [CrossRef]
- Šeděnková, I.; Taboubi, O.; Paúrová, M.; Hromádková, J.; Babič, M. Influence of the Type and Concentration of Oxidant on the Photoacoustic Response of Polypyrrole Nanoparticles for Potential Bioimaging Applications. Synth. Met. 2023, 292, 117218. [Google Scholar] [CrossRef]
- Hao, L.; Dong, C.; Zhang, L.; Zhu, K.; Yu, D. Polypyrrole Nanomaterials: Structure, Preparation and Application. Polymers 2022, 14, 5139. [Google Scholar] [CrossRef]
- Qiu, G.; Wang, Q.; Nie, M. Polypyrrole-Fe3O4 Magnetic Nanocomposite Prepared by Ultrasonic Irradiation. Macromol. Mater. Eng. 2006, 291, 68–74. [Google Scholar] [CrossRef]
- Wu, T.-M.; Chang, H.-L.; Lin, Y.-W. Synthesis and Characterization of Conductive Polypyrrole with Improved Conductivity and Processability. Polym. Int. 2009, 58, 1065–1070. [Google Scholar] [CrossRef]
- Li, M.; Li, W.; Liu, J.; Yao, J. Preparation and Characterization of PPy Doped with Different Anionic Surfactants. Polym. Eng. Sci. 2013, 53, 2465–2469. [Google Scholar] [CrossRef]
- Costa, M.B.G.; Juárez, J.M.; Martínez, M.L.; Beltramone, A.R.; Cussa, J.; Anunziata, O.A. Synthesis and Characterization of Conducting Polypyrrole/SBA-3 and Polypyrrole/Na–AlSBA-3 Composites. Mater. Res. Bull. 2013, 48, 661–667. [Google Scholar] [CrossRef]
- Gao, Q.; Wang, Y.; He, D.; Gao, L.; Zhou, Y.; Fu, M. Infrared and Micro-Wave Properties of Polypyrrole Nanocomposites. Integr. Ferroelectr. 2013, 144, 41–47. [Google Scholar] [CrossRef]
- Wu, T.-M.; Lin, S.-H. Synthesis, Characterization, and Electrical Properties of Polypyrrole/Multiwalled Carbon Nanotube Composites. J. Polym. Sci. Part A Polym. Chem. 2006, 44, 6449–6457. [Google Scholar] [CrossRef]
- Pang, A.L.; Arsad, A.; Ahmadipour, M. Synthesis and Factor Affecting on the Conductivity of Polypyrrole: A Short Review. Polym. Adv. Technol. 2021, 32, 1428–1454. [Google Scholar] [CrossRef]
- Qu, L.; Shi, G.; Yuan, J.; Han, G.; Chen, F. Preparation of Polypyrrole Microstructures by Direct Electrochemical Oxidation of Pyrrole in an Aqueous Solution of Camphorsulfonic Acid. J. Electroanal. Chem. 2004, 561, 149–156. [Google Scholar] [CrossRef]
- Othman, A.A.; Ali, M.A.; Ibrahim, E.M.M.; Osman, M.A. Influence of Cu Doping on Structural, Morphological, Photoluminescence, and Electrical Properties of ZnO Nanostructures Synthesized by Ice-Bath Assisted Sonochemical Method. J. Alloys Compd. 2016, 683, 399–411. [Google Scholar] [CrossRef]
- Balakumar, V.; Baishnisha, A. Rapid Visible Light Photocatalytic Reduction of Cr6+ in Aqueous Environment Using ZnO-PPy Nanocomposite Synthesized through Ultrasonic Assisted Method. Surf. Interfaces 2021, 23, 100958. [Google Scholar] [CrossRef]
- Zhang, Y.; Zhang, S.; Yang, X.; Wang, W.; Liu, X.; Wang, H.; Zhang, H. Enhancing the Fermentation Performance of Frozen Dough by Ultrasonication: Effect of Starch Hierarchical Structures. J. Cereal Sci. 2022, 106, 103500. [Google Scholar] [CrossRef]
- Manickavasagan, A.; Ramachandran, R.; Chen, S.-M.; Velluchamy, M. Ultrasonic Assisted Fabrication of Silver Tungstate Encrusted Polypyrrole Nanocomposite for Effective Photocatalytic and Electrocatalytic Applications. Ultrason. Sonochem. 2020, 64, 104913. [Google Scholar] [CrossRef]
- Kowalski, D.; Ueda, M.; Ohtsuka, T. The Effect of Ultrasonic Irradiation during Electropolymerization of Polypyrrole on Corrosion Prevention of the Coated Steel. Corros. Sci. 2008, 50, 286–291. [Google Scholar] [CrossRef]
- Cohen, S.; Zelikman, E.; Suckeveriene, R.Y. Ultrasonically Induced Polymerization and Polymer Grafting in the Presence of Carbonaceous Nanoparticles. Processes 2020, 8, 1680. [Google Scholar] [CrossRef]
- Yang, J.; Li, Y. Effect of Ultrasonic Wave on the Electropolymerization of Pyrrole. Chin. J. Polym. Sci. 1996, 14, 270–276. [Google Scholar]
- Ali Mohsin, M.E.; Shrivastava, N.K.; Basar, N.; Arsad, A.; Hassan, A. The Effect of Sonication Time on the Properties of Electrically Conductive PANI/Sago Starch Blend Prepared by the One-Pot Synthesis Method. Front. Mater. 2019, 6, 297. [Google Scholar] [CrossRef]
- Ardani, M.R.; Pang, A.L.; Pal, U.; Zheng, R.; Arsad, A.; Hamzah, A.A.; Ahmadipour, M. Ultrasonic-Assisted Polyaniline-Multiwall Carbon Nanotube Photocatalyst for Efficient Photodegradation of Organic Pollutants. J. Water Process Eng. 2022, 46, 102557. [Google Scholar] [CrossRef]
- Karami, H.; Nezhad, A.R. Investigation of Pulse-Electropolymerization of Conductive Polypyrrole Nanostructures. Int. J. Electrochem. Sci. 2013, 8, 8905–8921. [Google Scholar]
- Wang, M. Emerging Multifunctional NIR Photothermal Therapy Systems Based on Polypyrrole Nanoparticles. Polymers 2016, 8, 373. [Google Scholar] [CrossRef]
- Chatterjee, S.; Kumar, A.; Basu, S.; Dutta, S. Application of Response Surface Methodology for Methylene Blue Dye Removal from Aqueous Solution Using Low Cost Adsorbent. Chem. Eng. J. 2012, 181–182, 289–299. [Google Scholar] [CrossRef]
- Huang, P.; Chen, T.; Zheng, Y.; Yang, C.; Wang, Y.; Ran, S.; Zhi, Y.; Shan, S.; Jiang, L. Aerobic Epoxidation of α-Pinene Using Mn/SAPO-34 Catalyst: Optimization via Response Surface Methodology (RSM). Mol. Catal. 2023, 535, 112872. [Google Scholar] [CrossRef]
- Ghani, N.N.M.; Jalil, A.A.; Triwahyono, S.; Aziz, M.A.A.; Rahman, A.F.A.; Hamid, M.Y.S.; Izan, S.M.; Nawawi, M.G.M. Tailored Mesoporosity and Acidity of Shape-Selective Fibrous Silica Beta Zeolite for Enhanced Toluene Co-Reaction with Methanol. Chem. Eng. Sci. 2019, 193, 217–229. [Google Scholar] [CrossRef]
- Shahul Hamid, M.Y.; Abdul Jalil, A.; Abdul Rahman, A.F.; Tuan Abdullah, T.A. Enhanced Reactive CO2 Species Formation via V2O5-Promoted Ni/KCC-1 for Low Temperature Activation of CO2 Methanation. React. Chem. Eng. 2019, 4, 1126–1135. [Google Scholar] [CrossRef]
- Nguyen, V.T.; Dinh, D.K.; Mok, Y.S.; Yoon, K.H.; Dao, V.D.; Hossain, M.M.; Saud, S.; Sosiawati, T. High-Throughput Volatile Organic Compounds Removal in a Sandwich-Type Honeycomb Catalyst System Combined with Plasma. Appl. Catal. B Environ. 2022, 310, 121328. [Google Scholar] [CrossRef]
- Ángeles Corres, M.; Mugica, A.; Carrasco, P.M.; Milagros Cortázar, M. Effect of Crystallization on Morphology–Conductivity Relationship in Polypyrrole/Poly(ε-Caprolactone) Blends. Polymer 2006, 47, 6759–6764. [Google Scholar] [CrossRef]
- Yussuf, A.; Al-Saleh, M.; Al-Enezi, S.; Abraham, G. Synthesis and Characterization of Conductive Polypyrrole: The Influence of the Oxidants and Monomer on the Electrical, Thermal, and Morphological Properties. Int. J. Polym. Sci. 2018, 2018, 4191747. [Google Scholar] [CrossRef]
- Megha, R.; Ravikiran, Y.T.; Vijaya Kumari, S.C.; Raj Prakash, H.G.; Tiwari, S.K.; Thomas, S. Enhancement in Alternating Current Conductivity of Polypyrrole by Multi-Walled Carbon Nanotubes via Single Electron Tunneling. Diam. Relat. Mater. 2018, 87, 163–171. [Google Scholar] [CrossRef]
- Et Taouil, A.; Lallemand, F.; Hihn, J.Y.; Blondeau-Patissier, V. Electrosynthesis and Characterization of Conducting Polypyrrole Elaborated under High Frequency Ultrasound Irradiation. Ultrason. Sonochem. 2011, 18, 907–910. [Google Scholar] [CrossRef] [PubMed]
- Saheeda, P.; Jayaleksmi, S. Liquid/Liquid Interfacial Polymerization as an Effective Synthesis Approach for Polypyrrole/MWCNTs Nanocomposite with Impressive Nonlinear Optical Properties. Opt. Mater. 2020, 104, 109940. [Google Scholar] [CrossRef]
- Pang, A.L.; Arsad, A.; Ahmadipour, M.; Azlan Hamzah, A.; Ahmad Zaini, M.A.; Mohsin, R. High Efficient Degradation of Organic Dyes by Polypyrrole-Multiwall Carbon Nanotubes Nanocomposites. Polym. Adv. Technol. 2022, 33, 1402–1411. [Google Scholar] [CrossRef]
- Nerkar, D.M.; Jaware, S.E.; Padhye, G.G. Fabrication of a Novel Flexible Room Temperature Hydrogen Sulfide (H2S) Gas Sensor Based on Polypyrrole Films. Int. J. Sci. Res. 2016, 5, 106–111. [Google Scholar] [CrossRef]
- Ahmad, S.; Khan, I.; Husain, A.; Khan, A.; Asiri, A.M. Electrical Conductivity Based Ammonia Sensing Properties of Polypyrrole/MoS2 Nanocomposite. Polymers 2020, 12, 3047. [Google Scholar] [CrossRef] [PubMed]
- Deljoo Kojabad, Z.; Shojaosadati, S.A. Chemical Synthesis of Polypyrrole Nanostructures: Optimization and Applications for Neural Microelectrodes. Mater. Des. 2016, 96, 378–384. [Google Scholar] [CrossRef]
- Gumaan, M.S. Chromium Improvements on the Mechanical Performance of a Rapidly Solidified Eutectic Sn–Ag Alloy. J. Mater. Sci. Mater. Electron. 2020, 31, 10731–10737. [Google Scholar] [CrossRef]
- Pang, A.L.; Husin, M.R.; Arsad, A.; Ahmadipour, M. Effect of Graphene Nanoplatelets on Structural, Morphological, Thermal, and Electrical Properties of Recycled Polypropylene/Polyaniline Nanocomposites. J. Mater. Sci. Mater. Electron. 2021, 32, 9574–9583. [Google Scholar] [CrossRef]
- Mavinakuli, P.; Wei, S.; Wang, Q.; Karki, A.B.; Dhage, S.; Wang, Z.; Young, D.P.; Guo, Z. Polypyrrole/Silicon Carbide Nanocomposites with Tunable Electrical Conductivity. J. Phys. Chem. C 2010, 114, 3874–3882. [Google Scholar] [CrossRef]
- Ramesan, M.T.; Varghese, M.; Jayakrishnan, P.; Periyat, P. Silver-Doped Zinc Oxide as a Nanofiller for Development of Poly(Vinyl Alcohol)/Poly(Vinyl Pyrrolidone) Blend Nanocomposites. Adv. Polym. Technol. 2018, 37, 137–143. [Google Scholar] [CrossRef]
- Peighambardoust, S.J.; Pourabbas, B. Synthesis and Characterization of Conductive Polypyrrole/Montmorillonite Nanocomposites via One-Pot Emulsion Polymerization. Macromol. Symp. 2007, 247, 99–109. [Google Scholar] [CrossRef]
- Ahmad, M.; Gani, A.; Hassan, I.; Huang, Q.; Shabbir, H. Production and Characterization of Starch Nanoparticles by Mild Alkali Hydrolysis and Ultra-Sonication Process. Sci. Rep. 2020, 10, 3533. [Google Scholar] [CrossRef]
- Hasanvand, E.; Fathi, M.; Bassiri, A. Production and Characterization of Vitamin D(3) Loaded Starch Nanoparticles: Effect of Amylose to Amylopectin Ratio and Sonication Parameters. J. Food Sci. Technol. 2018, 55, 1314–1324. [Google Scholar] [CrossRef]
- Bose, S.; Kuila, T.; Uddin, M.E.; Kim, N.H.; Lau, A.K.T.; Lee, J.H. In-Situ Synthesis and Characterization of Electrically Conductive Polypyrrole/Graphene Nanocomposites. Polymer 2010, 51, 5921–5928. [Google Scholar] [CrossRef]


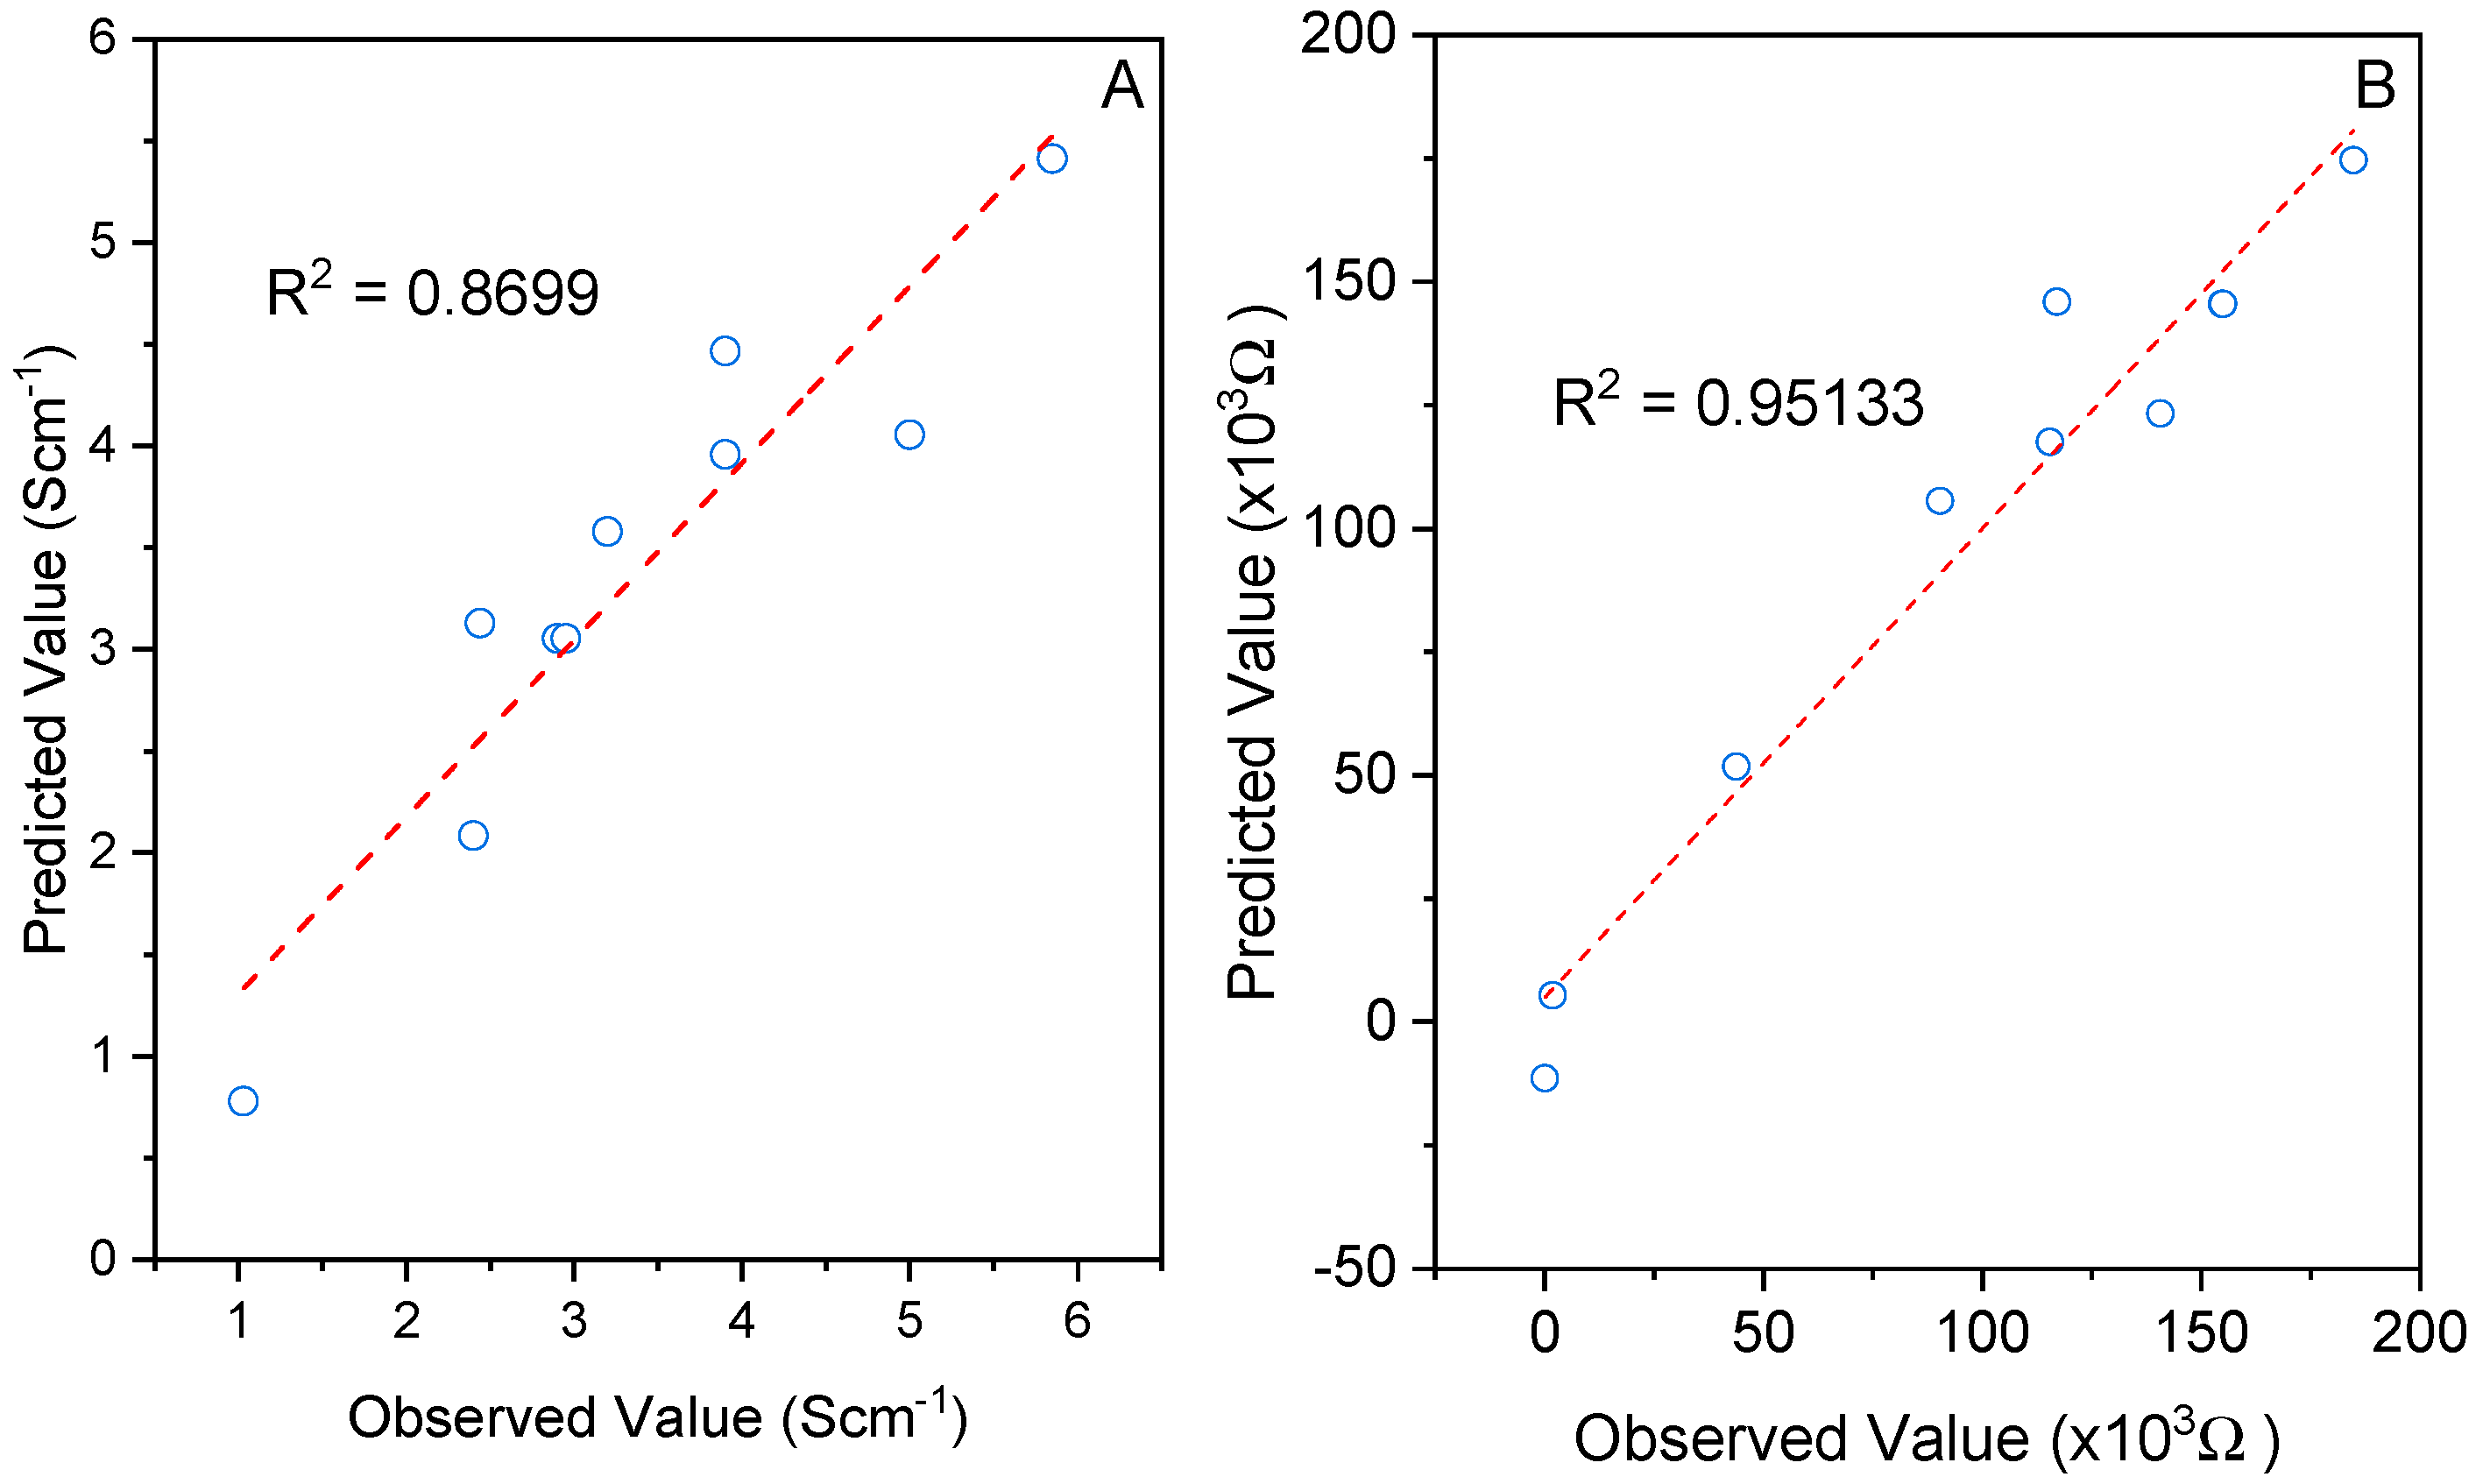
| Run | Factors | Response, Y1 (Conductivity, Scm−1) | Response, Y2 (Resistivity, × 103 Ω) | |||
|---|---|---|---|---|---|---|
| Time, X1 (min) | Power, X2 (W) | Observed Values | Predicted Values | Observed Values | Predicted Values | |
| 1 | 15.0 | 10.0 | 5.85 | 5.41 | 0.08 | −11.4382 |
| 2 | 15.0 | 50.0 | 1.03 | 0.779 | 43.8 | 51.78915 |
| 3 | 120.0 | 10.0 | 3.20 | 3.58 | 140.7 | 123.2975 |
| 4 | 120.0 | 50.0 | 3.90 | 4.47 | 115.4 | 117.542 |
| 5 | 15.0 | 30.0 | 2.44 | 3.13 | 1.85 | 5.37624 |
| 6 | 120.0 | 30.0 | 5.00 | 4.05 | 90.4 | 105.6205 |
| 7 | 67.5 | 10.0 | 3.90 | 3.96 | 117.0 | 145.9279 |
| 8 | 67.5 | 50.0 | 2.40 | 2.08 | 184.8 | 174.6638 |
| 9 | 67.5 | 30.0 | 2.90 | 3.05 | 154.8 | 145.4966 |
| 10 | 67.5 | 30.0 | 2.95 | 3.05 | 155.0 | 145.4966 |
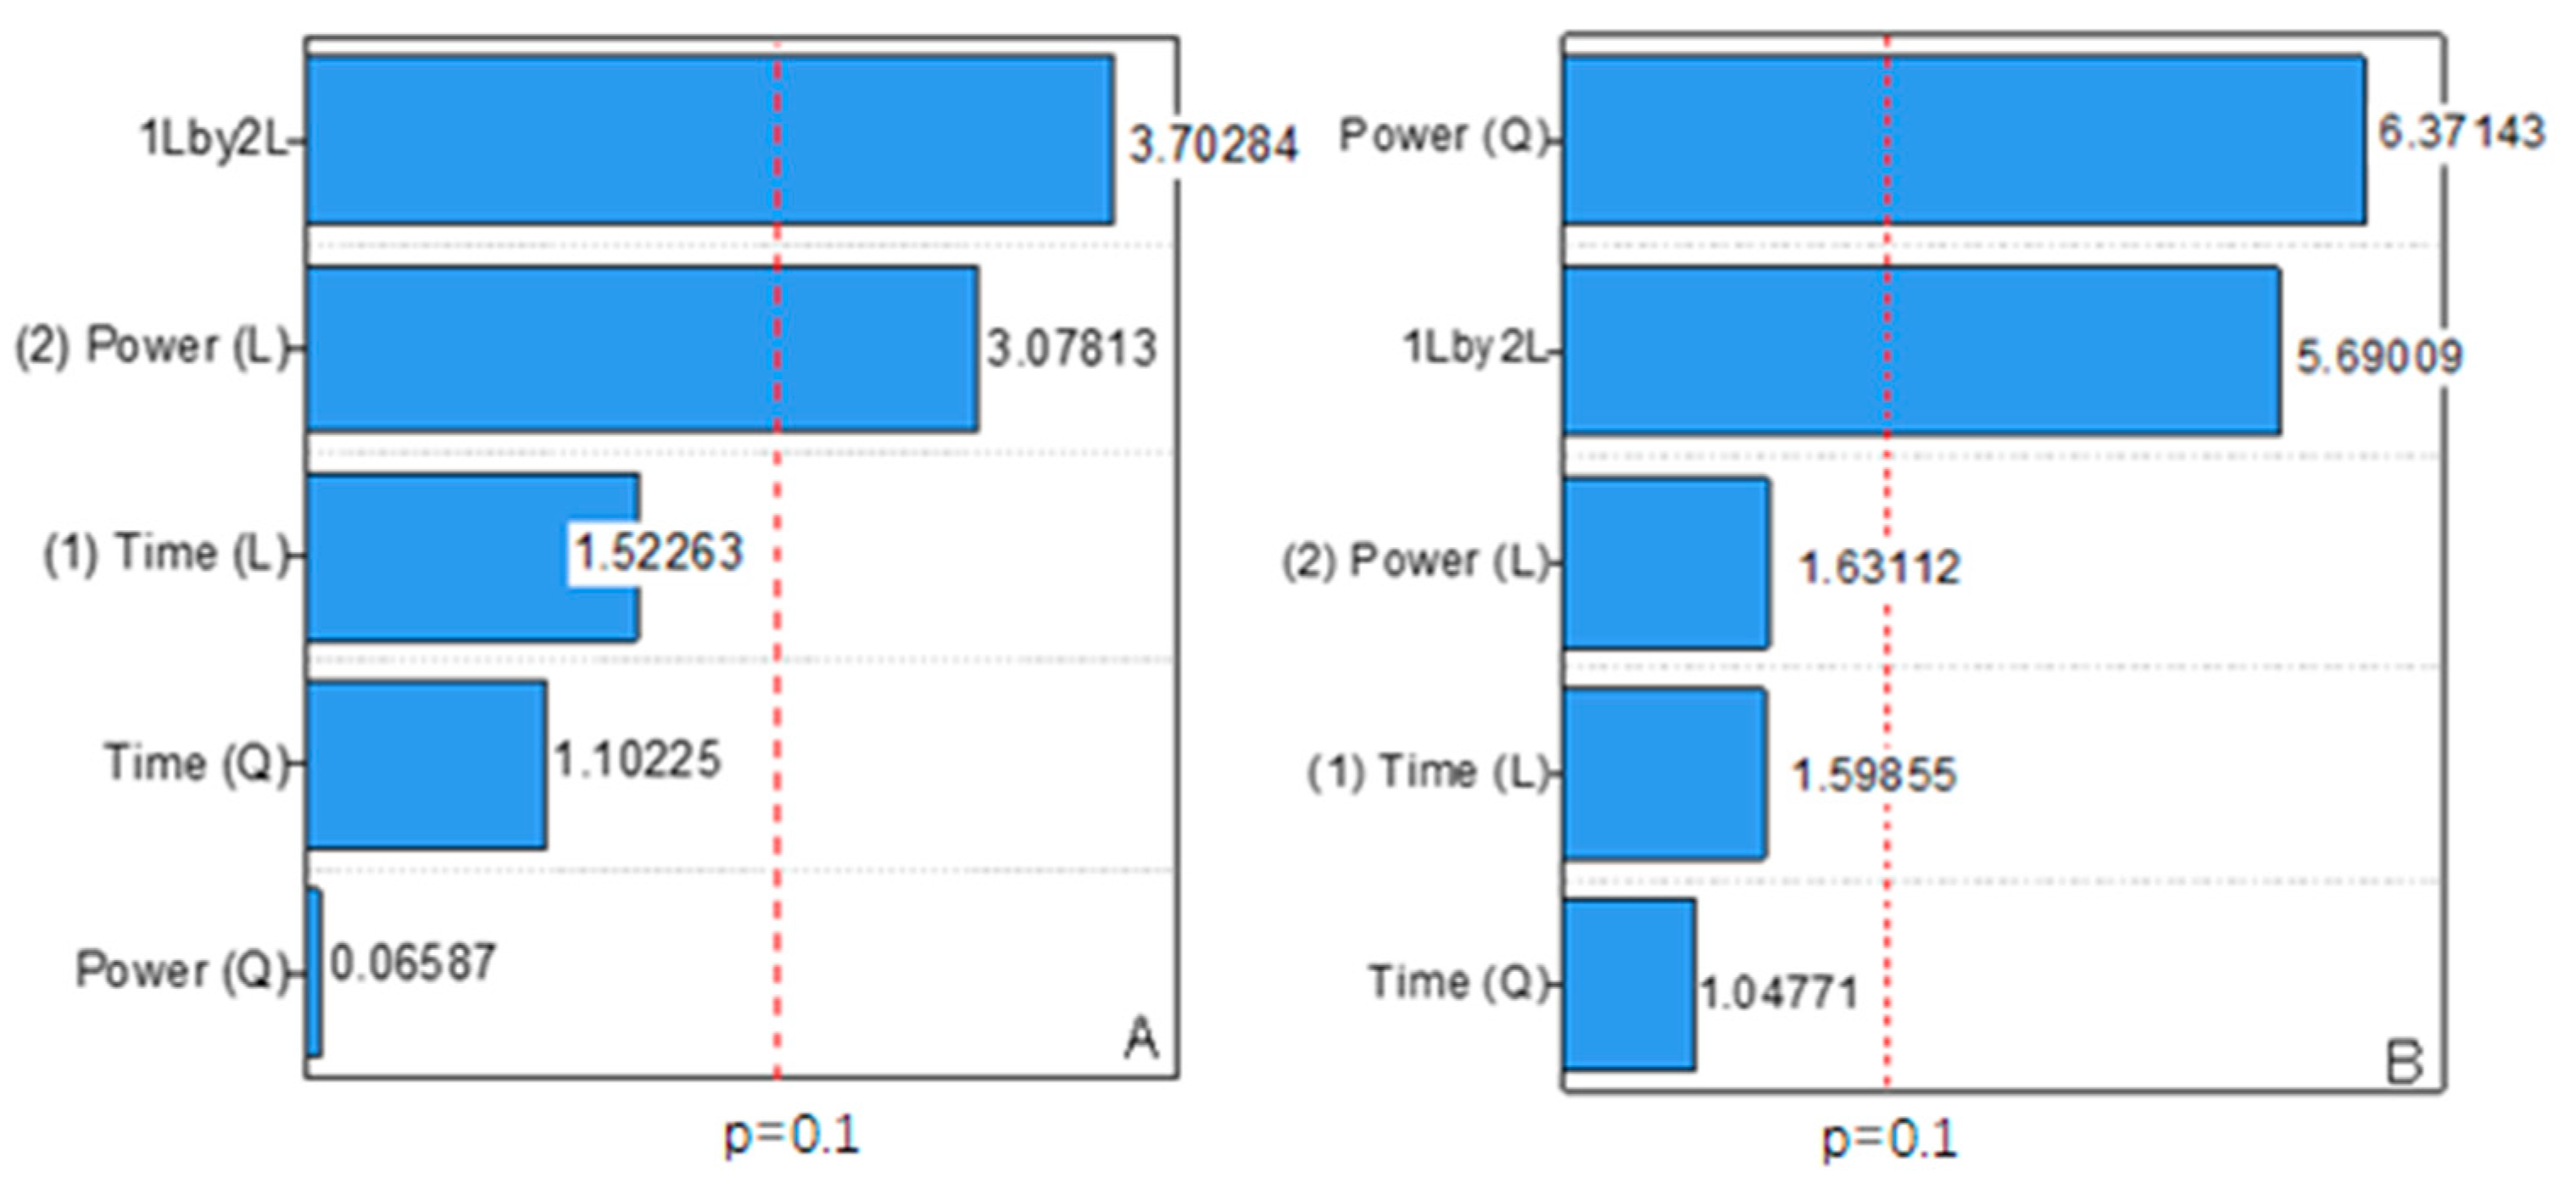
| Sources | Sum of Square (SS) | Degree of Freedom (DOF) | Mean Square (MS) | F-Value | F0.10 |
|---|---|---|---|---|---|
| Conductivity | |||||
| Regression (SSR) | 14.853 | 5 | 2.971 | 5.344 | 4.05 |
| Error | 2.222 | 4 | 0.556 | ||
| Total SS | 17.075 | 9 | |||
| Resistivity | |||||
| Regression (SSR) | 36,401.02 | 5 | 7280.204 | 15.638 | 4.05 |
| Error | 1862.22 | 4 | 465.56 | ||
| Total SS | 38,263.24 | 9 |
| Process Parameters | Model-Optimized | Experimental Value |
|---|---|---|
| Sonication Time (mins) | 17.7 | |
| Sonication Power (W) | 24.3 | |
| Conductivity (S/cm) | 2.249 | 2.334 |
Disclaimer/Publisher’s Note: The statements, opinions and data contained in all publications are solely those of the individual author(s) and contributor(s) and not of MDPI and/or the editor(s). MDPI and/or the editor(s) disclaim responsibility for any injury to people or property resulting from any ideas, methods, instructions or products referred to in the content. |
© 2023 by the authors. Licensee MDPI, Basel, Switzerland. This article is an open access article distributed under the terms and conditions of the Creative Commons Attribution (CC BY) license (https://creativecommons.org/licenses/by/4.0/).
Share and Cite
Hossain, S.S.; Rahman, A.F.A.; Arsad, A.; Basu, A.; Pang, A.L.; Harun, Z.; Alwi, M.M.A.; Ali, S.S. Effect of Ultrasonication Parameters on the Structural, Morphological, and Electrical Properties of Polypyrrole Nanoparticles and Optimization by Response Surface Methodology. Polymers 2023, 15, 1528. https://doi.org/10.3390/polym15061528
Hossain SS, Rahman AFA, Arsad A, Basu A, Pang AL, Harun Z, Alwi MMA, Ali SS. Effect of Ultrasonication Parameters on the Structural, Morphological, and Electrical Properties of Polypyrrole Nanoparticles and Optimization by Response Surface Methodology. Polymers. 2023; 15(6):1528. https://doi.org/10.3390/polym15061528
Chicago/Turabian StyleHossain, SK Safdar, Anis Farhana Abdul Rahman, Agus Arsad, Avijit Basu, Ai Ling Pang, Zakiah Harun, Muhammad Mudassir Ahmad Alwi, and Syed Sadiq Ali. 2023. "Effect of Ultrasonication Parameters on the Structural, Morphological, and Electrical Properties of Polypyrrole Nanoparticles and Optimization by Response Surface Methodology" Polymers 15, no. 6: 1528. https://doi.org/10.3390/polym15061528
APA StyleHossain, S. S., Rahman, A. F. A., Arsad, A., Basu, A., Pang, A. L., Harun, Z., Alwi, M. M. A., & Ali, S. S. (2023). Effect of Ultrasonication Parameters on the Structural, Morphological, and Electrical Properties of Polypyrrole Nanoparticles and Optimization by Response Surface Methodology. Polymers, 15(6), 1528. https://doi.org/10.3390/polym15061528