

Influence of Synthetic Fibers on the Flexural Properties of Concrete: Prediction of Toughness as a Function of Volume, Slenderness Ratio and Elastic Modulus of Fibers

 , , and
Abstract
1. Introduction
2. Experimental Program
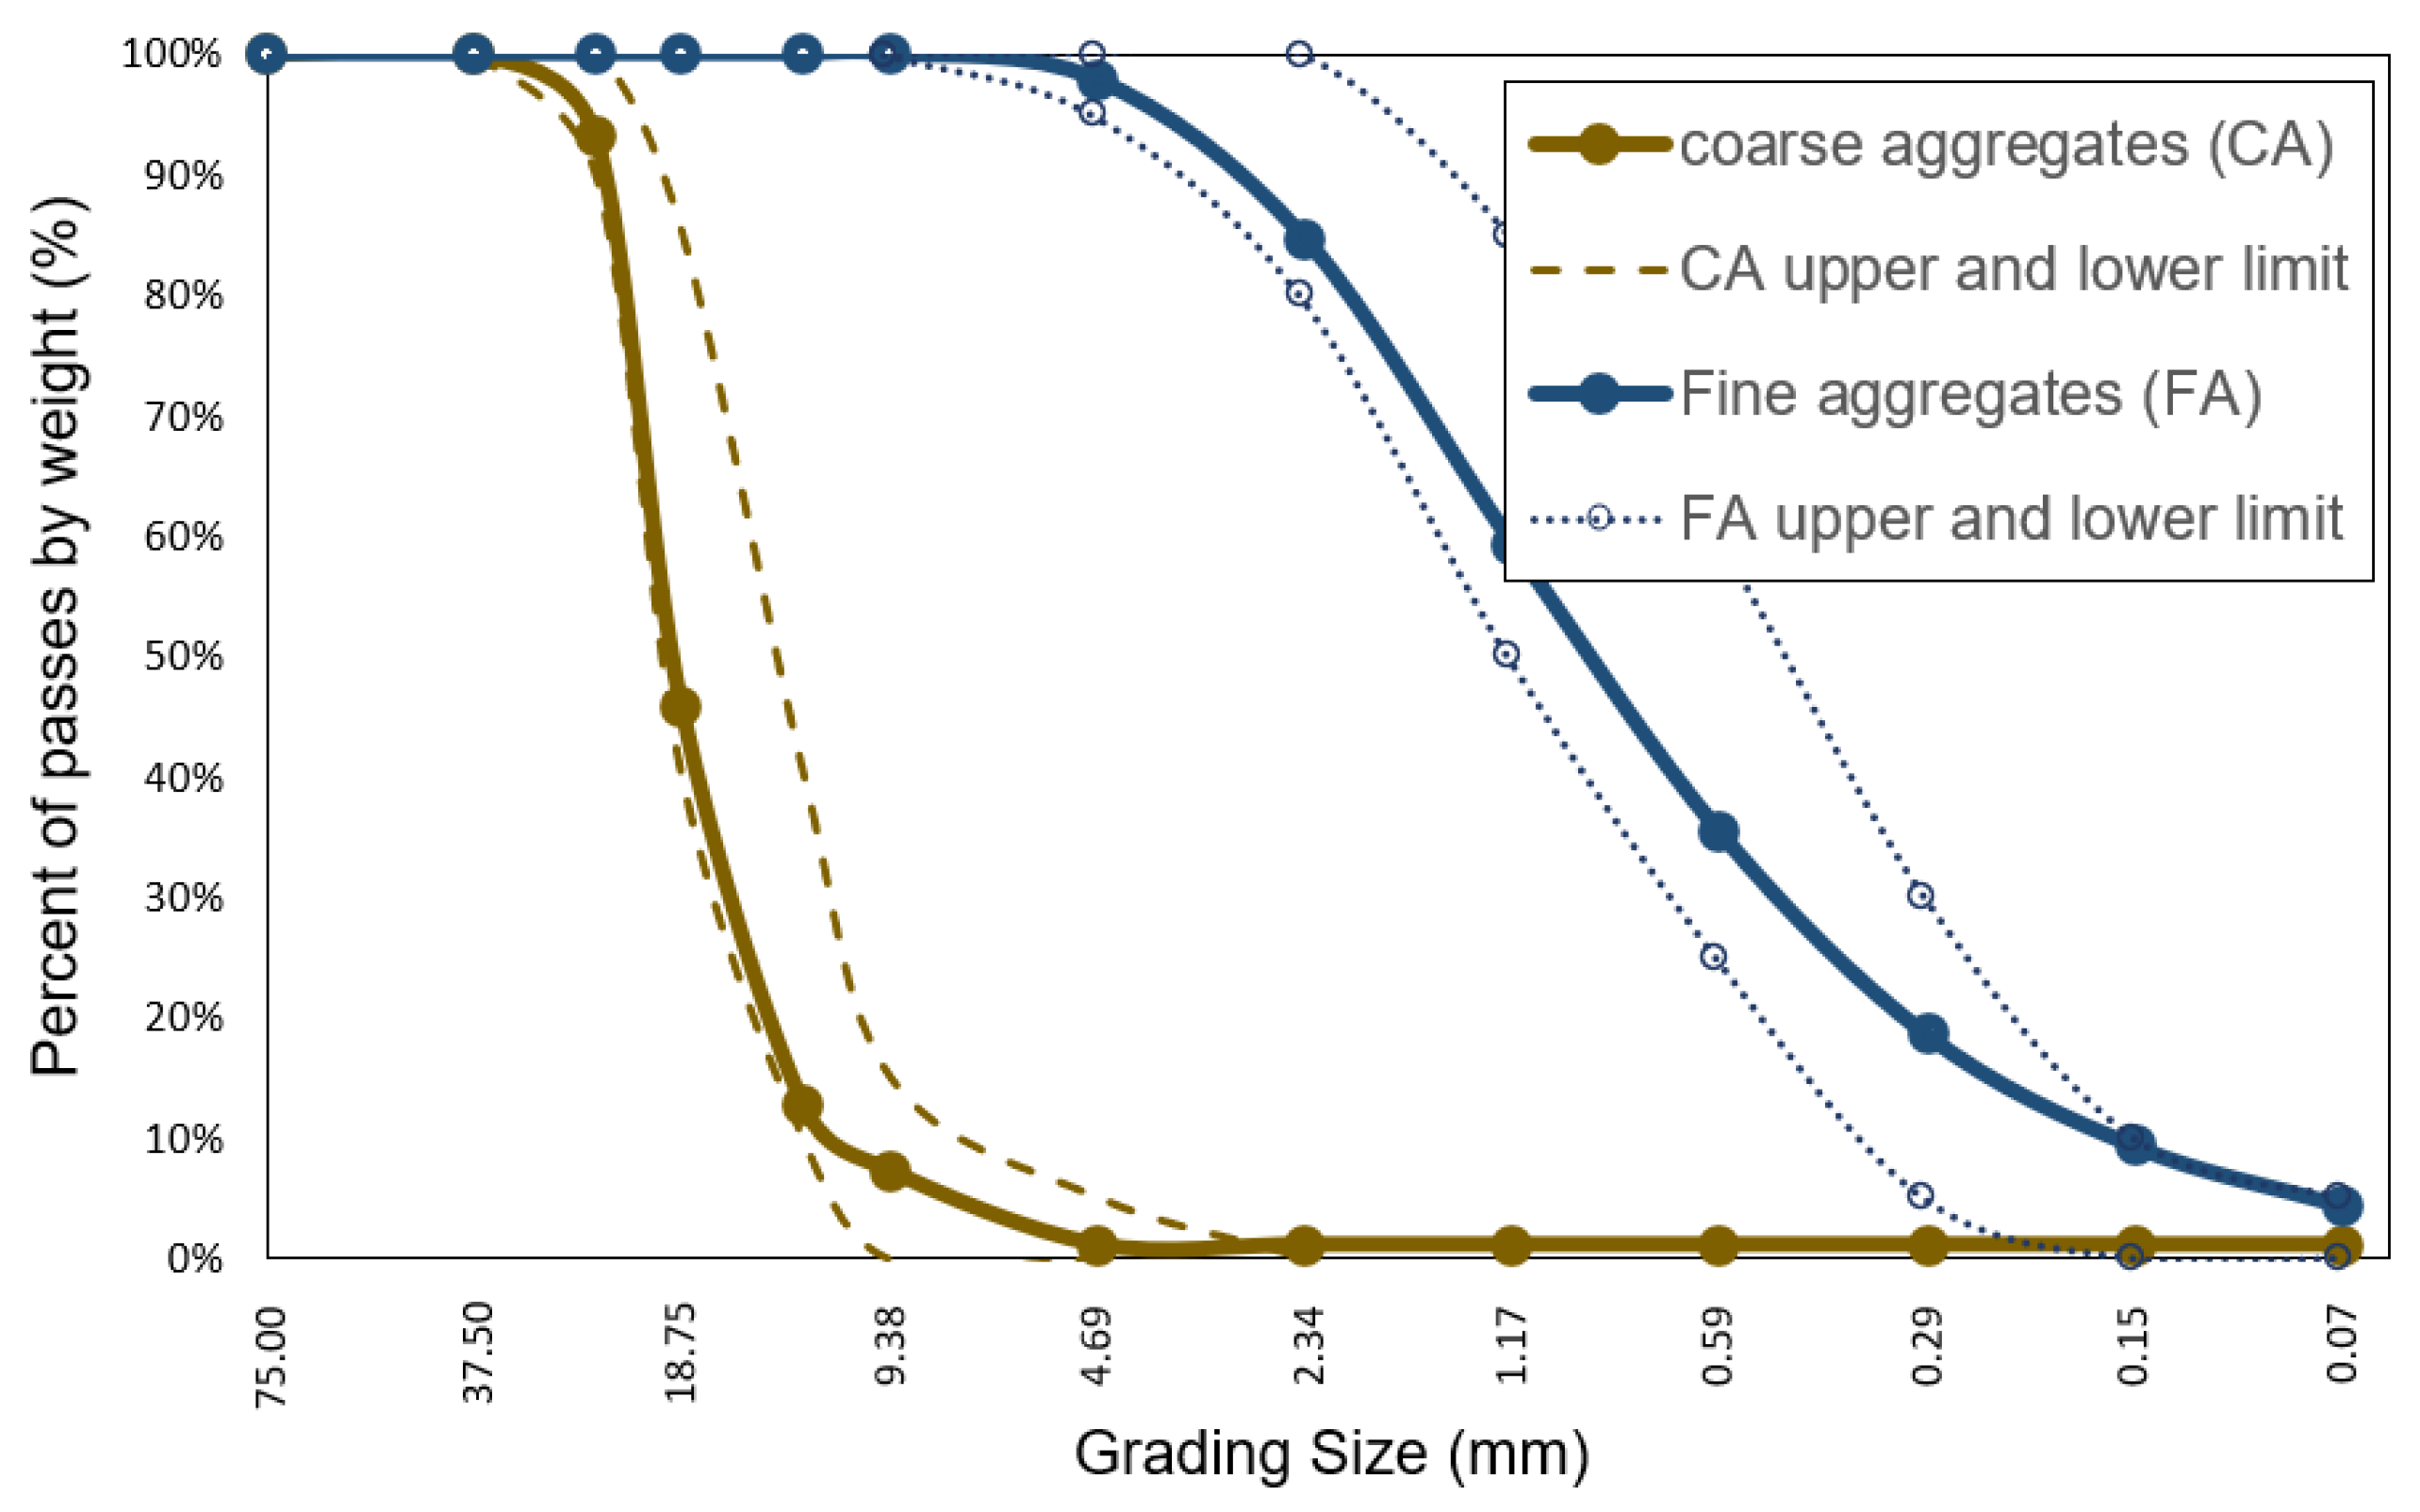
2.1. Materials
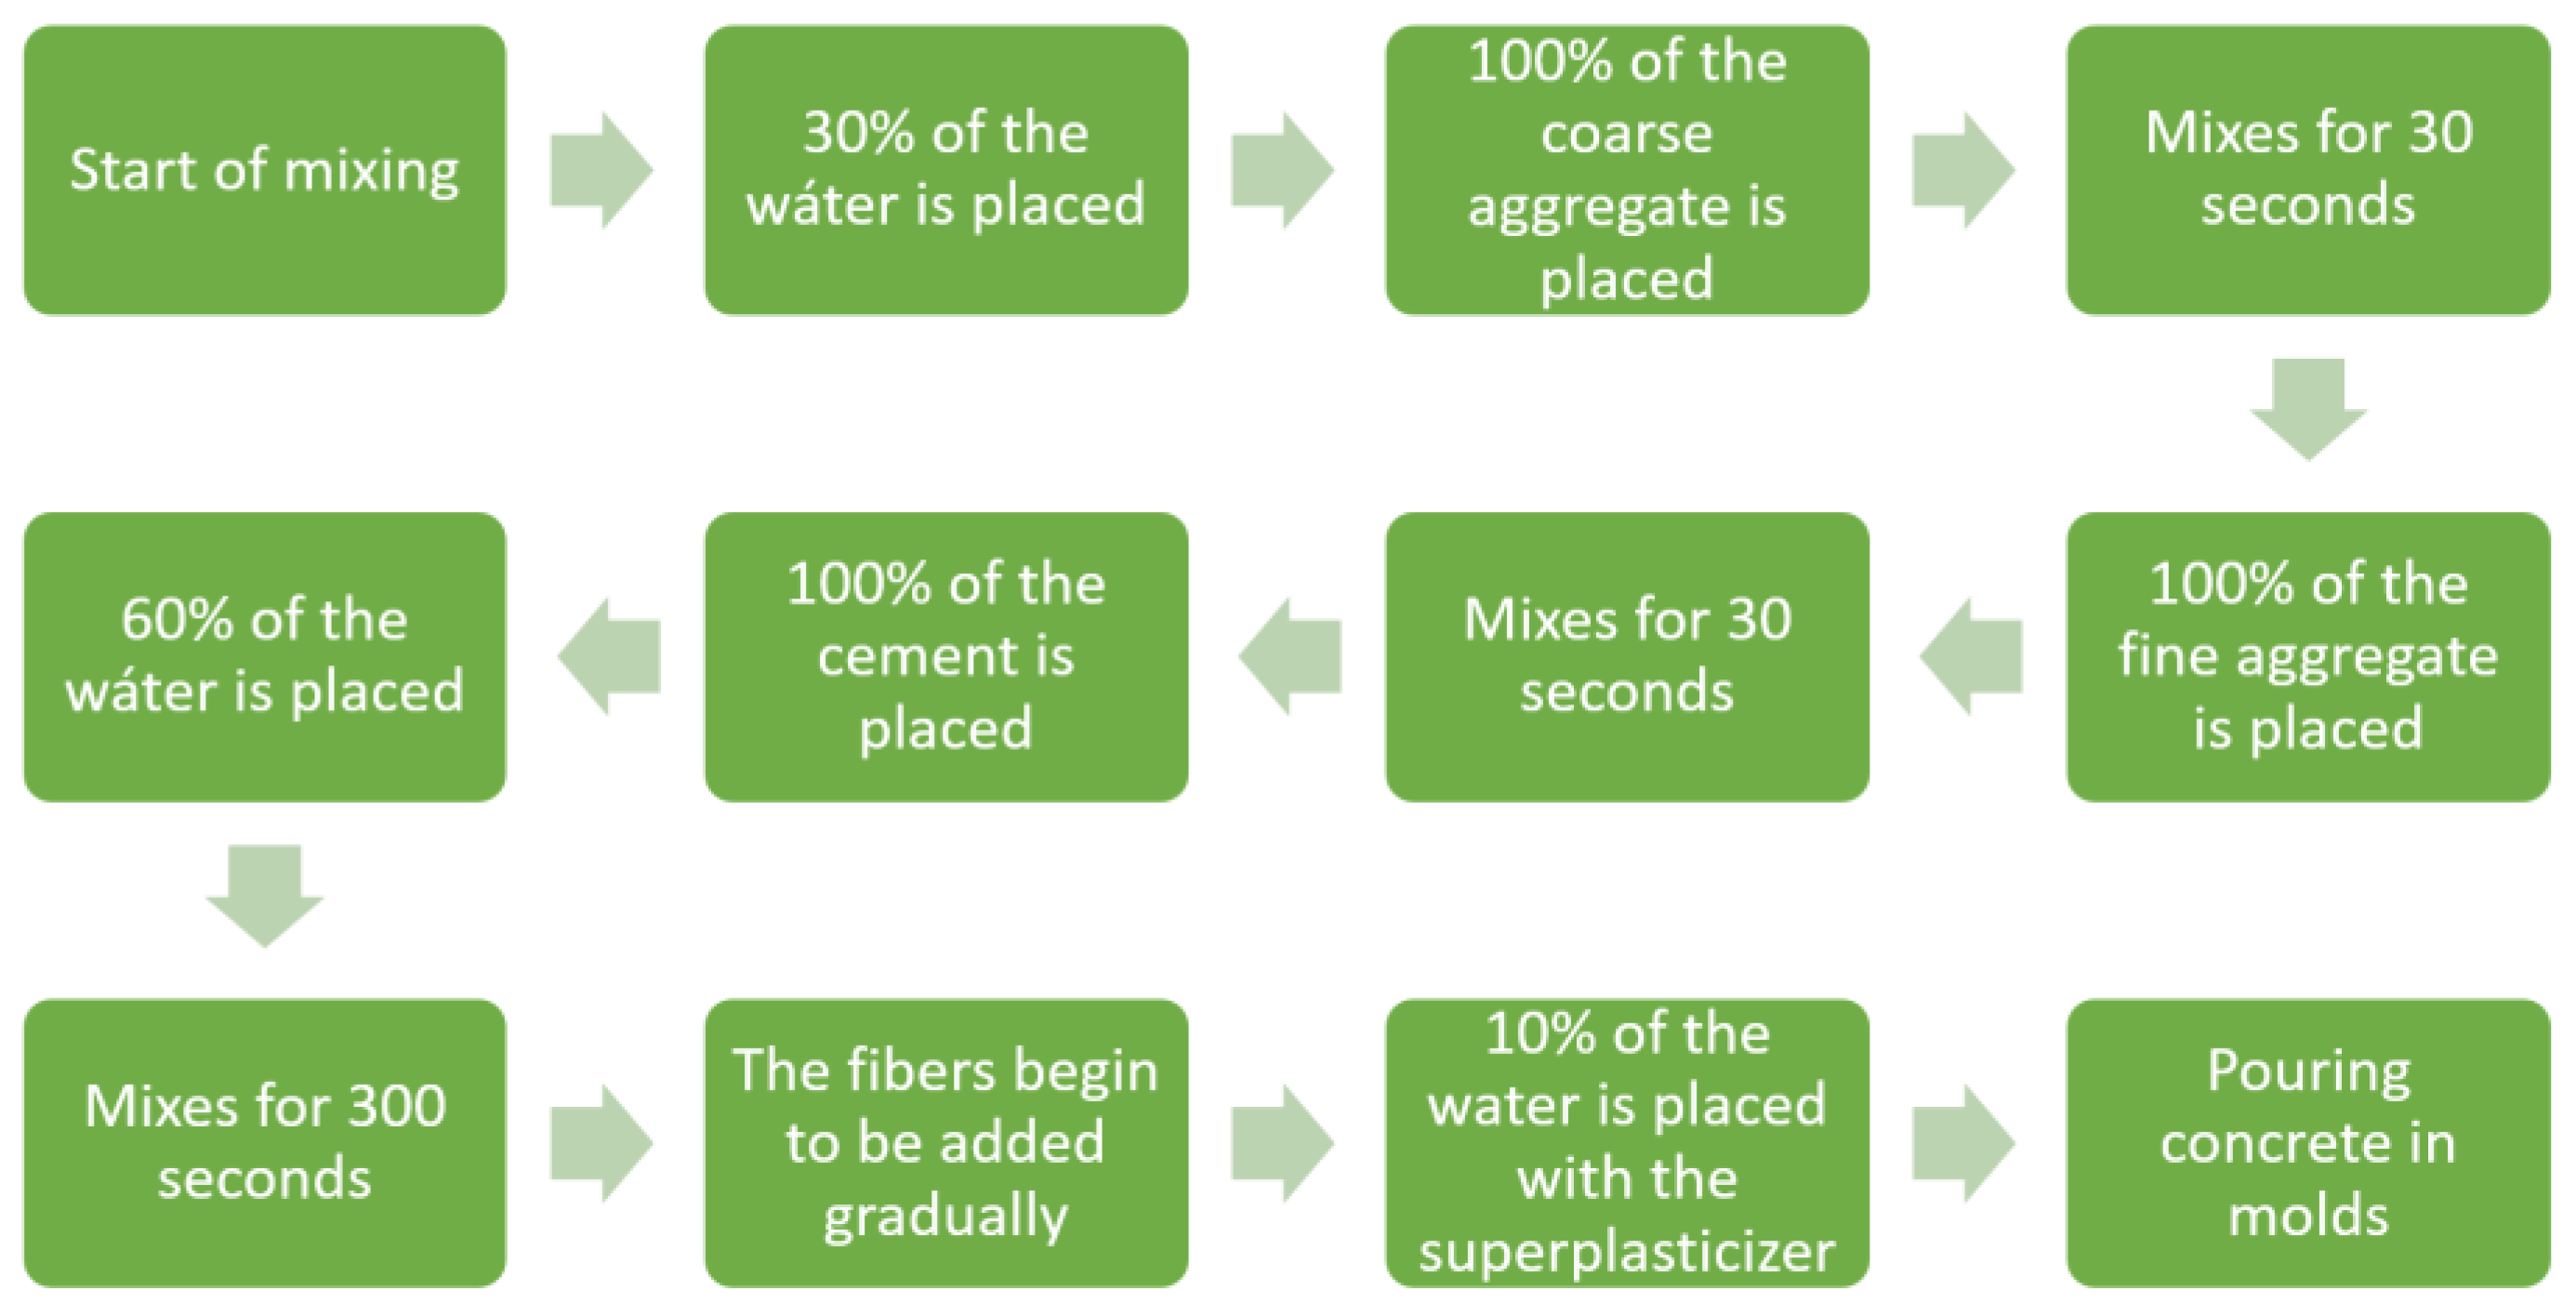
2.2. Mix Design
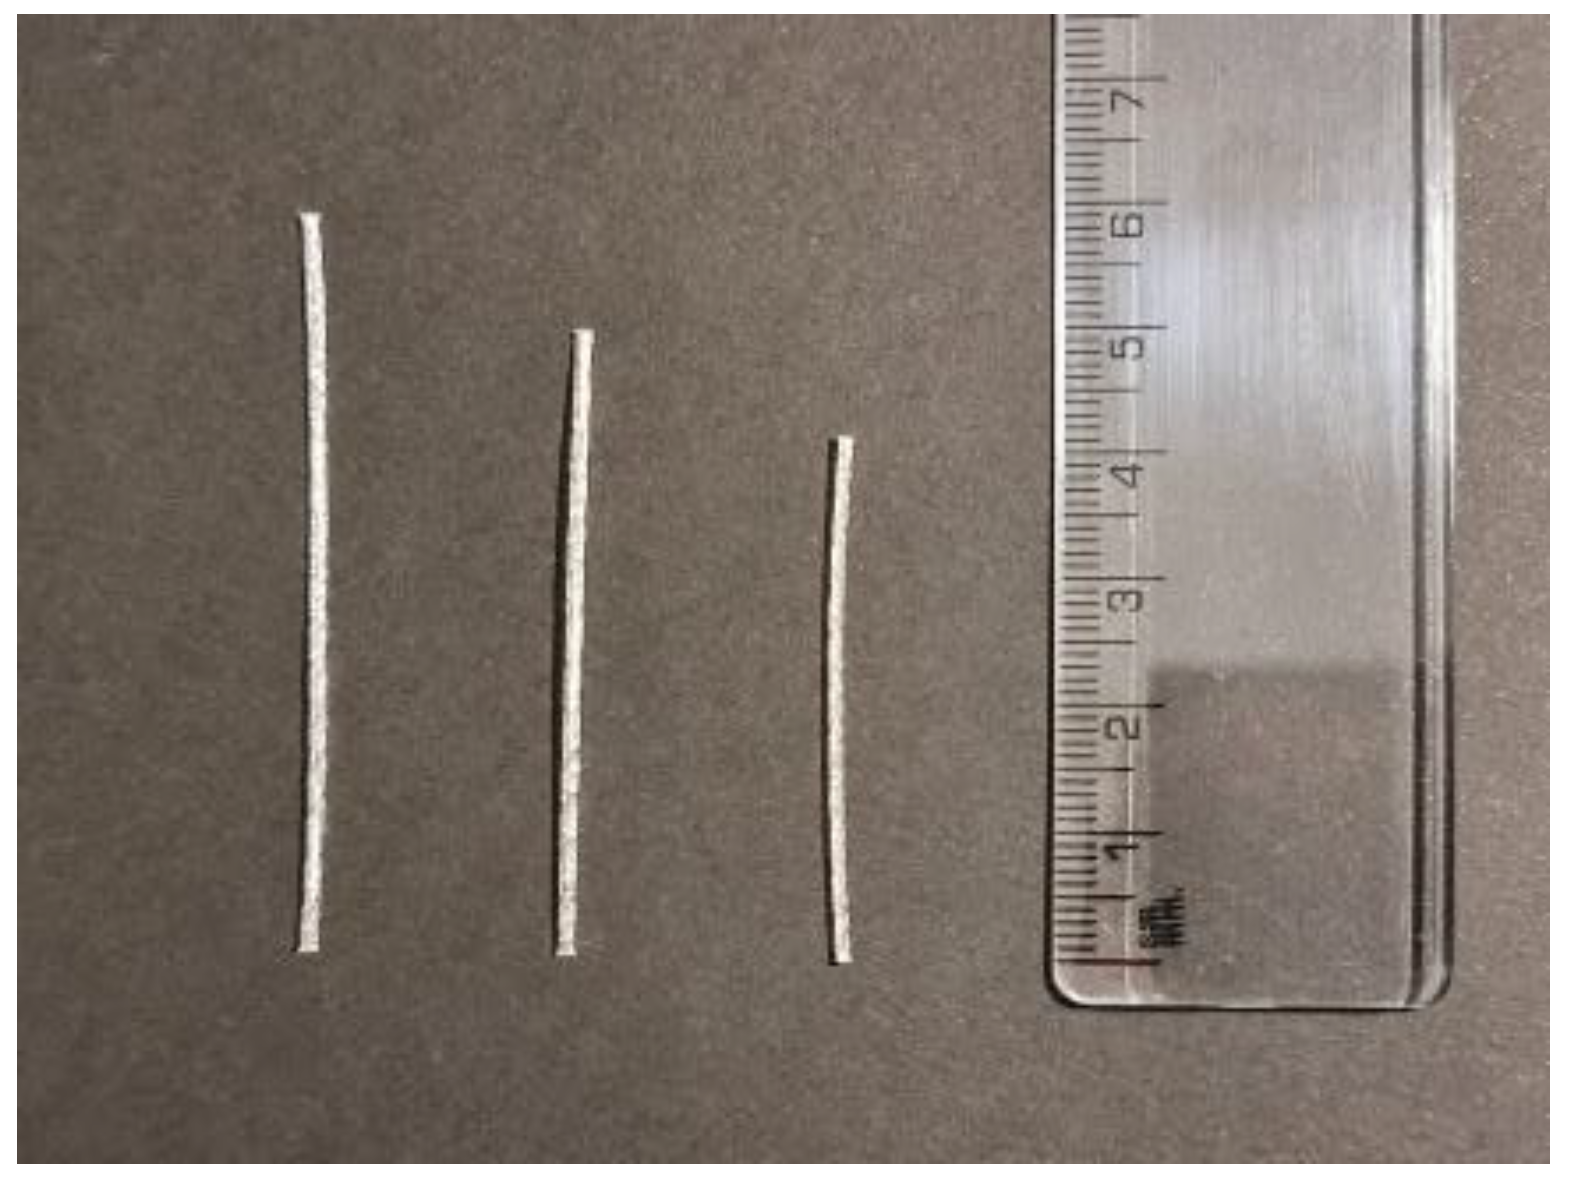
2.3. Specimens
2.4. Experimental Method
2.5. Hypothesis Testing
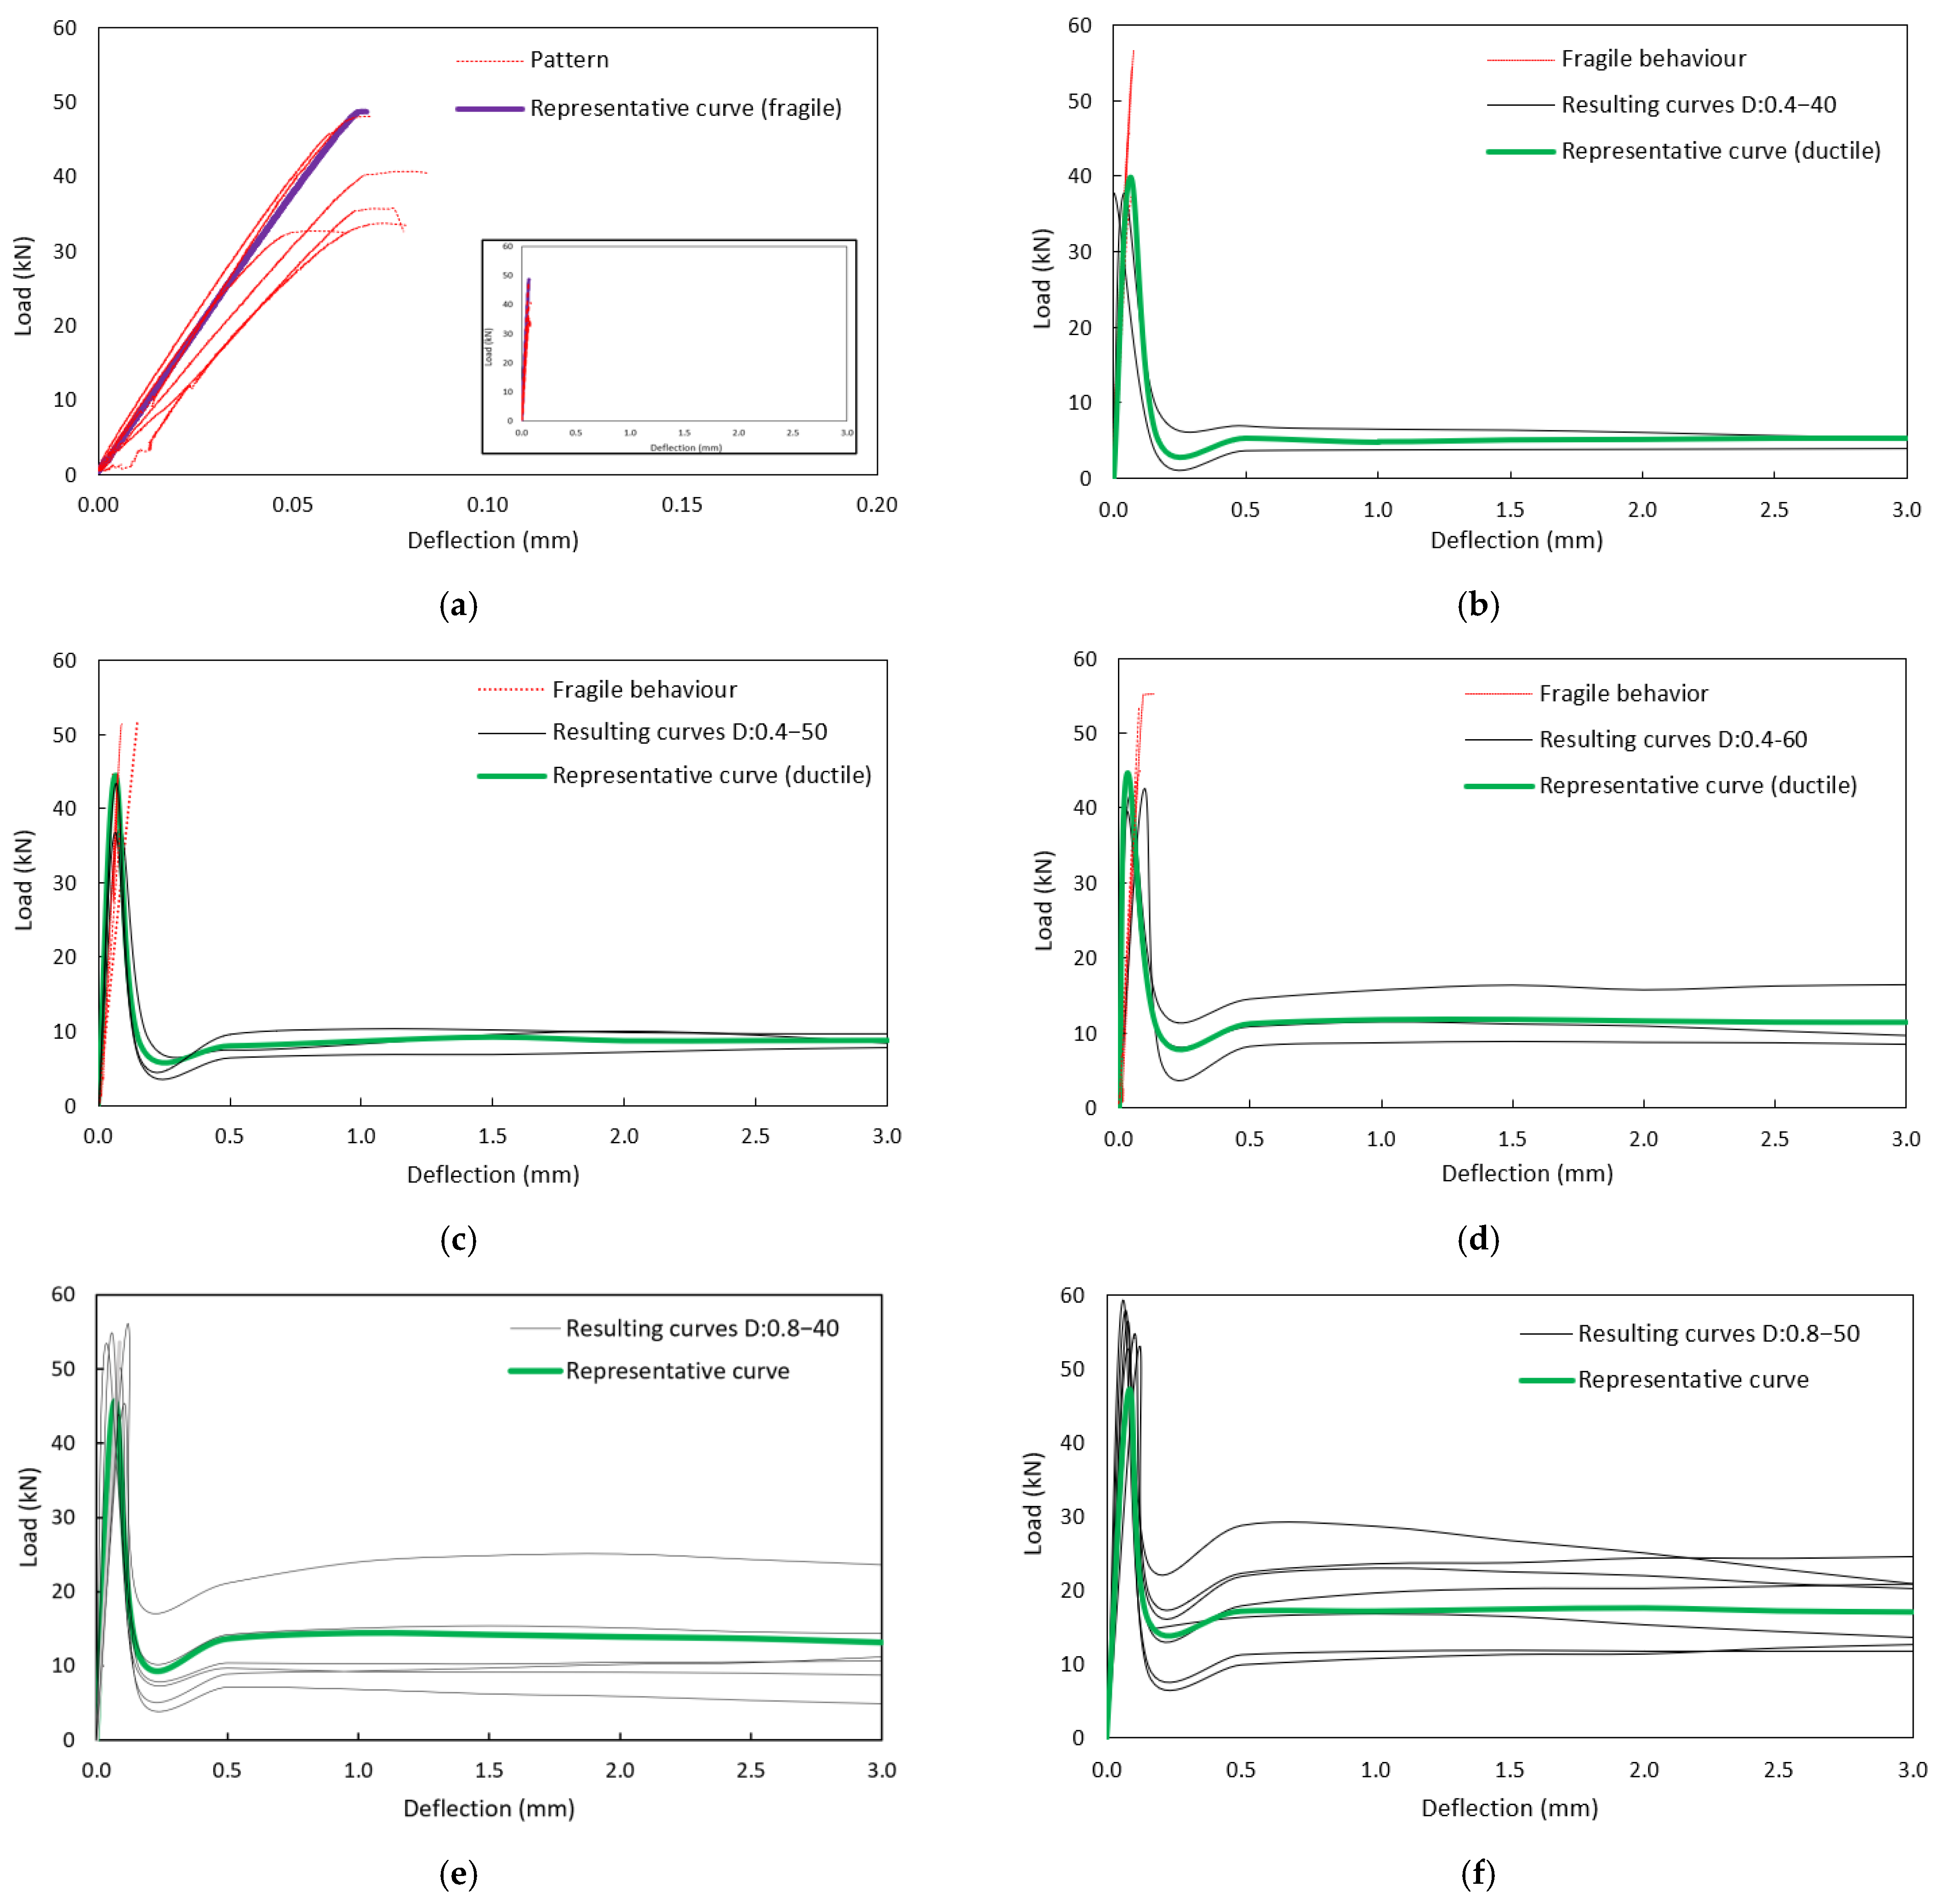
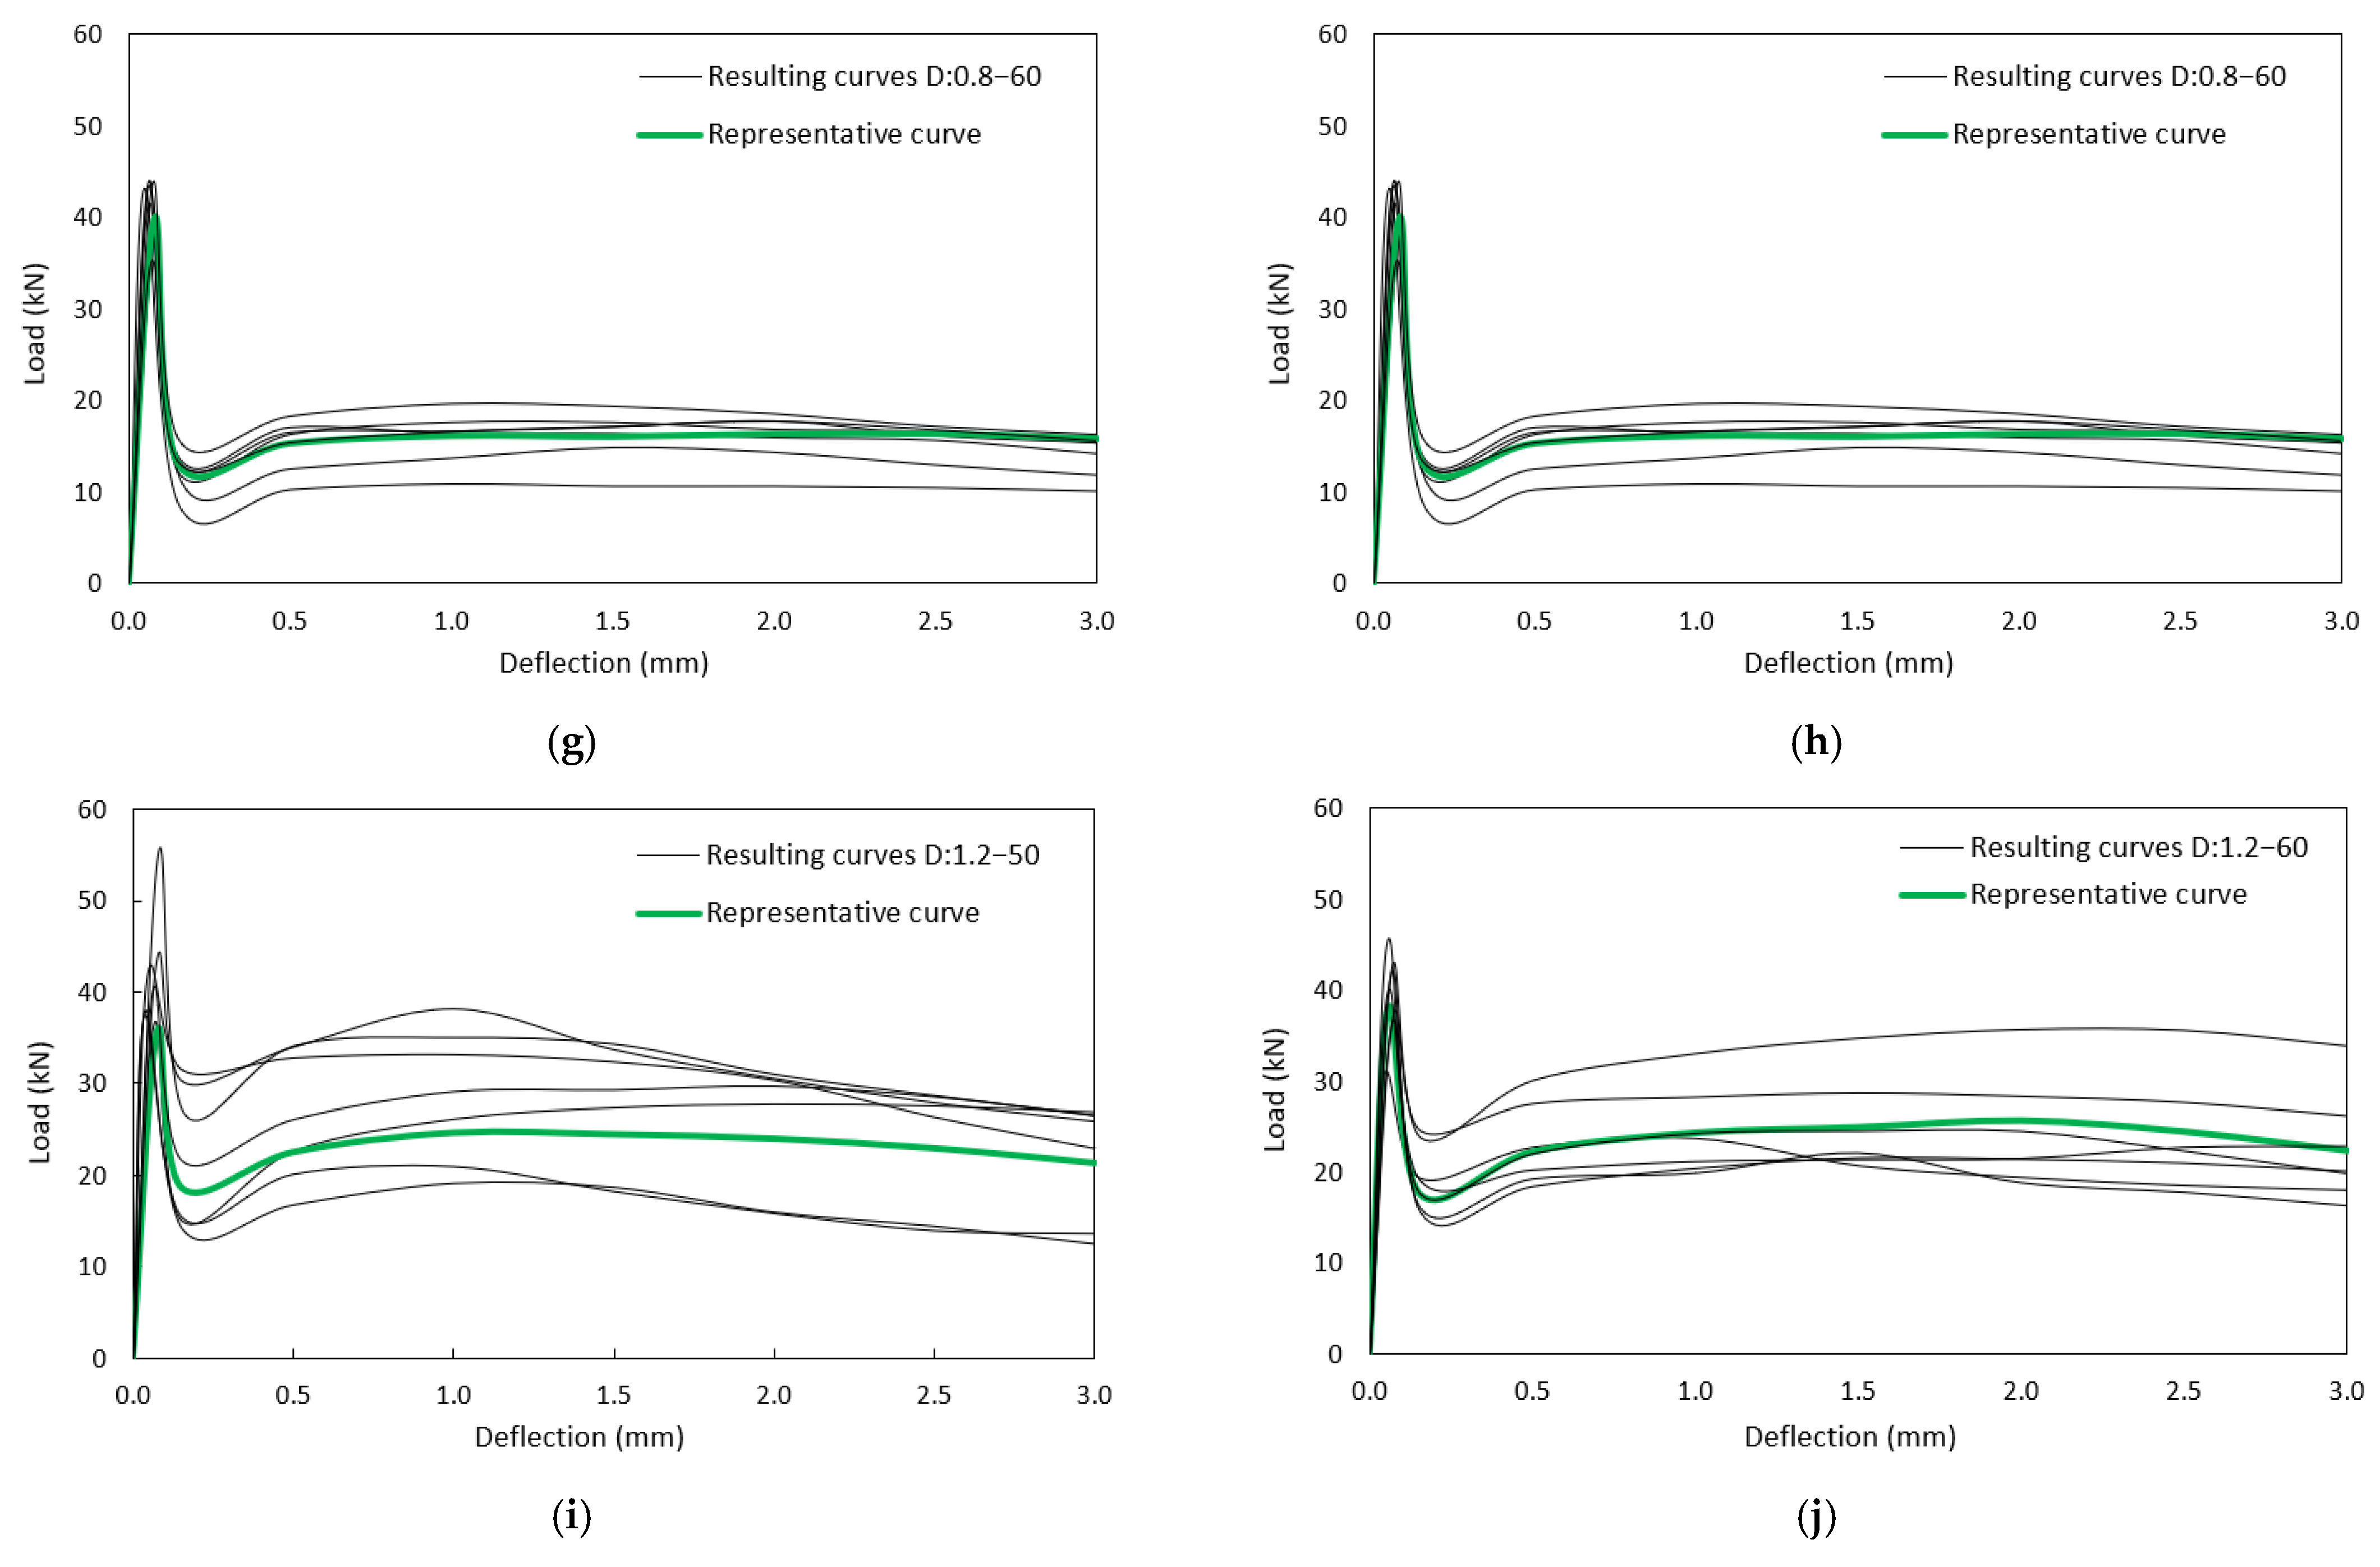
3. Results
4. Discussion
4.1. Properties of Elastic Range
4.2. Post-Failures Mechanical Properties
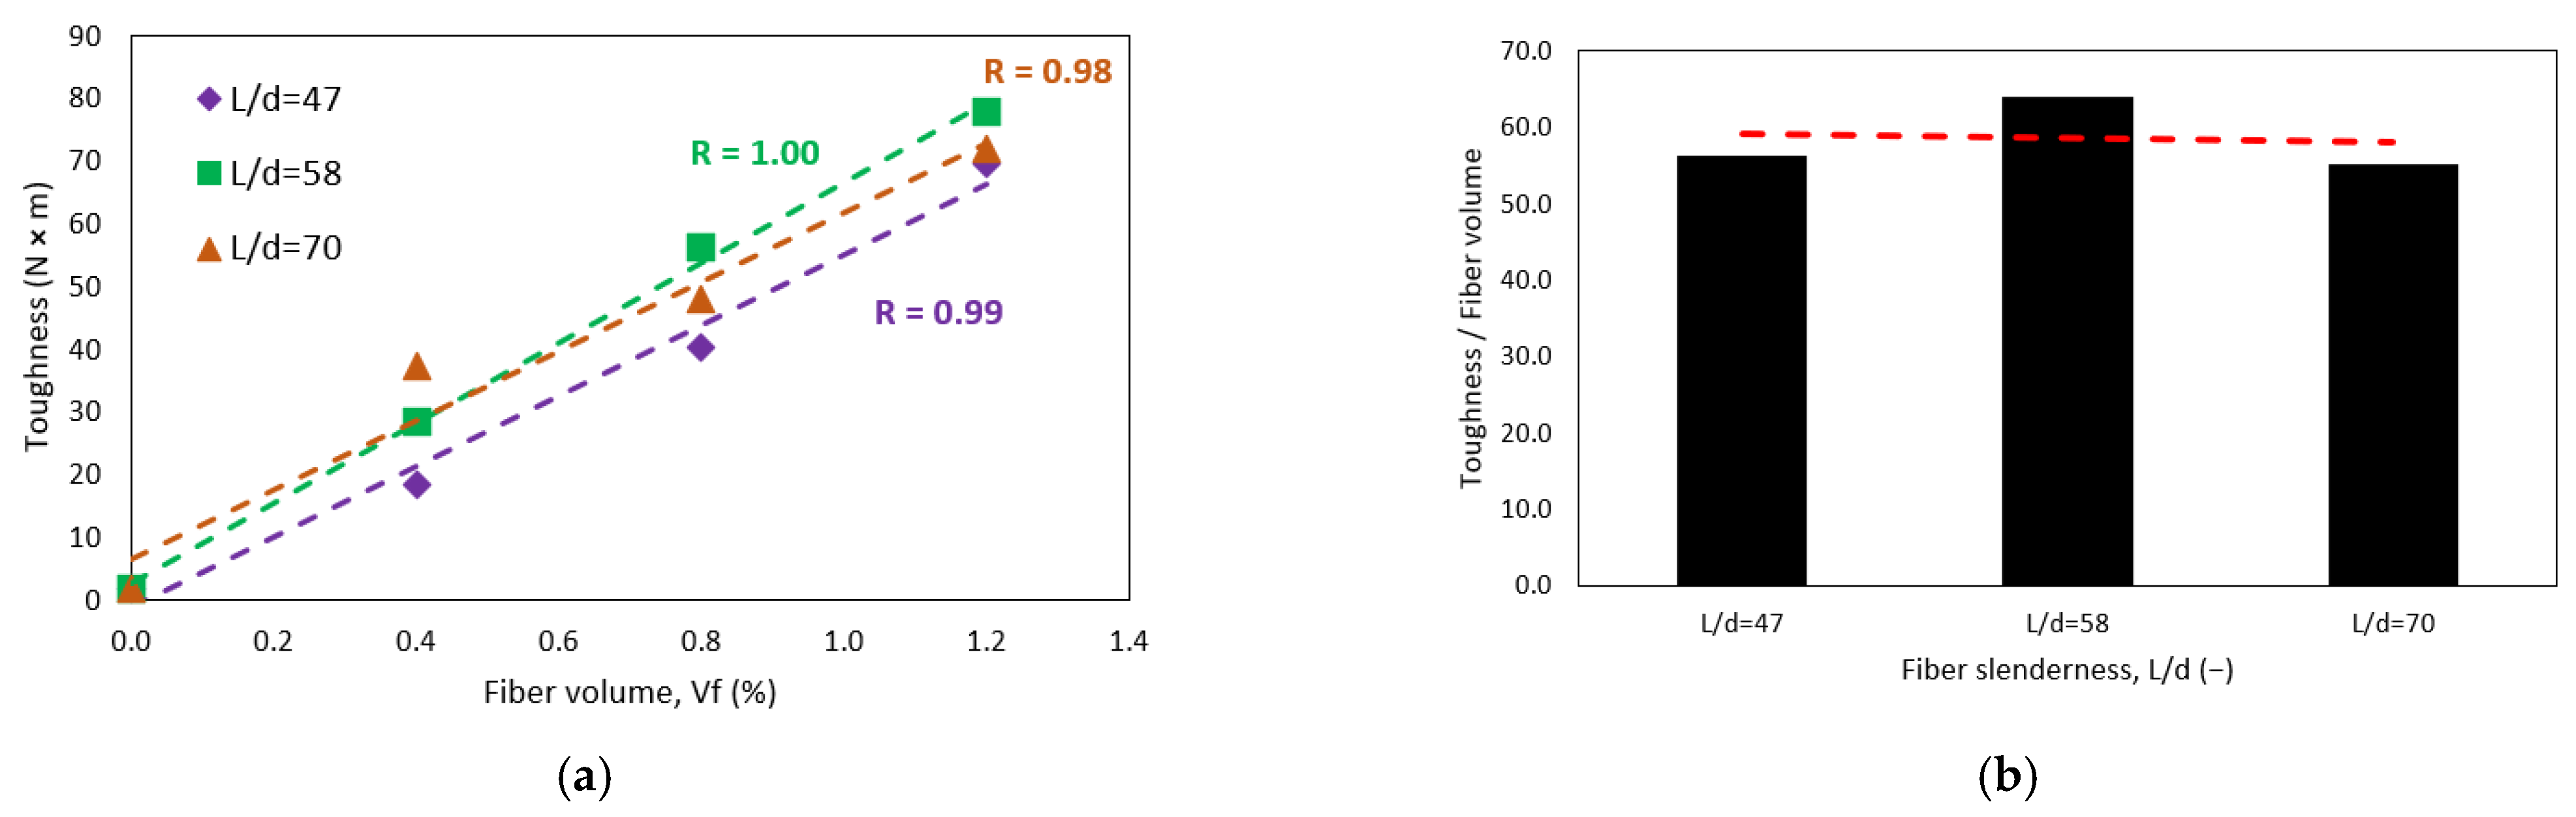
4.2.1. Toughness
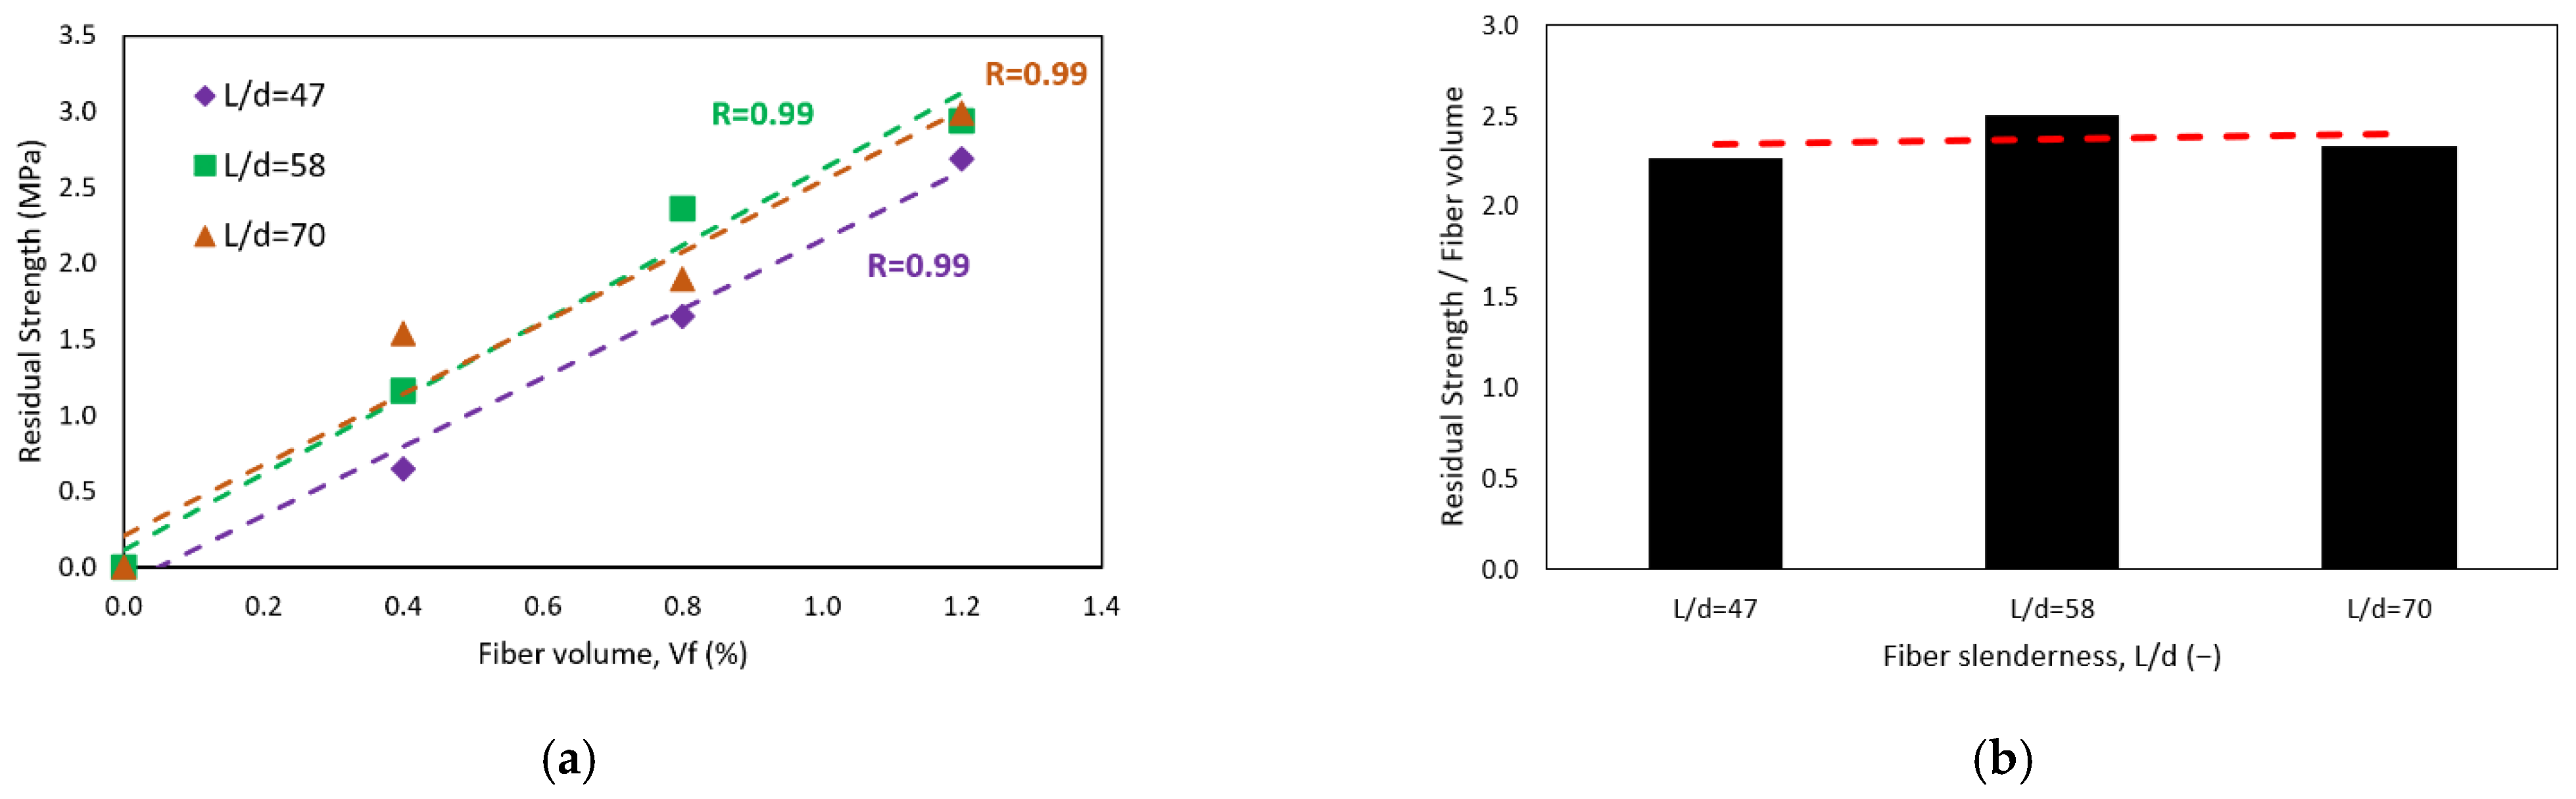
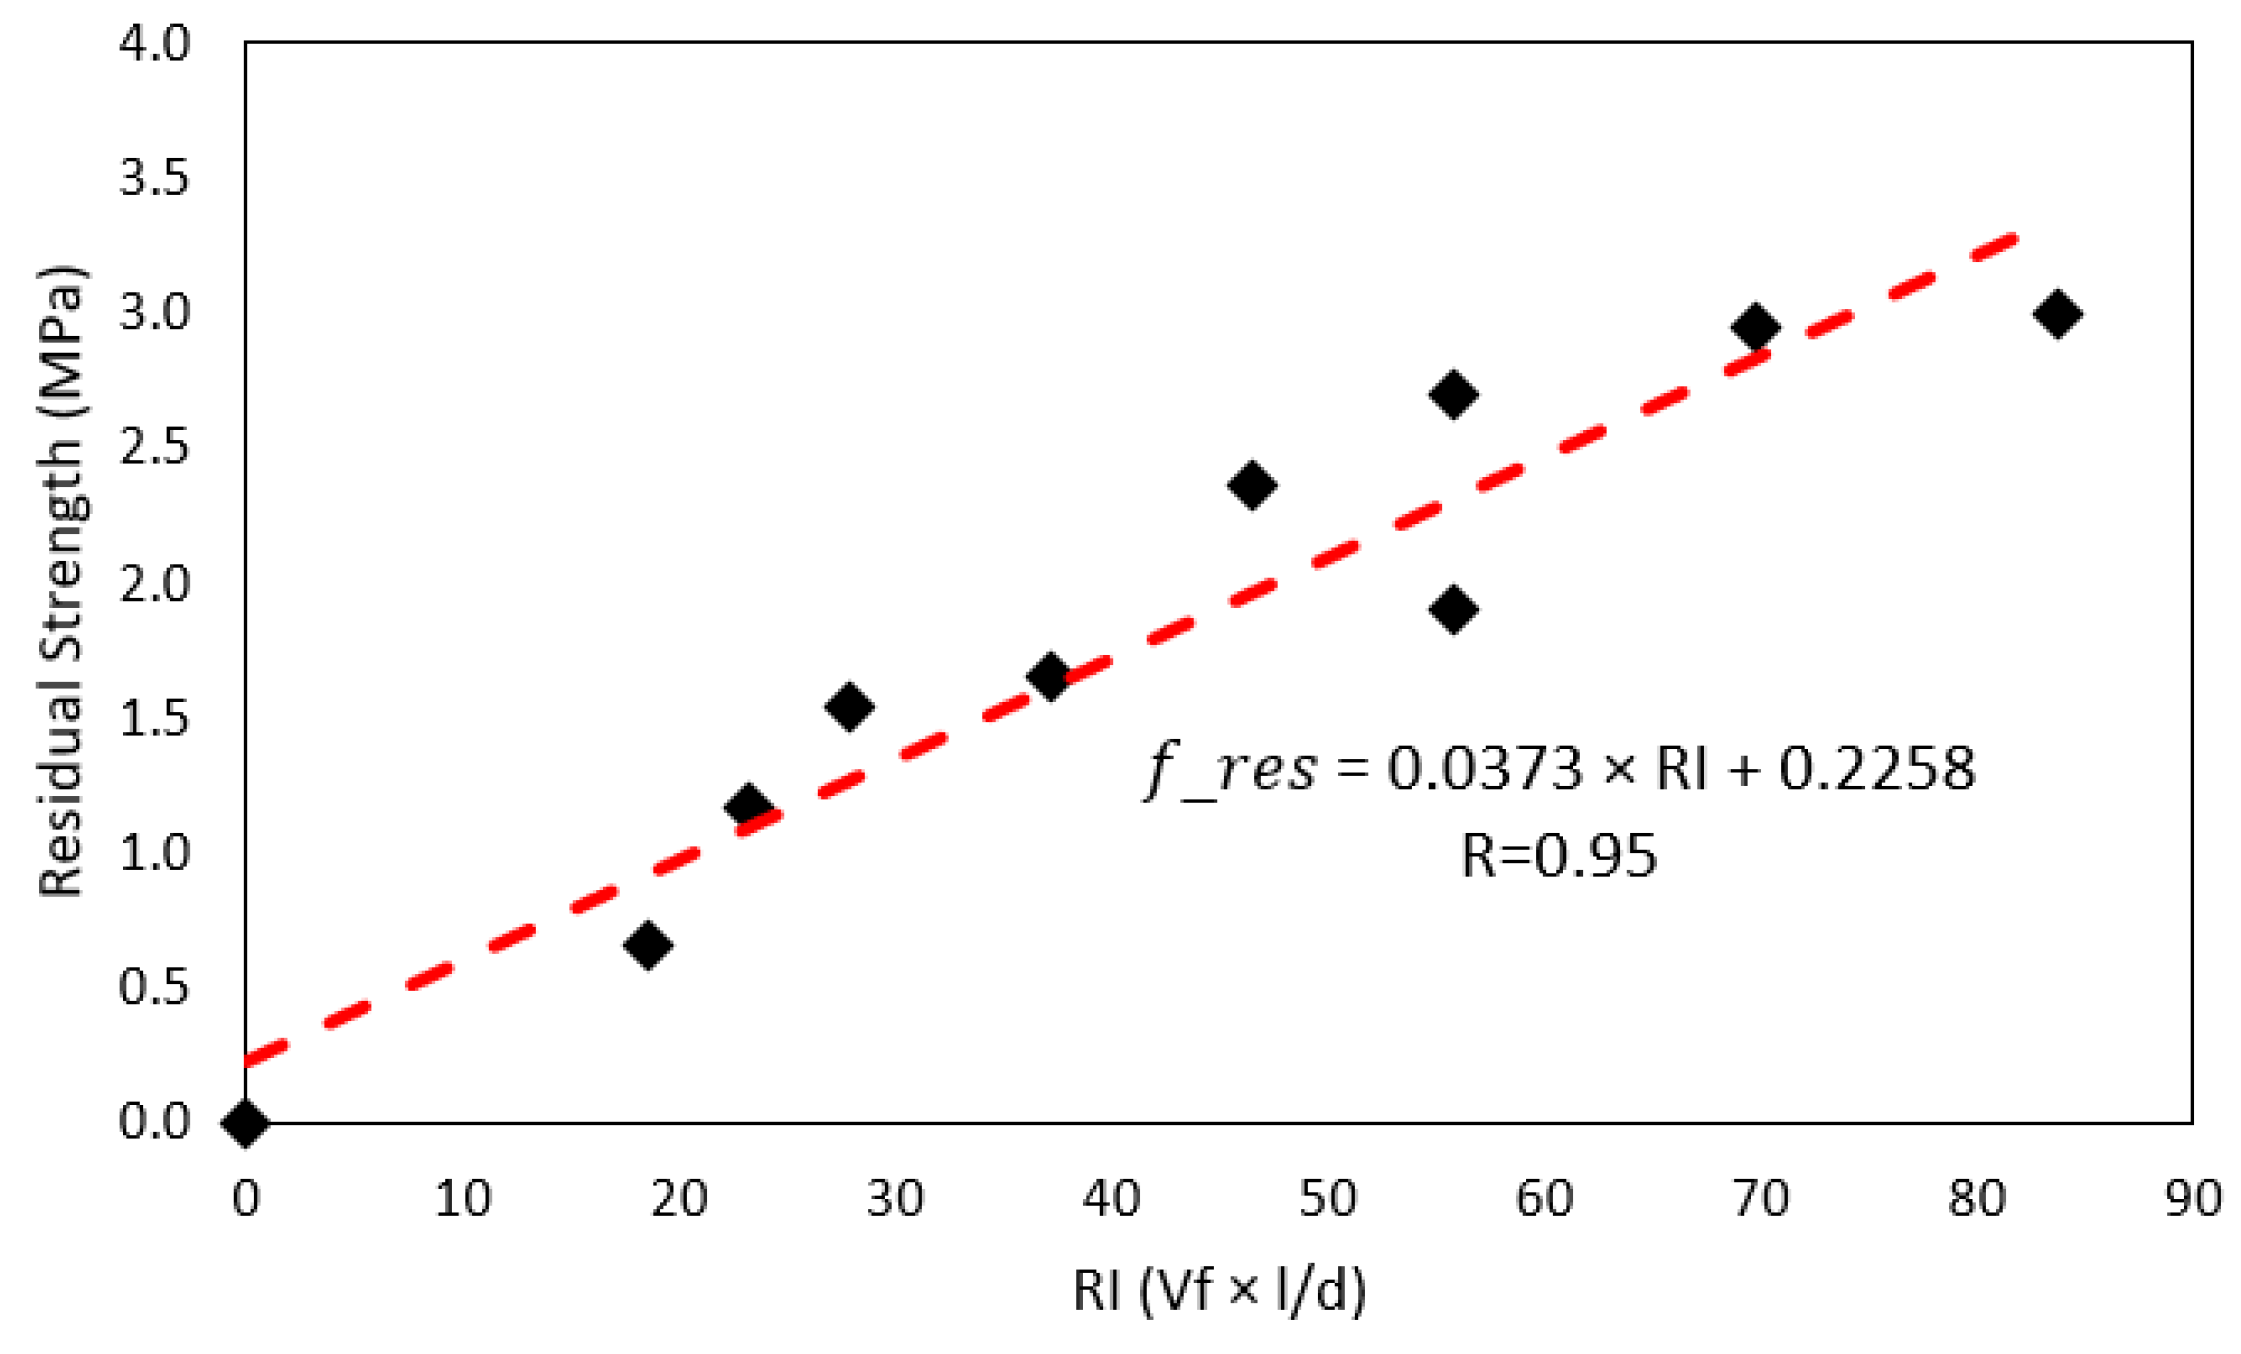
4.2.2. Residual Resistance
4.3. Statistical Analysis
4.3.1. Influence of Fiber Stiffness on Concrete Toughness
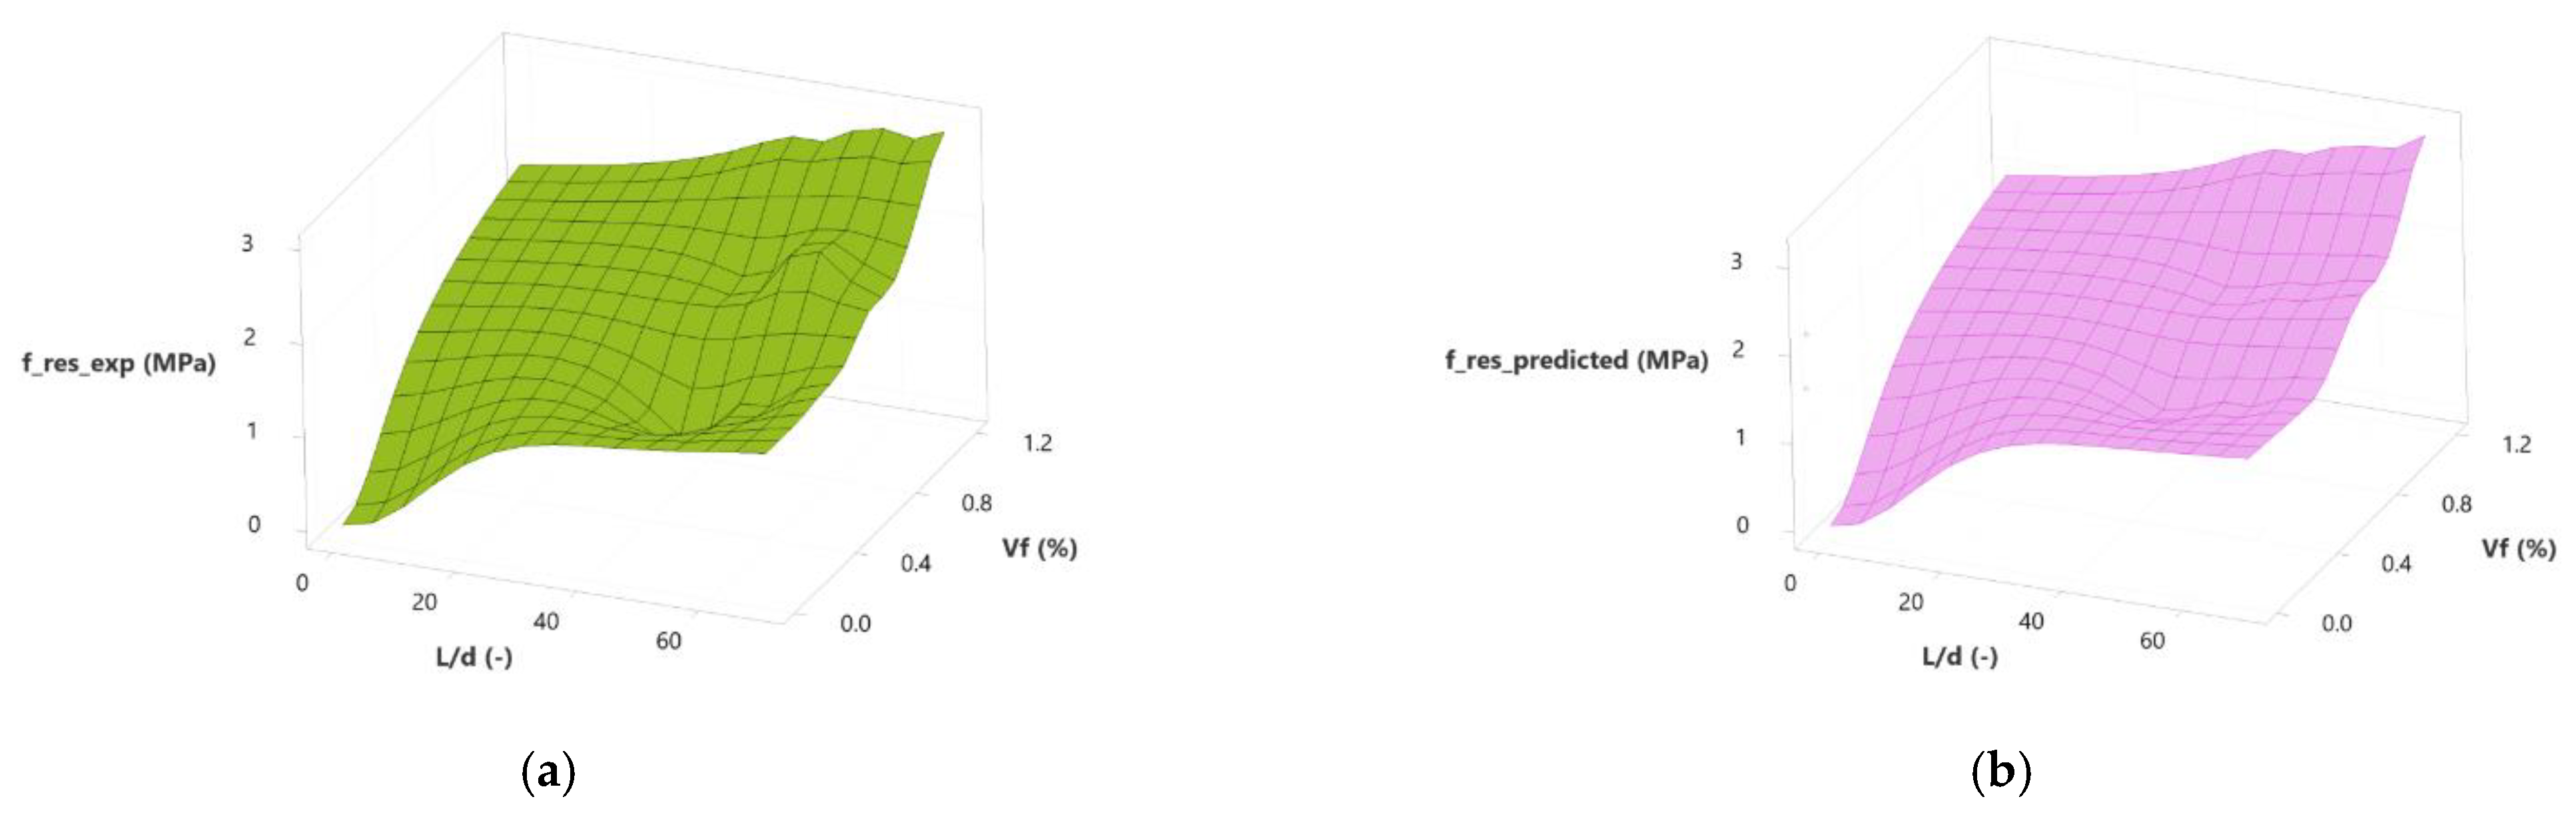
4.3.2. Development of Empirical Predictive Equations
5. Conclusions
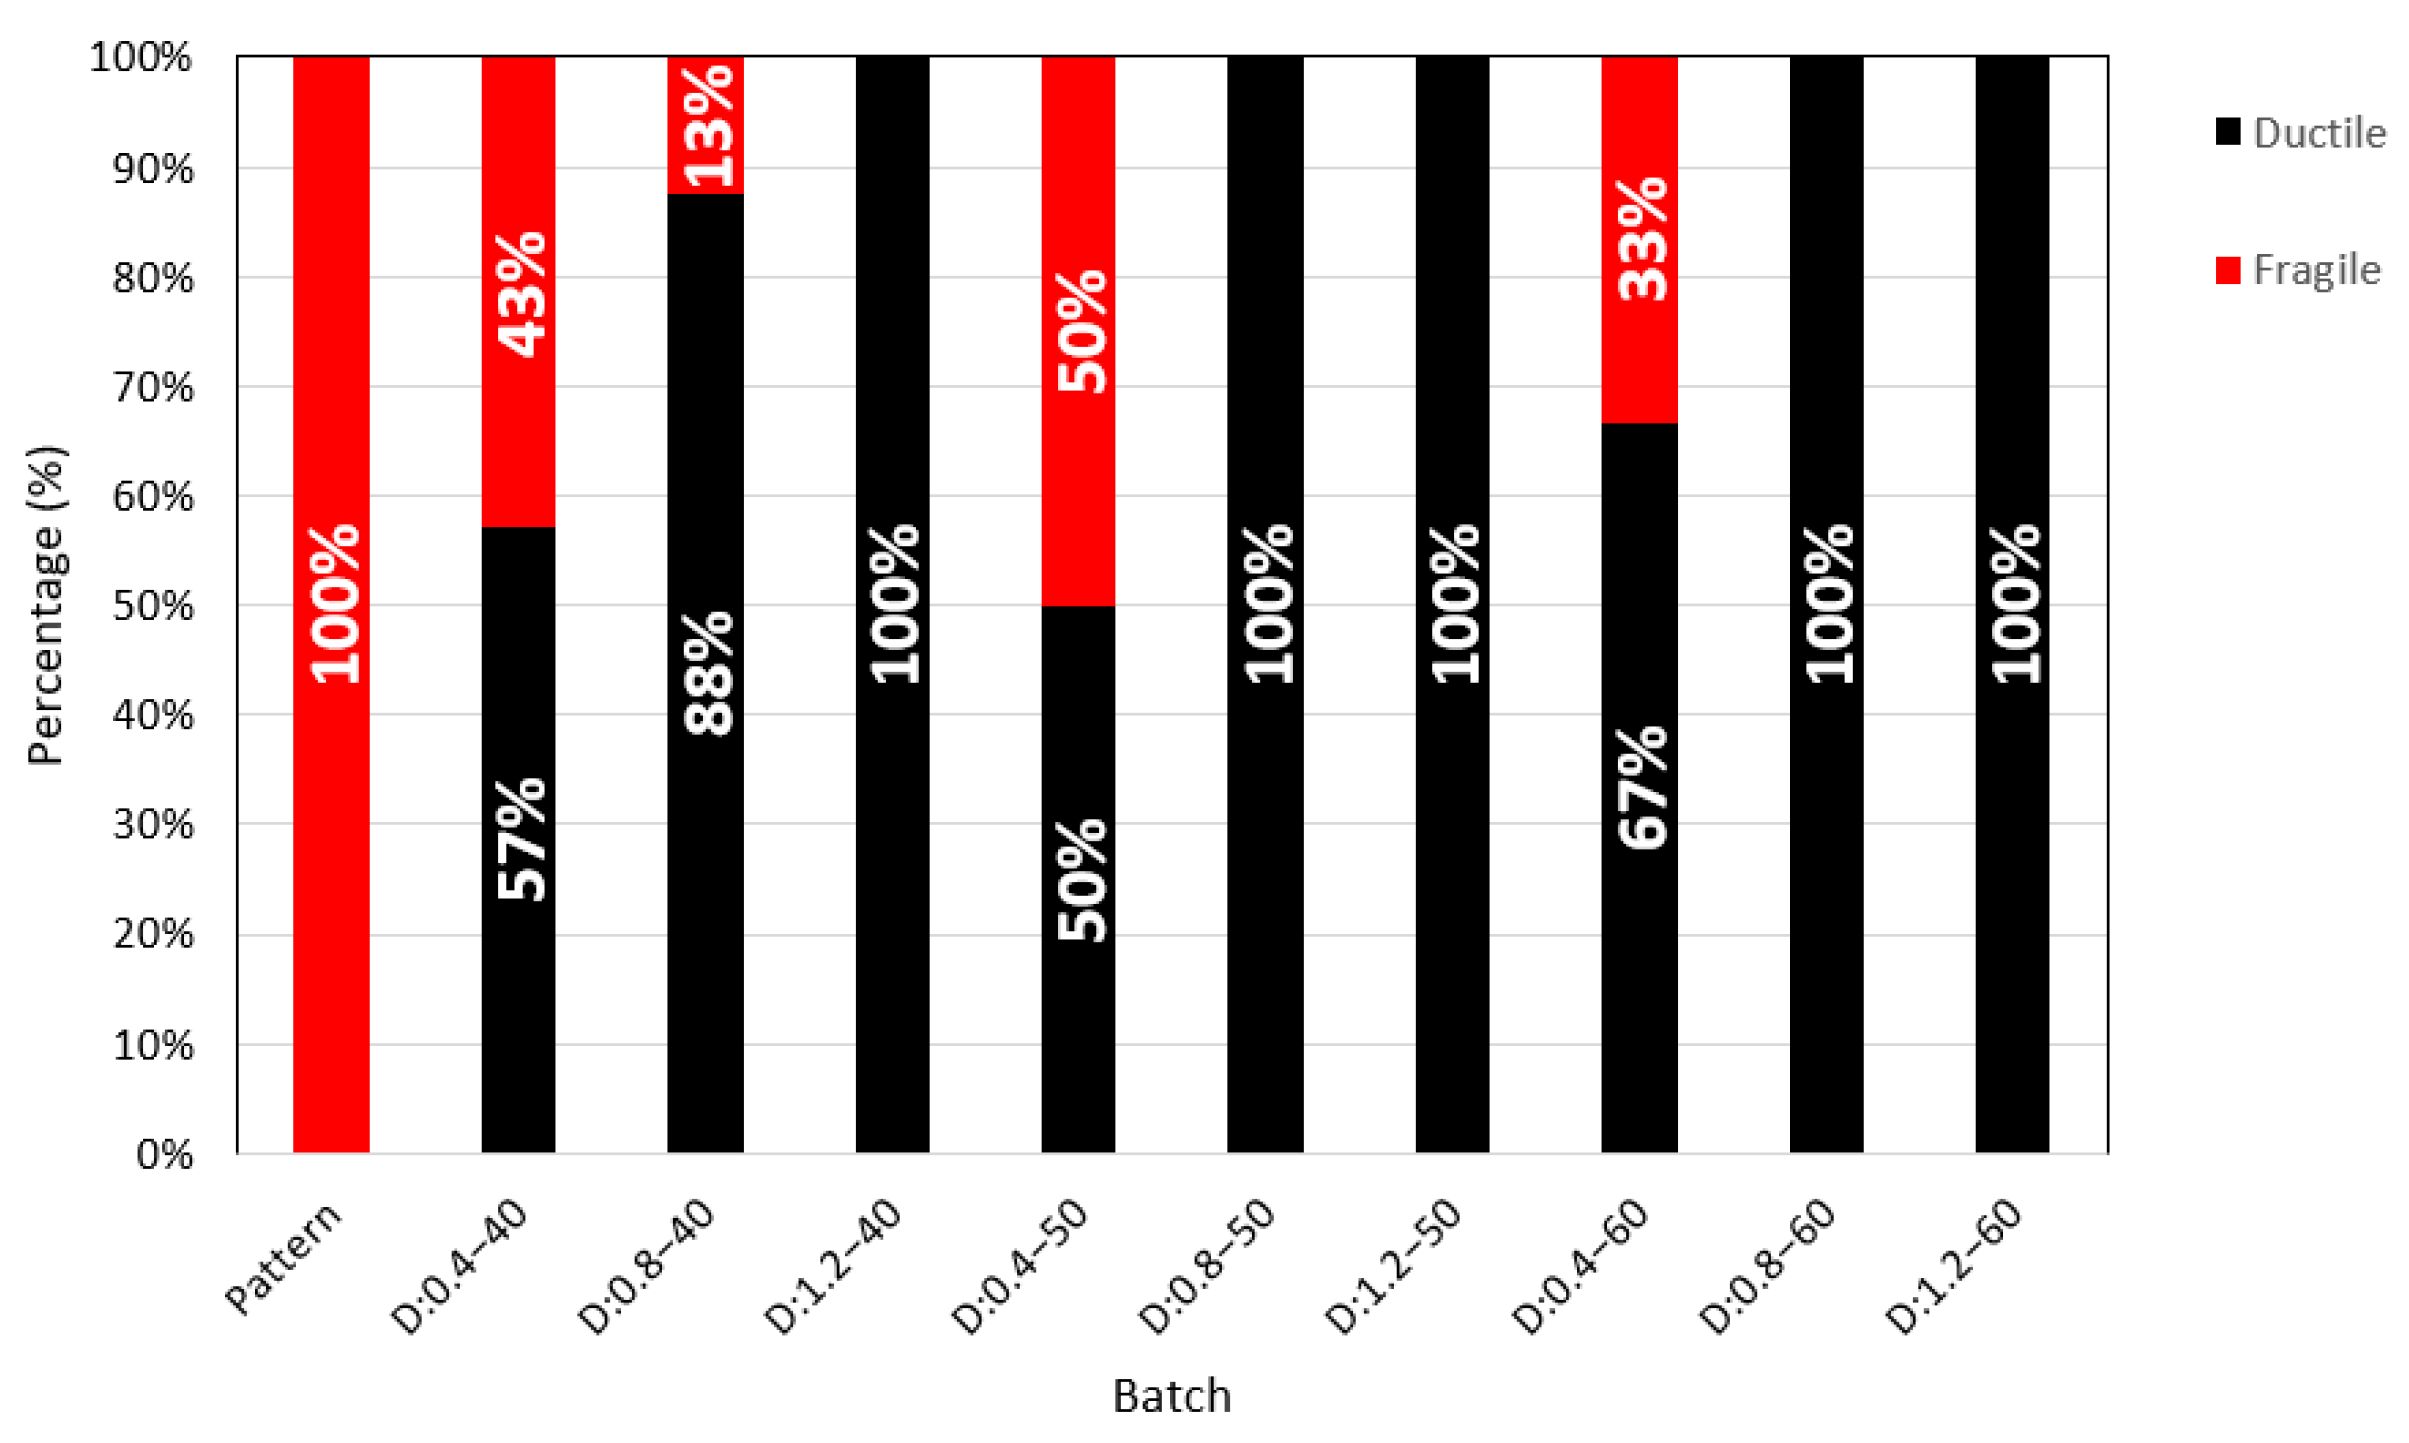
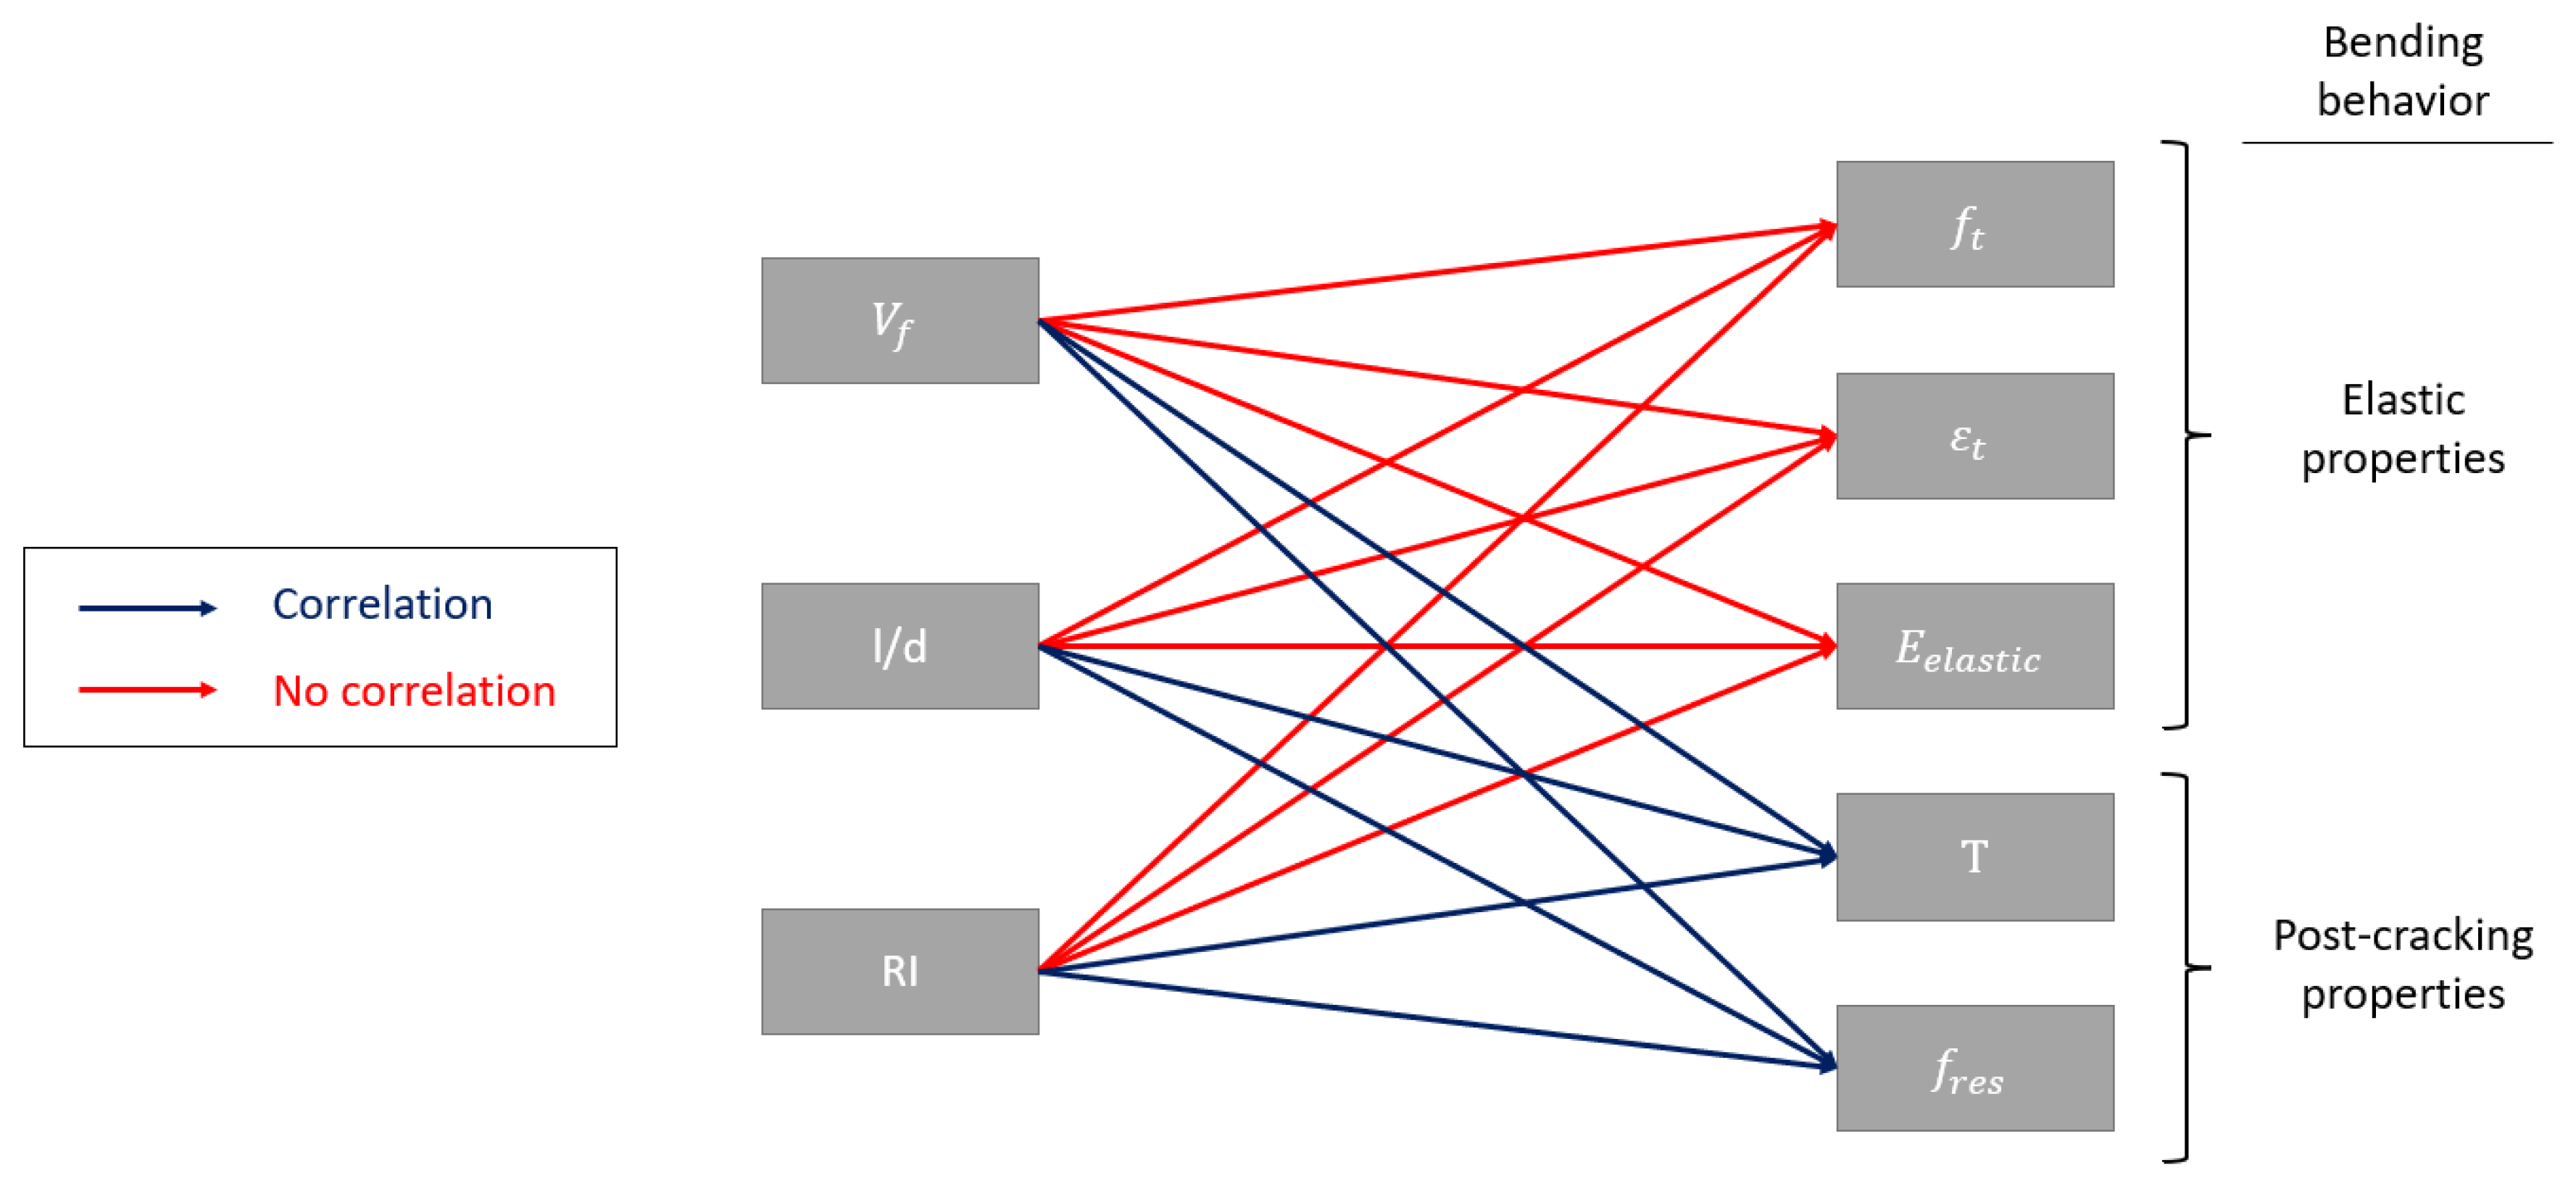
- The results showed a strong correlation between fiber parameters and post-cracking properties. The higher the volume, slenderness, and reinforcement index of PP fibers, the higher the toughness and residual strength of the concrete. Pearson’s hypothesis supports this since the p-values in all correlations between fiber parameters and elastic properties were less than the established significance level of 10%, rejecting the null hypothesis.
- The modulus of elasticity of the fibers conditions the toughness increase due to the reinforcement index. Investigations using fibers with high values of fiber modulus of elasticity reported greater increases in toughness concerning fibers with low values of modulus of elasticity. The rate of increase in toughness concerning RI is 0.263 units per 10 GPa increase in fiber modulus of elasticity.
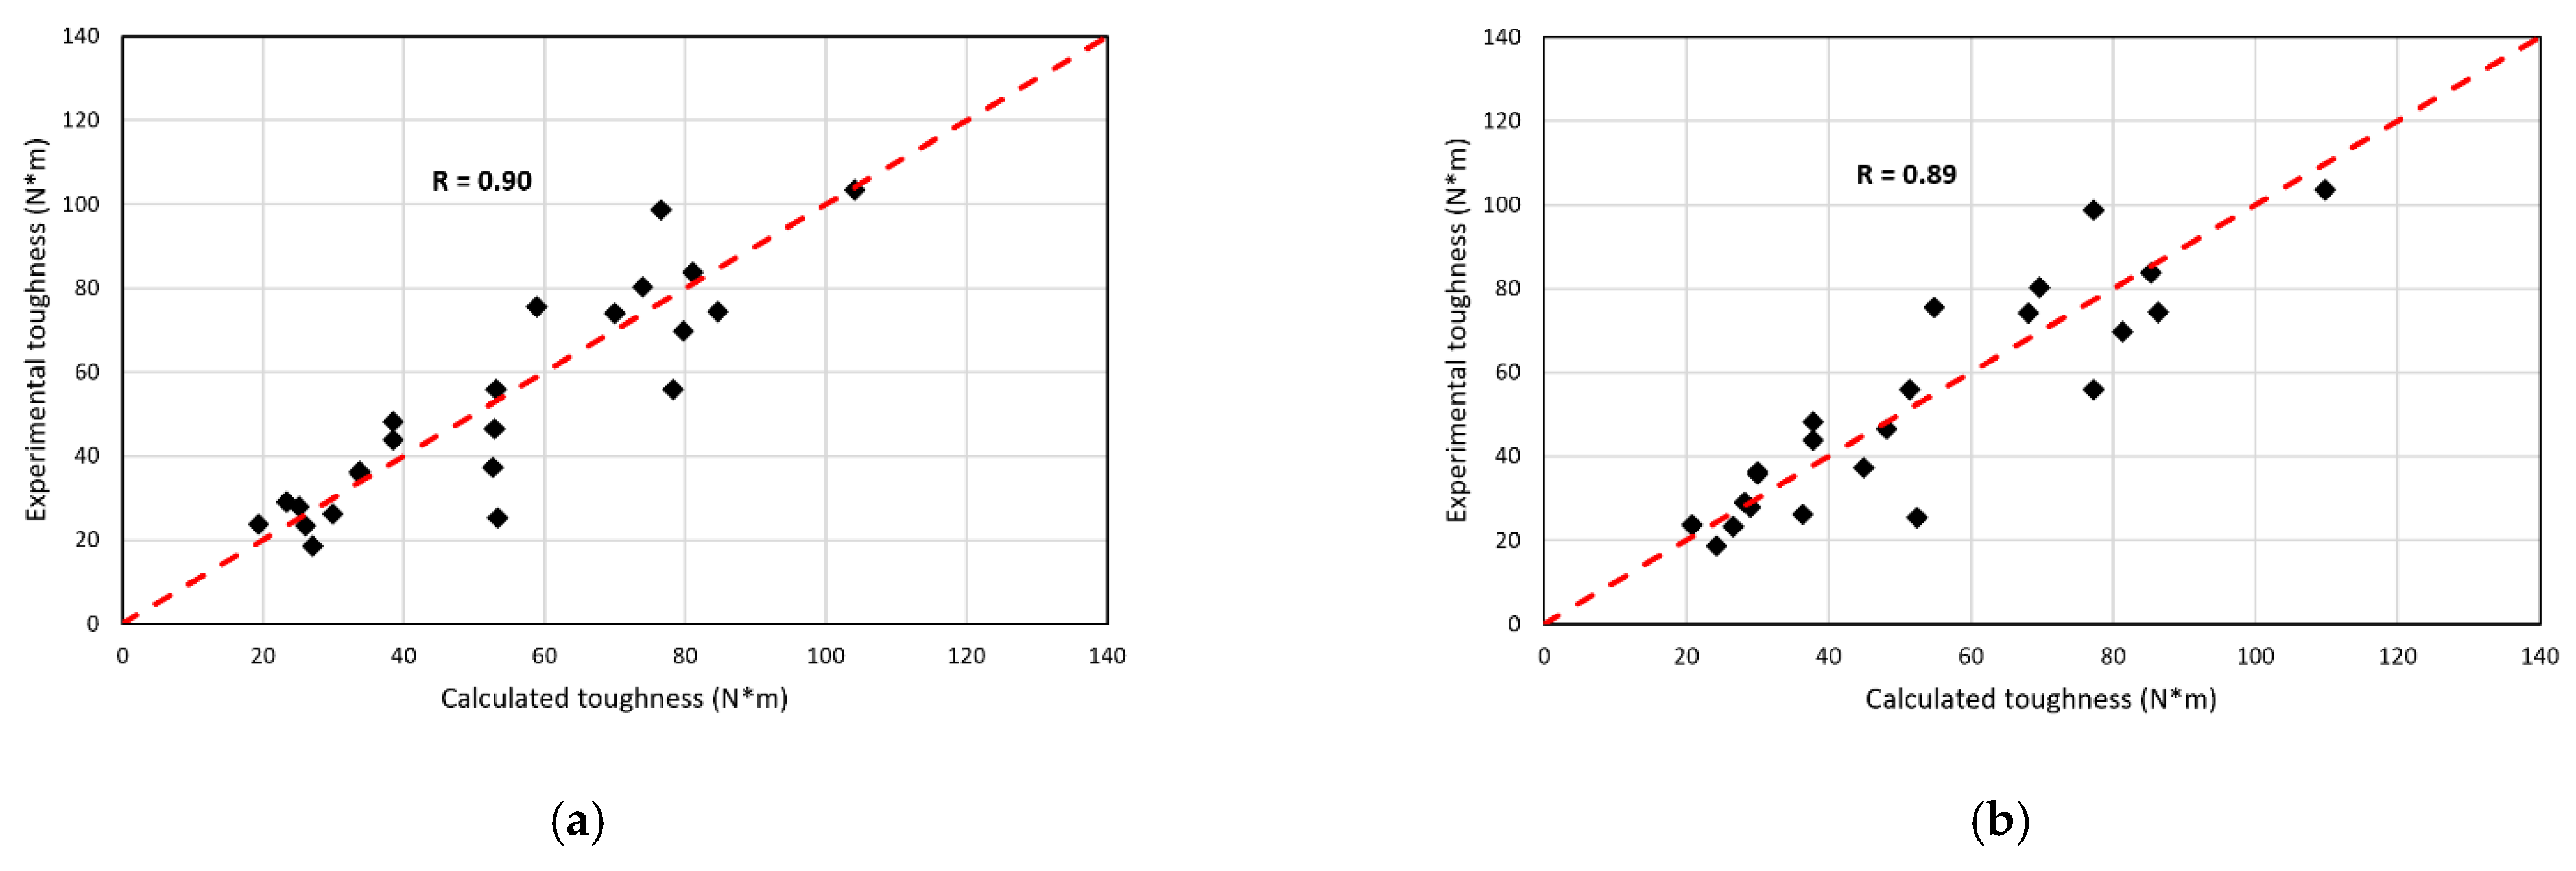
- From the data of the present investigation and other investigations, a multivariable nonlinear equation (Equation (12)) has been developed to determine the toughness of concrete according to volume, slenderness, and fiber modulus of elasticity. This equation presents a correlation coefficient of 0.89, which is considered strong. From this equation, it was possible to determine that the participation of the modulus of elasticity on the toughness is 26%, on the fiber volume squared is 39%, on the slenderness is 19% and on the reinforcement index is 16%.
Author Contributions
Funding
Data Availability Statement
Acknowledgments
Conflicts of Interest
Abbreviations
| L | fiber length (mm) |
| d | fiber diameter (mm) |
| L/d | slenderness (−) |
| fiber volume (%) | |
| RI | reinforcing index () |
| T | toughness calculated at 3 mm deflection (N * m) |
| residual resistance equivalent (MPa) | |
| residual resistance measured at 3 mm deflection (N * m) | |
| flexural tensile strength (MPa) | |
| deflection related to cracking load (mm) | |
| elastic strain energy (N * m) | |
| b | beam type specimen base (m) |
| d | beam type specimen height (m) |
| average compressive strength (MPa) | |
| E | modulus of elasticity of concrete (GPa) |
| modulus of elasticity of fibers (GPa) | |
| COV | coefficient of variation (%) |
| MV | moderator variable |
| IV | independent variable |
| DV | dependent variable |
| R2 | coefficient of determination |
| R | correlation coefficient |
| p | p-value |
References
- Nili, M.; Afroughsabet, V. The Effects of Silica Fume and Polypropylene Fibers on the Impact Resistance and Mechanical Properties of Concrete. Constr. Build. Mater. 2010, 24, 927–933. [Google Scholar] [CrossRef]
- Farnam, Y.; Mohammadi, S.; Shekarchi, M. Experimental and Numerical Investigations of Low Velocity Impact Behavior of High-Performance Fiber-Reinforced Cement Based Composite. Int. J. Impact Eng. 2010, 37, 220–229. [Google Scholar] [CrossRef]
- Afroughsabet, V.; Ozbakkaloglu, T. Mechanical and Durability Properties of High-Strength Concrete Containing Steel and Polypropylene Fibers. Constr. Build. Mater. 2015, 94, 73–82. [Google Scholar] [CrossRef]
- Behnood, A.; Ghandehari, M. Comparison of Compressive and Splitting Tensile Strength of High-Strength Concrete with and without Polypropylene Fibers Heated to High Temperatures. Fire Saf. J. 2009, 44, 1015–1022. [Google Scholar] [CrossRef]
- LaHucik, J.; Dahal, S.; Roesler, J.; Amirkhanian, A.N. Mechanical Properties of Roller-Compacted Concrete with Macro-Fibers. Constr. Build. Mater. 2017, 135, 440–446. [Google Scholar] [CrossRef]
- ASTM International ASTM C1609/C1609M-19; Standard Test Method for Flexural Performance of Fiber-Reinforced Concrete (Using Beam with Third-Point Loading). ASTM Special Technical Publication: West Conshohocken, PA, USA, 2019.
- Villalobos, F.; Paniagua Murillo, K.J. Evaluación de Una Modificación En La Norma ASTM C1609 Para El Estudio de Concreto Reforzado Con Fibras Sintéticas Sometido a Flexión. Métodos Y Mater. 2020, 10, 1–11. [Google Scholar] [CrossRef]
- Seabrook, P.T.; Balck, L.F.; Bawa, K.S.; Bortz, S.A.; Chynoweth, G.L.; Crom, T.R.; Dikeou, J.T.; Drudy, W.A.; Fredericks, J.C.; Glassgold, I.L.; et al. State-of-the-Art Report on Fiber Reinforced Shotcrete. Concr. Int. 1984, 6, 15–27. [Google Scholar]
- BS EN 14651+A1 BS EN 14651+A1; Test Method for Metallic Fibre Concrete—Measuring the Flexural Tensile Strength (Limit of Proportionality (LOP), Residual). British Standards Institution (BSI): London, UK, 2008.
- Labib, W.A. Fibre Reinforced Cement Composites. In Cement Based Materials; InTech: London, UK, 2018. [Google Scholar]
- Conforti, A.; Minelli, F.; Plizzari, G.A.; Tiberti, G. Comparing Test Methods for the Mechanical Characterization of Fiber Reinforced Concrete. Struct. Concr. 2018, 19, 656–669. [Google Scholar] [CrossRef]
- Ahmed, T.W.; Ali, A.A.M.; Zidan, R.S. Properties of High Strength Polypropylene Fiber Concrete Containing Recycled Aggregate. Constr. Build. Mater. 2020, 241, 118010. [Google Scholar] [CrossRef]
- Zheng, Z.; Feldman, D. Synthetic Fibre-Reinforced Concrete. Prog. Polym. Sci. 1995, 20, 185–210. [Google Scholar] [CrossRef]
- Manfredi, R.P.; de Andrade Silva, F. Test Methods for the Characterization of Polypropylene Fiber Reinforced Concrete: A Comparative Analysis. KSCE J. Civ. Eng. 2020, 24, 856–866. [Google Scholar] [CrossRef]
- Yao, Z.; Li, X.; Fu, C.; Xue, W. Mechanical Properties of Polypropylene Macrofiber-Reinforced Concrete. Adv. Mater. Sci. Eng. 2019, 2019, 7590214. [Google Scholar] [CrossRef]
- Sivakumar, A.; Santhanam, M. Mechanical Properties of High Strength Concrete Reinforced with Metallic and Non-Metallic Fibres. Cem. Concr. Compos. 2007, 29, 603–608. [Google Scholar] [CrossRef]
- Bentur, A.; Mindess, S. Fibre Reinforced Cementitious Composites, 2nd ed.; Taylor & Francis: London, UK; CRC Press: Boca Raton, FL, USA, 2006. [Google Scholar]
- Su, A.; Cai, Y. Influence of Aspect Ratio of Macro Synthetic Fiber on Mechanical Properties of Shotcrete. Adv. Mat. Res. 2013, 652–654, 1226–1232. [Google Scholar] [CrossRef]
- Dopko, M.; Najimi, M.; Shafei, B.; Wang, X.; Taylor, P.; Phares, B.M. Flexural Performance Evaluation of Fiber-Reinforced Concrete Incorporating Multiple Macro-Synthetic Fibers. Transp. Res. Rec. 2018, 2672, 1–12. [Google Scholar] [CrossRef]
- Portella, J. La Influencia de Fibras Sintéticas En Las Propiedades de Hormigones Frescos. Rev. Ing. De Construcción 2005, 20, 156–160. [Google Scholar]
- Singh, N.K.; Rai, B. A Review of Fiber Synergy in Hybrid Fiber Reinforced Concrete. J. Appl. Eng. Sci. 2018, 8, 41–50. [Google Scholar] [CrossRef]
- Choi, S.Y.; Park, J.S.; Jung, W.T. A Study on the Shrinkage Control of Fiber Reinforced Concrete Pavement. Procedia. Eng. 2011, 14, 2815–2822. [Google Scholar] [CrossRef]
- Bermudez, M.; Wen, K.-W.; Hung, C.-C. A Comparative Study on the Shear Behavior of UHPC Beams with Macro Hooked-End Steel Fibers and PVA Fibers. Materials 2022, 15, 1485. [Google Scholar] [CrossRef]
- Chajec, A.; Sadowski, L. The Effect of Steel and Polypropylene Fibers on the Properties of Horizontally Formed Concrete. Materials 2020, 13, 5827. [Google Scholar] [CrossRef]
- Li, J.; Niu, J.; Wan, C.; Liu, X.; Jin, Z. Comparison of Flexural Property between High Performance Polypropylene Fiber Reinforced Lightweight Aggregate Concrete and Steel Fiber Reinforced Lightweight Aggregate Concrete. Constr. Build. Mater. 2017, 157, 729–736. [Google Scholar] [CrossRef]
- Rui, Y.; Kangning, L.; Tianyi, Y.; Liwen, T.; Mengxi, D.; Zhonghe, S. Comparative Study on the Effect of Steel and Polyoxymethylene Fibers on the Characteristics of Ultra-High Performance Concrete (UHPC). Cem. Concr. Compos. 2022, 127, 104418. [Google Scholar] [CrossRef]
- Del Savio, A.A.; la Torre Esquivel, D.; Cedrón, J.P. Experimental Volume Incidence Study and the Relationship of Polypropylene Macrofiber Slenderness to the Mechanical Strengths of Fiber-Reinforced Concretes. Appl. Sci. 2022, 12, 9126. [Google Scholar] [CrossRef]
- Abousnina, R.; Premasiri, S.; Anise, V.; Lokuge, W.; Vimonsatit, V.; Ferdous, W.; Alajarmeh, O. Mechanical Properties of Macro Polypropylene Fibre-Reinforced Concrete. Polymers 2021, 13, 4112. [Google Scholar] [CrossRef]
- Karihaloo, B.L.; Nallathambi, P. An Improved Effective Crack Model for the Determination of Fracture Toughness of Concrete. Cem. Concr. Res. 1989, 19, 603–610. [Google Scholar] [CrossRef]
- Karihaloo, B.L.; Nallathambi, P. Effective Crack Model for the Determination of Fracture Toughness (KIce) of Concrete. Eng. Fract. Mech. 1990, 35, 637–645. [Google Scholar] [CrossRef]
- Yap, S.P.; Bu, C.H.; Alengaram, U.J.; Mo, K.H.; Jumaat, M.Z. Flexural Toughness Characteristics of Steel—Polypropylene Hybrid Fibre—Reinforced Oil Palm Shell Concrete. Mater. Des. 2014, 57, 652–659. [Google Scholar] [CrossRef]
- Wu, Z.; Yang, S.; Hu, X.; Zheng, J. An Analytical Model to Predict the Effective Fracture Toughness of Concrete for Three-Point Bending Notched Beams. Eng. Fract. Mech. 2006, 73, 2166–2191. [Google Scholar] [CrossRef]
- Wang, Y.; Hu, X.; Liang, L.; Zhu, W. Determination of Tensile Strength and Fracture Toughness of Concrete Using Notched 3-p-b Specimens. Eng. Fract. Mech. 2016, 160, 67–77. [Google Scholar] [CrossRef]
- Yao, X.; Li, L.; Guan, J.; Zhang, M.; Liu, Z.; Han, R.; He, S. Initial Cracking Strength and Initial Fracture Toughness from Three-point Bending and Wedge Splitting Concrete Specimens. Fatigue Fract. Eng. Mater. Struct. 2021, 44, 601–621. [Google Scholar] [CrossRef]
- Ramadoss, P. Modeling for the Evaluation of Strength and Toughness of High-Performance Fiber Reinforced Concrete. J. Eng. Sci. Technol. 2022, 7, 280–291. [Google Scholar]
- ASTM International ASTM C150/C150M; Standard Specification for Portland Cement. ASTM Special Technical Publication: West Conshohocken, PA, USA, 2022.
- ASTM International ASTM C33; Standard Specification for Concrete Aggregates. ASTM Special Technical Publication: West Conshohocken, PA, USA, 1999.
- ASTM International ASTM C494; Standard Specification for Chemical Admixtures for Concrete. ASTM Special Technical Publication: West Conshohocken, PA, USA, 2008.
- ACI Committee 211; Standard Practice for Selecting Proportions for Normal, Heavyweight, and Mass Concrete. American Concrete Institute: Detroit, MI, USA, 1991.
- ASTM International ASTM C143; Standard Test Method for Slump of Hydraulic-Cement Concrete. ASTM Special Technical Publication: West Conshohocken, PA, USA, 2015.
- ASTM International ASTM C39; Standard Test Method for Compressive Strength of Cylindrical Concrete Specimens. ASTM Special Technical Publication: West Conshohocken, PA, USA, 2020.
- ASTM International ASTM C469; Standard Test Method for Static Modulus of Elasticity and Poisson’s Ratio of Concrete in Compression. ASTM Special Technical Publication: West Conshohocken, PA, USA, 2014; pp. 1–5.
- Del Savio, A.A.; la Torre Esquivel, D.; Carrillo, J.; Chi Yep, E.C. Determination of Polypropylene Fiber-Reinforced Concrete Compressive Strength and Elasticity Modulus via Ultrasonic Pulse Tests. Appl. Sci. 2022, 12, 10375. [Google Scholar] [CrossRef]
- Akça, K.I.R.; Çakir, Ö.; Ipek, M. Properties of Polypropylene Fiber Reinforced Concrete Using Recycled Aggregates. Constr. Build. Mater. 2015, 98, 620–630. [Google Scholar] [CrossRef]
- Altoubat, S.; Yazdanbakhsh, A.; Rieder, K.A. Shear Behavior of Macro-Synthetic Fiber-Reinforced Concrete Beams without Stirrups. ACI Mater. J. 2009, 106, 381–389. [Google Scholar] [CrossRef]
- Ding, Y.; Li, D.; Zhang, Y.; Azevedo, C. Experimental Investigation on the Composite Effect of Steel Rebars and Macro Fibers on the Impact Behavior of High Performance Self-Compacting Concrete. Constr. Build. Mater. 2017, 136, 495–505. [Google Scholar] [CrossRef]
- Kazmi, S.M.S.; Munir, M.J.; Wu, Y.F.; Patnaikuni, I. Effect of Macro-Synthetic Fibers on the Fracture Energy and Mechanical Behavior of Recycled Aggregate Concrete. Constr. Build. Mater. 2018, 189, 857–868. [Google Scholar] [CrossRef]
- Mazzoli, A.; Monosi, S.; Plescia, E.S. Evaluation of the Early-Age-Shrinkage of Fiber Reinforced Concrete (FRC) Using Image Analysis Methods. Constr. Build. Mater. 2015, 101, 596–601. [Google Scholar] [CrossRef]
- Song, H.; Ding, Y. Investigation on the Spatial Distribution of Steel Fiber in Concrete Matrix Using Barcelona Test. J. Build. Mater. 2016, 19, 832–836. [Google Scholar] [CrossRef]
- Wan Ibrahim, M.H.; Mangi, S.A.; Burhanudin, M.K.; Ridzuan, M.B.; Jamaluddin, N.; Shahidan, S.; Wong, Y.H.; Faisal, S.K.; Fadzil, M.A.; Ramadhansyah, P.J.; et al. Compressive and Flexural Strength of Concrete Containing Palm Oil Biomass Clinker and Polypropylene Fibres. IOP Conf. Ser. Mater. Sci. Eng. 2017, 271, 012011. [Google Scholar] [CrossRef]
- Simão, L.; de, C.R.; Nogueira, A.B.; Monte, R.; Salvador, R.P.; de Figueiredo, A.D. Influence of the Instability of the Double Punch Test on the Post-Crack Response of Fiber-Reinforced Concrete. Constr. Build. Mater. 2019, 217, 185–192. [Google Scholar] [CrossRef]
- de Alencar Monteiro, V.M.; de Andrade Silva, F. The Use of the Barcelona Test as Quality Control of Fiber Reinforced Shotcrete for Underground Mining. Constr. Build. Mater. 2020, 262, 120719. [Google Scholar] [CrossRef]
- Yin, S.; Tuladhar, R.; Shi, F.; Combe, M.; Collister, T.; Sivakugan, N. Use of Macro Plastic Fibres in Concrete: A Review. Constr. Build. Mater. 2015, 93, 180–188. [Google Scholar] [CrossRef]
- Kayali, O.; Haque, M.N.; Zhu, B. Some Characteristics of High Strength Fiber Reinforced Lightweight Aggregate Concrete. Cem. Concr. Compos. 2003, 25, 207–213. [Google Scholar] [CrossRef]
- Mulheron, M.; Kevern, J.T.; Rupnow, T.D. Laboratory Fatigue and Toughness Evaluation of Fiber-Reinforced Concrete. Transp. Res. Rec. 2015, 2508, 39–47. [Google Scholar] [CrossRef]
- Noushini, A.; Hastings, M.; Castel, A.; Aslani, F. Mechanical and Flexural Performance of Synthetic Fibre Reinforced Geopolymer Concrete. Constr. Build. Mater. 2018, 186, 454–475. [Google Scholar] [CrossRef]
- Frank, H.P. Book review: Fibre Cements and Fibre Concretes; Hannant, D.J., Ed.; Wiley-Interscience: New York, NY, USA, 1978; pp. 219. J. Polym. Sci. Polym. Lett. Ed. 1979, 17, 464–465. [Google Scholar] [CrossRef]
- Carrillo, J.; Torres, D.; Guerrero, H. Correlation between Results Obtained from Four-Point Bending Tests (4PBT) and Double Punch Tests (DPT) in Concrete Reinforced with Hooked-End Steel Fibers. Eng. Struct. 2021, 239, 112353. [Google Scholar] [CrossRef]
- Foti, D. Preliminary Analysis of Concrete Reinforced with Waste Bottles PET Fibers. Constr. Build. Mater. 2011, 25, 1906–1915. [Google Scholar] [CrossRef]
- Małek, M.; Jackowski, M.; Łasica, W.; Kadela, M. Characteristics of Recycled Polypropylene Fibers as an Addition to Concrete Fabrication Based on Portland Cement. Materials 2020, 13, 1827. [Google Scholar] [CrossRef]
- Gao, D.; Zhang, L. Flexural Performance and Evaluation Method of Steel Fiber Reinforced Recycled Coarse Aggregate Concrete. Constr. Build. Mater. 2018, 159, 126–136. [Google Scholar] [CrossRef]
- Molins, C.; Aguado, A.; Saludes, S. Double Punch Test to Control the Energy Dissipation in Tension of FRC (Barcelona Test). Mater. Struct. Mater. Et Constr. 2009, 42, 415–425. [Google Scholar] [CrossRef]
- Carmona, S.; Molins, C. Use of BCN test for controlling tension capacity of fiber reinforced shotcrete in mining works. Constr. Build. Mater. 2019, 198, 399–410. [Google Scholar] [CrossRef]


| Property | Unit | Fine Aggregate | Coarse Aggregate |
|---|---|---|---|
| Maximum diameter | mm | 9.52 | 38.1 |
| Nominal maximum diameter | mm | 4.76 | 25.4 |
| Fineness modulus | – | 2.95 | 7.41 |
| Specific weight of dry mass | g/cm3 | 2.66 | 2.69 |
| Specific weight of mass SSD | g/cm3 | 2.69 | 2.72 |
| Specific weight of bulk mass | g/cm3 | 2.73 | 2.78 |
| Absorption | Percent | 1.06 | 1.15 |
| Loose unit weight | kg/m3 | 1716.46 | 1465.82 |
| Compacted unit weight | kg/m3 | 1969.75 | 1610.22 |
| Type | Water | Cement | Fine Aggregate | Coarse Aggregate | Water Reducer | PP Fibres 40 mm | PP Fibres 50 mm | PP Fibres 60 mm |
|---|---|---|---|---|---|---|---|---|
| Pattern | 226.6 | 502.8 | 721.1 | 891.2 | 7.1 | – | – | – |
| D:0.4–40 | 226.6 | 502.8 | 721.1 | 891.2 | 7.1 | 3.6 | – | – |
| D:0.8–40 | 226.6 | 502.8 | 721.1 | 891.2 | 7.1 | 7.2 | – | – |
| D:1.2–40 | 226.6 | 502.8 | 721.1 | 891.2 | 7.1 | 10.8 | – | – |
| D:0.4–50 | 226.6 | 502.8 | 721.1 | 891.2 | 7.1 | – | 3.6 | – |
| D:0.8–50 | 226.6 | 502.8 | 721.1 | 891.2 | 7.1 | – | 7.2 | – |
| D:1.2–50 | 226.6 | 502.8 | 721.1 | 891.2 | 7.1 | – | 10.8 | – |
| D:0.4–60 | 226.6 | 502.8 | 721.1 | 891.2 | 7.1 | – | – | 3.6 |
| D:0.8–60 | 226.6 | 502.8 | 721.1 | 891.2 | 7.1 | – | – | 7.2 |
| D:1.2–60 | 226.6 | 502.8 | 721.1 | 891.2 | 7.1 | – | – | 10.8 |
| Batch | RI | Slump (mm) | Density (kg/m3) | E (GPa) | |
|---|---|---|---|---|---|
| Reference | 0.0 | 240 | 2254.7 | 42.16 | 29.94 |
| D:0.4–40 | 18.4 | 210 | 2229.2 | 41.17 | 30.66 |
| D:0.8–40 | 36.8 | 175 | 2268.9 | 42.89 | 29.95 |
| D:1.2–40 | 55.2 | 95 | 2268.9 | 39.56 | 33.20 |
| D:0.4–50 | 23.2 | 210 | 2322.8 | 39.64 | 29.03 |
| D:0.8–50 | 46.4 | 70 | 2331.3 | 41.20 | 31.14 |
| D:1.2–50 | 69.6 | 46 | 2243.4 | 42.90 | 29.09 |
| D:0.4–60 | 28.0 | 140 | 2283.1 | 42.56 | 30.28 |
| D:0.8–60 | 56.0 | 125 | 2296.3 | 40.98 | 29.16 |
| D:1.2–60 | 84.0 | 111 | 2263.2 | 43.60 | 29.75 |
| Batch | (%) | l/d (−) | RI | f’c (MPa) | COV (%) | (Mpa) | COV (%) | (mm) | COV (%) | COV (%) | COV (%) | (Mpa) | COV (%) | ||
|---|---|---|---|---|---|---|---|---|---|---|---|---|---|---|---|
| Reference | 0.0 | 0.0 | 0.0 | 42.16 | 4.71 | 5.63 | 16.43 | 0.07 | 10.53 | 1.43 | 19.35 | 1.72 | 13.98% | 0 | 0.83% |
| D:0.4–40 | 0.4 | 46.5 | 18.6 | 41.17 | 3.03 | 5.89 | 18.68 | 0.06 | 19.80 | 1.69 | 26.86 | 18.130 | 21.13% | 0.65 | 16.12% |
| D:0.8–40 | 0.8 | 46.5 | 37.2 | 39.64 | 4.11 | 6.71 | 9.63 | 0.08 | 32.45 | 2.20 | 12.61 | 40.220 | 40.39% | 1.65 | 47.16% |
| D:1.2–40 | 1.2 | 46.5 | 55.8 | 42.56 | 1.19 | 6.45 | 9.23 | 0.08 | 29.04 | 2.18 | 14.11 | 69.360 | 18.15% | 2.69 | 27.99% |
| D:0.4–50 | 0.4 | 58.1 | 23.3 | 42.89 | 4.29 | 5.80 | 13.77 | 0.08 | 37.61 | 1.73 | 20.54 | 28.400 | 12.64% | 1.16 | 8.95% |
| D:0.8–50 | 0.8 | 58.1 | 46.5 | 41.20 | 7.43 | 7.24 | 7.42 | 0.08 | 25.57 | 2.16 | 18.28 | 56.230 | 27.55% | 2.36 | 26.27% |
| D:1.2–50 | 1.2 | 58.1 | 69.8 | 40.98 | 8.55 | 5.50 | 15.52 | 0.07 | 31.41 | 1.54 | 36.37 | 77.710 | 18.19% | 2.94 | 26.59% |
| D:0.4–60 | 0.4 | 69.8 | 27.9 | 39.56 | 2.56 | 5.89 | 10.95 | 0.06 | 49.29 | 1.43 | 44.30 | 37.160 | 23.96% | 1.54 | 30.50% |
| D:0.8–60 | 0.8 | 69.8 | 55.8 | 42.90 | 3.60 | 5.47 | 7.37 | 0.06 | 18.33 | 1.41 | 13.76 | 47.840 | 14.13% | 1.90 | 15.42% |
| D:1.2–60 | 1.2 | 69.8 | 83.7 | 43.60 | 18.75 | 5.20 | 11.74 | 0.06 | 16.09 | 1.46 | 23.32 | 71.740 | 19.91% | 2.99 | 24.78% |
| Item | MV | IV | DV | R2 | R | p | Null Hypothesis |
|---|---|---|---|---|---|---|---|
| 1 | L/d = 47 | ft | 73.07% | 85.48% | 0.145 | no rejection | |
| 2 | L/d = 58 | ft | 2.74% | 16.55% | 0.834 | no rejection | |
| 3 | L/d = 70 | ft | 49.80% | 70.57% | 0.294 | no rejection | |
| 4 | = 0.4% | L/d | ft | 0.00% | 0.00% | 0.998 | no rejection |
| 5 | = 0.8% | L/d | ft | 46.71% | 68.34% | 0.521 | no rejection |
| 6 | = 1.2% | L/d | ft | 91.75% | 95.79% | 0.188 | no rejection |
| 7 | – | RI | ft | 2.55% | 15.97% | 0.660 | no rejection |
| 8 | L/d = 47 | 51.16% | 71.53% | 0.285 | no rejection | ||
| 9 | L/d = 58 | 0.03% | 1.73% | 0.983 | no rejection | ||
| 10 | L/d = 70 | 59.96% | 74.34% | 0.226 | no rejection | ||
| 11 | = 0.4% | L/d | 1.53% | 12.37% | 0.921 | no rejection | |
| 12 | = 0.8% | L/d | 75.00% | 86.60% | 0.333 | no rejection | |
| 13 | = 1.2% | L/d | 98.38% | 99.19% | 0.081 | rejected | |
| 14 | – | RI | 0.77% | 8.77% | 0.810 | no rejection | |
| 15 | L/d = 47 | 88.39% | 94.02% | 0.060 | rejected | ||
| 16 | L/d = 58 | 9.67% | 31.10% | 0.689 | no rejection | ||
| 17 | L/d = 70 | 61.89% | 78.67% | 0.213 | no rejection | ||
| 18 | = 0.4% | L/d | 63.97% | 79.98% | 0.410 | no rejection | |
| 19 | = 0.8% | L/d | 78.42% | 88.56% | 0.308 | no rejection | |
| 20 | = 1.2% | L/d | 83.35% | 91.30% | 0.268 | no rejection | |
| 21 | – | RI | 0.16% | 4.00% | 0.914 | no rejection |
| Item | MV | IV | DV | R2 | R | p | Null Hypothesis |
|---|---|---|---|---|---|---|---|
| 1 | L/d = 47 | T | 98.42% | 99.21% | 0.008 | rejected | |
| 2 | L/d = 58 | T | 99.71% | 99.85% | 0.001 | rejected | |
| 3 | L/d = 70 | T | 95.85% | 97.90% | 0.021 | rejected | |
| 4 | = 0.4% | L/d | T | 95.19% | 97.57% | 0.024 | rejected |
| 5 | = 0.8% | L/d | T | 91.20% | 95.50% | 0.045 | rejected |
| 6 | = 1.2% | L/d | T | 91.09% | 95.44% | 0.046 | rejected |
| 7 | – | RI | T | 89.99% | 94.86% | 0.000 | rejected |
| 8 | L/d = 47 | 98.49% | 99.24% | 0.008 | rejected | ||
| 9 | L/d = 58 | 98.13% | 99.06% | 0.009 | rejected | ||
| 10 | L/d = 70 | 95.29% | 97.62% | 0.024 | rejected | ||
| 11 | = 0.4% | L/d | 91.55% | 95.68% | 0.043 | rejected | |
| 12 | = 0.8% | L/d | 88.35% | 93.99% | 0.060 | rejected | |
| 13 | = 1.2% | L/d | 94.76% | 97.34% | 0.027 | rejected | |
| 14 | – | RI | 90.88% | 95.33% | 0.000 | rejected |
| Item | Author | f’c (MPa) | l (mm) | d (mm) | l/d (−) | COV (%) | ||||
|---|---|---|---|---|---|---|---|---|---|---|
| 1 | [11] | 50.00 | 3.5 | 0.33 | 40 | 0.75 | 53.3 | 17.6 | 23.65 | 12.0 |
| 50.00 | 3.5 | 0.55 | 40 | 0.75 | 53.3 | 29.3 | 35.75 | 18.0 | ||
| 50.00 | 6.0 | 0.33 | 54 | 0.81 | 66.7 | 22.0 | 29.00 | 14.0 | ||
| 50.00 | 6.0 | 0.55 | 54 | 0.81 | 66.7 | 36.7 | 43.80 | 18.0 | ||
| 80.00 | 3.5 | 0.55 | 40 | 0.75 | 53.3 | 29.3 | 36.35 | 17.0 | ||
| 80.00 | 3.5 | 1.10 | 40 | 0.75 | 53.3 | 58.7 | 74.05 | 10.0 | ||
| 80.00 | 6.0 | 0.55 | 54 | 0.81 | 66.7 | 36.7 | 48.13 | 13.0 | ||
| 80.00 | 6.0 | 1.10 | 54 | 0.81 | 66.7 | 73.3 | 98.71 | 13.0 | ||
| 2 | [63] | 38.60 | 12.0 | 0.66 | 54 | 0.84 | 64.3 | 42.4 | 75.50 | − |
| 40.90 | 12.0 | 0.88 | 54 | 0.84 | 64.3 | 56.6 | 80.30 | − | ||
| 42.30 | 12.0 | 1.32 | 54 | 0.84 | 64.3 | 84.9 | 103.50 | − | ||
| 3 | [19] | − | 4.7 | 0.50 | 38 | 0.34 | 111.8 | 55.9 | 70.00 | − |
| − | 4.7 | 1.00 | 38 | 0.34 | 111.8 | 111.8 | 78.00 | − | ||
| − | 4.7 | 1.50 | 38 | 0.34 | 111.8 | 167.6 | 113.00 | − | ||
| − | 27.0 | 0.50 | 18 | 0.20 | 90.0 | 45.0 | 108.00 | − | ||
| − | 27.0 | 1.00 | 18 | 0.20 | 90.0 | 90.0 | 145.00 | − | ||
| − | 27.0 | 1.50 | 18 | 0.20 | 90.0 | 135.0 | 275.00 | − | ||
| − | 44.0 | 0.50 | 43 | 0.65 | 66.2 | 33.1 | 177.00 | − | ||
| − | 44.0 | 1.00 | 43 | 0.65 | 66.2 | 66.2 | 255.00 | − | ||
| − | 44.0 | 1.50 | 43 | 0.65 | 66.2 | 99.2 | 300.00 | − | ||
| 4 | [14] | 73.00 | 9.5 | 0.33 | 40 | 0.54 | 74.1 | 24.4 | 26.22 | 35.00 |
| 73.00 | 9.5 | 0.66 | 40 | 0.54 | 74.1 | 48.8 | 25.32 | 9.00 | ||
| 73.00 | 9.5 | 1.10 | 40 | 0.54 | 74.1 | 81.4 | 74.33 | 8.00 |
Disclaimer/Publisher’s Note: The statements, opinions and data contained in all publications are solely those of the individual author(s) and contributor(s) and not of MDPI and/or the editor(s). MDPI and/or the editor(s) disclaim responsibility for any injury to people or property resulting from any ideas, methods, instructions or products referred to in the content. |
© 2023 by the authors. Licensee MDPI, Basel, Switzerland. This article is an open access article distributed under the terms and conditions of the Creative Commons Attribution (CC BY) license (https://creativecommons.org/licenses/by/4.0/).
Share and Cite
Del Savio, A.A.; Esquivel, D.L.T.; de Andrade Silva, F.; Agreda Pastor, J. Influence of Synthetic Fibers on the Flexural Properties of Concrete: Prediction of Toughness as a Function of Volume, Slenderness Ratio and Elastic Modulus of Fibers. Polymers 2023, 15, 909. https://doi.org/10.3390/polym15040909
Del Savio AA, Esquivel DLT, de Andrade Silva F, Agreda Pastor J. Influence of Synthetic Fibers on the Flexural Properties of Concrete: Prediction of Toughness as a Function of Volume, Slenderness Ratio and Elastic Modulus of Fibers. Polymers. 2023; 15(4):909. https://doi.org/10.3390/polym15040909
Chicago/Turabian StyleDel Savio, Alexandre Almeida, Darwin La Torre Esquivel, Flávio de Andrade Silva, and Joaquín Agreda Pastor. 2023. "Influence of Synthetic Fibers on the Flexural Properties of Concrete: Prediction of Toughness as a Function of Volume, Slenderness Ratio and Elastic Modulus of Fibers" Polymers 15, no. 4: 909. https://doi.org/10.3390/polym15040909
APA StyleDel Savio, A. A., Esquivel, D. L. T., de Andrade Silva, F., & Agreda Pastor, J. (2023). Influence of Synthetic Fibers on the Flexural Properties of Concrete: Prediction of Toughness as a Function of Volume, Slenderness Ratio and Elastic Modulus of Fibers. Polymers, 15(4), 909. https://doi.org/10.3390/polym15040909