Article

Polyaniline Composites Containing Eco-Friendly Biomass Carbon from Agricultural-Waste Coconut Husk for Enhancing Gas Sensor Performance in Hydrogen Sulfide Detection

1
Department of Chemistry, Chung Yuan Christian University, Chung Li District‚ Taoyuan City 32023, Taiwan
2
Department of Food Science, National Quemoy University, Jinning Township, Kinmen County 89250, Taiwan
*
Authors to whom correspondence should be addressed.
Polymers 2023, 15(23), 4554; https://doi.org/10.3390/polym15234554
Submission received: 1 November 2023 / Revised: 24 November 2023 / Accepted: 25 November 2023 / Published: 28 November 2023
(This article belongs to the Special Issue Polymer Materials for Sensors)

Abstract

:
Hydrogen sulfide, a colorless, flammable gas with a distinct rotten egg odor, poses severe health risks in industrial settings. Sensing hydrogen sulfide is crucial for safeguarding worker safety and preventing potential accidents. This study investigated the gas-sensing performance of an electroactive polymer (i.e., polyaniline, PANI) and its composites with active carbon (AC) (i.e., PANI-AC1 and PANI-AC3) toward H2S at room temperature. PANI-AC composites-coated IDE gas sensors were fabricated and their capability of detecting H2S at concentrations ranging from 1 ppm to 30 ppm was tested. The superior gas-sensing performance of the PANI-AC composites can be attributed to the increased surface area of the materials, which provided increased active sites for doping processes and enhanced the sensing capability of the composites. Specifically, the incorporation of AC in the PANI matrix resulted in a substantial improvement in the doping process, which led to stronger gas-sensing responses with higher repeatability and higher stability toward H2S compared to the neat PANI-coated IDE sensor. Furthermore, the as-prepared IDE gas sensor exhibited the best sensing response toward H2S at 60% RH. The use of agricultural-waste coconut husk for the synthesis of these high-performance gas-sensing materials promotes sustainable and eco-friendly practices while improving the detection and monitoring of H2S gas in industrial settings.

1. Introduction

Because of insufficient internal air circulation, numerous accidents occur in the oil storage, chemical reaction, and solvent distillation units of modern chemical industries during annual maintenance. Hydrogen sulfide (H2S), a highly hazardous gas used and generated in this industry, poses a significant risk [1,2]. This colorless, corrosive, explosive, and flammable acid gas is highly soluble in water and produces hydrosulfuric acid [3]. The severity of the health effects of H2S varies depending on its concentration. At low concentrations (~1.5 ppm), H2S has a rotten egg odor and can cause chronic symptoms, such as memory loss [4], facial paralysis [5], and nerve tissue damage [6], but is not life-threatening. By contrast, at high concentrations, H2S is extremely dangerous. At concentrations >140 ppm, H2S can paralyze the olfactory system; exposure to H2S concentrations ≥700 ppm can be fatal. Short-term exposure to high levels of H2S can also affect various organs [7]. Therefore, H2S gas sensors with high sensitivity and high selectivity are crucial.
Various semiconducting materials, spanning both inorganic and organic compounds, have been investigated for the advancement of H2S sensors. Notably, inorganic materials like zinc oxide [8], copper oxide [9], tin oxide [10], indium oxide [11], and cobalt ferrite [12] showcase commendable H2S-sensing properties in an operating temperature ranging from 75 °C to 400 °C. However, this temperature range means that inorganic materials are not suitable for ambient working conditions where human protection from H2S gas poisoning is essential [13]. Recent research trends have pivoted towards organic sensors, especially those employing conductive polymers, seeking to mitigate the temperature dependency observed in inorganic analogs [14,15].
Among the diverse conductive polymers explored, polyaniline (PANI) has emerged prominently, lauded for its outstanding environmental stability, reversible redox capacity, and reversible doping capability, setting it apart in the realm of conductive polymers. Significantly, Monkman et al. [16] ushered in a pivotal era in 1995 by introducing the concept of coating a thin PANI film onto an interdigitated electrode (IDE) on a quartz substrate for H2S sensing through a doping mechanism, anchoring the historical significance of PANI in gas sensor development. Furthermore, the utilization of HCl-doped PANI-related materials for ammonia (NH3) sensing through a dedoping mechanism extended the narrative of conductive polymer applications in gas sensing. These contributions add a nuanced layer to the diverse landscape of conductive polymer applications, showcasing the versatility and potential of PANI in H2S and NH3 gas-sensing scenarios. This unique amalgamation of properties positions PANI as a compelling candidate for gas-sensing applications [17,18,19].
As a main source of carbon derivation, sustainable natural materials such as clay minerals [20] and soil minerals [21] have gained global prominence as primary sources for carbon derivation, sparking a surge in applications for renewable energy. Biomass, encompassing organic matter derived from various sources, including agricultural crops [22], forest residues [23], animal wastes [24], and industrial by-products [25], serves as a crucial renewable energy source. Despite biomass being a primary resource distinct from the aforementioned minerals, its utilization has witnessed a recent upswing due to its capacity to mitigate greenhouse gas emissions and foster sustainable development [26,27]. When biomass is pyrolyzed at low temperatures (i.e., 200 °C–300 °C) in the presence of air or nitrogen gas, biochar, with a low porosity and a small specific surface area, is produced [28]. Biomass can be further activated and transformed into nanoporous carbon materials with a large surface area and well-developed porosity, which can be leveraged to enhance the performance of gas sensors [29]. This activation can be achieved through physical or chemical activation methods [30,31]. The physical activation of biochar at high temperatures (i.e., 800 °C–1100 °C) using steam or CO2 is a simple and cost-effective method to produce nanoporous activated carbons (ACs) with specific surface areas in the range of 500–1000 m2/g. Chemical activation can further enhance the specific surface area to >1000 m2/g [32]. The chemical activation process involves impregnating the biomass or biochar with an activating agent, followed by carbonization in an inert atmosphere of nitrogen or argon gas at temperatures ranging from 400 °C to 1000 °C [33]. Activating agents, usually alkali and alkaline earth metal-containing substances and some acids, such as KOH, K2CO3, NaOH, Na2CO3, AlCl3, ZnCl2, MgCl2, H3PO4, and H2SO4, can be used to enhance porosity through the depolymerization and dehydration of biochar [34]. ZnCl2 is a commonly used activating agent that contributes to the creation of a porous structure by acting as a template. ZnCl2 dehydrates and accelerates the decomposition of carbonaceous materials during the carbonization process, restricts the formation of tar, and intercalates in the carbon matrix to create void spaces. The incorporation of biomass-derived materials, such as carbon nanotubes [35] and graphene oxide [36], in gas-sensing materials has been shown to improve the sensitivity, selectivity, and stability of gas sensors, including those sensors used for detecting harmful gases such as H2S [37,38].
Leveraging the favorable properties of PANI and AC, the PANI-AC hybrid composites were prepared by physical mixing of chemically synthesized PANI with biomass carbon. While recent in situ polymerization methods have been applied to synthesize PANI-based carbon material composites [39,40,41], their synergy faces inherent challenges. In such cases, molecular chains of the polymer may hinder filler interconnection, counteracting intended synergies [42]. The nature of in situ polymerization also restricts bulk production. Opting for an alternative, simpler, and cost-effective method like physical mixing not only overcomes these limitations but also enhances the formation of hybrid structures. This approach holds promise for tailoring composites with superior electrical and chemical properties, expanding their applications in gas sensors, particularly for industrial production [43].
In this study, PANI has been incorporated with AC, a natural biomass derived from coconut husks, to fabricate H2S sensors exhibiting a higher response value, great repeatability, and high stability. AC increases the specific surface area of the material, improving its redox capability and substantially enhancing the gas-sensing performance of the resulting sensor. The use of biomass in the sensor used for sensing H2S demonstrates the enormous potential of biomass in improving the performance of existing sensors and developing new sensing materials. The utilization of agricultural waste in the development of sensing materials can also contribute to a highly sustainable and environmentally friendly approach toward agricultural-waste management.

2. Experimental Section

2.1. Chemicals

Aniline (99.5%; Acros Organics, Geel, UK) was distilled at 70 °C under 0.1 atm pressure before use. N-methyl-2-pyrrolidone (NMP; 99%; Duksan, Seoul, Republic of Korea), ammonium persulfate (APS; 97.0%; J.T. Baker, Radnor, PA, USA), methanol (99%; Sigma-Aldrich, Burlington, VT, USA), ZnCl2 (98%; Sigma-Aldrich, Burlington, VT, USA), isopropanol (99.5%; Sigma-Aldrich, Burlington, VT, USA), hydrochloric acid (HCl; 37%; Riedel-de Haen, Seelze, Germany), and ammonium hydroxide (NH4OH; 28%; Riedel-de Haen, Seelze, Germany) were used as received without further purification. All gases used in this study, including H2S, SO2, CO2, NO2, NH3, CO, and air (50 ppm; Chian Hong Gas Co., Ltd., Hong Kong, China), were used as received. An Interdigitated Electrode device (IDE, thickness of 0.375 mm, 12 pairs of electrodes, spacing of 0.3 mm, and length × width of 20 × 20 mm) was fabricated using indium tin oxide (ITO), purchased from Ruilong Optoelectronics in Miaoli, Taiwan, for the gas-sensing study.

2.2. Instruments

A laser engraver (Flux Beambox, Taipei, Taiwan) was employed to carve grooves into the ITO glass to form an ITO-based IDE that resulted in nonconductive open circuits on both sides of the glass. Raman scattering spectra were acquired using a Raman spectrometer (Horiba Jobin Yvon, Traix 320, Palaiseau, France) with a laser source using an excitation wavelength of 640 nm. A Fourier-transform infrared (FTIR) spectrometer (JASCO, FT/IR-4200, Tokyo, Japan) was employed to acquire the FTIR spectra of calcined carbon (CC) and AC at room temperature and for wavelengths ranging from 4000 to 400 cm−1. Moreover, the spectra of PANI and PANI-AC composites were obtained using the attenuated total reflectance mode of FTIR (ATR-FTIR) at room temperature and for wavelengths ranging from 4000 to 600 cm−1. A PFY400 oven (Dengyng Instruments Co., Ltd., Kaohsiung, Taiwan) was utilized for the preparation of CC and AC. Cyclic voltammetry (CV) measurements were conducted using the AutoLab PGSTAT204 (Ω Metrohm Autolab, KM Utrecht, The Netherlands) electrochemical workstation. A four-point probe connected to a voltmeter system with a constant current source (Keithley 2400, Tektronix, Beaverton, OR, USA) was used to evaluate the conductivity of PANI-AC composites and determine the conductivity of the undoped, doped, and de-doped forms of PANI and PANI-AC composites. The morphology and composition of the composites were determined via scanning electron microscopy (SEM; JEOL JSM-7600F, Tokyo, Japan). The N2 adsorption–desorption isotherm at 77K (Brunauer–Emmett–Teller [BET] analysis; Micromeritics ASAP-2010, Norcross, GA, USA) was used to calculate the surface area and pore diameter of samples. Conductivity measurements of the sensors were performed using a four-point probe (LRS4-TK1, KeithLink Technology, Taipei, Taiwan). The fabrication of IDEs was accomplished using a laser engraver (Flux Beambox, Taipei, Taiwan). The H2S-sensing capabilities of all PANI-composite-coated IDE sensors were evaluated using a custom-made sensing device in our laboratory. To measure the sensor response, an electrometer (Keithley 2450 Source Meter, Keithlink Technology, Taipei, Taiwan) was employed. The carrier gas (air) was combined with the target gas from a cylinder and maintained at a fixed concentration of 50 ppm. This gas mixture was subsequently directed through a programmable mass-flow controller (MFC; F-201CB Mass-flow Controller, Bronkhorst, Ruurlo, The Netherlands). The target and carrier gases were simultaneously introduced into the mixing chamber, enabling the generation of different analyte concentrations.

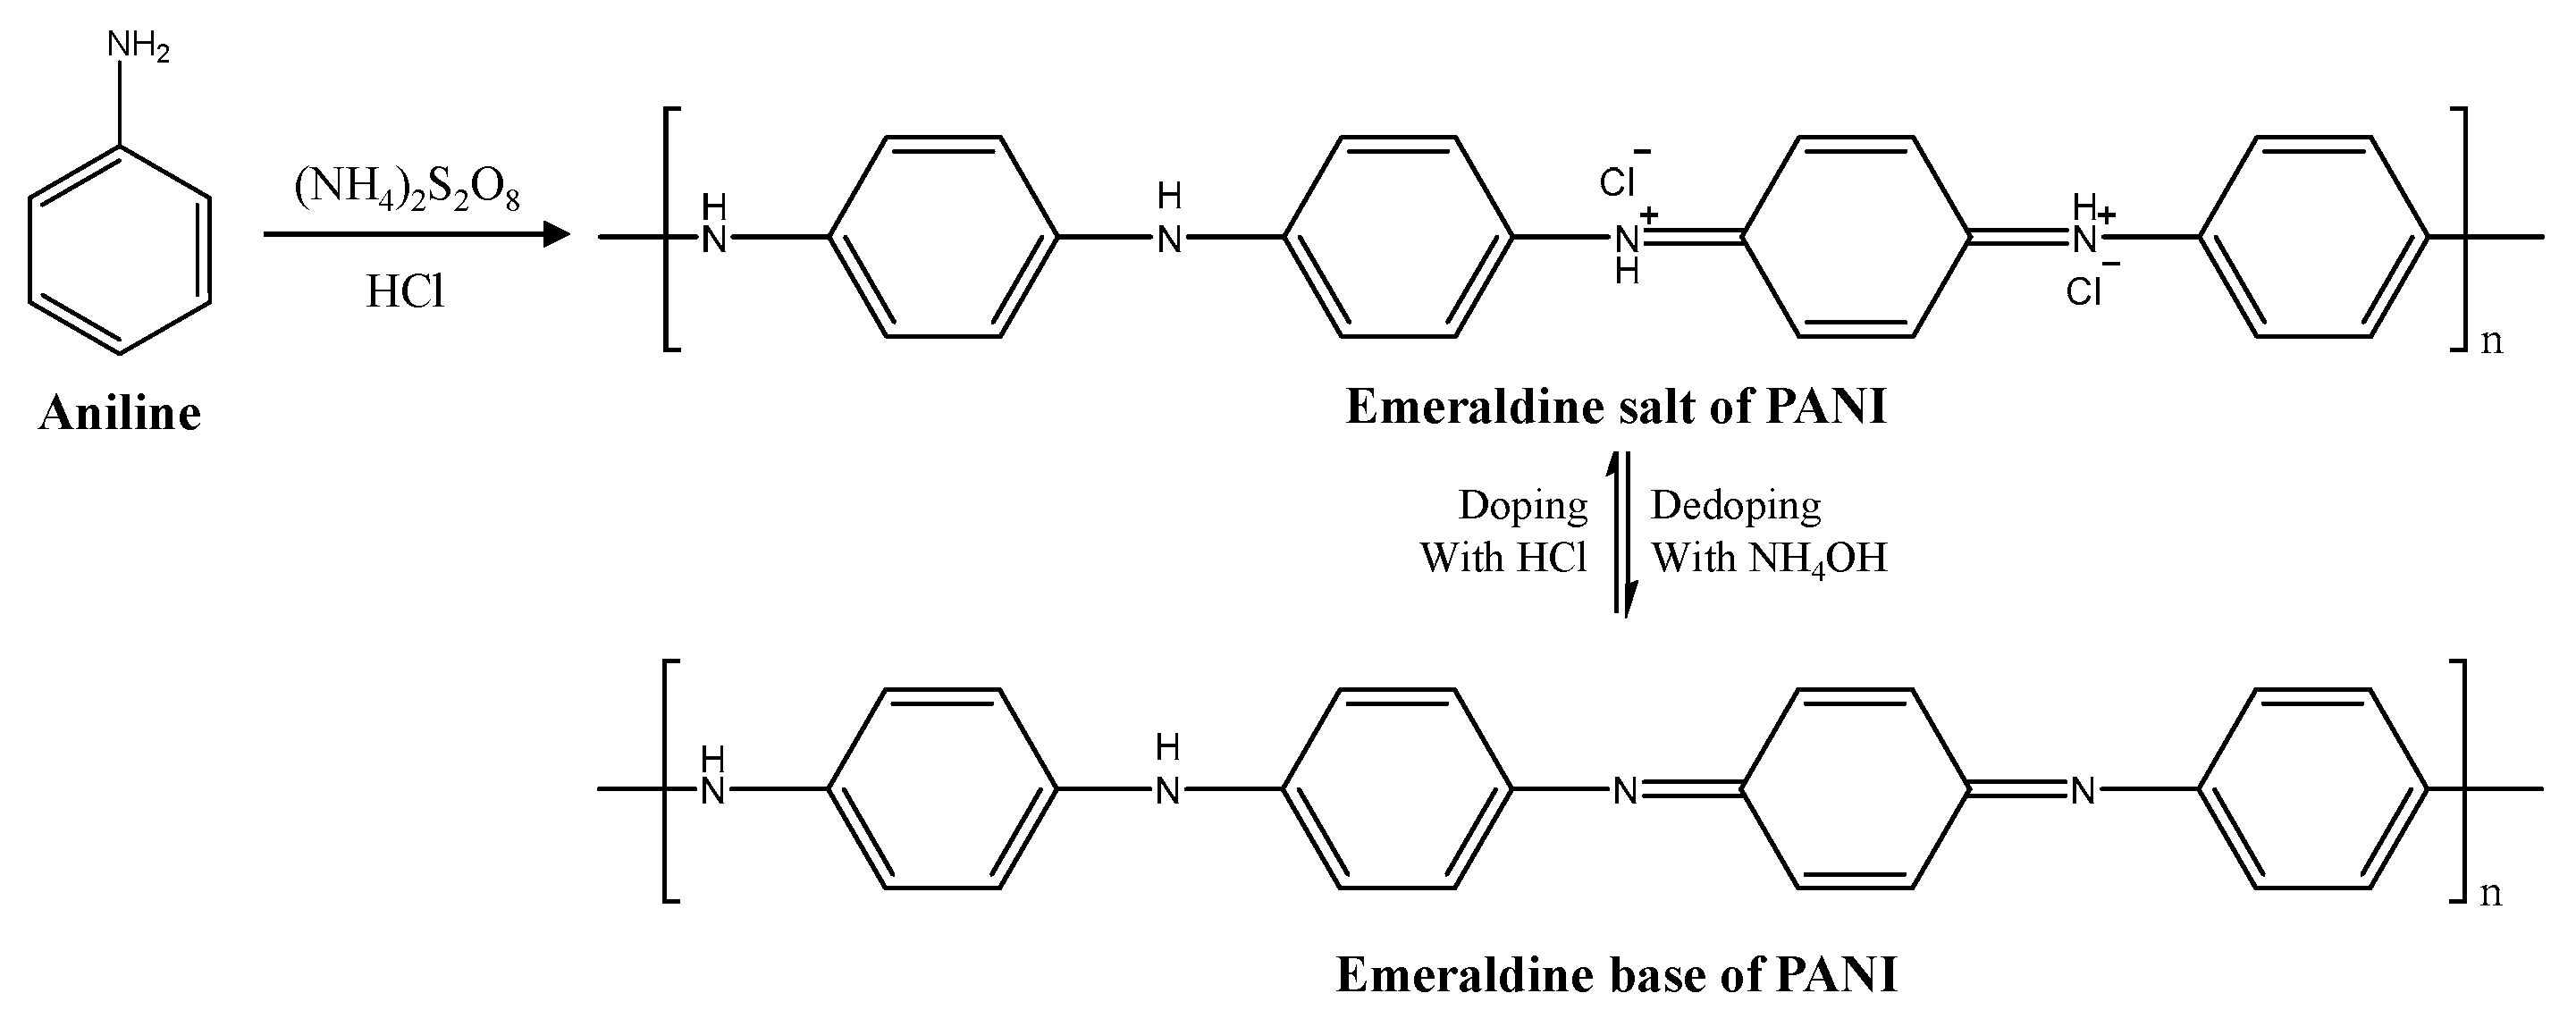
2.3. Synthesis of PANI

PANI was synthesized via oxidation coupling polymerization [44], as shown in Scheme 1. First, 0.1 mol of aniline monomer was dispersed perfectly under magnetic stirring in 400 mL of 1.0 M HCl. Then, 0.025 mol of APS was added to 20 mL of 1.0 M HCl and the resultant solution was stirred in an ice bath for 6 h. This resultant solution was added quickly to the precooled aniline solution, and the resulting mixture was stirred at 10 °C for 24 h to promote polymerization. The precipitate obtained through suction filtration underwent washing with 400 mL of 0.1 M NH4OH, with magnetic stirring maintained for 4 h at room temperature. Subsequently, the mixture was filtered and vacuum-dried for 2 days at 40 °C to yield the final PANI products.

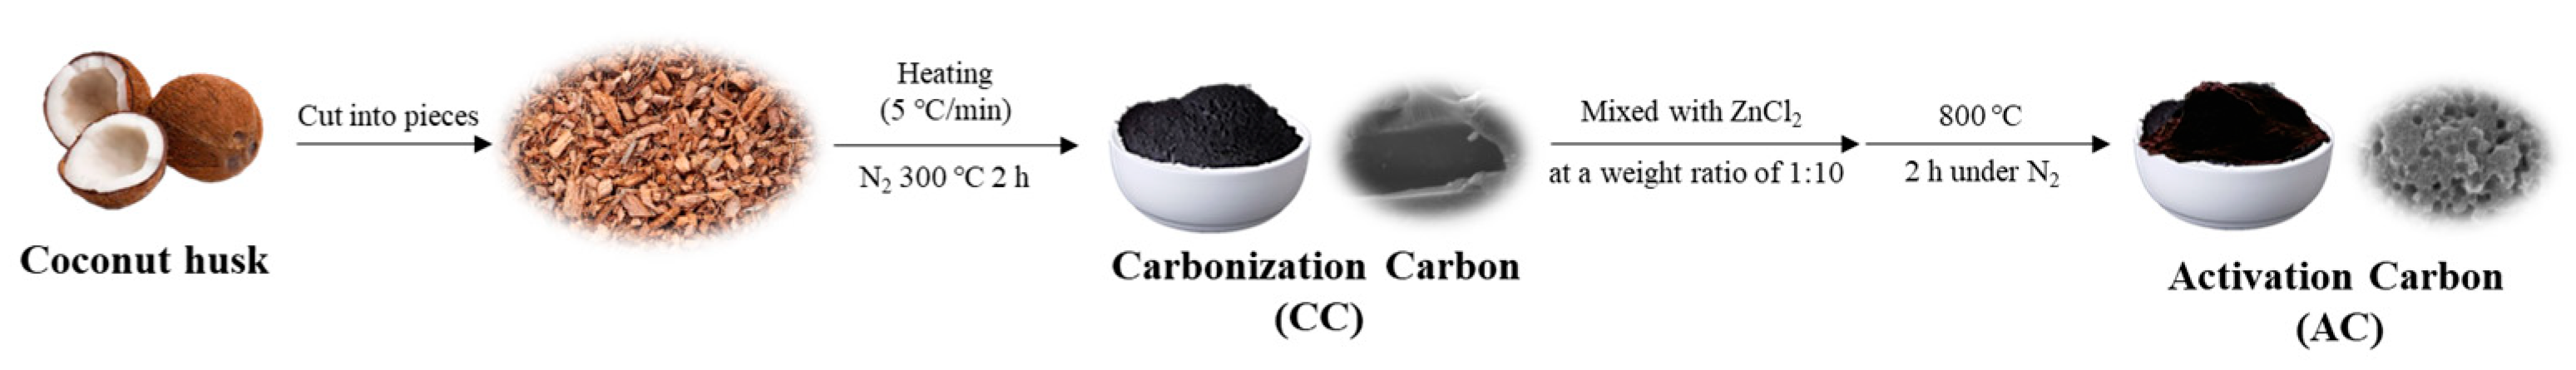
2.4. Preparation of CC and AC Using Agricultural-Waste Coconut Husk

Scheme 2 illustrates the preparation process of CC and AC. Natural biomass waste was initially washed three times with distilled water and subsequently dried at 60 °C overnight in an oven. Then, the dried biomass waste was cut into small pieces and subjected to precarbonization by heating at 300 °C with a heating rate of 5 °C min−1 for 2 h under a N2 atmosphere. The resulting precarbonized biochar was ground and further washed with methanol, ethanol, and distilled water before drying at 80 °C. In the activation step, the precarbonized biochar was mixed with ZnCl2 at a weight ratio of 1:10 and carbonized at 800 °C for 2 h under a N2 flow in a tube furnace. The temperature ramp during carbonization was set to 5 °C min−1. Finally, the synthesized AC was washed with a mixture of water and isopropanol (1:1) and dried under vacuum at 80 °C for 6 h [45].

2.5. Preparation of PANI-AC Composites

A straightforward physical mixing method was employed for the synthesis of PANI composites incorporating coconut-husk-derived AC. Initially, a 1 wt% PANI solution was created by dissolving 1 g of PANI in 9 g of NMP under magnetic stirring at room temperature. Subsequently, different weights of AC (0.01 g, constituting 1% of PANI, and 0.03 g, constituting 3% of PANI) were introduced into the prepared solution, followed by overnight stirring. The resulting composites, labeled as PANI-AC1 and PANI-AC3, were obtained through suction filtration and subjected to a 2-day vacuum-drying process at 40 °C.

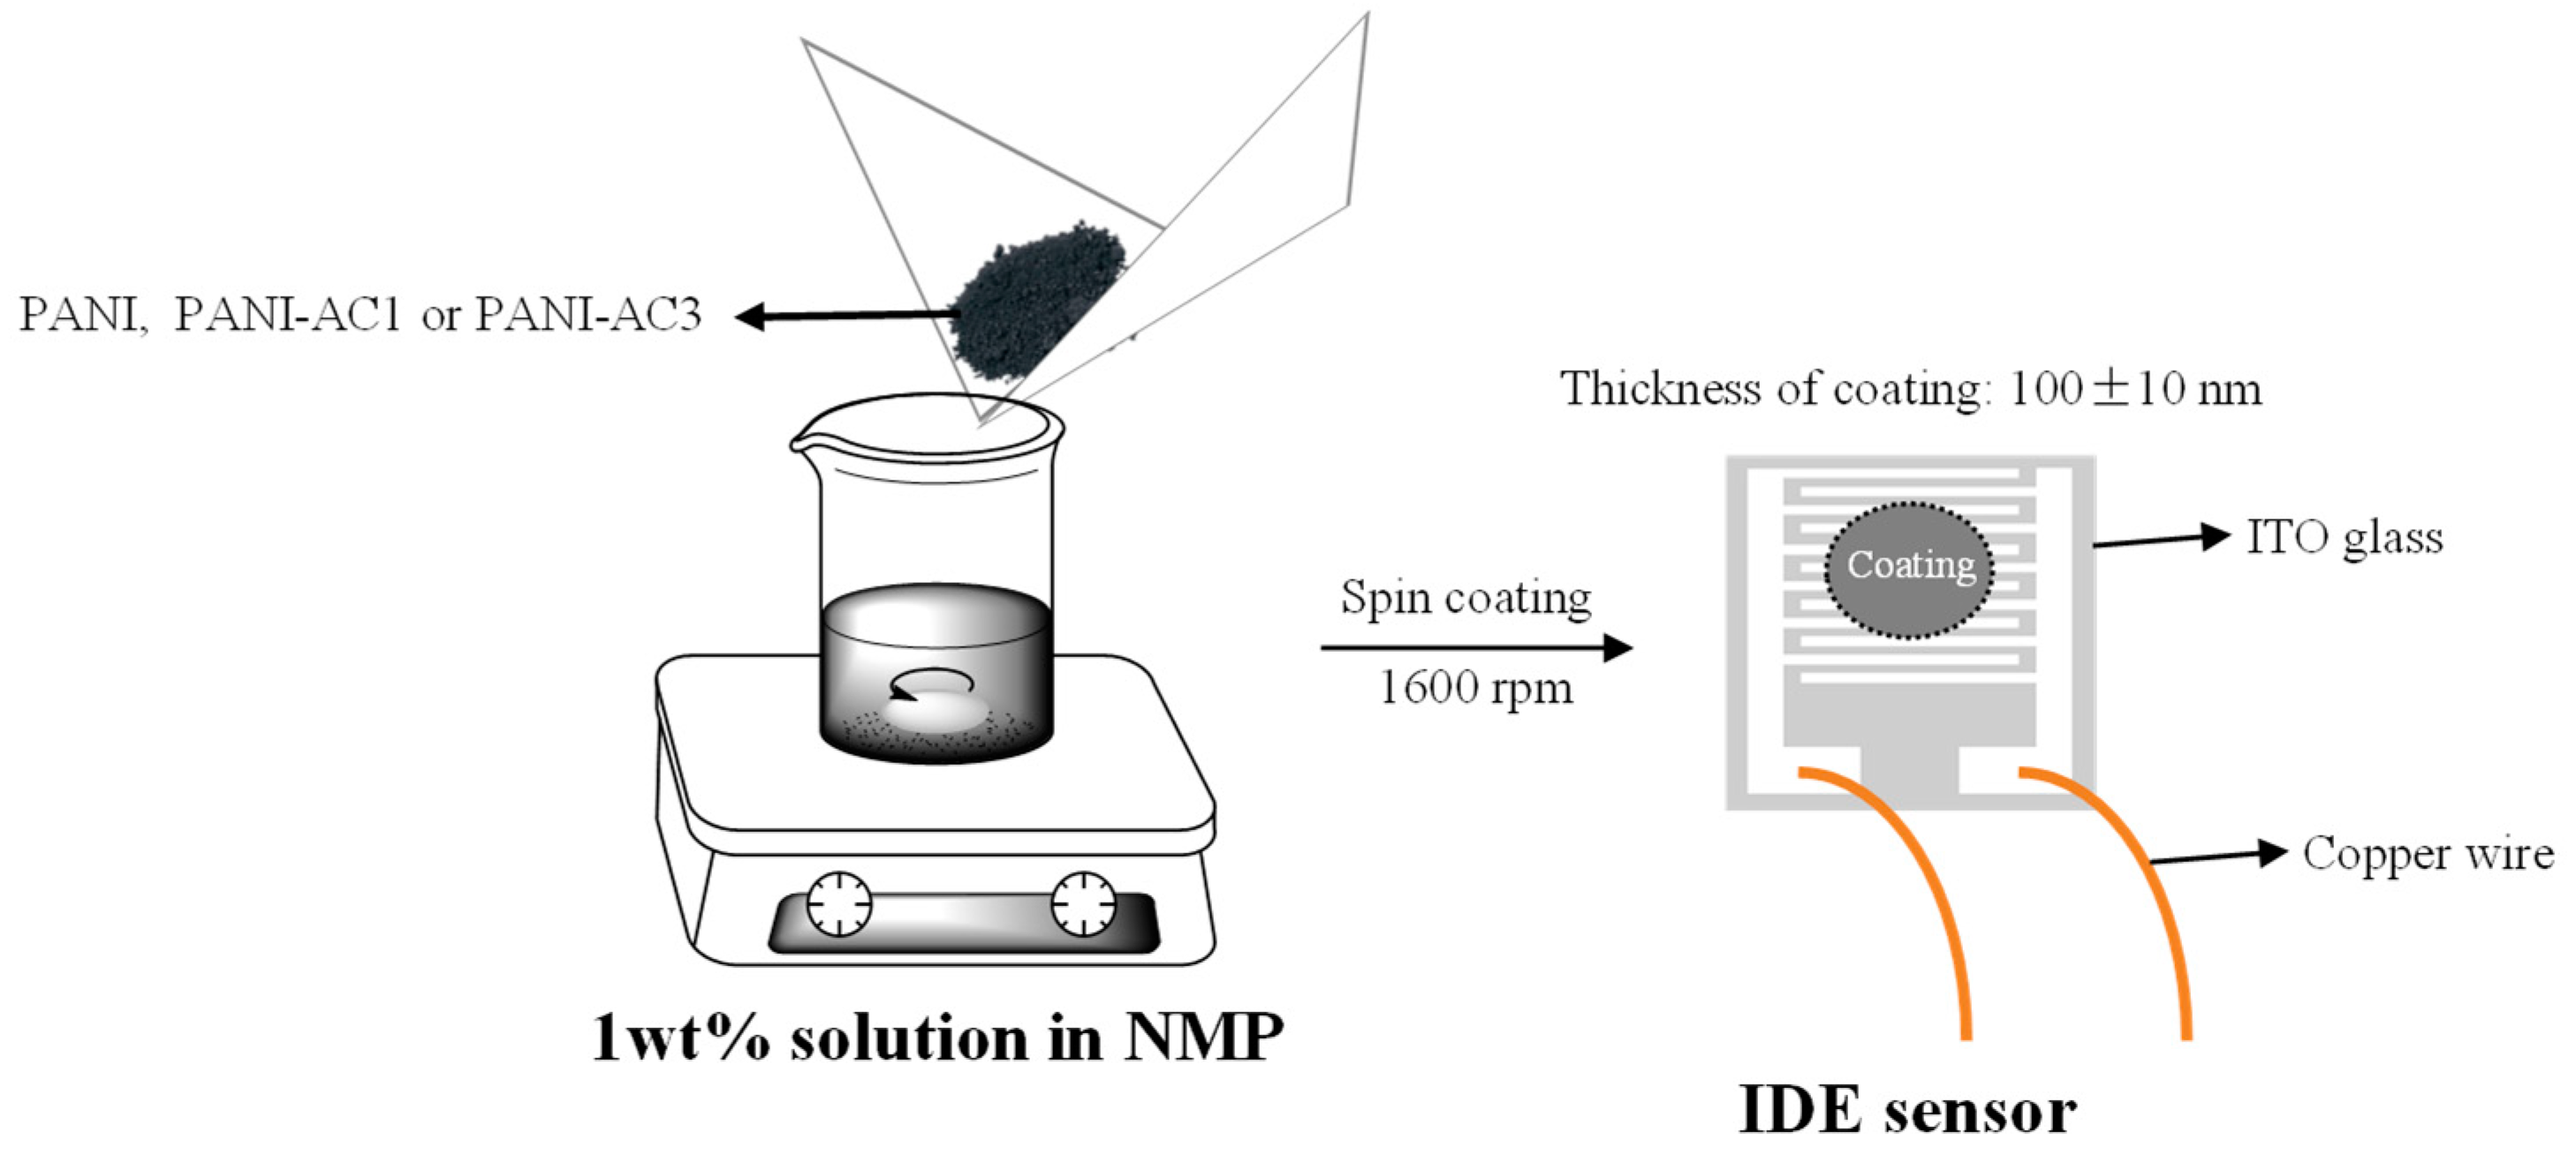
2.6. Preparation of PANI-AC Composites-Coated IDE Sensors

The spin-coating technique was used to prepare IDE sensors coated with PANI, PANI-AC1, and PANI-AC3. First, 1 wt% solutions of the samples of PANI, PANI-AC1, and PANI-AC3 were prepared using NMP under stirring at room temperature, as shown in Scheme 3. Thereafter, thin films were prepared by spin coating 200 μL of the corresponding solutions on ITO at a spin rate of 1600 rpm followed by drying overnight at room temperature. An advantage of spin coating is that it produces extremely fine, thin, and uniform coatings. Using the spin-coating method, the desired film thickness (100 ± 10 nm) can be achieved.

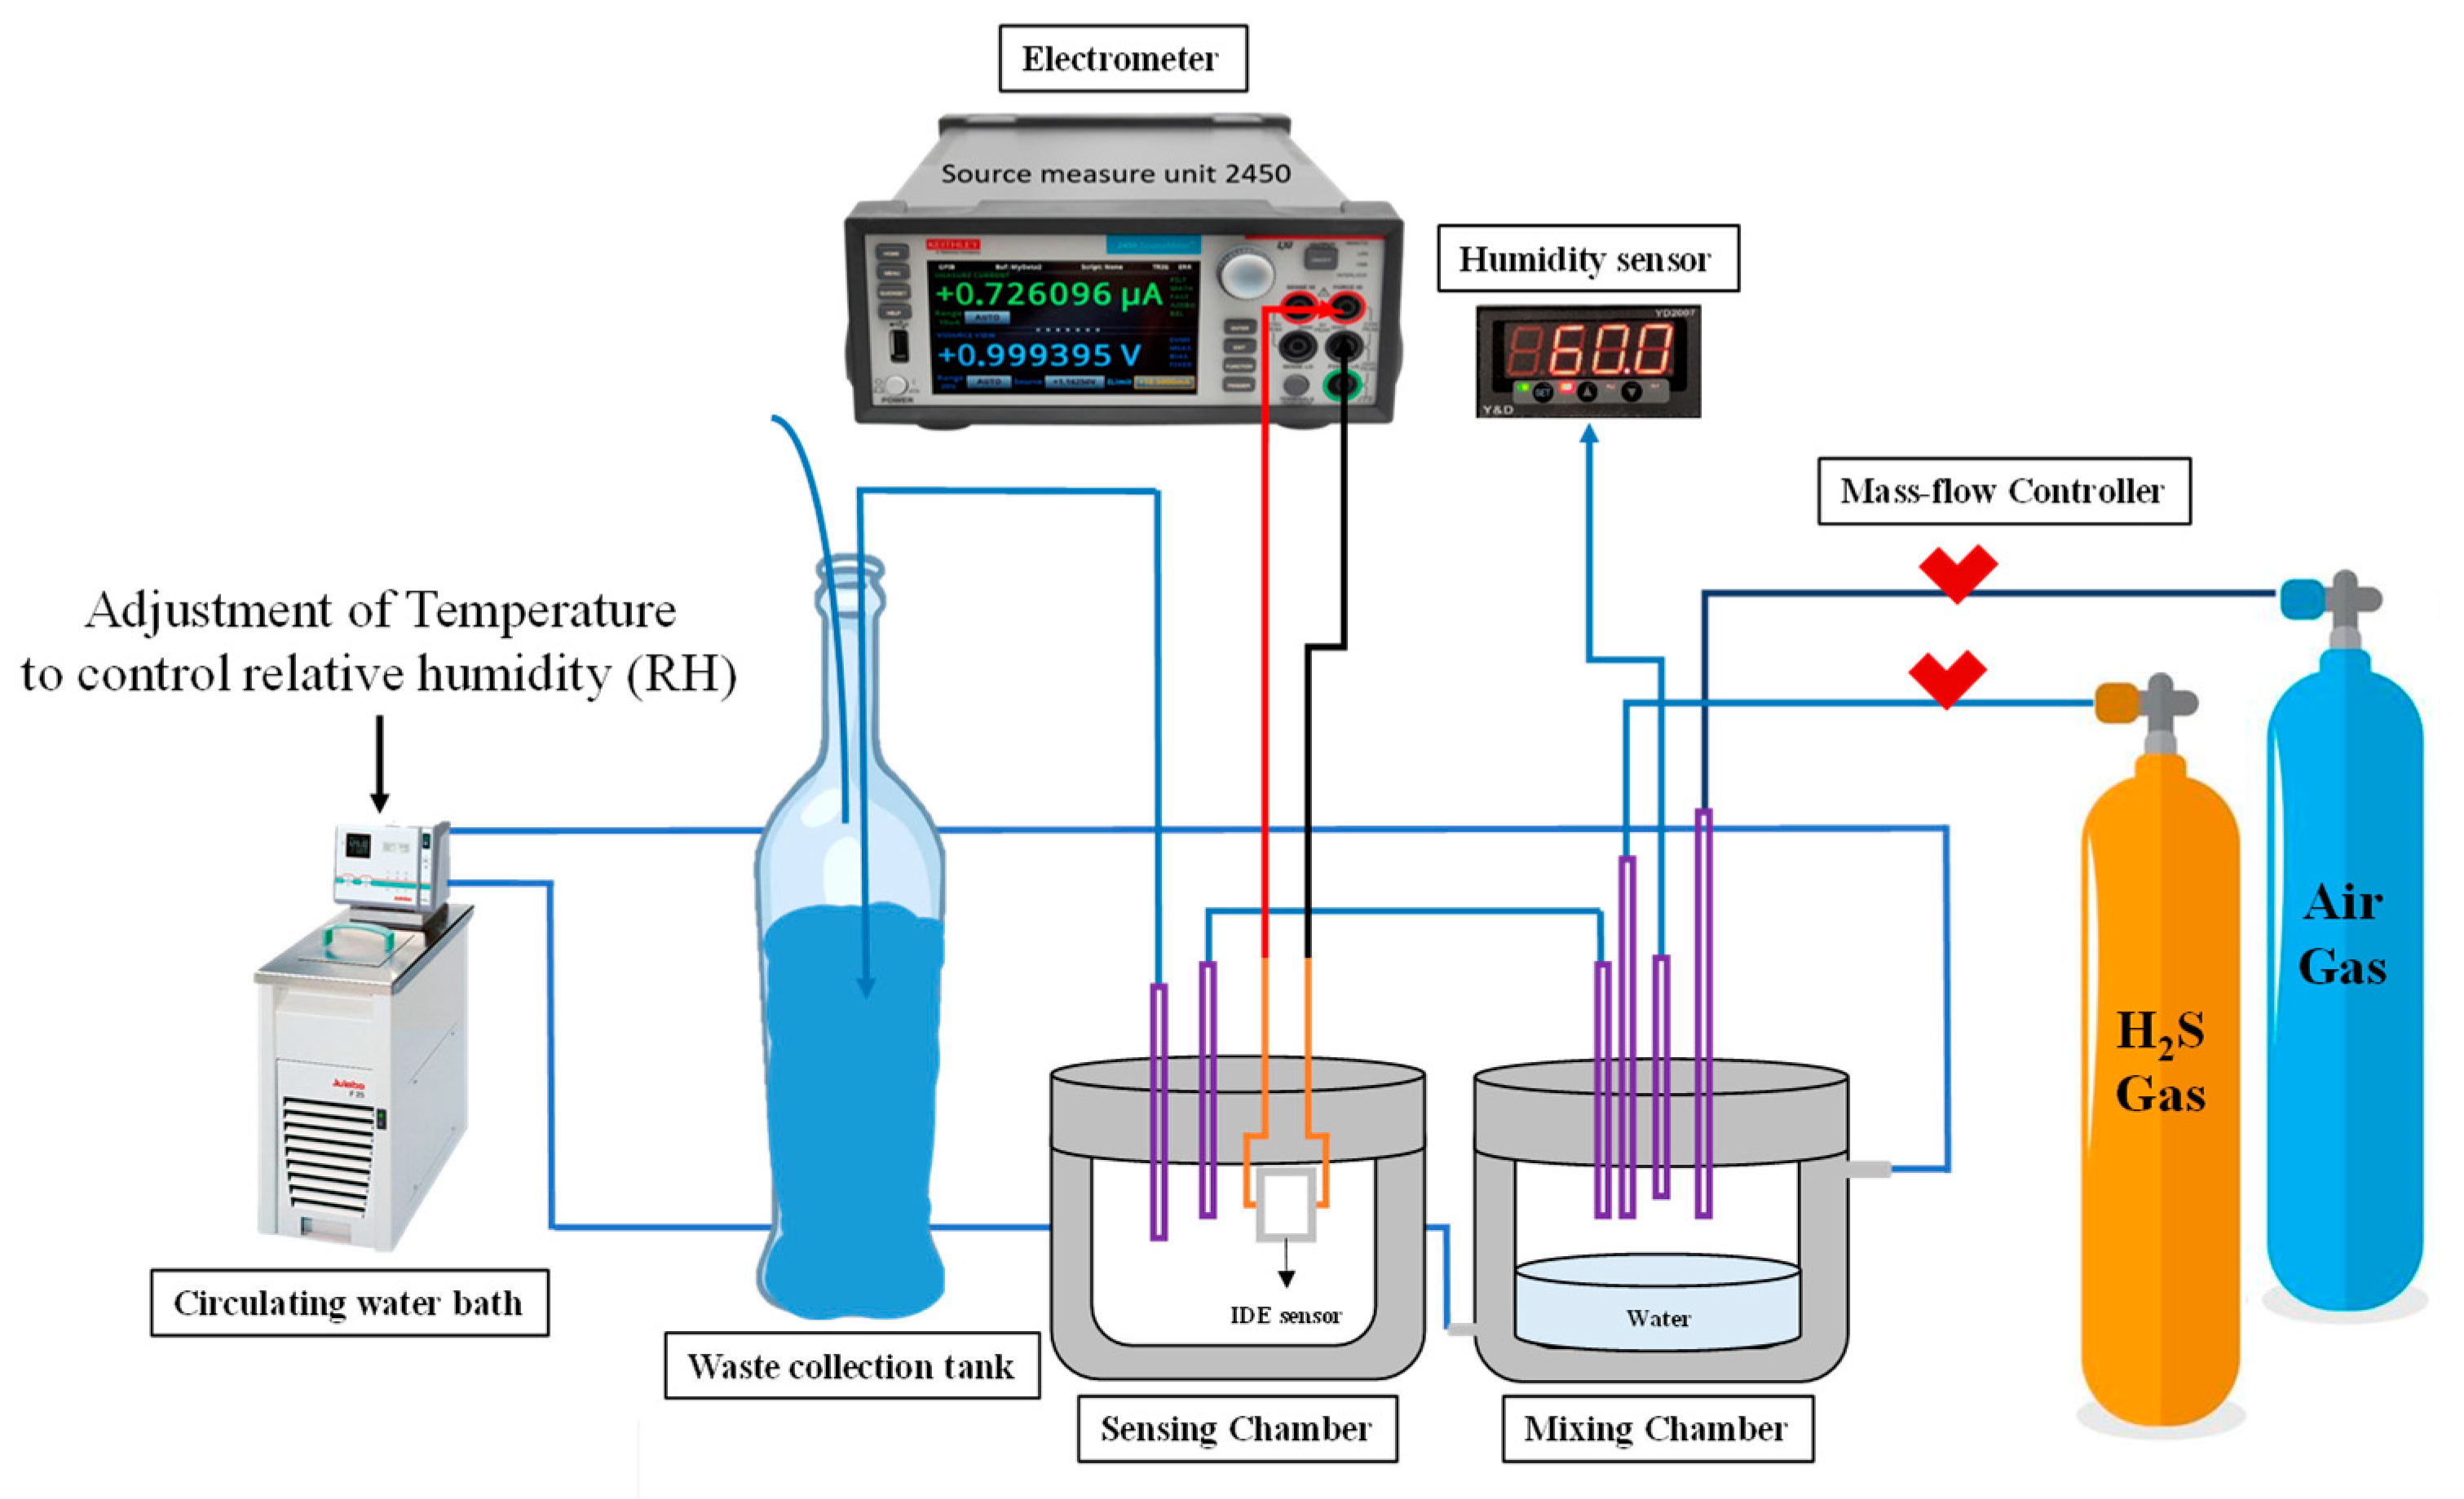
2.7. Gas-Sensing Experiment

In the gas-sensing experiment, PANI-coated, PANI-AC1-coated, and PANI-AC3-coated IDE sensors were exposed to various concentrations of the target gas (ranging from 1 ppm to 30 ppm) at room temperature. The target gases are H2S and five other common toxic gases, namely SO2, CO2, CO, NH3, and NO2. The IDE sensor was fixed in a gas chamber and connected to an electrometer to measure the responses, as depicted in Scheme 4. All measurements were conducted at a stable state after reaching room temperature (i.e., 25 ± 0.5 °C). The modulation of relative humidity (RH) to levels of 40%, 60%, and 80% was accomplished by regulating the temperature of the water in the mixing chamber. This control was facilitated through a circulating water bath connected to the mixing chamber, with alterations tracked by a humidity sensor positioned within the mixing chamber. The carrier gas (air) was mixed with the target gas in the mixing chamber, and the gas concentration was controlled by the programmable MFC to investigate the dependency of PANI-composite-coated IDE responses on gas concentration. The gas chamber was set to a total-gas-flow value of 1000 sccm. Each measurement was performed by flushing the measurement chamber with H2S gas for 150 s, followed by cleaning the sensor with air until the baseline was reached. The responses of PANI-composite-coated IDE sensors were evaluated as the normalized resistance (Ra/Rg), where Ra and Rg indicate the resistance under air and the given analyte, respectively. After the gas-sensing experiment, the gas was collected in a waste collection tank filled with water to dilute its toxicity.

3. Results and Discussion

3.1. Material Characterization

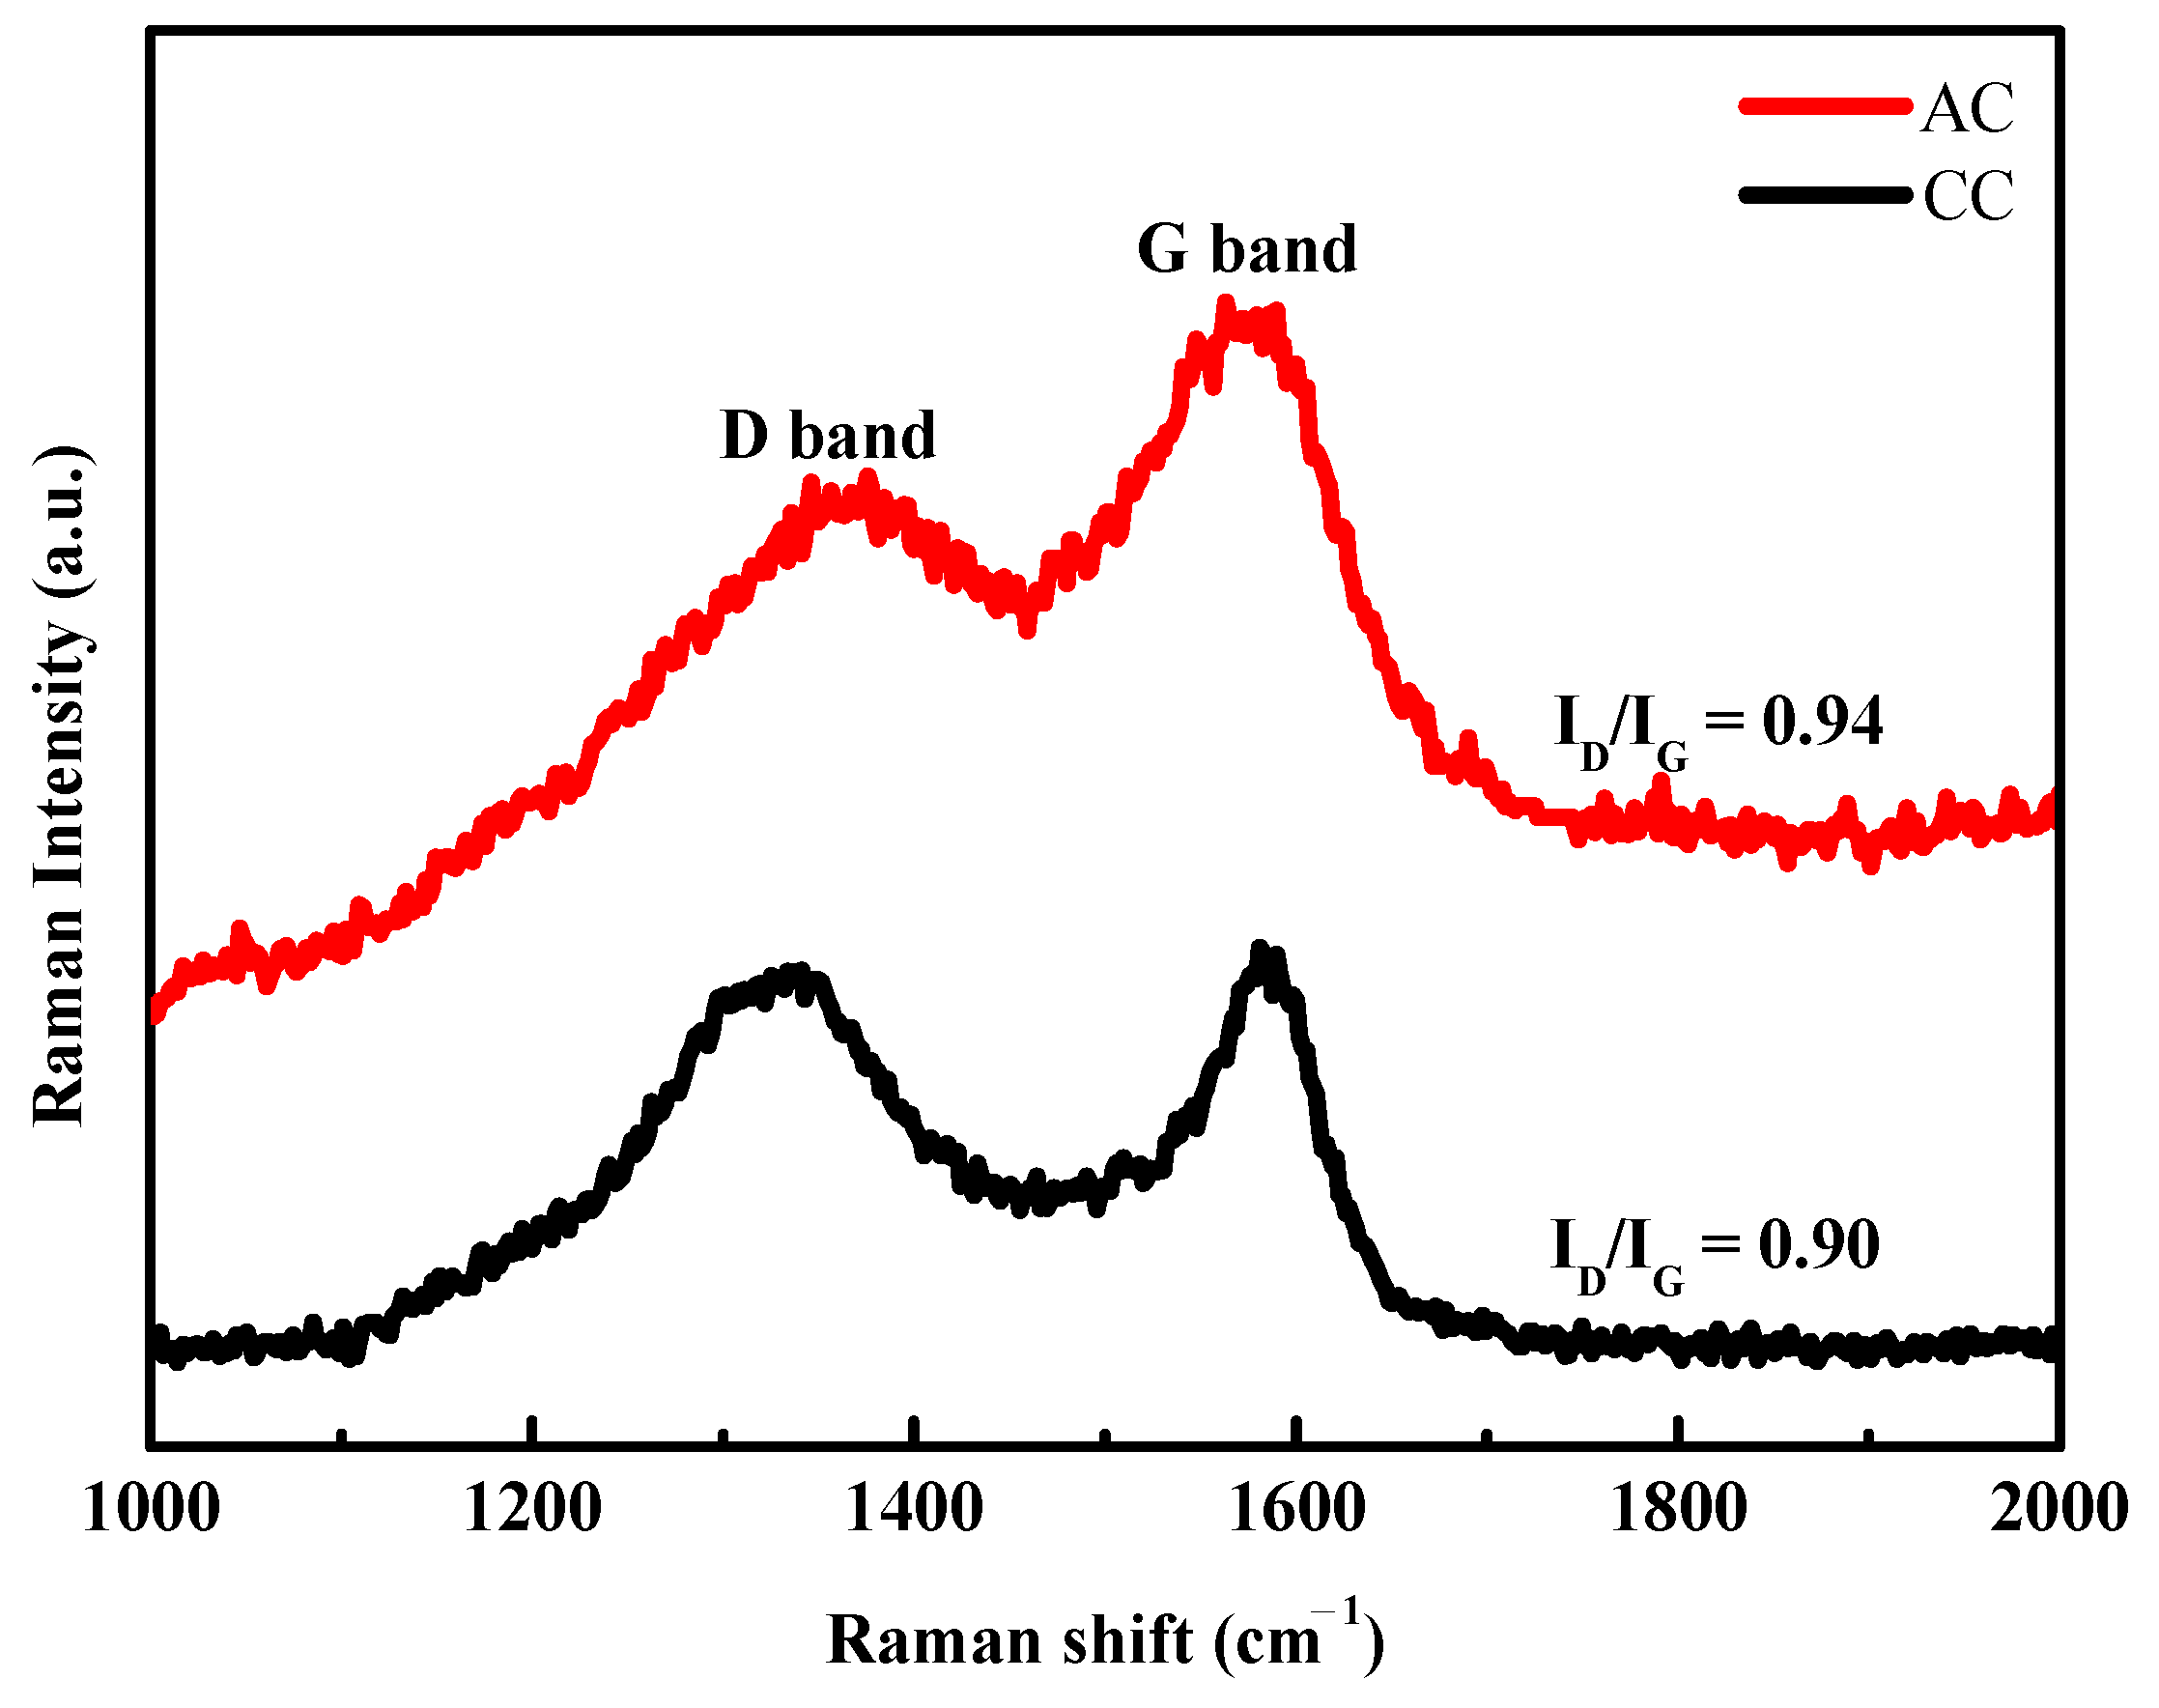
3.1.1. Raman Analyses of CC and AC

Figure 1 shows the Raman spectra of CC and AC. The D band was located at ~1330 cm−1, indicating the presence of disordered structural defects due to carbonization [45]. The G band appeared at 1580 cm−1, which was attributed to the ordered nature of any carbon atoms with a hexagonal two-dimensional structure because of C=C bond stretching. The D band in the CC spectrum corresponded to the double resonance effect of disordered carbon structures, whereas the G band corresponded to the in-plane vibration of ordered graphite. The relative intensity integration ratio of the D and G bands (ID/IG) with respect to AC indicated an increase in carbon defects owing to the structural damage caused to the material after activation [46].

3.1.2. FTIR Analyses of CC, AC, PANI, and PANI-AC Composites

A broad absorption band ranging from 3000 to 3700 cm−1, with a peak appearing between 3420 and 3440 cm−1, is evident in the FTIR spectra of CC and AC (Figure 2a). This band was attributable to the O–H stretching of the phenolic groups [47]. The peaks observed in the range of 2922–2967 cm−1 were attributed to the stretching vibrations of the C–H bond [48]. The peaks at 2320 and 1550 cm−1 correspond to the stretching vibration of the C=O bond in carboxylic acid, whereas that at 1120 cm−1 was attributed to the stretching vibration of the C–O bond [49]. After activation, the peaks at 2967 and 1555 cm−1 can be attributed to the C–H and C=C stretching frequencies, respectively, indicating the common graphite-like extended conjugation of AC [50]. The peaks detected for the PANI-AC1 and PANI-AC3 composites were also visible in the ATR-FTIR spectra of PANI, as shown in Figure 2b. In the spectrum of the PANI-AC composite, the peak observed between 3271 and 3041 cm−1 represented the stretching vibration of the N–H bond. The characteristic peak observed at 1553 cm−1 corresponded to the quinoid ring, whereas the peak at 1482 cm−1 corresponded to the benzenoid group. The incorporation of AC resulted in a peak similar to that of pure PANI, with a slight difference in peak intensity. PANI-AC composites exhibited an inverse intensity ratio of the bands at 1553/1482 cm−1 compared to pure PANI, indicating a higher abundance of quinoid units in PANI-AC composites. This suggested longer conjugation lengths in the polymeric chains of PANI-AC composites. The conjugated structure of PANI tended to strongly interact with the AC surface, particularly with the quinoid ring. Such aromatic structures were well-known for their ability to interact with the graphitic surface through π–π stacking [51]. The peak at 1291 cm−1 represented the C=C stretching vibration. The peak at 1242 cm−1 represented the C–N stretching vibrations of the benzenoid and quinoid rings. The peak at 654 cm−1 indicated out-of-plane vibration related to the C–H bending in the phenylene rings shifted to higher regions at 654 cm−1 [52].

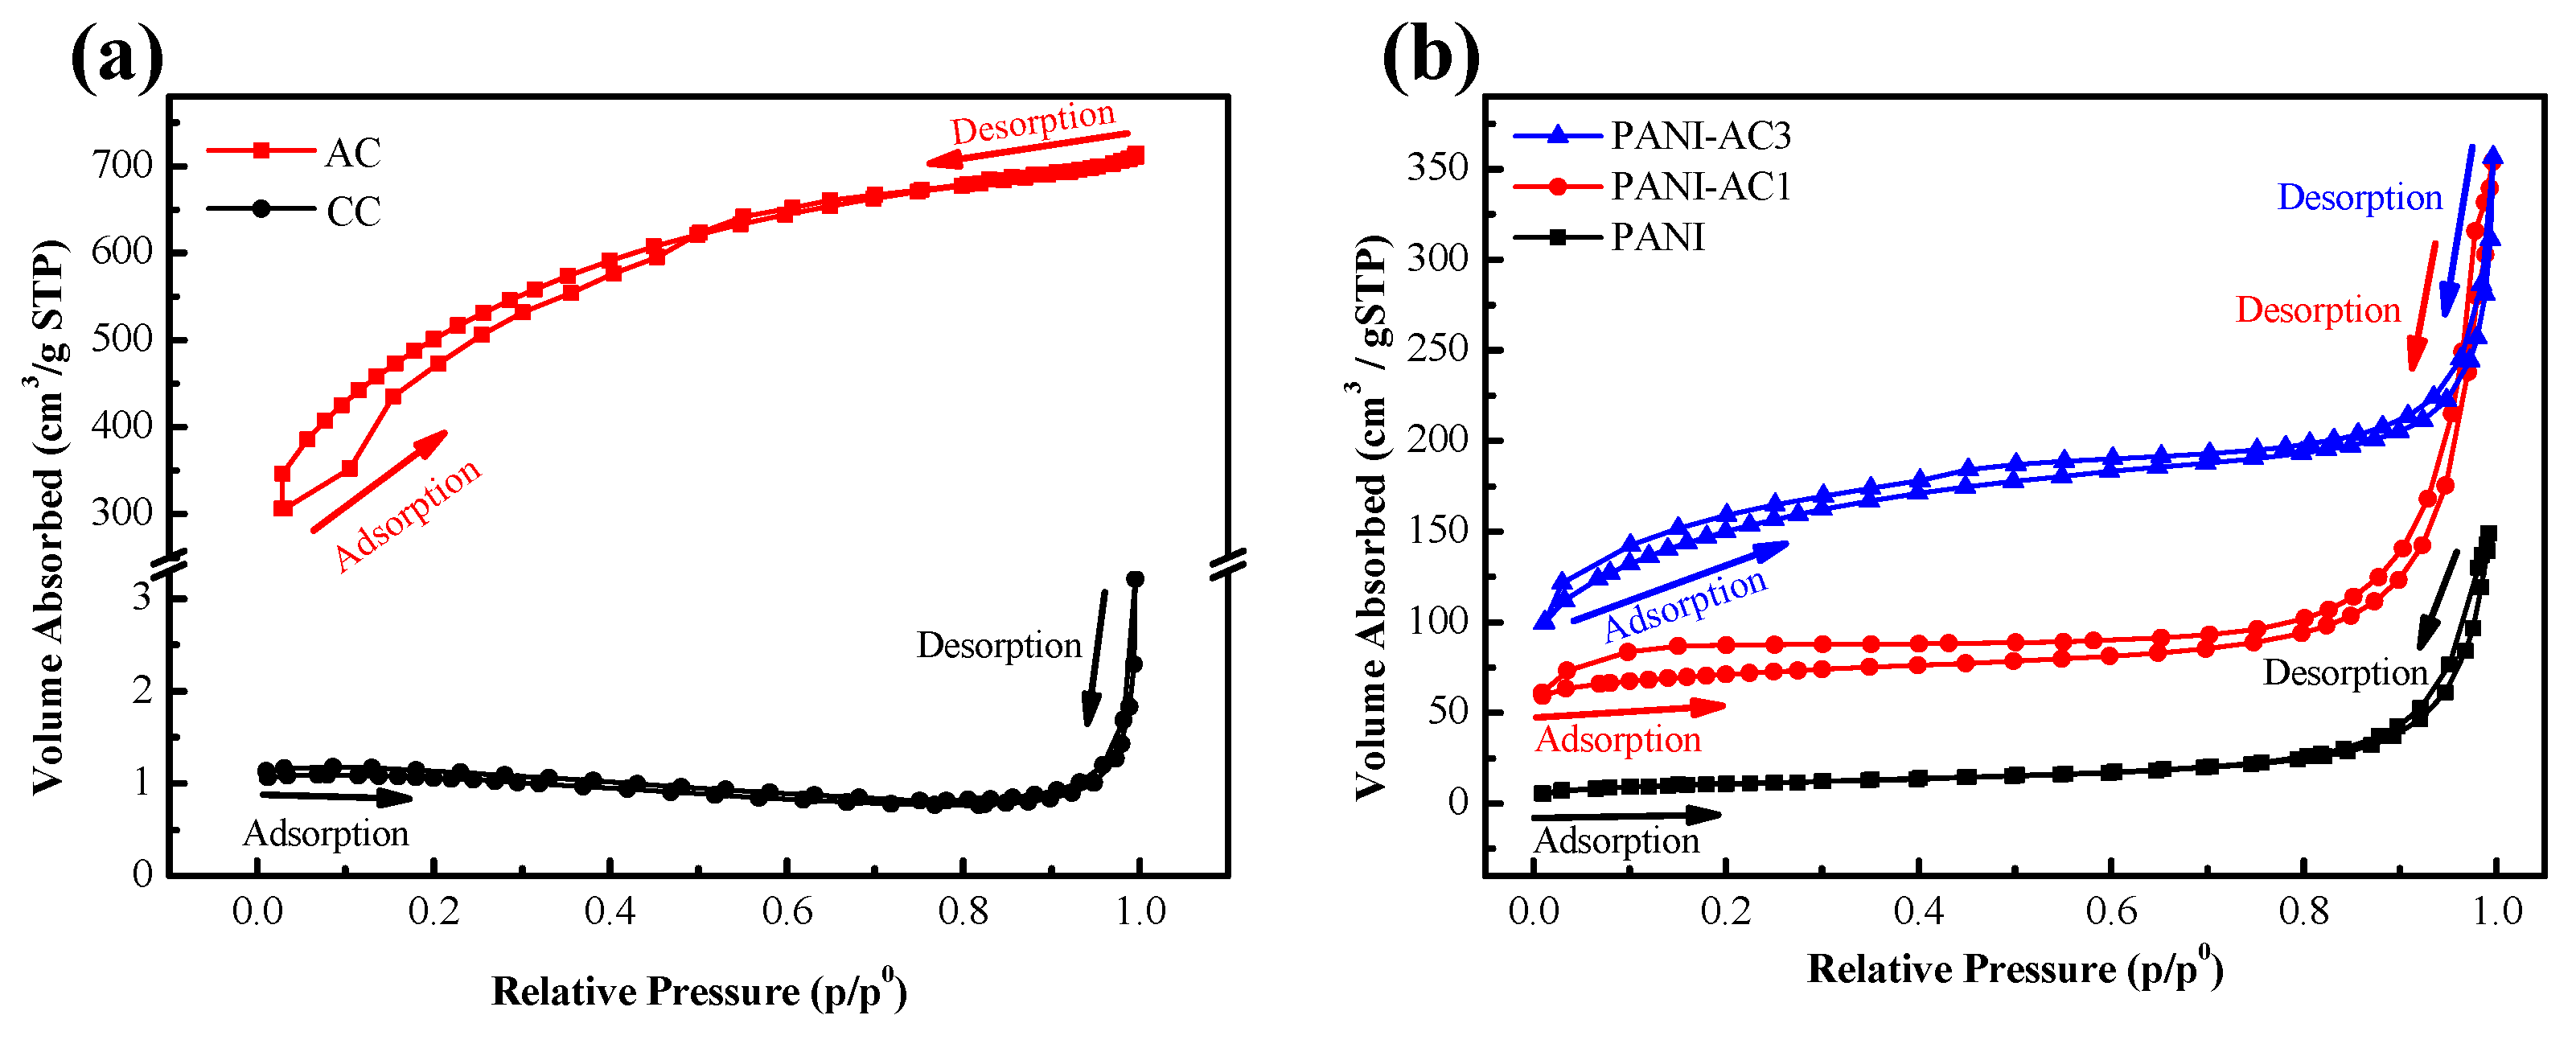
3.2. Pore Structure Characterization via the BET Analyses of CC, AC, PANI, and PANI-AC Composites

This study employed N2 adsorption–desorption analysis at 77 K to investigate the specific surface area, pore structure, and average pore diameter of the samples, as illustrated in Figure 3. Table 1 provides the BET surface area values for CC and AC, which were determined to be 5 and 1718 m2/g, respectively. The carbonized coconut husk exhibited a relatively small surface area, a common characteristic in lignocellulosic materials. This phenomenon is attributed to particle aggregation and unchanged porosity, resulting in smooth surfaces [53]. As shown in Figure 3a, the adsorption/desorption curves of CC revealed a Type II isotherm typical for macroporous materials, with an average pore size of 42.7 nm. In contrast, AC exhibited a Type I isotherm, indicating that the pores were not considerably larger than the diameter of the adsorbate, and the pore size was measured to be 2.6 nm. These findings underscored the significance of the activation process for CC. During pyrolysis, nanoporous carbon materials are formed, and the gaseous materials released in the subsequent stage act as pore generators, ultimately leading to the development of mesopores and an increase in the surface area of CC [54]. Figure 3b illustrates the N2 adsorption–desorption curves of the PANI and PANI-AC composites, displaying a Type IV isotherm with an H3 hysteresis loop. This characteristic signifies the porous structure of PANI and PANI-AC composites [55]. For PANI, PANI-AC1, and PANI-AC3, the results presented in Table 1 show that the BET surface area of the samples increased with the incorporation of AC. Specifically, the BET surface areas of PANI-AC1 and PANI-AC3, measuring 225 and 416 m2/g, respectively, were substantially larger than that of pure PANI, measuring 38 m2/g. This increase in the specific surface areas of PANI-AC1 and PANI-AC3 can be attributed to the porous structure of AC, which provides additional active sites for interaction with H+ molecules dissociated from H2S [56].

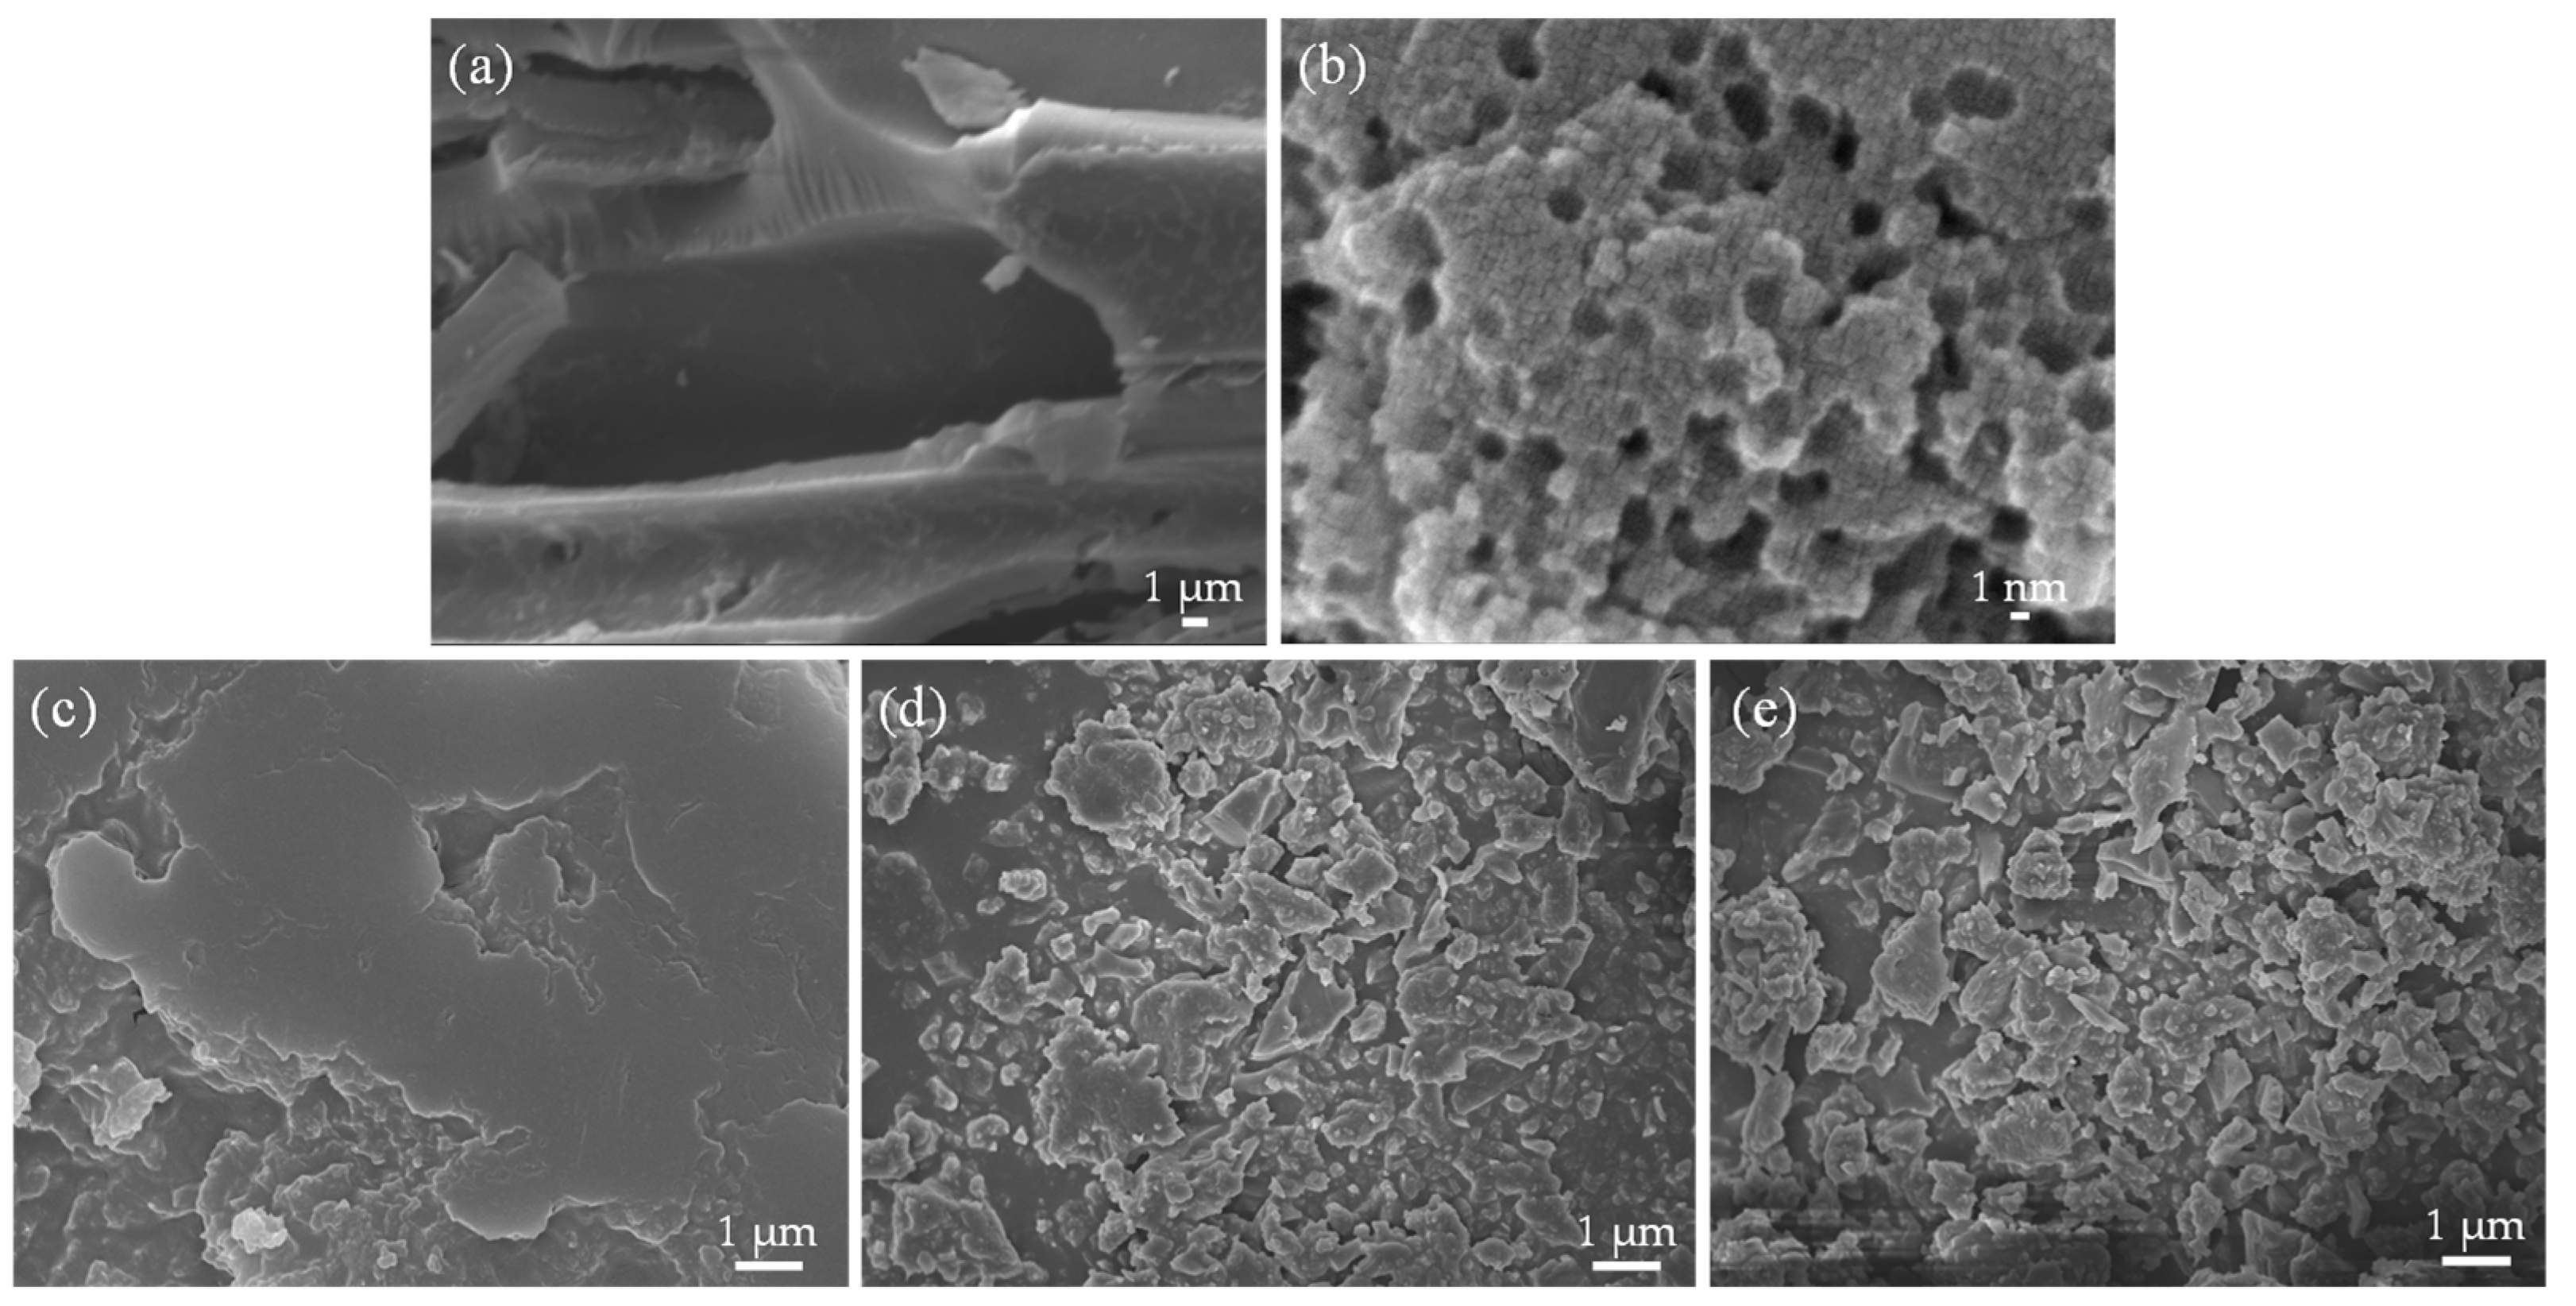
3.3. Morphologies of CC, AC, PANI, and PANI-AC Composites

Figure 4a shows the original shape of coconut shell–based carbon powder after carbonization, and stacked microsheet structures were observed. Figure 4b illustrates AC with visible pores that are critical for increasing the specific surface area. These pores were nonexistent in CC without the activating agent, ZnCl2, because oxidation did not occur on the carbon surface in CC. This study investigated the effect of AC on the morphology of PANI composites. The SEM image of PANI (Figure 4c) shows a smooth surface morphology without any distinctive features. However, in Figure 4d,e, a substantial modification in the morphology of PANI is observed owing to the incorporation of AC. The absence of agglomeration in the SEM images of PANI-AC1 and PANI-AC3 is consistent with the BET analyses that demonstrate that the addition of AC can enhance the formation of composites having improved properties, such as a large specific surface area. These results indicate that the incorporation of AC can induce desirable changes in the morphology of PANI, which may have implications related to the potential applications of AC in gas sensing.

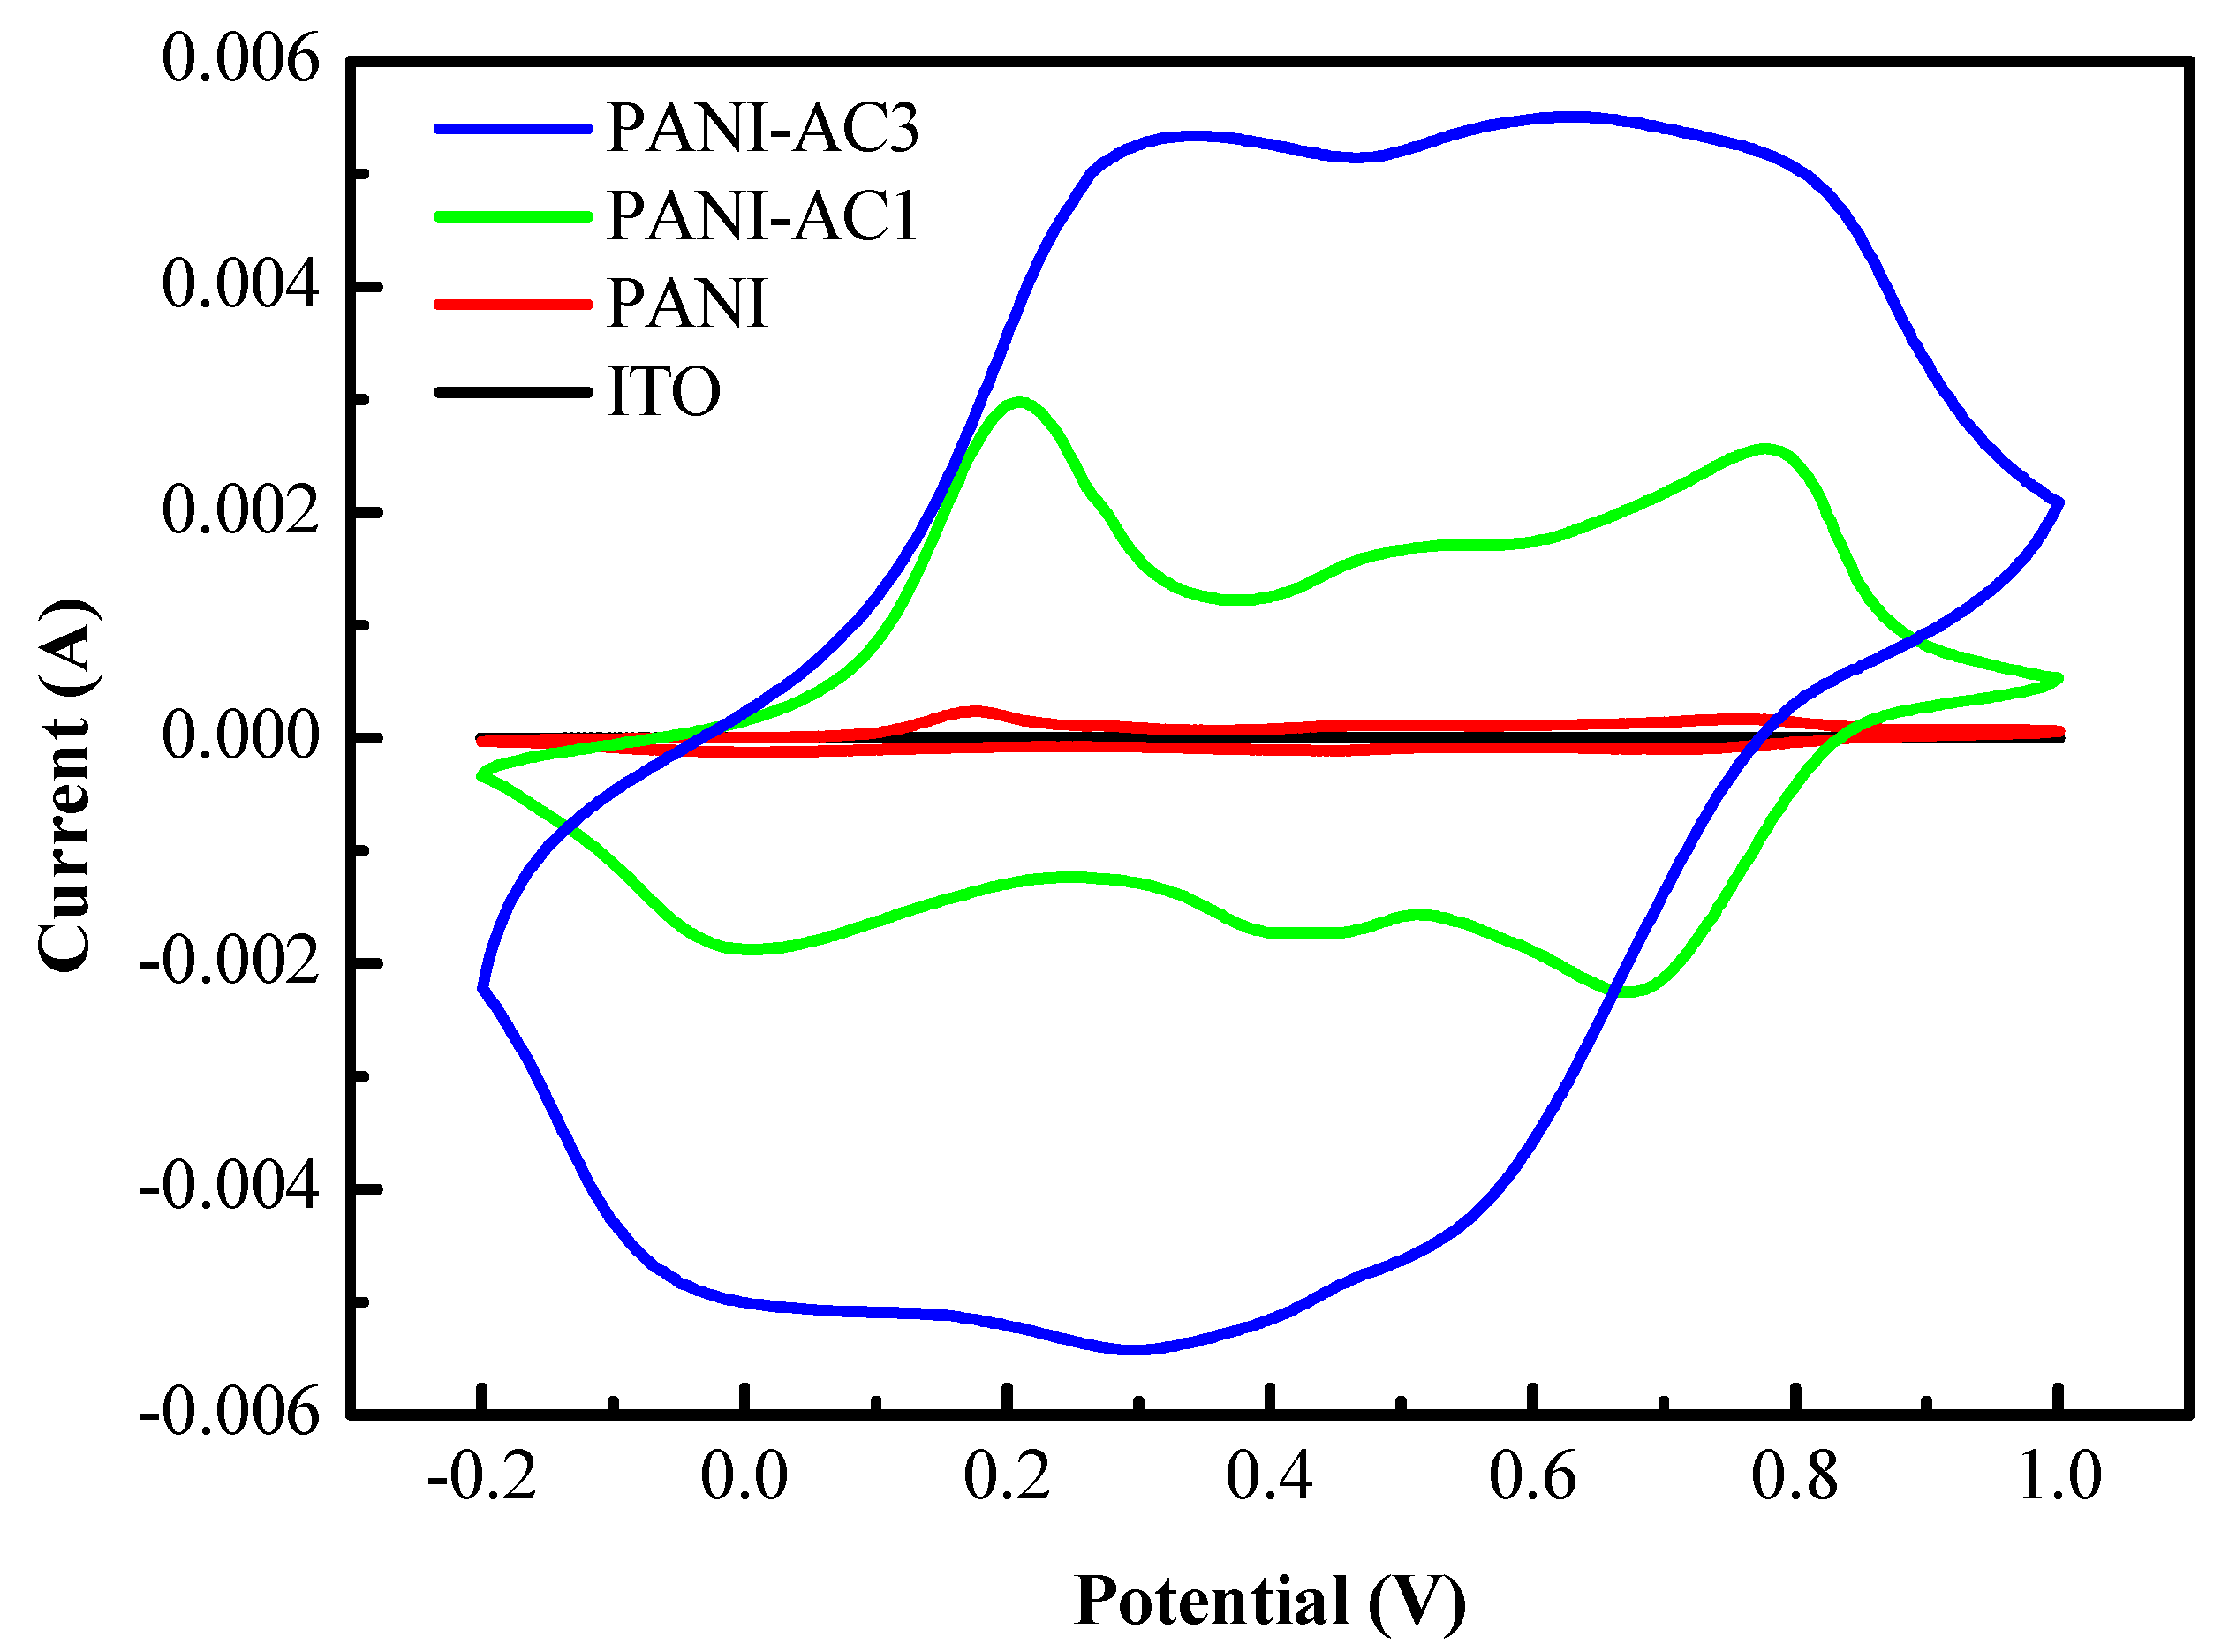
3.4. Electrochemical Redox Properties of PANI-AC Composites

CV performance was investigated to evaluate the redox properties of each component in the potential range of −0.2 V to 1.0 V in 1.0 M H2SO4 at various scan rates, and the scan rate of 5 mV/s was selected for comparison in Figure 5 [57]. Three pairs of redox peaks were observed for PANI, PANI-AC1, and PANI-AC3, where all oxidation peaks were accompanied by a reduction peak, which was associated with the main chain of PANI that can exist in four oxidation states, i.e., Leucoemeraldine, Emeraldine I, Emeraldine II, and Pernigraniline [58]. The oxidation and reduction peak pairs appeared at 0.17/−1.25 V, 0.45/0.44 V, and 0.75/0.72 V for PANI. For PANI-AC1, the oxidation and reduction peak pairs appeared at 0.21/0.01 V, 0.51/0.41 V, and 0.78/0.68 V. For PANI-AC3, the oxidation and reduction peak pairs appeared at 0.31/0.54 V, 0.62/0.30 V, and 0.81/−0.05 V. Importantly, the incorporation of AC in the PANI matrix caused a shift in the oxidation peaks toward higher currents, indicating more effective electron inclusion and exclusion during the redox processes in the PANI-AC composites than in the neat electroactive polymer. This improvement was attributed to the enhancement of the surface area by AC that led to increased active sites that benefited the redox processes [59].

3.5. Electrochemical Doping Properties of PANI-AC Composites

The impact of increased surface area in PANI-AC composites on their doping capacity was assessed using a four-point probe technique with hydrosulfuric acid as the dopant. The conductivities of undoped, doped, dedoped, and redoped PANI-AC composites were determined (Table 2). These results highlighted the reversible doping–dedoping capability of PANI, with similar observations in PANI-AC composites. Notably, the conductivities of the doped and redoped forms of PANI-AC composites, especially PANI-AC3, were significantly higher, approximately 10 times more than those of the corresponding PANI forms. This difference is attributed to the incorporation of AC, which provides a larger surface area than bare PANI, offering numerous active sites for dopants. The increased conductivity of PANI-AC composites during doping suggests a superior gas-sensing performance compared to PANI alone.

3.6. Gas-Sensing Performance

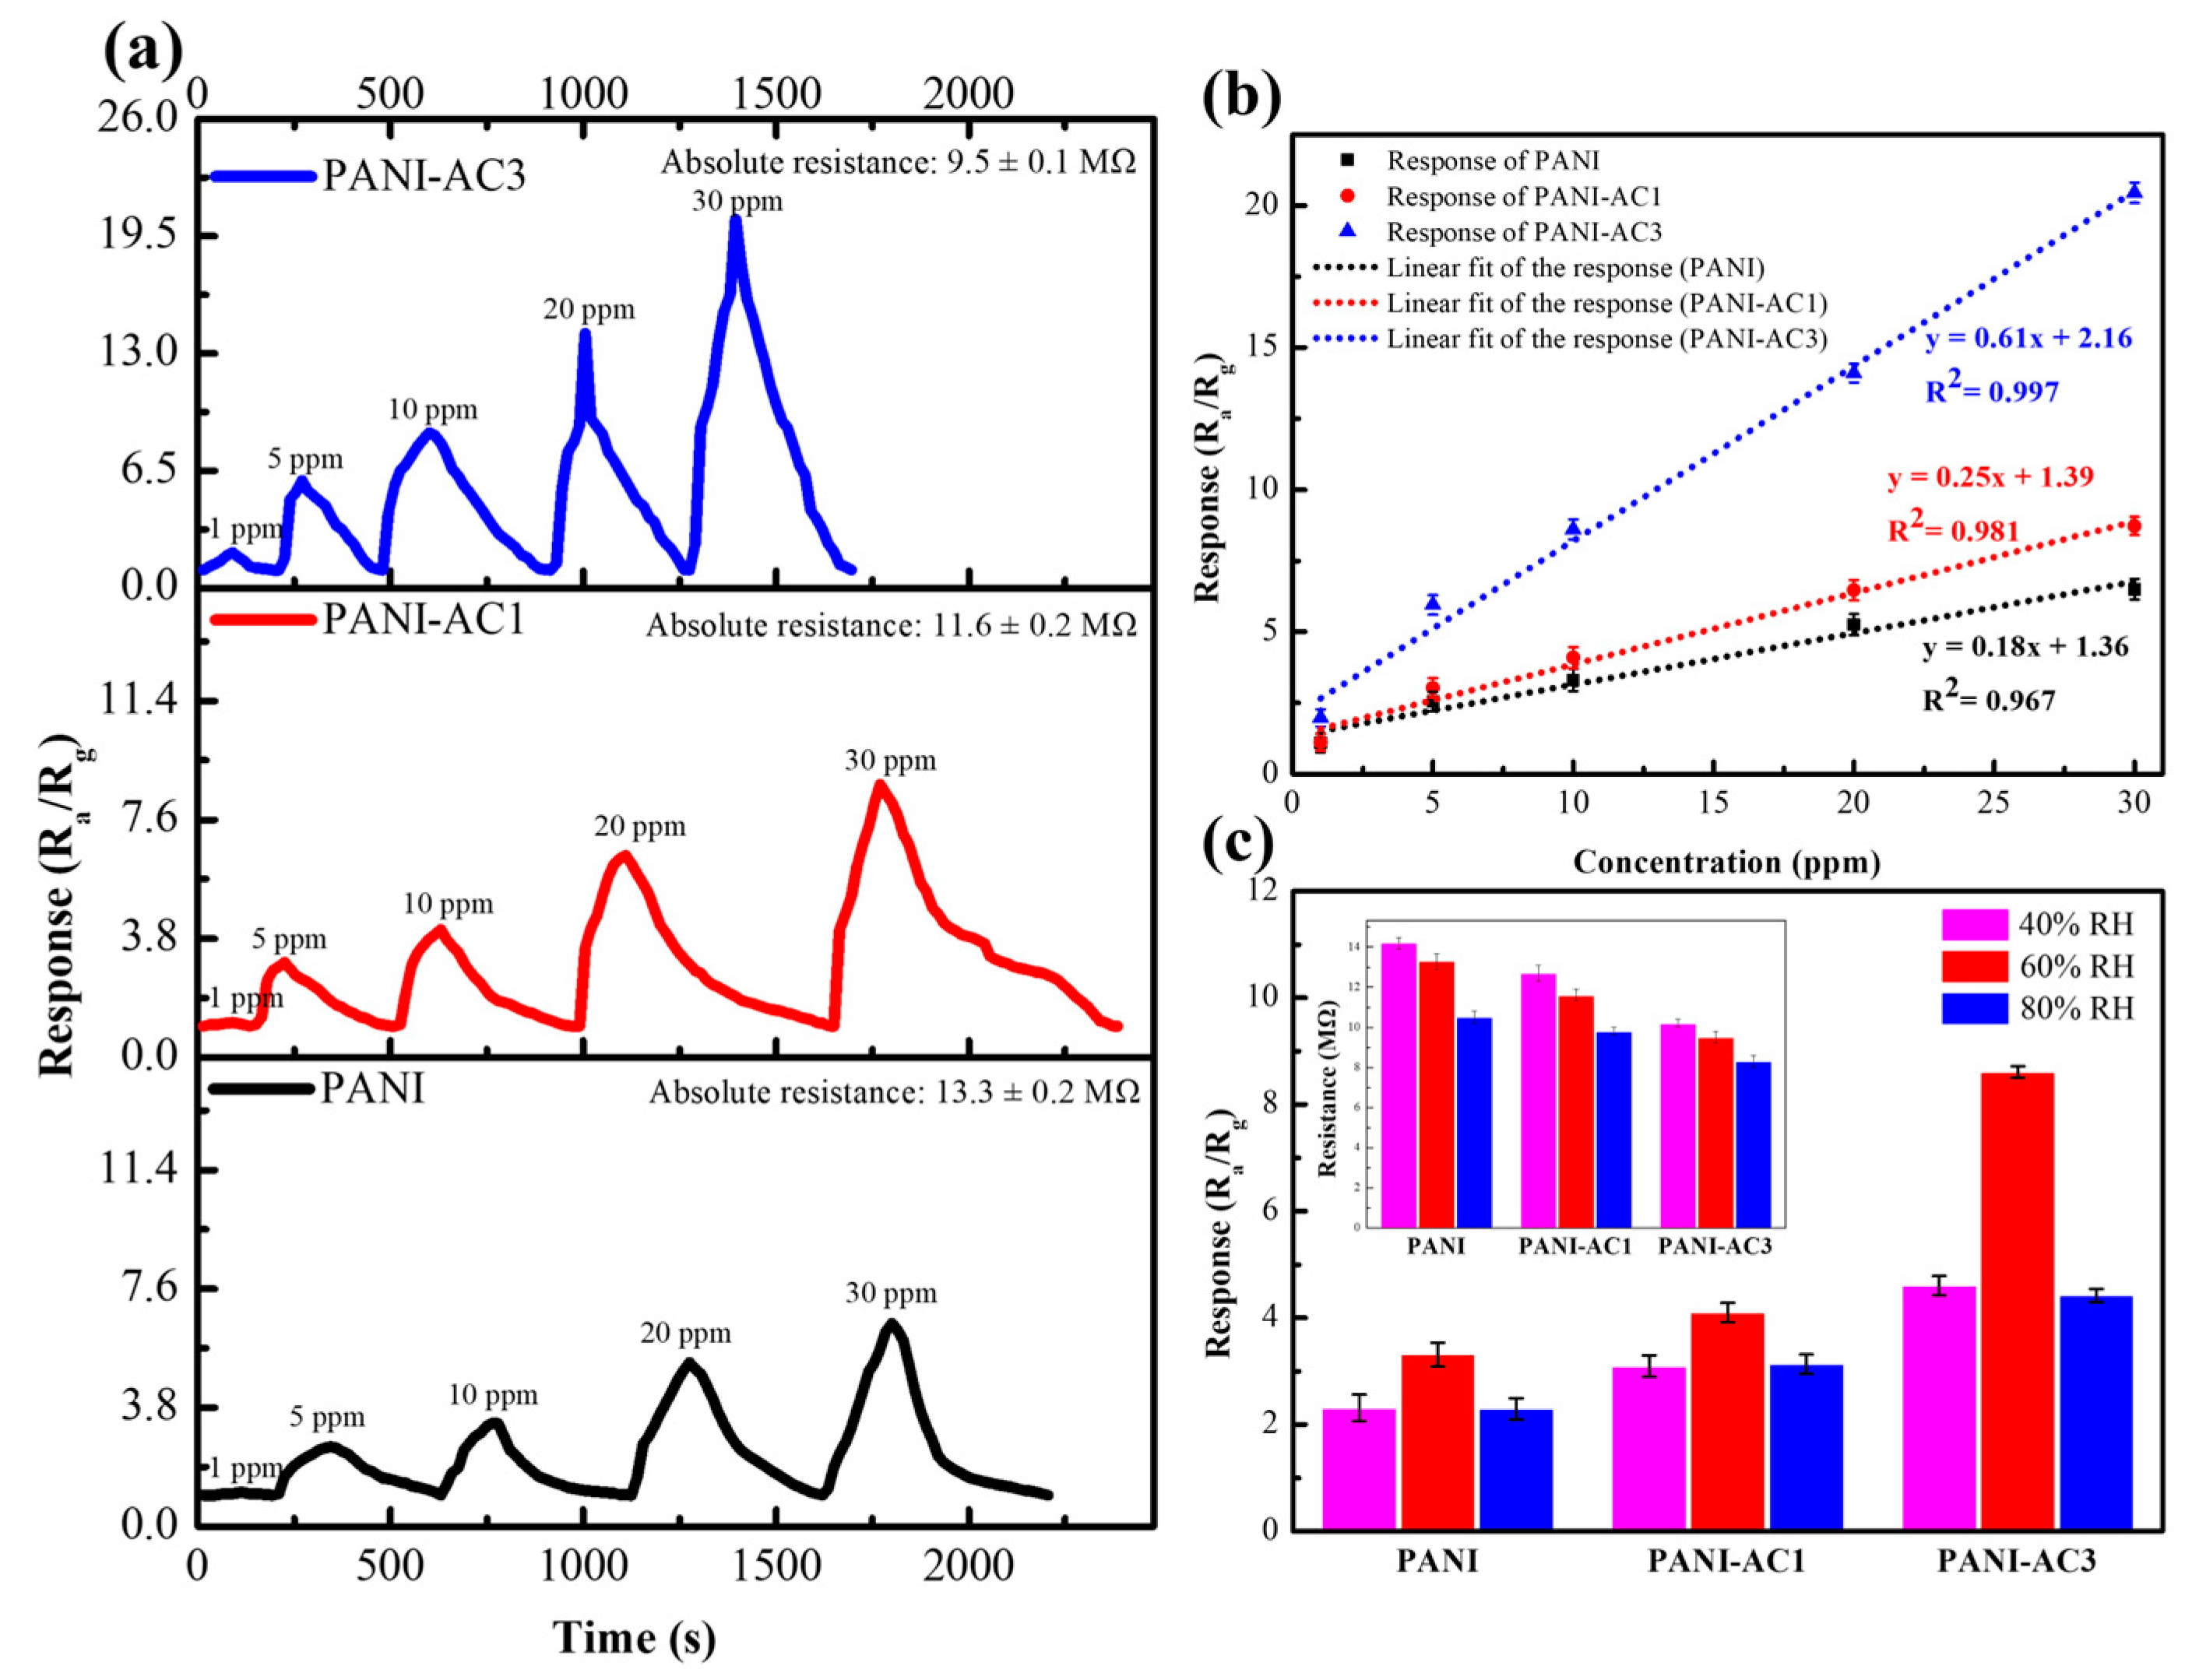
3.6.1. Sensitivity and Effect of Humidity

The IDE sensor responses were examined at different H2S concentrations (i.e., 1, 5, 10, 20, and 30 ppm), as presented in Figure 6a. The absolute resistance of PANI-coated, PANI-AC1-coated, and PANI-AC3-coated IDEs was 13.3 ± 0.2, 11.6 ± 0.2, and 9.5 ± 0.1 MΩ, respectively. The response signals of PANI-coated, PANI-AC1-coated, and PANI-AC3-coated IDEs increased gradually with the increase in H2S concentration. The response signals exhibited a gradual increase in PANI-coated, PANI-AC1-coated, and PANI-AC3-coated IDEs with the elevation of H2S concentration. As H2S gas was introduced, the PANI and PANI-AC composites underwent doping with hydrosulfuric acid as the dopant, inducing a change in conductivity and a subsequent sharp decrease in resistance as a response. Notably, variations in H2S concentration directly influenced the response, with higher concentrations of dopant correlating to more pronounced responses. Subsequent replacement with air facilitated the removal of the dopant by the air, causing the response to revert to the baseline state. This analysis underscores the close relationship between acidic gas doping, gas concentration, and the resulting gas-sensing characteristics in PANI and PANI-AC composites. For the PANI sensor, the response values for detecting 1, 5, 10, 20, and 30 ppm H2S gas were 1.09, 2.55, 3.31, 5.25, and 6.50, respectively. The PANI-AC1 sensor responses were even higher, reaching 1.12, 3.04, 4.10, 6.47, and 8.73 for the same concentrations. Meanwhile, the PANI-AC3 sensor showed the highest response values at 1.80, 5.96, 8.61, 14.09, and 20.44 for the same concentrations. The PANI-AC3-coated IDE sensor exhibited a stronger response than the PANI-coated IDE sensor. Notably, the difference in sensor response could be attributed to the introduction of AC, which improved the doping properties via the availability of a larger number of active sites in the sensing layer to provide doping reaction sites for H+ dissociated from H2S.
Figure 6b displays the linear calibration curves of the PANI-coated, PANI-AC1-coated, and PANI-AC3-coated IDE sensors exposed to different concentrations of H2S. The linear fit equations were y = 0.18x + 1.36, y = 0.25x + 1.39, and y = 0.61x + 2.16 for the PANI-coated, PANI-AC1-coated, and PANI-AC3-coated IDE sensors, respectively. The correlation coefficients for the fitted data (R2) were 0.967, 0.981, and 0.997 for the PANI-coated, PANI-AC1-coated, and PANI-AC3-coated IDE sensors, respectively. Notably, a highly linear response was observed in the tested H2S range, where the R2 of the PANI-AC3-coated IDE sensor was higher than that of the PANI-coated IDE sensor, indicating the reliable calculation and superiority of PANI-AC3 in gas sensing.
To investigate the effect of humidity on the sensing of toxic gases, the responses of the PANI-coated, PANI-AC1-coated, and PANI-AC3-coated IDE sensors at a concentration of 10 ppm were compared, as depicted in Figure 6c. The responses of the PANI-coated, PANI-AC1-coated, and PANI-AC3-coated IDE sensors at 40% and 80% RH were observed to be lower than those at 60% RH. The decrease in sensor response at 40% RH was attributed to the insufficient adsorption of water molecules on the material, thereby reducing the number of active protonic acid sites. By contrast, the decrease in sensor response at 80% RH was due to the overabundance of adsorbed water molecules, leading to the occupation of the active sites by water vapor. Both effects resulted in a decrease in sensor response [60]. In the inset of Figure 6c, a decrease in the absolute resistance of the gas sensor is observed with an increase in RH, which can be attributed to the further protonation of PANI through the adsorption of water or the formation of H3O+ [61].

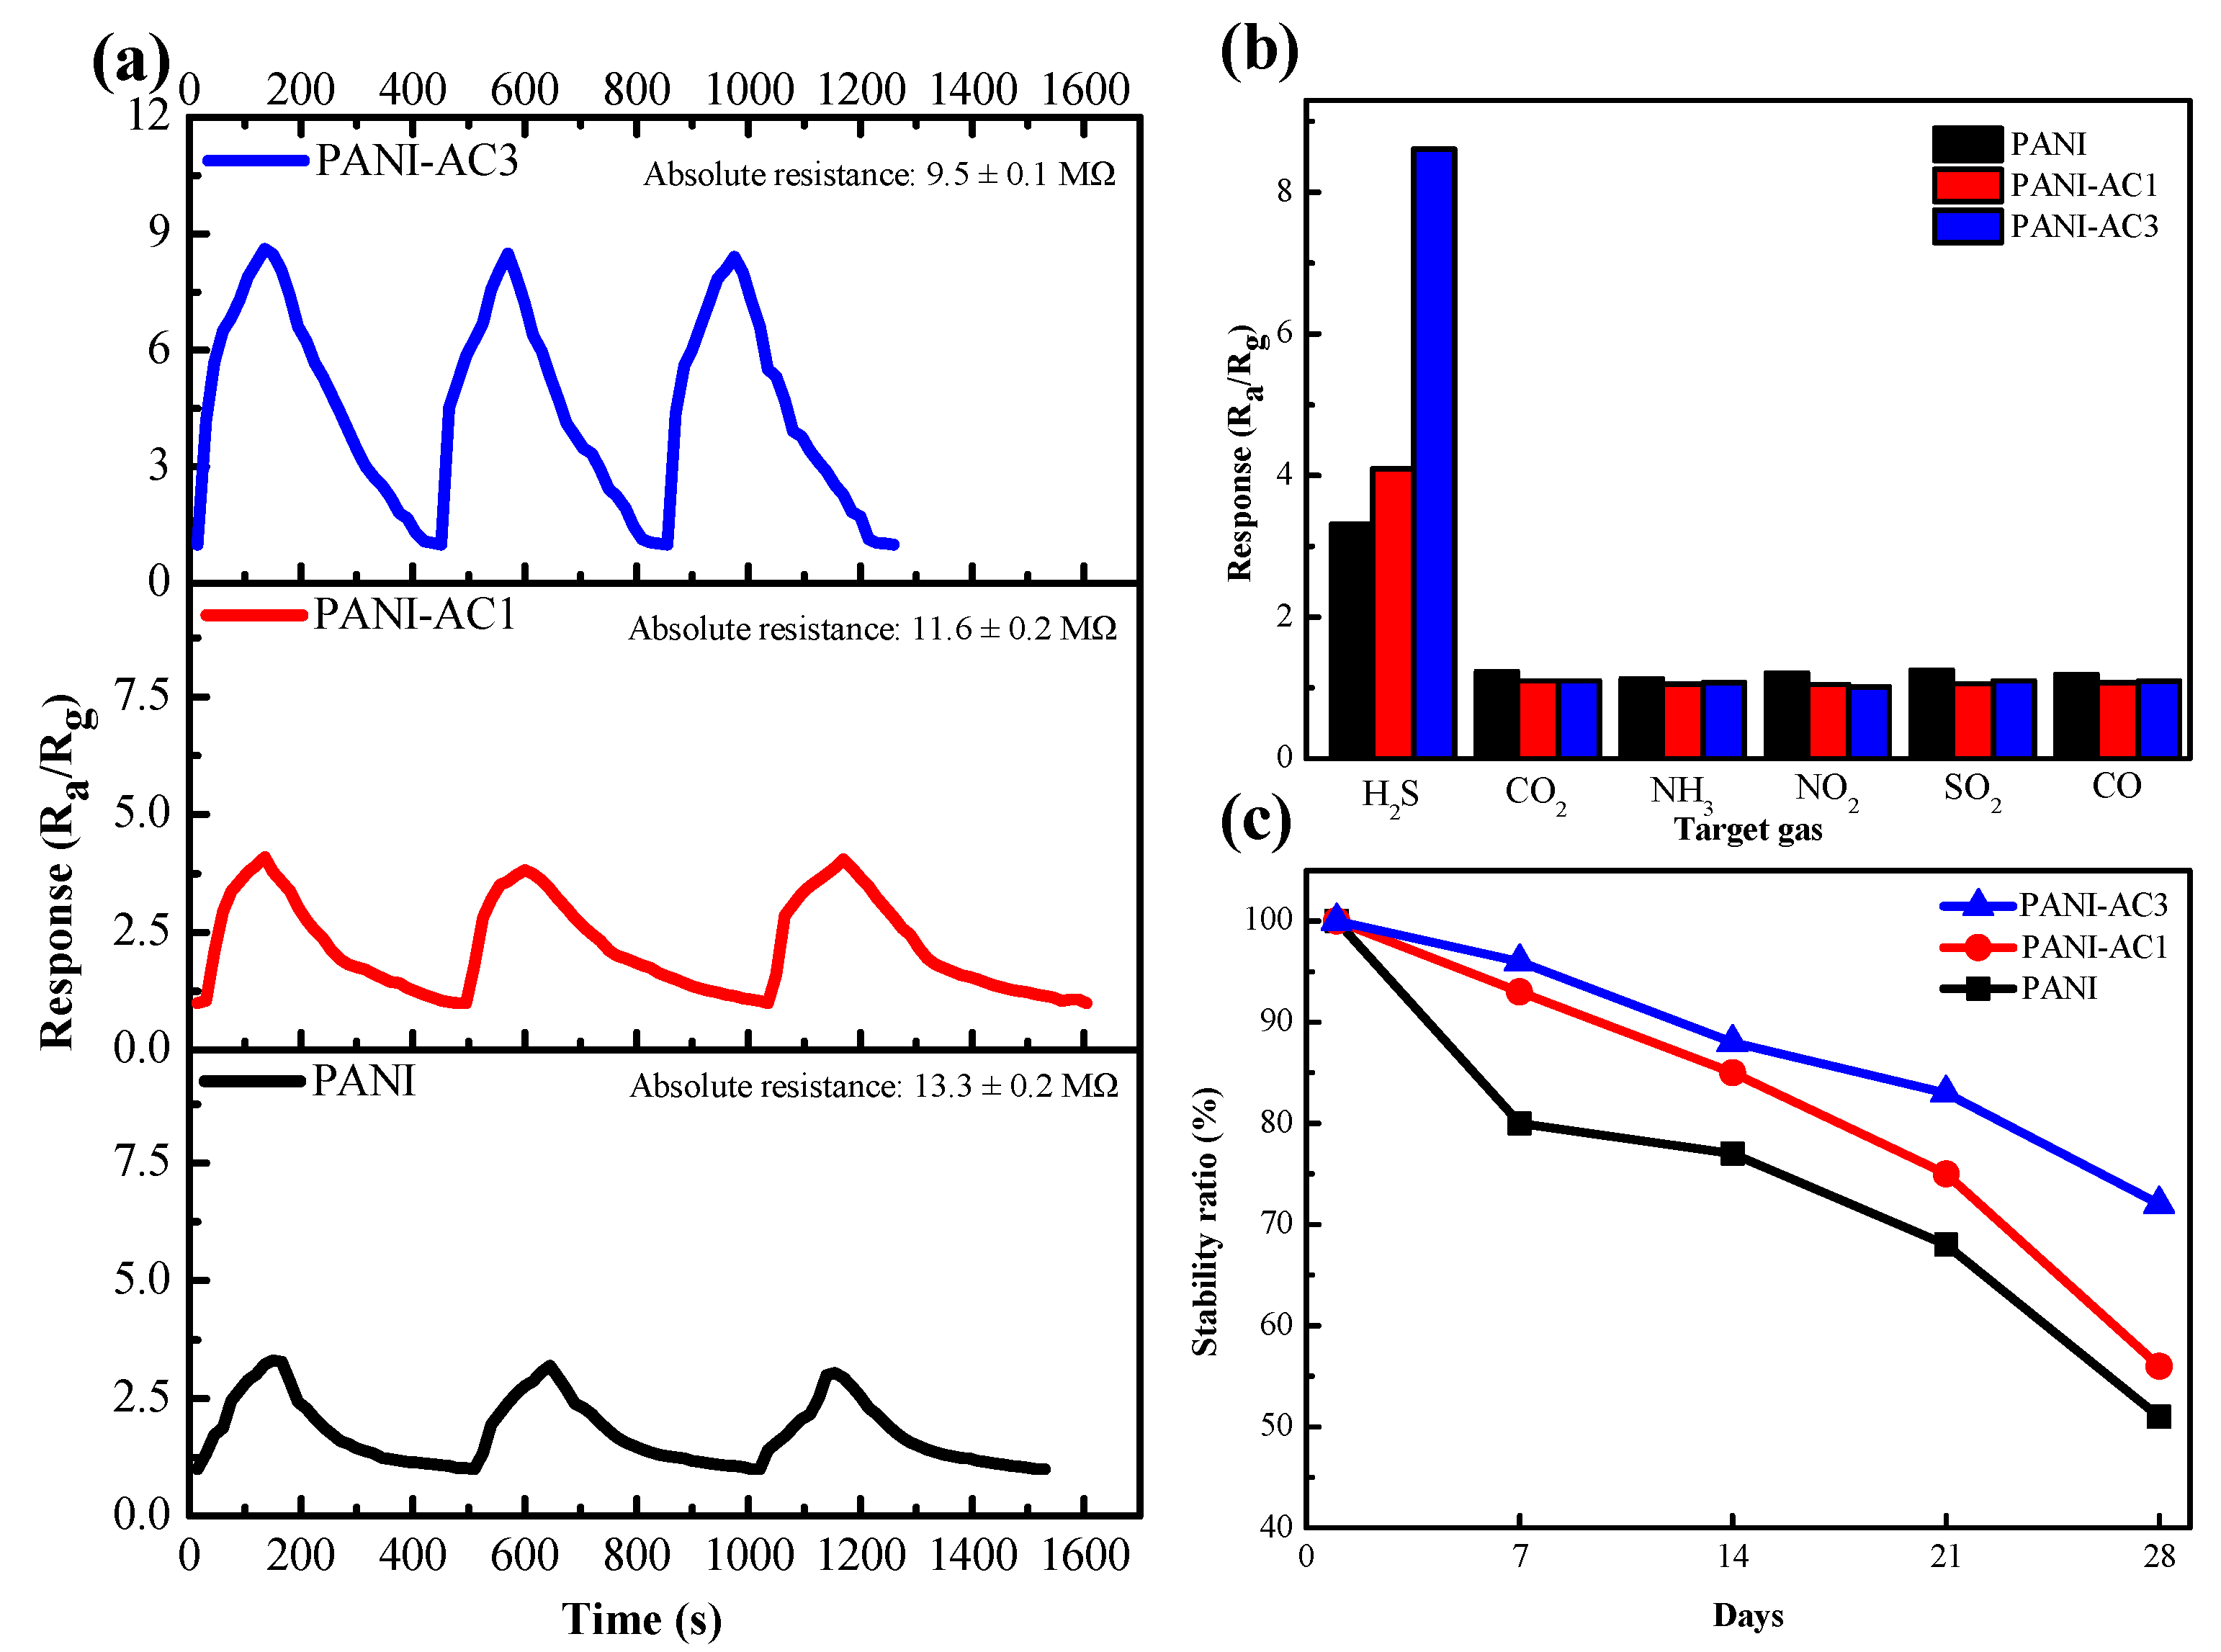
3.6.2. Repeatability, Selectivity, and Stability

The repeatability of PANI-coated, PANI-AC1-coated, and PANI-AC3-coated IDE sensors was evaluated by exposing the devices to an H2S concentration of 10 ppm for three adsorption–desorption cycles, as shown in Figure 7a. The PANI-AC3-coated IDE sensor exhibited highly repeatable and constant responses throughout each cycle, indicating its excellent repeatability. By contrast, the PANI-coated IDE sensor remained at a consistent lower response throughout the three tests. Furthermore, all sensors fully recovered after multiple adsorption–desorption cycles, indicating the reversibility of H2S gas sensing.
To evaluate the selectivity of the as-fabricated sensors, in addition to H2S, five other common toxic and hazardous gases, namely CO2, NH3, NO2, SO2, and CO, were tested at the same concentration (i.e., 10 ppm). As shown in Figure 7b, the sensors exhibited a higher selectivity toward H2S than toward the other gases. Despite the stronger acidity of nitric and sulfuric acids compared to hydrosulfuric acid, NO2 and SO2 interacted directly with PANI without undergoing dissociation for doping, leading to distinct sensing behaviors [42,43,44]. Notably, the PANI-AC3-coated IDE sensor showed a markedly higher selectivity toward H2S than the PANI-coated IDE sensor.
Stability (Figure 7c) was determined by continuously measuring the response values of the PANI-coated, PANI-AC1-coated, and PANI-AC3-coated IDE sensors to 10 ppm H2S gas at room temperature for 7, 14, 21, and 28 days. The stability ratio was estimated using Equation (1):
Stability ratio (%) = Rs/Rs0 × 100%,
where Rs0 and Rs represent the recorded resistance on the first day and the following days, respectively. The response values of all the sensors decreased with time. After 28 days, the stability ratio of the PANI-coated IDE sensor remained at 51%, whereas those of the PANI-AC1-coated and PANI-AC3-coated IDE sensors were as high as 56% and 72%, respectively. This result indicates the robustness of the sensor, which provides reproducible results within 28 days, and the stability improved with the increasing load of AC.
In Table 3, the sensing properties of H2S gas sensors based on a variety of conductive polymers and composites are summarized. Among these materials, the PANI-AC3 composite developed in this study stands out with its notable response to H2S gas at room temperature, achieving a response value of 8.6 at a concentration of 10 ppm. This promising result indicates that the PANI-AC3 composite has the potential to be a sensitive and reliable material for H2S gas-sensing applications. The use of agricultural-waste-derived AC in the composite also demonstrates the potential for sustainable and eco-friendly approaches to material development.

3.7. Gas-Sensing Mechanism

The gas-sensing mechanism primarily hinged on the intrinsic properties of PANI, with the reversible doping process playing a pivotal role [70]. A reversible acid/base doping process is often observed, with the doped form being conductive and the dedoped form being insulative. When exposed to H2S in a humid environment, it can react with water molecules and dissociate into H+ and HS ions, where the H+ ion has doped PANI, increasing the conductivity of the polymer chain by increasing the number of holes in the chain [16]. When PANI is exposed to a reduced concentration of H2S, the following doping reactions can occur [60]:
H 2 S   H 2 O H + + HS
PANI + H + PANIH +
In the PANI-AC composite, the incorporation of AC has been found to markedly improve its sensing performance, particularly toward H2S. This improvement was attributed to the heightened specific surface area, creating a surplus of active sites for H+ molecules, thereby enhancing the doping capability of the material and subsequently amplifying the sensor’s response to H2S. The observed enhancements in response values for the PANI-AC composites underscored the efficacy of this approach [59]. Furthermore, the introduction of AC contributed to heightened selectivity and stability, positioning the sensor as a highly promising candidate for practical gas-sensing applications. This emphasized the dominance of doping capability in the gas-sensing mechanism.

4. Conclusions

In this study, a sensitive H2S gas sensor was successfully fabricated using an IDE with PANI and PANI-AC composite coatings operating at room temperature (i.e., 25 ± 0.5 °C) and 60% relative humidity. PANI was synthesized via the oxidation coupling polymerization of an aniline monomer, whereas AC was synthesized via the calcination of coconut husk, an agricultural waste, at up to 800 °C with ZnCl2 as the catalyst. Calcined carbon and AC were identified via Raman spectroscopy. Subsequently, the composites were prepared using a physical mixing method. AC and its composites, containing PANI-AC1 and PANI-AC3, were characterized via FTIR spectroscopy, as well as BET, SEM, and CV. The H2S-sensing performance of PANI and its composites was investigated herein. Notably, the PANI-AC3 composite showed a higher sensing response to H2S with higher repeatability and stability than neat PANI. The increased H2S-sensing response of the PANI-AC composites was attributed to the large surface area of AC, which provided abundant active sites, resulting in an enhanced redox and doping capacity. The response of the sensors based on PANI-AC1 and PANI-AC3 increased by 1.34 and 3.16 times, respectively. Moreover, the as-prepared sensors exhibited a high sensing selectivity toward H2S, with minimal to negligible responses toward other gases. Therefore, the development of PANI-AC gas sensors holds great promise for the recycling and utilization of agricultural waste and for advancing the field of gas sensing.

Author Contributions

Conceptualization, K.-H.L.; Methodology, J.-M.Y.; Validation, H.-C.C.; Formal analysis, J.-Y.K.; Resources, Y.-J.L.; Data curation, Y.-H.H.; Writing—original draft, K.-H.L.; Writing—review & editing, M.Y. and Y.-J.L.; Supervision, Y.-J.L. and J.-M.Y. All authors have read and agreed to the published version of the manuscript.

Funding

This research received external funding from the National Science and Technology Council, Taiwan, R.O.C. (grant number: NSTC110-2113-M-033-007).

Institutional Review Board Statement

Not applicable.

Data Availability Statement

The data that support the findings of this study are available from the corresponding author, but restrictions apply to the availability of these data, which were used under license for the current study, and so are not publicly available. The data are, however, available from the authors upon reasonable request and with permission of the funding party, Ministry of Science and Technology, Taiwan, R.O.C.

Conflicts of Interest

The authors declare no conflict of interest.

References

  1. Liu, S.; Yang, W.; Liu, L.; Chen, H.; Liu, Y. Enhanced H2S Gas-Sensing Performance of Ni-Doped ZnO Nanowire Arrays. ACS Omega 2023, 8, 7595–7601. [Google Scholar] [CrossRef] [PubMed]
  2. Zuo, P.; Wang, R.; Li, F.; Wu, F.; Xu, G.; Niu, W. A trace ppb-level electrochemical H2S sensor based on ultrathin Pt nanotubes. Talanta 2021, 233, 122539. [Google Scholar] [CrossRef] [PubMed]
  3. Laurent, D.; Barré, G.; Durlet, C.; Cartigny, P.; Carpentier, C.; Paris, G.; Collon, P.; Pironon, J.; Gaucher, E.C. Unravelling biotic versus abiotic processes in the development of large sulfuric-acid karsts. Geology 2023, 51, 262–267. [Google Scholar] [CrossRef]
  4. Sun, X.; Huang, W.; Ji, L.; Xu, H.; Qu, Z.; Yan, N. Establishing a Self-supporting System of H2S Production from SO2 with Induced Catalytic Reduction Process for Mercury Capture with Super-large Enrichment. Chem. Eng. J. 2023, 459, 141493. [Google Scholar] [CrossRef]
  5. Zhang, J.; Ma, L.; Liu, Y.; Tong, X.; Zhou, Y. Hydrogen sulfide poisoning in forensic pathology and toxicology: Mechanism and metabolites quantification analysis. Crit. Rev. Toxicol. 2023, 52, 742–756. [Google Scholar] [CrossRef]
  6. Deng, G.; Muqadas, M.; Adlat, S.; Zheng, H.; Li, G.; Zhu, P.; Nasser, M.I. Protective Effect of Hydrogen Sulfide on Cerebral Ischemia–Reperfusion Injury. Cell. Mol. Neurobiol. 2023, 43, 15–25. [Google Scholar] [CrossRef]
  7. Wang, Y.; Zhang, S.; Xiao, D.; Wang, S.; Zhang, T.; Yang, X.; Heng, S.; Sun, M. CuO/WO3 hollow microsphere P-N heterojunction sensor for continuous cycle detection of H2S gas. Sens. Actuators B Chem. 2023, 374, 132823. [Google Scholar] [CrossRef]
  8. Zhang, B.; Li, M.; Song, Z.; Kan, H.; Yu, H.; Liu, Q.; Zhang, G.; Liu, H. Sensitive H2S gas sensors employing colloidal zinc oxide quantum dots. Sens. Actuators B Chem. 2017, 249, 558–563. [Google Scholar] [CrossRef]
  9. Bang, J.H.; Mirzaei, A.; Choi, M.S.; Han, S.; Lee, H.Y.; Kim, S.S.; Kim, H.W. Decoration of multi-walled carbon nanotubes with CuO/Cu2O nanoparticles for selective sensing of H2S gas. Sens. Actuators B Chem. 2021, 344, 130176. [Google Scholar] [CrossRef]
  10. Keshtkar, S.; Rashidi, A.; Kooti, M.; Askarieh, M.; Pourhashem, S.; Ghasemy, E.; Izadi, N. A novel highly sensitive and selective H2S gas sensor at low temperatures based on SnO2 quantum dots-C60 nanohybrid: Experimental and theory study. Talanta 2018, 188, 531–539. [Google Scholar] [CrossRef]
  11. Kapse, V.D.; Ghosh, S.A.; Chaudhari, G.N.; Raghuwanshi, F.C. Nanocrystalline In2O3-based H2S sensors operable at low temperatures. Talanta 2008, 76, 610–616. [Google Scholar] [CrossRef] [PubMed]
  12. Bodade, A.B.; Bodade, A.B.; Wankhade, H.G.; Chaudhari, G.N.; Kothari, D.C. Conduction mechanism and gas sensing properties of CoFe2O4 nanocomposite thick films for H2S gas. Talanta 2012, 89, 183–188. [Google Scholar] [CrossRef] [PubMed]
  13. Qu, F.; Zhang, S.; Huang, C.; Guo, X.; Zhu, Y.; Thomas, T.; Guo, H.; Attfield, J.P.; Yang, M. Surface Functionalized Sensors for Humidity-Independent Gas Detection. Angew. Chem. Int. Ed. Engl. 2021, 60, 6561–6566. [Google Scholar] [CrossRef] [PubMed]
  14. Gautam, S.K.; Panda, S. Effect of moisture and molecular weight of polyaniline on H2S sensing characteristics. Sens. Actuators B Chem. 2021, 344, 130323. [Google Scholar] [CrossRef]
  15. Yavarinasab, A.; Janfaza, S.; Tahmooressi, H.; Ghazi, M.; Tasnim, N.; Hoorfar, M. A selective polypyrrole-based sub-ppm impedimetric sensor for the detection of dissolved hydrogen sulfide and ammonia in a mixture. J. Hazard. Mater. 2021, 416, 125892. [Google Scholar] [CrossRef] [PubMed]
  16. Agbor, N.; Petty, M.; Monkman, A. Polyaniline thin films for gas sensing. Sens. Actuators B Chem. 1995, 28, 173–179. [Google Scholar] [CrossRef]
  17. Lv, D.; Shen, W.; Chen, W.; Wang, Y.; Tan, R.; Zhao, M.; Song, W. One-step preparation of flexible citric acid-doped polyaniline gas sensor for ppb-level ammonia detection at room temperature. Sens. Actuators A Phys. 2023, 350, 114120. [Google Scholar] [CrossRef]
  18. Tan, W.; Zhang, X.; Zhang, H.; Wu, C.; Su, Y.; Li, P.; Jiang, J.; Liu, A.; Li, H.; Yang, Q. Investigation on the electromagnetic interference shielding performance of hydrochloric acid doped polyaniline: An insight into the protonation. J. Mater. Sci. Mater. Electron. 2023, 34, 769. [Google Scholar] [CrossRef]
  19. Liu, S.; Qin, Y.; Bai, Y. Highly response and humidity-resistant gas sensor based on polyaniline-functionalized Bi2MoO6 with UV activation. Electrochim. Acta 2022, 427, 140863. [Google Scholar] [CrossRef]
  20. Kumar, A.; Kostikov, Y.; Zanatta, M.; Sorarù, G.D.; Orberger, B.; Nessim, G.D.; Mariotto, G. Carbon nanotubes synthesis using siliceous breccia as a catalyst source. Diam. Relat. Mater. 2019, 97, 107433. [Google Scholar] [CrossRef]
  21. Barraza-García, F.d.J.; Caballero-Briones, F.; Morelos-Gómez, A.; Martínez-Villegas, N.; Hernández-Martínez, J.L.; Endo, M.; López-Urías, F.; Muñoz-Sandoval, E. The synthesis of sponge-type nitrogen-doped multiwall carbon nanotubes using ball-milled natural red-leptosol as catalyst precursor: A cycle voltammetry study. Carbon 2022, 196, 510–524. [Google Scholar] [CrossRef]
  22. Rathour, R.K.; Devi, M.; Dahiya, P.; Sharma, N.; Kaushik, N.; Kumari, D.; Kumar, P.; Baadhe, R.R.; Walia, A.; Bhatt, A.K. Recent trends, opportunities and challenges in sustainable management of rice straw waste biomass for green biorefinery. Energies 2023, 16, 1429. [Google Scholar] [CrossRef]
  23. Adetona, A.B.; Layzell, D.B. Diverting residual biomass to energy use: Quantifying the global warming potential of biogenic CO2 (GWPbCO2). GCB Bioenergy 2023, 15, 697–709. [Google Scholar] [CrossRef]
  24. Yadav, R.; Singh, S.; Kaur, A.; Tokas, D.; Kathi, S.; Singh, A.N. Harnessing Energy from Animal Waste: A Win–Win Approach for India. In Manure Technology and Sustainable Development; Springer: Berlin/Heidelberg, Germany, 2023; pp. 283–304. [Google Scholar]
  25. Jayanthi, V.; Avudaiappan, S.; Amran, M.; Arunachalam, K.P.; Qader, D.N.; Delgado, M.C.; Flores, E.I.S.; Rashid, R.S. Innovative use of micronized biomass silica-GGBS as agro-industrial by-products for the production of a sustainable high-strength geopolymer concrete. Case Stud. Constr. Mater. 2023, 18, e01782. [Google Scholar] [CrossRef]
  26. Polvara, E.; Gallego, E.; Invernizzi, M.; Perales, J.F.; Sironi, S. Chemical characterization of odorous emissions: A comparative performance study of different sampling methods. Talanta 2023, 253, 124110. [Google Scholar] [CrossRef]
  27. Safian, M.T.-U.; Sekeri, S.H.; Yaqoob, A.A.; Serrà, A.; Jamudin, M.D.; Mohamad Ibrahim, M.N. Utilization of lignocellulosic biomass: A practical journey towards the development of emulsifying agent. Talanta 2022, 239, 123109. [Google Scholar] [CrossRef] [PubMed]
  28. Chaudhary, R.; Maji, S.; Shrestha, R.G.; Shrestha, R.L.; Shrestha, T.; Ariga, K.; Shrestha, L.K. Jackfruit Seed-Derived Nanoporous Carbons as the Electrode Material for Supercapacitors. C 2020, 6, 73. [Google Scholar] [CrossRef]
  29. Wang, N.; Ye, J.-X.; Sun, J.-B.; Zhang, X.-F.; Deng, Z.-P.; Xu, Y.-M.; Huo, L.-H.; Gao, S. Rapid and accurate detection of highly toxic NO2 gas based on catkins biomass-derived porous In2O3 microtubes at low temperature. Sens. Actuators B Chem. 2022, 361, 131692. [Google Scholar] [CrossRef]
  30. Fan, W.; Zhang, H.; Wang, H.; Zhao, X.; Sun, S.; Shi, J.; Huang, M.; Liu, W.; Zheng, Y.; Li, P. Dual-doped hierarchical porous carbon derived from biomass for advanced supercapacitors and lithium ion batteries. RSC Adv. 2019, 9, 32382–32394. [Google Scholar] [CrossRef]
  31. Kaipannan, S.; Marappan, S. Fabrication of 9.6 V High-performance Asymmetric Supercapacitors Stack Based on Nickel Hexacyanoferrate-derived Ni(OH)2 Nanosheets and Bio-derived Activated Carbon. Sci. Rep. 2019, 9, 1104. [Google Scholar] [CrossRef]
  32. Liu, S.; Pan, M.; Feng, Z.; Qin, Y.; Wang, Y.; Tan, L.; Sun, T. Ultra-high adsorption of tetracycline antibiotics on garlic skin-derived porous biomass carbon with high surface area. New J. Chem. 2020, 44, 1097–1106. [Google Scholar] [CrossRef]
  33. Ghosh, S.; Santhosh, R.; Jeniffer, S.; Raghavan, V.; Jacob, G.; Nanaji, K.; Kollu, P.; Jeong, S.K.; Grace, A.N. Natural biomass derived hard carbon and activated carbons as electrochemical supercapacitor electrodes. Sci. Rep. 2019, 9, 16315. [Google Scholar] [CrossRef] [PubMed]
  34. Yorgun, S.; Vural, N.; Demiral, H. Preparation of high-surface area activated carbons from Paulownia wood by ZnCl2 activation. Microporous Mesoporous Mater. 2009, 122, 189–194. [Google Scholar] [CrossRef]
  35. Hoang, A.T.; Nižetić, S.; Cheng, C.K.; Luque, R.; Thomas, S.; Banh, T.L.; Nguyen, X.P. Heavy metal removal by biomass-derived carbon nanotubes as a greener environmental remediation: A comprehensive review. Chemosphere 2022, 287, 131959. [Google Scholar] [CrossRef]
  36. Idris, M.O.; Guerrero–Barajas, C.; Kim, H.-C.; Yaqoob, A.A.; Ibrahim, M.N.M. Scalability of biomass-derived graphene derivative materials as viable anode electrode for a commercialized microbial fuel cell: A systematic review. Chin. J. Chem. Eng. 2022, 55, 277–292. [Google Scholar] [CrossRef]
  37. Teng, Y.; Zhang, X.-F.; Xu, T.-T.; Deng, Z.-P.; Xu, Y.-M.; Huo, L.-H.; Gao, S. A spendable gas sensor with higher sensitivity and lowest detection limit towards H2S: Porous α-Fe2O3 hierarchical tubule derived from poplar branch. Chem. Eng. J. 2020, 392, 123679. [Google Scholar] [CrossRef]
  38. Li, C.; Song, B.-Y.; Teng, Y.; Zhang, X.-F.; Deng, Z.-P.; Xu, Y.-M.; Huo, L.-H.; Gao, S. Biomass-derived hierarchical porous ZnO microtubules for highly selective detection of ppb-level nitric oxide at low temperature. Sens. Actuators B Chem. 2021, 333, 129627. [Google Scholar] [CrossRef]
  39. Zhao, D.-L.; Zeng, X.-W.; Shen, Z.-M. Synthesis of carbon nanotube/polyaniline composite nanotube and its microwave permittivity. Acta Phys. Sin. 2005, 54, 3878–3883. [Google Scholar] [CrossRef]
  40. Zheng, B.-n.; Gao, C. Preparation of graphene nanoscroll/polyaniline composites and their use in high performance supercapacitors. New Carbon Mater. 2016, 31, 315–320. [Google Scholar] [CrossRef]
  41. Tran, T.P.; Do, Q.H. High-Performance Supercapacitor Electrode Based on Buckypaper/Polyaniline Composite. J. Electron. Mater. 2017, 46, 6056–6062. [Google Scholar] [CrossRef]
  42. Papageorgiou, D.G.; Kinloch, I.A.; Young, R.J. Graphene/elastomer nanocomposites. Carbon 2015, 95, 460–484. [Google Scholar] [CrossRef]
  43. Megha, R.; Ravikiran, Y.T.; Chethan, B.; Raj Prakash, H.G.; Vijaya Kumari, S.C.; Thomas, S. Effect of mechanical mixing method of preparation of polyaniline-transition metal oxide composites on DC conductivity and humidity sensing response. J. Mater. Sci. Mater. Electron. 2018, 29, 7253–7261. [Google Scholar] [CrossRef]
  44. Gospodinova, N.; Terlemezyan, L. Conducting polymers prepared by oxidative polymerization: Polyaniline. Prog. Polym. Sci. 1998, 23, 1443–1484. [Google Scholar] [CrossRef]
  45. Shrestha, R.L.; Shrestha, T.; Tamrakar, B.M.; Shrestha, R.G.; Maji, S.; Ariga, K.; Shrestha, L.K. Nanoporous carbon materials derived from washnut seed with enhanced supercapacitance. Materials 2020, 13, 2371. [Google Scholar] [CrossRef] [PubMed]
  46. Hirst, E.A.; Taylor, A.; Mokaya, R. A simple flash carbonization route for conversion of biomass to porous carbons with high CO2 storage capacity. J. Mater. Chem. A 2018, 6, 12393–12403. [Google Scholar] [CrossRef]
  47. Valencia, A.; Muñiz-Valencia, R.; Ceballos-Magaña, S.G.; Rojas-Mayorga, C.K.; Bonilla-Petriciolet, A.; González, J.; Aguayo-Villarreal, I.A. Cyclohexane and benzene separation by fixed-bed adsorption on activated carbons prepared from coconut shell. Environ. Technol. Innov. 2022, 25, 102076. [Google Scholar] [CrossRef]
  48. Rawal, S.; Joshi, B.; Kumar, Y. Synthesis and characterization of activated carbon from the biomass of Saccharum bengalense for electrochemical supercapacitors. J. Energy Storage 2018, 20, 418–426. [Google Scholar] [CrossRef]
  49. Sujiono, E.H.; Zabrian, D.; Zurnansyah; Mulyati; Zharvan, V.; Samnur; Humairah, N.A. Fabrication and characterization of coconut shell activated carbon using variation chemical activation for wastewater treatment application. Results Chem. 2022, 4, 100291. [Google Scholar] [CrossRef]
  50. Kesavan, T.; Partheeban, T.; Vivekanantha, M.; Kundu, M.; Maduraiveeran, G.; Sasidharan, M. Hierarchical nanoporous activated carbon as potential electrode materials for high performance electrochemical supercapacitor. Microporous Mesoporous Mater. 2019, 274, 236–244. [Google Scholar] [CrossRef]
  51. Abdulla, S.; Mathew, T.L.; Pullithadathil, B. Highly sensitive, room temperature gas sensor based on polyaniline-multiwalled carbon nanotubes (PANI/MWCNTs) nanocomposite for trace-level ammonia detection. Sens. Actuators B Chem. 2015, 221, 1523–1534. [Google Scholar] [CrossRef]
  52. Chonat, A.; Palatty, S. Enhanced electrochemical performance of a hybrid supercapacitive material based on ternary doped polyaniline/activated carbon composite. Energy Fuels 2020, 34, 10148–10159. [Google Scholar] [CrossRef]
  53. Divyashree, A.; Manaf, S.A.B.A.; Yallappa, S.; Chaitra, K.; Kathyayini, N.; Hegde, G. Low cost, high performance supercapacitor electrode using coconut wastes: Eco-friendly approach. J. Energy Chem. 2016, 25, 880–887. [Google Scholar]
  54. Li, S.; Zhang, N.; Zhou, H.; Li, J.; Gao, N.; Huang, Z.; Jiang, L.; Kuang, Y. An all-in-one material with excellent electrical double-layer capacitance and pseudocapacitance performances for supercapacitor. Appl. Surf. Sci. 2018, 453, 63–72. [Google Scholar] [CrossRef]
  55. Zaihua, D.; Qiuni, Z.; Si, W.; Qi, H.; Zhen, Y.; Yajie, Z.; Yadong, J.; Huiling, T. Halloysite nanotubes: Natural, environmental-friendly and low-cost nanomaterials for high-performance humidity sensor. Sens. Actuators B Chem. 2020, 317, 128204. [Google Scholar]
  56. Wang, J.; Zhang, D.; Gao, Y.; Chen, F.; Wang, T.; Xia, H.; Sui, X.; Wang, Z. Fast-response hydrogen sulfide gas sensor based on electrospinning Co3O4 nanofibers-modified CuO nanoflowers: Experimental and DFT calculation. Sens. Actuators B Chem. 2023, 396, 134579. [Google Scholar] [CrossRef]
  57. Ahmed, M.M.M.; Chi, Y.-T.; Hung, Y.-H.; Reyes, L.M.C.; Yeh, J.-M. UV-cured electroactive polyurethane acrylate coatings with superhydrophobic surface structure of biomimetic peacock feather for anticorrosion application. Prog. Org. Coat. 2022, 165, 106679. [Google Scholar] [CrossRef]
  58. Yoon, S.-B.; Yoon, E.-H.; Kim, K.-B. Electrochemical properties of leucoemeraldine, emeraldine, and pernigraniline forms of polyaniline/multi-wall carbon nanotube nanocomposites for supercapacitor applications. J. Power Sources 2011, 196, 10791–10797. [Google Scholar] [CrossRef]
  59. Dhand, C.; Arya, S.K.; Singh, S.P.; Singh, B.P.; Datta, M.; Malhotra, B.D. Preparation of polyaniline/multiwalled carbon nanotube composite by novel electrophoretic route. Carbon 2008, 46, 1727–1735. [Google Scholar] [CrossRef]
  60. Bibi, A.; Rubio, Y.R.M.; Xian-Lun, L.; Sathishkumar, N.; Chen, C.-Y.; Santiago, K.S.; Chen, H.-T.; Lin, Y.-F.; Yeh, J.-M. Detection of hydrogen sulfide using polyaniline incorporated with graphene oxide aerogel. Synth. Met. 2021, 282, 116934. [Google Scholar] [CrossRef]
  61. Wang, L.; Huang, H.; Xiao, S.; Cai, D.; Liu, Y.; Liu, B.; Wang, D.; Wang, C.; Li, H.; Wang, Y.; et al. Enhanced Sensitivity and Stability of Room-Temperature NH3 Sensors Using Core–Shell CeO2 Nanoparticles@Cross-linked PANI with p–n Heterojunctions. ACS Appl. Mater. Interfaces 2014, 6, 14131–14140. [Google Scholar] [CrossRef]
  62. Akber, H.J.; Ibrahim, I.M.; Razeg, K.H. Hydrothermal Synthesis of Polyaniline Nano-fibers as H2S Gas Sensor. J. Phys. Conf. Ser. 2020, 1664, 012017. [Google Scholar] [CrossRef]
  63. Bai, S.; Zhang, K.; Sun, J.; Zhang, D.; Luo, R.; Li, D.; Liu, C. Polythiophene-WO3 hybrid architectures for low-temperature H2S detection. Sens. Actuators B Chem. 2014, 197, 142–148. [Google Scholar] [CrossRef]
  64. Nerkar, D.M.; Jaware, S.E.; Padhye, G. Fabrication of a Novel Flexible Room Temperature Hydrogen Sulfide (H2S) Gas Sensor based on Polypyrrole Films. Int. J. Sci. Res. 2016, 5, 106–111. [Google Scholar] [CrossRef]
  65. Hosseini-Shokouh, S.H.; Zhou, J.; Berger, E.; Lv, Z.-P.; Hong, X.; Virtanen, V.; Kordas, K.; Komsa, H.-P. Highly Selective H2S Gas Sensor Based on Ti3C2Tx MXene–Organic Composites. ACS Appl. Mater. Interfaces 2023, 15, 7063–7073. [Google Scholar] [CrossRef] [PubMed]
  66. Abu-Hani, A.F.S.; Awwad, F.; Greish, Y.E.; Ayesh, A.I.; Mahmoud, S.T. Design, fabrication, and characterization of low-power gas sensors based on organic-inorganic nano-composite. Org. Electron. 2017, 42, 284–292. [Google Scholar] [CrossRef]
  67. Hasan, M.; Ibrahim, I.M.; Bakr, N. The Sensitivity of PolyPyrrole NanoTube/(Ag NanoParticle, Ag-NiO nanocomposite) Against H2S Toxic Gas at Low Temperature. Sens. Transducers 2020, 243, 31–41. [Google Scholar]
  68. Garg, R.; Kumar, V.; Kumar, D.; Chakarvarti, S.K. Polypyrrole Microwires as Toxic Gas Sensors for Ammonia and Hydrogen Sulphide. J. Syst. Integr. 2015, 3, 1–13. [Google Scholar] [CrossRef]
  69. Geng, L. Gas sensitivity study of polypyrrole/WO3 hybrid materials to H2S. Synth. Met. 2010, 160, 1708–1711. [Google Scholar] [CrossRef]
  70. Bai, H.; Shi, G. Gas sensors based on conducting polymers. Sensors 2007, 7, 267–307. [Google Scholar] [CrossRef]
Scheme 1. Synthesis of PANI and its reversible doping behavior.
Polymers 15 04554 sch001
Scheme 2. Flow chart for the preparation of CC and AC.
Polymers 15 04554 sch002
Scheme 3. Preparation of PANI, PANI-AC1, and PANI-AC3-coated IDE sensors for measuring gas-sensing properties.
Polymers 15 04554 sch003
Scheme 4. Schematic diagram of the gas-sensing apparatus.
Polymers 15 04554 sch004
Figure 1. Raman spectra of CC and AC.
Polymers 15 04554 g001
Figure 2. (a) FTIR spectra of CC, AC; (b) ATR-FTIR spectra of PANI, PANI-AC1, and PANI-AC3.
Polymers 15 04554 g002
Figure 3. (a) N2 (77K) adsorption/desorption isotherms of (a) CC and AC; (b) PANI, PANI-AC1, and PANI-AC3.
Polymers 15 04554 g003
Figure 4. SEM image of the surface structure of the (a) CC, with a magnification of 10,000, (b) AC, with a magnification of 300,000; SEM image of the surface structure of PANI and PANI composites, with a magnification of 10,000. (c) Structure diagram of PANI, (d) PANI-AC1, and (e) PANI-AC3.
Polymers 15 04554 g004
Figure 5. Cyclic voltammogram showing the redox capabilities of PANI, PANI-AC1, and PANI-AC3.
Polymers 15 04554 g005
Figure 6. (a) Sensitivity of the IDE sensor device with the PANI, PANI-AC1, and PANI-AC3 coating at various concentrations of H2S ranging from 1 ppm to 30 ppm, respectively. (b) Linear calibration curves of the aforementioned IDE sensors exposed to 1–30 ppm H2S concentration at +0.1 V. (c) Comparison response of the aforementioned IDE sensors exposed to 10 ppm H2S with 40%, 60%, and 80% RH. Inset: comparison response of the aforementioned IDE sensors exposed to 10 ppm H2S with 40%, 60%, and 80% RH.
Polymers 15 04554 g006
Figure 7. (a) Repeatability of the PANI, PANI-AC1, and PANI-AC3-coated IDE sensors at an H2S concentration of 10 ppm. (b) Selectivity of the aforementioned sensors exposed to six different gases (concentration = 10 ppm). (c) Stability of the aforementioned sensors (concentration = 10 ppm).
Polymers 15 04554 g007
Table 1. BET analysis of CC, AC, PANI, PANI-AC1, and PANI-AC3.
Sample CodeSBET (m2/g) aVt (cm3/g) bDp (nm) c
CC50.0142.7
AC17181.102.6
PANI380.2122.8
PANI-AC12250.4316.6
PANI-AC34160.934.2
a BET surface area. b Total pore volume calculated from P/P0 = 0.99. c Pore diameter.
Table 2. Conductivities of the undoped, doped, dedoped, and redoped forms of PANI, PANI-AC1, and PANI-AC3.
Sample CodeConductivity (S/cm)
UndopedDopedDedopedRedoped
PANI6.02 × 10−62.24 × 10−36.42 × 10−62.2 × 10⁻³
PANI-AC16.35 × 10−64.96 × 10−37.07 × 10−64.46 × 10⁻³
PANI-AC37.60 × 10−63.87 × 10−27.81 × 10−63.65 × 10⁻²
Table 3. Performance comparison of other conductive polymers-based H2S sensors with different morphology with the present work.
Sample CodeResponse (Ra/Rg)Gas Concentration (ppm)Operating Temperature
(°C)
Ref.
PANI-NF7.3225150[62]
PTh-WO31.420070[63]
PPy film51025[64]
Ti3C2Tx/PDS-Cl2.2530[65]
PVA-IL-WO3151080[66]
Ag NPs-PPy NTs1.32025[67]
PPy microwire1.8520025[68]
PPy/WO31.61100090[69]
PANI-AC38.61025This work
Disclaimer/Publisher’s Note: The statements, opinions and data contained in all publications are solely those of the individual author(s) and contributor(s) and not of MDPI and/or the editor(s). MDPI and/or the editor(s) disclaim responsibility for any injury to people or property resulting from any ideas, methods, instructions or products referred to in the content.

