Article

Separating Curing and Temperature Effects on the Temperature Coefficient of Resistance for a Single-Walled Carbon Nanotube Nanocomposite

Center for Petroleum Science and Engineering, Skolkovo Institute of Science and Technology, Bolshoy Boulevard 30 bld. 1, Moscow 121205, Russia
*
Author to whom correspondence should be addressed.
Polymers 2023, 15(2), 433; https://doi.org/10.3390/polym15020433
Submission received: 5 December 2022 / Revised: 29 December 2022 / Accepted: 9 January 2023 / Published: 13 January 2023
(This article belongs to the Special Issue Application and Development of Conductive Polymers)

Abstract

:
The temperature coefficient of resistance (TCR) determines the electrical performance of materials in electronics. For a carbon nanotube (CNT) nanocomposite, change of resistivity with temperature depends on changes in CNT intrinsic conductivity, tunnelling thresholds and distances, matrix’ coefficient of thermal expansion, and other factors. In our study, we add one more influencing factor–the degree of cure. Complexities of the curing process cause difficulties to predict, or even measure, the curing state of the polymer matrix while uncertainty in the degree of cure influences TCR measurements leading to biased values. Here we study the influence of the cure state on the TCR of a single-walled CNT/epoxy polymer nanocomposite. For the given degree of cure, TCR measurements are conducted in the temperature range 25–100 °C, followed by the next 24 h of post-curing and a new cycle of measurements, 8 cycles in total. We find that contrary to industry practice to expect a high degree of cure after 3 h at 130 °C, the curing process is far from reaching the steady state of the material and continues at least for the next 72 h at 120 °C, as we observe by changes in the material electrical resistivity. If TCR measurements are conducted in this period, we find them significantly influenced by the post-curing process continuing in parallel, leading in particular to non-monotonic temperature dependence and the appearance of negative values. The unbiased TCR values we observe only when the material reaches the steady state are no longer influenced by the heat input. The dependence becomes steady, monotonically increasing from near zero value at room temperature to 0.001 1/°C at 100 °C.

Graphical Abstract

1. Introduction

Complimentary to good mechanical performance, epoxy resins suffer from poor electrical conductivities [1,2]. Carbon nanotubes (CNTs) enhance polymer properties as a nanofiller and have been promising candidates to increase the electrical conductivities of epoxy-based nanocomposites with high precision and piezoresistive sensitivity [3,4,5,6,7]. Especially in the field of high-precision sensors [8,9,10], the influence of environment temperature [11,12] cannot be ignored for multiple polymer functionalities. Considering electrical properties, this phenomenon is commonly related to the temperature coefficient of resistance (TCR).
TCR determines the performance of electrical materials in electronics. TCR accurate values are required for the design of electronic components, especially in high-precision devices. TCR is defined as
T C R = 1 R d R d T
where R is the electrical resistance (or resistivity) of the material and dR is its change with the change in temperature dT.
TCR of a CNT/polymer nanocomposite depends extremely on the morphology of CNT networks and properties of CNTs and polymer [13]. The CNT intrinsic conductance and tunnelling (or contact) conductance between CNTs are the two basic types of conductance determining the electrical response of a CNT/ polymer nanocomposite [14,15,16,17,18]. Both are complementary one to another [9] when the leading mechanism of resistance is determined by many factors, first of all, chirality. Besides, the electrical behaviour of CNT networks is significantly influenced by CNT shapes, CNT wall count, functional surface groups, bundling, agglomeration, and CNT deformation at contacts–phenomena that are difficult to be described quantitatively. For example, experimental observations show that the interactions of tube-tube or tube-matrix could lead to structural distortions of CNTs [19,20,21]. It could substantially affect the local electrical structure and act as a strong scatter to reduce the intrinsic conductance. CNT shapes, described by curvature and torsion of their centerlines, also significantly influence the nanocomposite resistance [18]. Often studies assume a ballistic limit of infinite CNT intrinsic conductance, but detailed analysis [9] demonstrates that more experimental evidence is required, especially since experiments are often biased by CNT bundling (van der Waals attraction causing single-walled CNTs to form bundles) and CNT agglomeration (entanglement). Moreover, the investigations of humidity effects [22,23,24,25] show that the resistivity of CNT networks exponentially depends on the development of water absorption. All mentioned factors influence the TCR of a studied material leading to complex analyses in support of experimental observations.
As electrical materials, CNT nanocomposites find wide applications nowadays with several studies addressing the TCRs of these materials. Approaches to effectively tailor the TCR of CNT/polymer nanocomposites, including zero and/or enhanced TCR, have been developed. Skákalová et al. [26] measured and compared the electronic transport properties of individual multi-walled carbon nanotubes (MWCNTs) and individual single-walled carbon nanotubes (SWCNTs), as well as their networks of varying thickness, not infused with polymer. They found mostly negative TCRs at low temperatures below room temperature but argued about the presence of a peak in conductance-temperature dependence at high temperatures. Negative TCRs were as well reported for non-infused aligned CNT forests by Lee et al. [27]. Gong et al. [13,28] investigated the influence of temperature on the MWCNT/epoxy nanocomposite TCRs as critical for high-accuracy sensors. Observing complex temperature behaviour, the authors argued it resulted from the competition of the tunnelling and thermal expansion of the polymer matrix. Varying the loading of CNTs, the authors tailored the nanocomposite to the near-zero TCR in a wide temperature range.
For MWCNT/vinyl ester nanocomposites, studied at different fractions of nanofiller, Lasater and Thostenson [29] observed complex TCR dependences on temperature: two maxima with positive values, two minima with negative values for higher CNT fractions 0.5–1.0 wt.% and monotonic near-linear trend with positive slope and negative values for 0.1 wt.%. Negative TCR was observed by Karimov et al. [30] for MWCNT/glue nanocomposites. Similar results were observed by Nankali et al. [31] for MWCNT/PDMS silicone elastomer with non-linear TCR dependence. Negative TCRs with a complex dependence on temperature, having a maximum, were found by Xiao et al. [32] for a variety of filler fractions in MWCNT/epoxy nanocomposites.
Another complex TCR behaviour was reported by Gao et al. [33], where SWCNT/polyimide composite film was evaluated at a temperature range from room (25 °C) to annealing temperature up to 400 °C. As for fresh composite films, the initial TCR behaviour showed a negative trend. With increasing the annealing temperature, the TCR of films gradually changed from negative to positive, passing zero value.
Clearly, experimental results are controversial and demonstrate the play of several factors complicating the comparative analysis. As discussed above, many factors influence changes in the electrical resistivity of a CNT nanocomposite with temperature. Intrinsic conductivity of CNTs depends on temperature, thermal expansion of material causes changes in tunnelling distances while tunnelling thresholds depend on temperature as well. In addition to all these factors, we investigate the influence of another one–the degree of cure of the polymer matrix.
Industrial practice tells us that several hours at elevated temperatures (3 h at 130 °C for the materials studied by us) provide a relatively high degree of cure. Does this degree of cure allow us to conduct TCR measurements? This is a well-posed question because, by conducting these measurements at elevated temperatures, we activate the post-curing process with the changes in electrical resistivity. These changes may shift the measured values of resistivity leading to biased TCRs. We argue that controversy in the literature on TCR values may be attributed to this effect.
Indirect proof of this statement comes from the results of TCRs measured for thermoplastics, where the post-curing does not take place. Mohiuddin and Hoa [34] observed a steady, near-linear increase of conductivity with temperature leading to monotonic TCR dependence with negative values for MWCNT/PEEK. Cen-Puc et al. [35] for MWCNT/PSF reported near linear resistance changes with temperature when slope (and thereby the sign of TCR) depended on the filler fraction–positive for <10 wt.% and negative for 50 wt.%. No extrema were observed.
The present work aims to offer a better understanding of the influence of possible post-curing on the TCR values of the single-walled CNT/epoxy nanocomposite. For this purpose, curing durations longer than recommended by industrial practice are investigated. The manuscript addresses (1) the duration of the post-curing process marked by the saturation of changes in the electrical response of the material; (2) changes in TCR with the different post-curing stages; (3) the TCR of the fully post-cured material.

2. Materials and Methods

2.1. Materials

The single-walled CNT masterbatch used in the experiment was TUBALL™ MATRIX 201 (OCSiAl), specifically designed to provide superior electrical conductivity to epoxy, polyester, and polyurethane resins. To fabricate CNT/epoxy samples, the epoxy resin system Biresin CR131, designed for high-performance fibre-reinforced polymer composite applications, was used as the matrix.

2.2. Samples’ Fabrication

CNT masterbatch was mixed with Biresin CR131 resin by shear mixing for desired 0.6 wt.% of CNTs at room temperature of 25 °C and relative humidity of 30%. Three different stirring cycles were utilized with varying speeds as presented in Table 1. The low vacuum of 0.1 mbar was applied for 15 min between each stirring cycle to reduce air entrapment.
To ascertain the quality of nanofiller mixing, the scanning electron microscopy characterization of a sample fracture surface has been conducted (Figure 1). Apart from minor agglomeration and bundling present, the nanofiller demonstrates near-perfect distribution and dispersion, both isotropic and homogeneous.
To measure the electrical resistance of a sample, two copper tape electrodes were placed at the opposite sides of a cubic silicon mould 25 mm × 25 mm × 25 mm. Five samples for the constant temperature measurements and five samples for the varying temperature cycles were moulded and subsequently cured at an industrial temperature regime of 130 °C for 3 h (recommendation from resin manufacturer to achieve a high degree of cure).

2.3. Electrical Resistance Measurements at Post-Curing

DC electrical measurements were performed on CNT/epoxy samples using Keithley DMM6500 as shown in Figure 2. Before post-curing heating, the initial resistances of the samples were recorded.
Procedure A: Five samples were post-cured at 120 °C in BINDER ED115 for 72 h uninterruptedly; electrical resistance measurements were conducted once a day with the samples maintained inside the oven. Every day, the duration of measurements was 1 h during which the change in readings was observed. Analysis of results is given in Section 3.1.
Procedure B: Five other samples were exposed to a temperature regime of 100 °C for 8 days, but with the heating interrupted for the TCR measurements in the range 25–100 °C. For this purpose, every cycle the samples were cooled down slowly to room temperature. Next, the electrical resistance of the samples was measured at temperatures 25 (room), 40, 60, 80, and 100 °C, consecutively, kept at the given temperature for 1 h at each step to equilibrate the temperature within the samples. After the end of the measurements, the samples were further post-cured at 100 °C for the remaining part of the day, and the next day the cycle repeated itself. This procedure was followed within 8 cycles. Analysis of results is given in Section 3.2.

3. Results and Discussion

In this section, we present the obtained results of the DC electrical resistance measurements conducted during the samples’ post-curing.

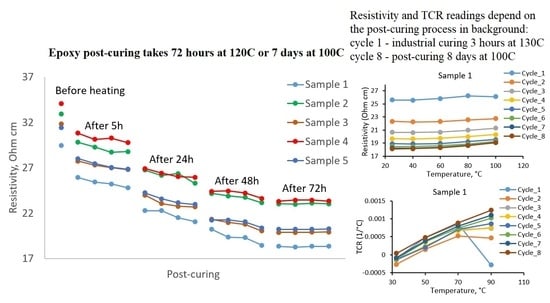
3.1. Electrical Resistivity Change during Uninterrupted Post-Curing

The current discussion is for measurements conducted with Procedure A from Section 2.3. For the five samples, uninterruptedly post-cured at 120 °C for 72 h, the measured electrical resistivities are presented in Figure 3. Each connected set of markers represents the resistivity change of a sample during an hour. The decreasing trend is clearly observed, indicating the continuation of the curing process. We argue that the way the samples were manufactured (industrial curing at 130 °C for 3 h) does not allow them to reach a high enough degree of cure since post-curing clearly changes material properties. In Section 4, we compare the behaviour of post-cured samples in the presented work with reported investigations in the literature [13,29]. We see that only after 72 h at 120 °C, the curves reach a steady state indicating that the final state of curing has been achieved.
All dependencies in Figure 3 possess identical trends but differ due to the scatter in the conductance values, remaining unchanged even after 72 h of post-curing. We attribute this scatter to variations in mixing, porosity, and variability of interface properties between nanocomposite mixture and copper electrode which can serve as an initiator of gas bubble nucleation as well as a modifier of CNT content due to the difference in CNT-polymer and CNT-copper surface energies. Nevertheless, the post-curing time dependencies present a clear trend, independent of the scatter present.
Table 2 represents the relative difference in electrical resistance of the samples. The table compares the initial resistance of the samples before heating with the resistances at the end of the thermal program. Due to Table 2, the average relative difference of the samples was obtained at 53% which implies a significant change.

3.2. Changes in Electrical Resistivity with Temperature at Different Post-Curing States

The current discussion is for measurements conducted with Procedure B from Section 2.3. The dependence of the electrical resistance on temperature for the CNT/epoxy nanocomposite was investigated within 8 thermal cycles, each providing 24-h post-curing at 100 °C, interrupted for measurements. Experimental results are presented in Figure 4. Clearly, three trends can be observed: (1) the resistance decreases with post-curing until the material reaches the fully cured steady state (cycles 7 and 8); in cycles 1 and 2 the increase in resistance with temperature is not monotonic, exhibiting a peak, leading to the appearance of negative TCRs at higher temperatures; (3) in the fully cured state (cycles 7 and 8) the increase in resistance with temperature is monotonic, demonstrating only positive TCRs.
Utilizing these data to calculate TCRs, we depict results in Figure 5. Again, for the first cycles, when the degree of cure of the material is far from being fully cured, we observe the complex, sometimes monotonic, sometimes non-monotonic behaviour. However, in the fully cured state, the behaviour becomes stable, with the TCR monotonically increasing from a near zero value at room temperature to the values of the order of 0.001 at elevated temperatures.
Table 3 shows the relative difference in TCRs of the samples (the absolute value of the relative difference is not taken to demonstrate the crossing of zero). The table compares the TCRs at the end of cycles 1 and 8 for each sample. The results indicate the average relative difference of the samples is −394% which demonstrates that values at low degrees of cure are nearly unrelated to values at the fully cured state.

4. Comparative Analysis

To explore the influence of post-curing on resistivity and TCR of CNT nanocomposites, a comparison between the present study and experimental works in the literature was accomplished. Table 4 shows materials, temperatures, and CNT contents in compared studies (for comparison, we selected studies with a thermoset resin and full data for both resistivity and TCR temperature dependencies).
First, we compare temperature dependencies for resistivities. Both studies, [13,29], were conducted with MWCNTs. MWCNTs provide much higher resistivities than SWCNTs, by several orders of magnitudes higher [4], and, thereby, cannot be compared directly. To overcome this problem, we have normalized resistivities by their value at 25 °C to observe not absolute values but trends. In Figure 6a, we present these dependencies for sample 1 in our study and Figure 6b we put results from [13,29] on top of them. While Gong et al. [13] present a much wider scale of changes, beyond the limits of our plot, both with negative and positive slopes, Lasater and Thostenson data [29] follow our results closely–note the resemblance between Lasater and Thostenson data curves for 0.5 wt.%, 0.75 wt.%, 1.0 wt.% and cycle 1 curve (blue) from our results, corresponding to industrially cured materials (no post-curing). All these curves have a maximum of around 80 °C, which we attribute to active post-curing following the measurements and shifting the results.
In Figure 7, we compare TCR temperature dependencies. For our samples, TCRs exhibited maximums near 70 °C for initial cycles of post-curing, but were becoming steadily increasing monotonic dependencies at the end of post-curing. TCRs from [13] exhibited not only maxima but also minima near 50–80 °C, demonstrating much bigger absolute TCR values (Figure 7a). TCRs from [29] (Figure 7b) had values close to our study reaching zero values near 90 °C, similar to the cycle 1 dependence of the present study.
We argue that the complex and non-monotonic behaviour of TCRs presented in the literature depends on the curing state of the material. Figure 5 demonstrates that in the fully cured state (cycles 7 and 8), as discussed in Section 3, the material shows stable, monotonically increasing dependence of TCR on temperature.

5. Conclusions

The temperature coefficient of resistance (TCR) of a single-walled CNT/epoxy nanocomposite was studied considering the influence of post-curing. It was found that industrially cured material demonstrates post-curing resulting in complex, non-monotonic TCR behaviour. The reason is that during TCR measurements the samples are required to be equilibrated at the measurement temperature (1 h in the present study) which activates further post-curing and shifts the results. On the contrary, in the fully cured state, the material demonstrates stable, monotonically increasing dependence of TCR on temperature. We argue that the controversy of data on TCRs in the literature may be caused by the measurements taken not from fully cured material when measurements are influenced by the simultaneously initiated post-curing process.

Author Contributions

Conceptualization, M.J. and S.G.A.; methodology, B.M. and S.G.A.; software, M.J. and S.G.A.; validation, M.J., B.M. and S.G.A.; formal analysis, M.J. and S.G.A.; investigation, M.J. and S.G.A.; resources, B.M.; data curation, M.J. and S.G.A.; writing—original draft preparation, M.J.; writing—review and editing, M.J., B.M. and S.G.A.; visualization, S.G.A.; supervision, S.G.A.; project administration, S.G.A.; funding acquisition, S.G.A. All authors have read and agreed to the published version of the manuscript.

Funding

This work was supported by the Skoltech NGP Program “Multifunctional Fusion: Life-cycle enhancements via data-driven nanoengineering of advanced composite structures”.

Data Availability Statement

The data presented in this study are available on request from the corresponding author.

Conflicts of Interest

The authors declare no conflict of interest.

References

  1. Ma, C.; Liu, H.-Y.; Du, X.; Mach, L.; Xu, F.; Mai, Y.-W. Fracture resistance, thermal and electrical properties of epoxy composites containing aligned carbon nanotubes by low magnetic field. Compos. Sci. Technol. 2015, 114, 126–135. [Google Scholar] [CrossRef]
  2. Sabu, M.; Bementa, E.; Ruban, Y.J.V.; Mon, S.G. A novel analysis of the dielectric properties of hybrid epoxy composites. Adv. Compos. Hybrid Mater. 2020, 3, 325–335. [Google Scholar] [CrossRef]
  3. Gong, S.; Zhu, Z.H. Giant piezoresistivity in aligned carbon nanotube nanocomposite: Account for nanotube structural distortion at crossed tunnel junctions. Nanoscale 2015, 7, 1339–1348. [Google Scholar] [CrossRef] [PubMed]
  4. Butt, H.A.; Lomov, S.V.; Akhatov, I.S.; Abaimov, S.G. Self-diagnostic carbon nanocomposites manufactured from industrial epoxy masterbatches. Compos. Struct. 2021, 259, 113244. [Google Scholar] [CrossRef]
  5. Hu, N.; Karube, Y.; Arai, M.; Watanabe, T.; Yan, C.; Li, Y.; Liu, Y.; Fukunaga, H. Investigation on sensitivity of a polymer/carbon nanotube composite strain sensor. Carbon 2010, 48, 680–687. [Google Scholar] [CrossRef]
  6. Ge, L.; Gong, X.; Wang, Y.; Xuan, S. The conductive three dimensional topological structure enhanced magnetorheological elastomer towards a strain sensor. Compos. Sci. Technol. 2016, 135, 92–99. [Google Scholar] [CrossRef]
  7. Yang, W.; Zou, W.; Du, Z.; Li, H.; Zhang, C. Enhanced conductive polymer nanocomposite by foam structure and polyelectrolyte encapsulated on carbon nanotubes. Compos. Sci. Technol. 2016, 123, 106–114. [Google Scholar] [CrossRef]
  8. Lomov, S.V.; Abaimov, S.G. Influence of the Nanostitch Sensor Embedment on the Fibrous Microstructure of Glass Fiber Prepreg Laminates. Polymers 2022, 14, 4644. [Google Scholar] [CrossRef]
  9. Lomov, S.V.; Gudkov, N.A.; Abaimov, S.G. Uncertainties in Electric Circuit Analysis of Anisotropic Electrical Conductivity and Piezoresistivity of Carbon Nanotube Nanocomposites. Polymers 2022, 14, 4794. [Google Scholar] [CrossRef]
  10. Chen, L.; Weng, M.; Zhang, W.; Zhou, Z.; Zhou, Y.; Xia, D.; Li, J.; Huang, Z.; Liu, C.; Fan, S. Transparent actuators and robots based on single-layer superaligned carbon nanotube sheet and polymer composites. Nanoscale 2016, 8, 6877–6883. [Google Scholar] [CrossRef]
  11. Masarapu, C.; Zeng, H.F.; Hung, K.H.; Wei, B. Effect of Temperature on the Capacitance of Carbon Nanotube Supercapacitors. ACS Nano 2009, 3, 2199–2206. [Google Scholar] [CrossRef] [PubMed]
  12. Bao, S.; Tjong, S.C. Mechanical behaviors of polypropylene/carbon nanotube nanocomposites: The effects of loading rate and temperature. Mater. Sci. Eng. A 2008, 485, 508–516. [Google Scholar] [CrossRef]
  13. Gong, S.; Wang, Y.; Xiao, Z.; Li, Z.; Wang, Z.X.; Lei, R.S.; Zhu, Z.H. Effect of temperature on the electrical property of epoxy composites with carbon nanotube. Compos. Sci. Technol. 2017, 149, 48–54. [Google Scholar] [CrossRef]
  14. Gong, S.; Zhu, Z.; Meguid, S. Anisotropic electrical conductivity of polymer composites with aligned carbon nanotubes. Polymer 2015, 56, 498–506. [Google Scholar] [CrossRef]
  15. Gong, S.; Zhu, Z.H. On the mechanism of piezoresistivity of carbon nanotube polymer composites. Polymer 2014, 55, 4136–4149. [Google Scholar] [CrossRef]
  16. Simmons, J.G. Generalized Formula for the Electric Tunnel Effect between Similar Electrodes Separated by a Thin Insulating Film. J. Appl. Phys. 1963, 34, 1793–1803. [Google Scholar] [CrossRef] [Green Version]
  17. Penazzi, G.; Carlsson, J.M.; Diedrich, C.; Olf, G.; Pecchia, A.; Frauenheim, T. Atomistic Modeling of Charge Transport across a Carbon Nanotube–Polyethylene Junction. J. Phys. Chem. C 2013, 117, 8020–8027. [Google Scholar] [CrossRef]
  18. Gudkov, N.; Lomov, S.; Akhatov, I.; Abaimov, S. Conductive CNT-polymer nanocomposites digital twins for self-diagnostic structures: Sensitivity to CNT parameters. Compos. Struct. 2022, 291, 115617. [Google Scholar] [CrossRef]
  19. Bower, C.; Rosen, R.; Jin, L.; Han, J.; Zhou, O. Deformation of carbon nanotubes in nanotube–polymer composites. Appl. Phys. Lett. 1999, 74, 3317–3319. [Google Scholar] [CrossRef]
  20. Tombler, T.W.; Zhou, C.; Alexseyev, L.; Kong, J.; Dai, H.; Liu, L.; Jayanthi, C.S.; Tang, M.; Wu, S.-Y. Reversible electromechanical characteristics of carbon nanotubes underlocal-probe manipulation. Nature 2000, 405, 769–772. [Google Scholar] [CrossRef]
  21. Luo, X.; Wang, B.; Zheng, Y. Tunable Tunneling Electroresistance in Ferroelectric Tunnel Junctions by Mechanical Loads. ACS Nano 2011, 5, 1649–1656. [Google Scholar] [CrossRef] [PubMed]
  22. Benchirouf, A.; Palaniyappan, S.; Ramalingame, R.; Raghunandan, P.; Jagemann, T.; Müller, C.; Hietschold, M.; Kanoun, O. Electrical properties of multi-walled carbon nanotubes/PEDOT:PSS nanocomposites thin films under temperature and humidity effects. Sens. Actuators B Chem. 2016, 224, 344–350. [Google Scholar] [CrossRef]
  23. Han, J.-W.; Kim, B.; Li, J.; Meyyappan, M. Carbon Nanotube Based Humidity Sensor on Cellulose Paper. J. Phys. Chem. C 2012, 116, 22094–22097. [Google Scholar] [CrossRef]
  24. Zaidi, B.; Smida, N.; Althobaiti, M.G.; Aldajani, A.G.; Almdhaibri, S.D. Polymer/Carbon Nanotube Based Nanocomposites for Photovoltaic Application: Functionalization, Structural, and Optical Properties. Polymers 2022, 14, 1093. [Google Scholar] [CrossRef]
  25. Shooshtari, M.; Salehi, A.; Vollebregt, S. Effect of Humidity on Gas Sensing Performance of Carbon Nanotube Gas Sensors Operated at Room Temperature. IEEE Sens. J. 2020, 21, 5763–5770. [Google Scholar] [CrossRef]
  26. Skákalová, V.; Kaiser, A.B.; Woo, Y.-S.; Roth, S. Electronic transport in carbon nanotubes: From individual nanotubes to thin and thick networks. Phys. Rev. B 2006, 74, 085403. [Google Scholar] [CrossRef]
  27. Lee, J.; Stein, I.Y.; Devoe, M.E.; Lewis, D.J.; Lachman, N.; Kessler, S.S.; Buschhorn, S.T.; Wardle, B.L. Impact of carbon nanotube length on electron transport in aligned carbon nanotube networks. Appl. Phys. Lett. 2015, 106, 053110. [Google Scholar] [CrossRef] [Green Version]
  28. Gong, S.; Zhu, Z.H.; Li, Z. Electron tunnelling and hopping effects on the temperature coefficient of resistance of carbon nanotube/polymer nanocomposites. Phys. Chem. Chem. Phys. 2017, 19, 5113–5120. [Google Scholar] [CrossRef]
  29. Lasater, K.L.; Thostenson, E.T. In situ thermoresistive characterization of multifunctional composites of carbon nanotubes. Polymer 2012, 53, 5367–5374. [Google Scholar] [CrossRef]
  30. Karimov, K.S.; Chani, M.T.S.; Khalid, F.A. Carbon nanotubes film based temperature sensors. Phys. E Low-Dimens. Syst. Nanostruct. 2011, 43, 1701–1703. [Google Scholar] [CrossRef]
  31. Nankali, M.; Nouri, N.M.; Malek, N.G.; Amjadi, M. Dynamic thermoelectromechanical characterization of carbon nanotube nanocomposite strain sensors. Sensors Actuators A Phys. 2021, 332, 113122. [Google Scholar] [CrossRef]
  32. Xiao, T.; Gong, S.; Lei, X.; Jiang, Z.; Wang, Y.; Wu, D.; Xiao, Z.; Zhu, Z.; Li, Z. High temperature response capability in carbon nanotube/polymer nanocomposites. Compos. Sci. Technol. 2018, 167, 563–570. [Google Scholar] [CrossRef]
  33. Gao, W.; Zhang, Z.; Zhang, Y.; Ma, B.; Luo, J.; Deng, J.; Yuan, W. Efficient carbon nanotube/polyimide composites exhibiting tunable temperature coefficient of resistance for multi-role thermal films. Compos. Sci. Technol. 2020, 199, 108333. [Google Scholar] [CrossRef]
  34. Mohiuddin, M.; Hoa, S. Temperature dependent electrical conductivity of CNT–PEEK composites. Compos. Sci. Technol. 2011, 72, 21–27. [Google Scholar] [CrossRef]
  35. Cen-Puc, M.; Oliva-Avilés, A.; Avilés, F. Thermoresistive mechanisms of carbon nanotube/polymer composites. Phys. E Low-Dimensional Syst. Nanostruct. 2018, 95, 41–50. [Google Scholar] [CrossRef]
Figure 1. Scanning electron microscopy of a sample fracture surface.
Polymers 15 00433 g001
Figure 2. Schematic diagram of DC electrical measurements. Copper tape electrodes at the opposite faces of the sample to which conducting wires were soldered. The other end of conducting wires was connected to DMM6500 for DC electrical measurement.
Polymers 15 00433 g002
Figure 3. Change in electrical resistivity of single-walled CNT/epoxy samples during the post-curing at T = 120 °C for 72 h.
Polymers 15 00433 g003
Figure 4. Change in electrical resistivity with the temperature at different post-curing cycles.
Polymers 15 00433 g004aPolymers 15 00433 g004b
Figure 5. Change in TCR with the temperature at different post-curing cycles.
Polymers 15 00433 g005
Figure 6. Relative resistivity temperature dependencies normalized by their values at 25 °C for (a) sample 1 in the current study (circles) with (b) dependencies from the literature added ([13]–squares, [29]–triangles).
Polymers 15 00433 g006
Figure 7. TCR comparison between sample 1 of the present study (circles) and literature data ([13]–squares, [29]–triangles), (a) full scale and (b) close-up.
Polymers 15 00433 g007
Table 1. Steps of the synthesis process for CNT nanocomposite samples.
Mixed MaterialsCycle 1 Cycle 2 Cycle 3
Low speed +
heating (45 °C)
(20 min)
15 min
Vacuum
High speed +
heating (45 °C)
(60 min)
15 min
Vacuum
Low speed
Without heating
(20 min)
15 min
Vacuum
Table 2. Relative difference in electrical resistance of epoxy-CNT single-walled with the influence of constant temperature.
SampleResistance before Heating [Ω]Resistance at the End of Program [Ω]Relative Difference
111.797.3462%
213.189.2143%
312.737.9760%
413.639.3346%
512.578.1155%
Table 3. Relative difference in TCRs with the influence of curing cycles.
SampleTCR at Cycle 1, 90 °C [1/°C]TCR at Cycle 8, 90 °C [1/°C]Relative Difference
1−0.000280.0012−535%
2−0.000920.00076−183%
3−0.000720.0011−257%
4−0.000630.0011−278%
5−0.000210.0013−717%
Table 4. Experimental material, temperature, and CNT content of the nanocomposites used in the literature and present study.
SourceNanocompositeTemperature [°C]CNT Fraction
CNTResin
Present studySWCNTepoxy25–1000.6 wt.%
Gong et al. [13]MWCNTepoxy−40–1100.5 wt.%
Lasater et al. [29]MWCNTvinyl ester25–1700.5 wt.%
Disclaimer/Publisher’s Note: The statements, opinions and data contained in all publications are solely those of the individual author(s) and contributor(s) and not of MDPI and/or the editor(s). MDPI and/or the editor(s) disclaim responsibility for any injury to people or property resulting from any ideas, methods, instructions or products referred to in the content.

