Article

Moisture Sorption and Degradation of Polymer Filaments Used in 3D Printing

Institute for Mechanics of Materials, The University of Latvia, Jelgavas Str. 3, LV-1004 Riga, Latvia
*
Author to whom correspondence should be addressed.
Polymers 2023, 15(12), 2600; https://doi.org/10.3390/polym15122600
Submission received: 19 April 2023 / Revised: 2 June 2023 / Accepted: 2 June 2023 / Published: 7 June 2023
(This article belongs to the Special Issue Mechanical and Physical Properties of 3D Printed Polymer Materials)

Abstract

:
Experimental research of the moisture sorption process of 12 typical filaments used for FFF was performed in atmospheres with a relative humidity from 16 to 97% at room temperature. Materials with high moisture sorption capacity were revealed. Fick’s diffusion model was applied to all tested materials, and a set of sorption parameters was found. The solution of Fick’s second equation for the two-dimensional cylinder was obtained in series form. Moisture sorption isotherms were obtained and classified. Moisture diffusivity dependence on relative humidity was evaluated. The diffusion coefficient was independent of the relative humidity of the atmosphere for six materials. It essentially decreased for four materials and grew for the other two. Swelling strain changed linearly with the moisture content of the materials and reached up to 0.5% for some of them. The degree of degradation of the elastic modulus and the strength of the filaments due to moisture absorption were estimated. All tested materials were classified as having a low (changes ca. 2–4% or less), moderate (5–9%), or high sensitivity to water (more than 10%) by their reduction in mechanical properties. This reduction in stiffness and strength with absorbed moisture should be considered for responsible applications.

1. Introduction

Additive manufacturing, widely known as 3D printing, is a modern technology that has experienced constant growth in recent decades. It is also referred to as one of the trends of Industry 4.0 [1]. One of the AM technologies, known as fused filament fabrication (FFF), has great potential for engineers and designers and allows the creation of unique complex-shape polymer constructions within relative time limits [2,3]. FFF technology is based on a layer-by-layer layup of extruded polymer material, referred to as filament. The filament materials range from pure polymers to those reinforced with nanoparticles, fibres, etc., responding to planned applications [4]. Generally, polymer materials used as a filament base can be divided into home/laboratory use and industrial use [5]. Materials for home/laboratory use are more straightforward in terms of printing and processing but are more sensitive to environmental factors [6] and do not have outstanding mechanical and physical properties [7]. Such materials could be used for prototyping and producing parts for single use and for studying the material properties [8]. The main materials used in this group are polylactic acid (PLA), acrylonitrile butadiene styrene (ABS), polycarbonate (PC), and polyamide (PA, Nylon). On the other hand, materials for industrial printing such as polyetherimide (PEI) and polyetherketoneketone (PEKK) materials, or a combination of them [9,10], have more advanced properties, are not so sensitive to external factors, and could be used for more practical applications [11].
Three-dimensional printing using the FFF method is swiftly moving from prototyping to functional parts, thus facing new practical challenges. Most traditional polymers and composites used for structural applications are moisture-sensitive, tend to absorb humidity, and lose stiffness and strength in a moist environment [12,13]. FFF filaments are expected to behave similarly. Thus, this affects the printing parameters [6] and properties of the 3D-printed structures [14,15].
Filaments shipped from manufacturers are vacuum-packed and are in relatively stable conditions before opening. The mechanical, physical, and other properties mentioned in the datasheet should correspond to these reference, “ideal” conditions. After unsealing, filaments tend to sorb the moisture from the ambient atmosphere, which is typically not controlled. Frequently, only specialised 3D printing companies closely monitor the storage conditions of unsealed filaments during the storing and printing period. For example, such companies use a 3D printing filament storage cabinet or at least a silica-gel-containing storage box. In most room conditions, filaments are subjected to an atmosphere of 20–50% relative humidity (RH). Filaments absorb water from the air, swell, and degrade in such conditions. Even following the rules during storage for filaments, a coil is removed from the safety conditions, and the filament is subjected to humidity because most desktop-type printers are not equipped with a specific “humidity-safe” place or dry box for coil storage during the printing period.
Despite the wide range of work devoted to studying the properties of printed parts and printing parameters, a gap in the information is observed when it comes to studies of the main component—a filament.
One of the possible ways to investigate the effect of moisture on the mechanical properties of FFF structures is the so-called structural approach, well known in the mechanics of fibre-reinforced composites and also applied to moisture sorption processes [16]. In this way, the experimental investigation and modelling of filament moisture sorption are crucial. The sorption of various materials such as PLA, SiC-filled PLA composites, ABS [17], PC/ABS blend, and Nylon [18] was studied. The results showed that the sorption of samples was strongly affected by the manufacturing method [19,20]. Thus, these data are not applicable for sorption modelling in contrast to the sorption data of specific filaments. Unfortunately, systematised comparative research devoted to filaments is missing in the literature.
On the other hand, the moisture sorption process and its effect on the mechanical properties of composites are well investigated. The effect of moisture on the elastic and viscoelastic properties of epoxy and epoxy-based carbon-fibre-reinforced plastic filled with multiwall carbon nanotubes was described in [21]. The effects of moisture on the elastic and viscoelastic properties of CFRP rebars and vinyl ester binder are described in [22]. The hydrothermal ageing of an epoxy resin filled with carbon nanofillers is described in [23]. These attempts should be extended to FFF materials and structures.
This research aimed to conduct an experimental investigation and model the water sorption process of typical polymer filaments used for FFF in order to obtain the data necessary for the further prediction of the effect of moisture on the properties of FFF structures. To achieve this aim, four tasks were formulated: (1) To perform experimental research on the moisture sorption process of some typical filaments used for FFF. (2) To model the moisture sorption process and obtain the material parameters that characterised the process. (3) To evaluate the swelling of the filaments in wet environments. (4) To estimate the possible degree of degradation of the mechanical properties of the filaments due to moisture absorption.

2. Moisture Sorption by a Cylindrical Specimen

Let us consider the well-known Fick’s second equation [24,25] for the case of the moisture diffusion (sorption) process in a cylindrical polymer specimen
U t = D Δ U
where U is the moisture concentration in the specimen, D is the diffusion coefficient, and t is time. The cylindrical coordinates are r and z only. The initial moisture concentration distribution in the specimen is φ (r, z), and the concentration on the specimen surface is U0. Equation (1) with initial and border conditions could be rewritten as
U t = D Δ r , z U , U | t = 0 = φ r , z , U | r = R = U 0 , U | z = 0 , l = U 0
The above-mentioned classical books provide the solution to the diffusion problem for an infinite-length cylinder. Many authors often use it to model the moisture sorption process in long fibres [26,27]. For the case of a bounded cylinder, instead of (2), we have
U t = D 2 U r 2 + 1 r U r + 2 U z 2
with the initial condition
U t = 0 = φ r , z
and the border condition
U z = 0 , l = U 0 ,   U r = R = U 0 ,   r , z , t U < .
A complete step-by-step solution of the problem using the method of the separation of variables is given in Appendix A.
As a result, the moisture content in a cylindrical sample could be calculated as
Q = Q + 8 Q 0 Q π 2 k = 1 m = 1 exp λ k , m 2 D t m 2 γ k 2 1 1 m 2 ,   λ k , m 2 = γ k R 2 + π m l 2
The roots, γk, of the zero Bessel function are also given in Appendix A.
A user-defined function was developed in Microsoft Excel using Visual Basic for Applications (VBA) programming language to calculate moisture content in a cylindrical sample using (5).
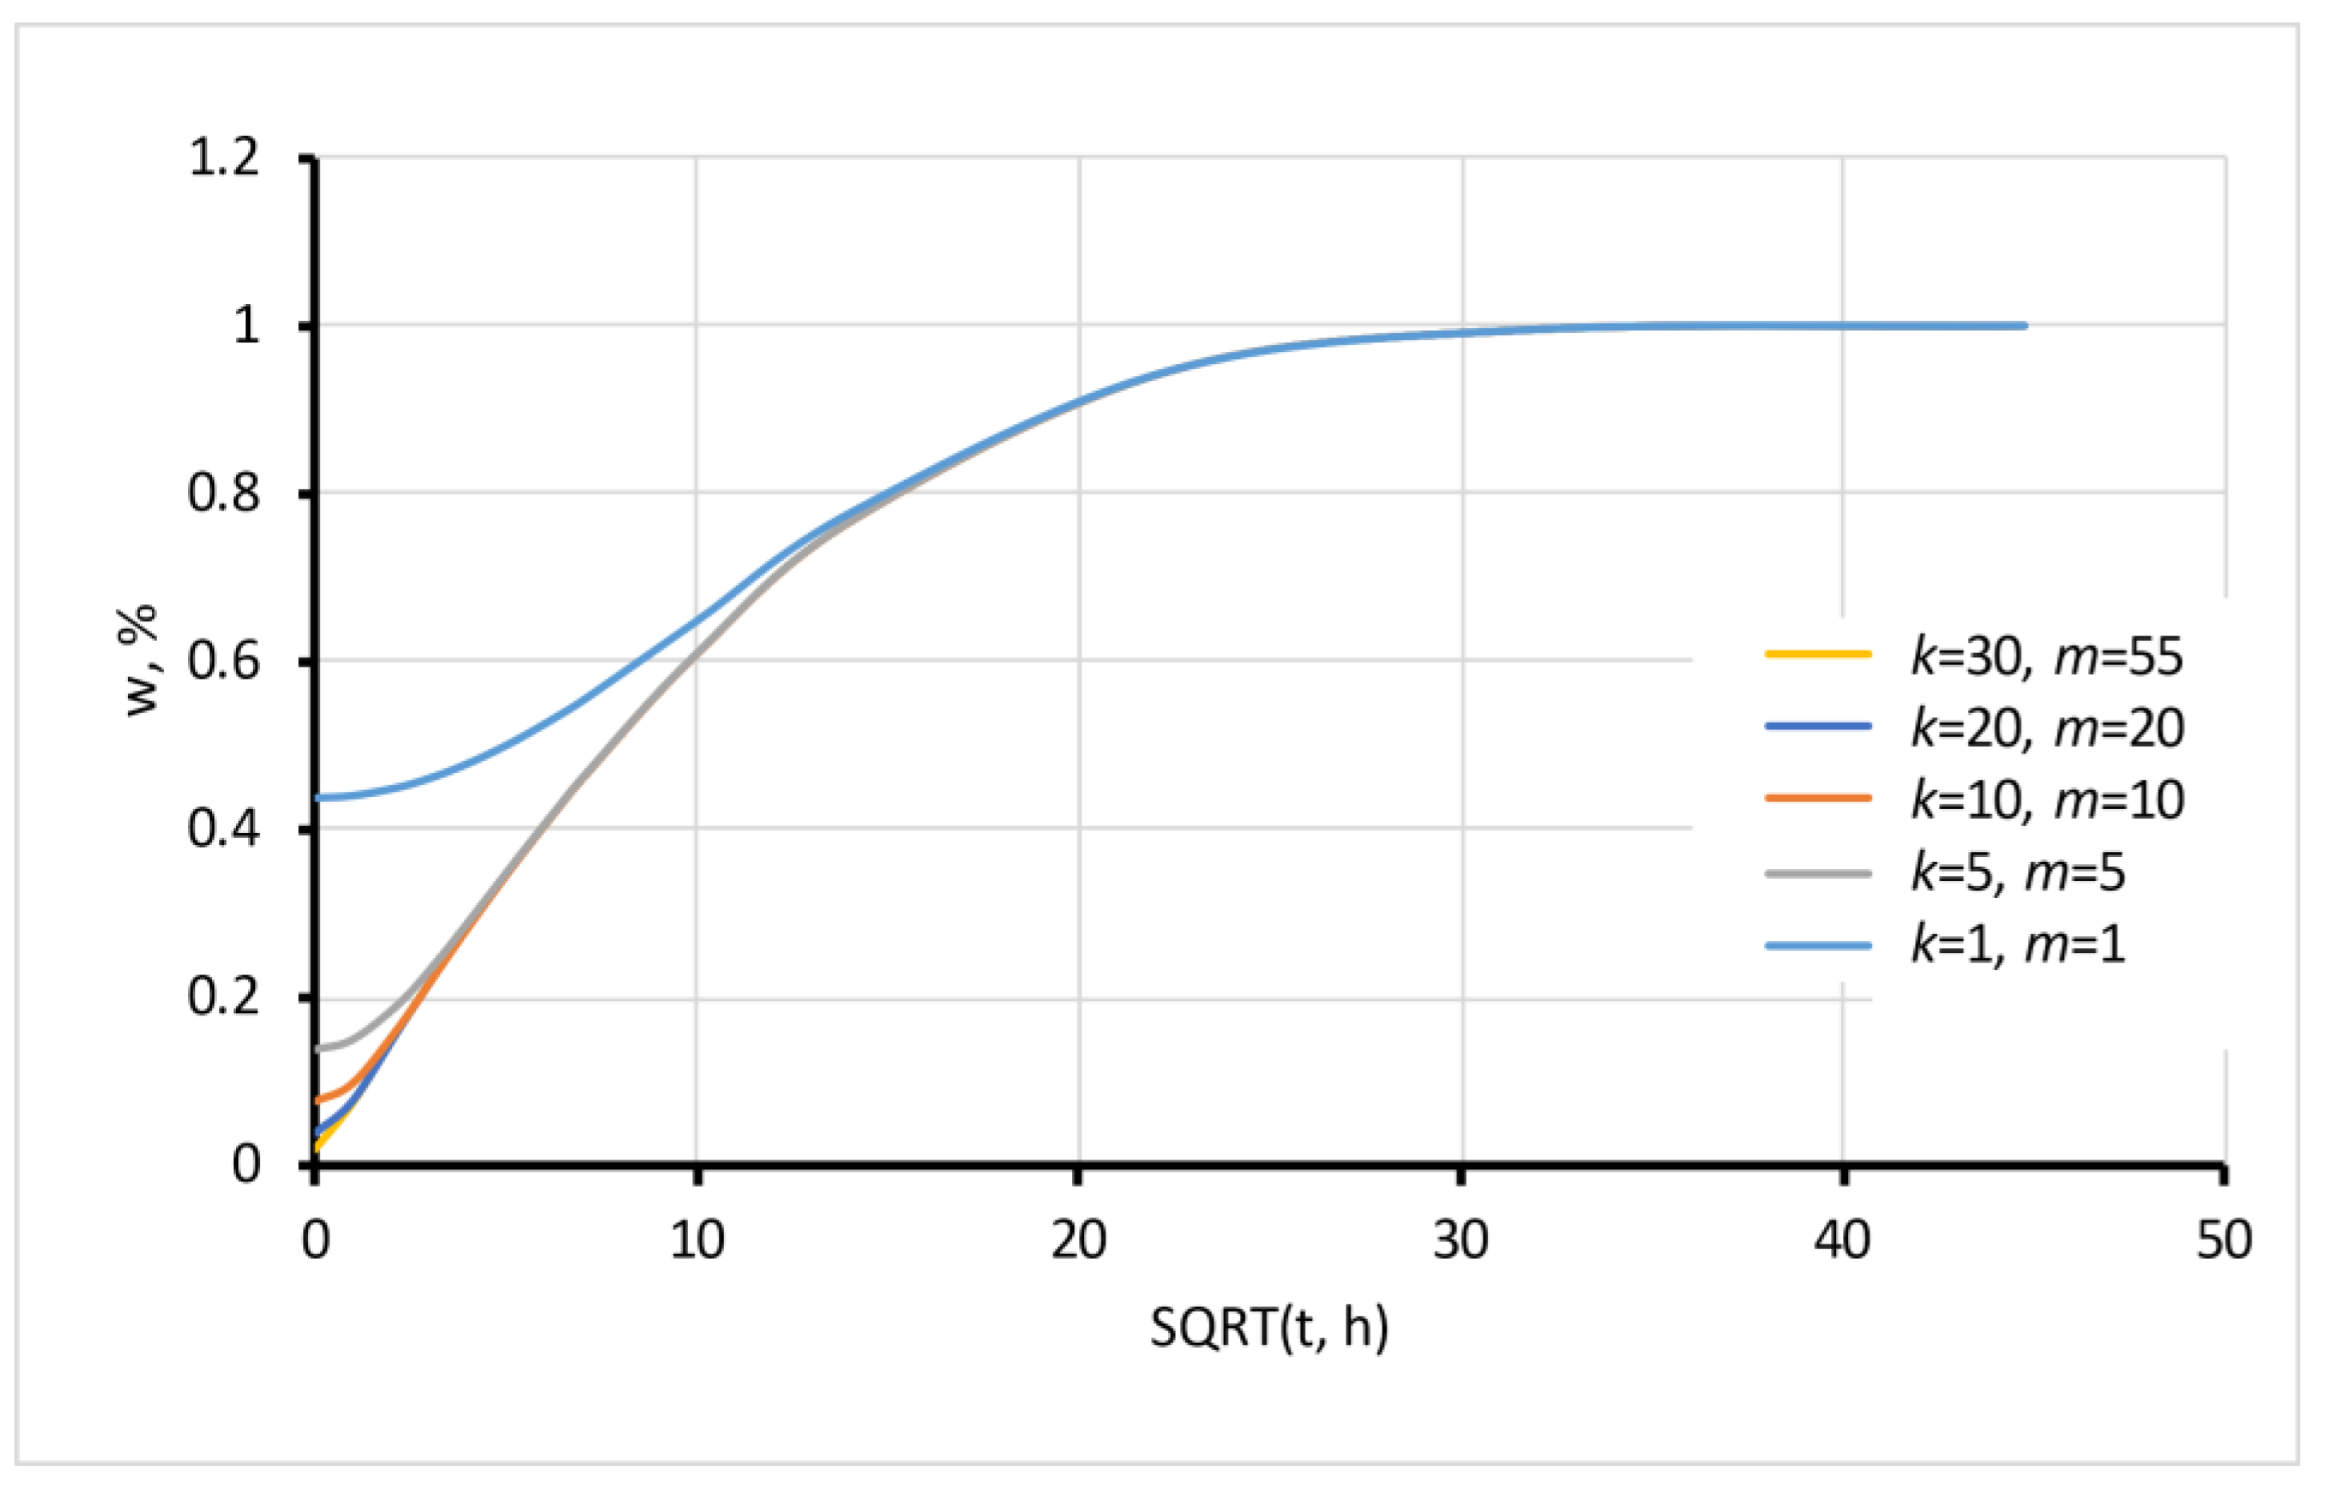
A large number of summands (up to k = 30) in expression (5) provides convergence of the equation for relatively small time values close to zero, as seen in Figure 1. For the prediction of the moisture sorption process at the final stage, when the moisture content of a sample is 80% of the equilibrium or more, the sum could be restricted only to the first term of the series to obtain the simple expression
Q = Q + 32 Q 0 Q exp λ 1 , 1 2 D t π 2 γ 1 2
This expression provides 98% or better accuracy for Fo > 0.004, which is enough for many evaluations.
The moisture sorption rate depends on the geometry of the sample. A calculated graph of moisture sorption for cylinders with different length-to-radius ratios l/R is presented in Figure 2. It is seen from the figure that for short cylinders with l/R < 2 (disk shape), the contribution of the axial component in the sorption process is essential. The one-dimensional solution with only the radial component gives an underestimated prediction for such cases. For modelling purposes, the equilibrium moisture content in this calculation was chosen and fixed as w = 1, but this does not matter for such evaluation.

3. Materials and Methods

A list of tested materials is given in Table 1. Representatives of the most often used filament classes were tested. Some materials with additional functionality, such as electrical conductivity (Koltron, PLA Cnd, ABS ESD) or a thermochromatic effect (PLA LAVA), were also included in the list. The fillers that provide this additional functionality can notably influence the properties of basic polymers; however, these effects are beyond the scope of the present study. Most of the tested thermoplastics are hydrophobic materials, excluding Nylon and CPE, which are hydrophilic, as indicated in the technical data sheets. This information is not available for materials with additives.
The categories of tested materials include common, engineering, functional, and high-performance plastics, as presented in Figure 3. This division is often used but is relatively conventional, and white horizontal lines in the figure are not sharp borders between the categories. The white vertical line in the figure is also not a sharp border between amorphous and semi-crystalline. Additionally, the horizontal and vertical arrows do not indicate any degree of crystallinity or the scale of price or performance, but only growth directions. The 13 tested polymers have different chemical formulations and molecular and sub-molecular structures that could change with moisture sorption. Their moisture sorption behaviour and degradation of properties also are different, though they should be classified using the obtained results.
All filaments were stored in the producer’s vacuum package with silica gel to prevent filament exposure to humid air before the start of experiments. Two types of samples were prepared and tested: “short” cylinders of l = 4 mm marked with an asterisk (*), as given in Table 1, and “long” cylinders with a length of l = 100 mm (all materials are listed in the table, except ABS Black). The nominal diameter of the filaments was 2R = 2.8 mm (except Ultem and Antero, with a diameter of 2R = 1.75 mm). “Short” cylinders were intended for accelerated moisture sorption tests, while “long” cylinders, in turn, were for long-term sorption, swelling, and mechanical tests. All samples were cut with a knife and the cylinder ends were polished.
Moisture sorption experiments were performed in desiccators with varying levels of RH of the atmosphere created using silica gel (12%) and saturated salt solutions: LiCl (16%), KSCN (47%), NaCl (75%), and K2SO4 (97%). From 10 to 15 “short” and 5 “long” cylinder samples were placed in each desiccator. Silica gel was dried in an oven at a temperature of 150 °C for 3 h. A datalogger Extech Instrument RHT10 (Extech Instruments, NH, USA) was used to control the humidity, temperature, and dew-point values in the desiccators. It was revealed that after a desiccator lid was opened during the experiment, it took up to 20 h to restore the moisture environment in the desiccator after closure. The mass of the samples was controlled only once per day at the initial stage of the sorption process and later once per week using the Mettler-Toledo XS205DU Analytical Balance Scale (Mettler-Toledo, Switzerland) range 81/220 g with an accuracy of ± 0.00001 g. The relative water content of a sample w(t) was calculated using the equation
w ( t ) = m ( t ) m 0 m 0 100 %
where m(t) and m0 are the current and initial mass of a sample.
The samples were considered to be in the equilibrium state if small mass oscillations were observed only around a value during a certain time interval, which was approximately the same as that of the sorption process. All moisture content values during the interval were averaged and considered as the equilibrium moisture content.
The length of “long” cylinders was measured for swelling calculations during moisture sorption experiments. A Mitutoyo Absolute digital micrometre 100–125 mm (Mitutoyo, Japan) with a precision of ± 0.001 mm was used for the measurements. This parameter has quite a big scatter in terms of its physical nature because the length of a sample changes by ca. 0.1% or less. Multiple length measurements for “long” samples were performed to reduce the data scatter.
Mechanical tensile tests of filaments moistened in a humid atmosphere till equilibrium were performed on the ZWICK 2.5 machine (ZwickRoell GmbH, Germany) with a 10 mm/min crosshead displacement rate. The tensile strain was measured by grip-to-grip separation with a nominal distance of 50 mm. A pre-load of 1 N was applied to all samples. The elastic modulus was calculated in the strain range of 0.05–0.25%. The tensile test duration till fracture depended on the material, but it was less than 1 min. Thus, the mass loss of absorbed moisture was neglected during the test. Three to five moistened specimens were tested for each material and each environment, and the average data were used.
4. Results and Discussion

4.1. Water Sorption

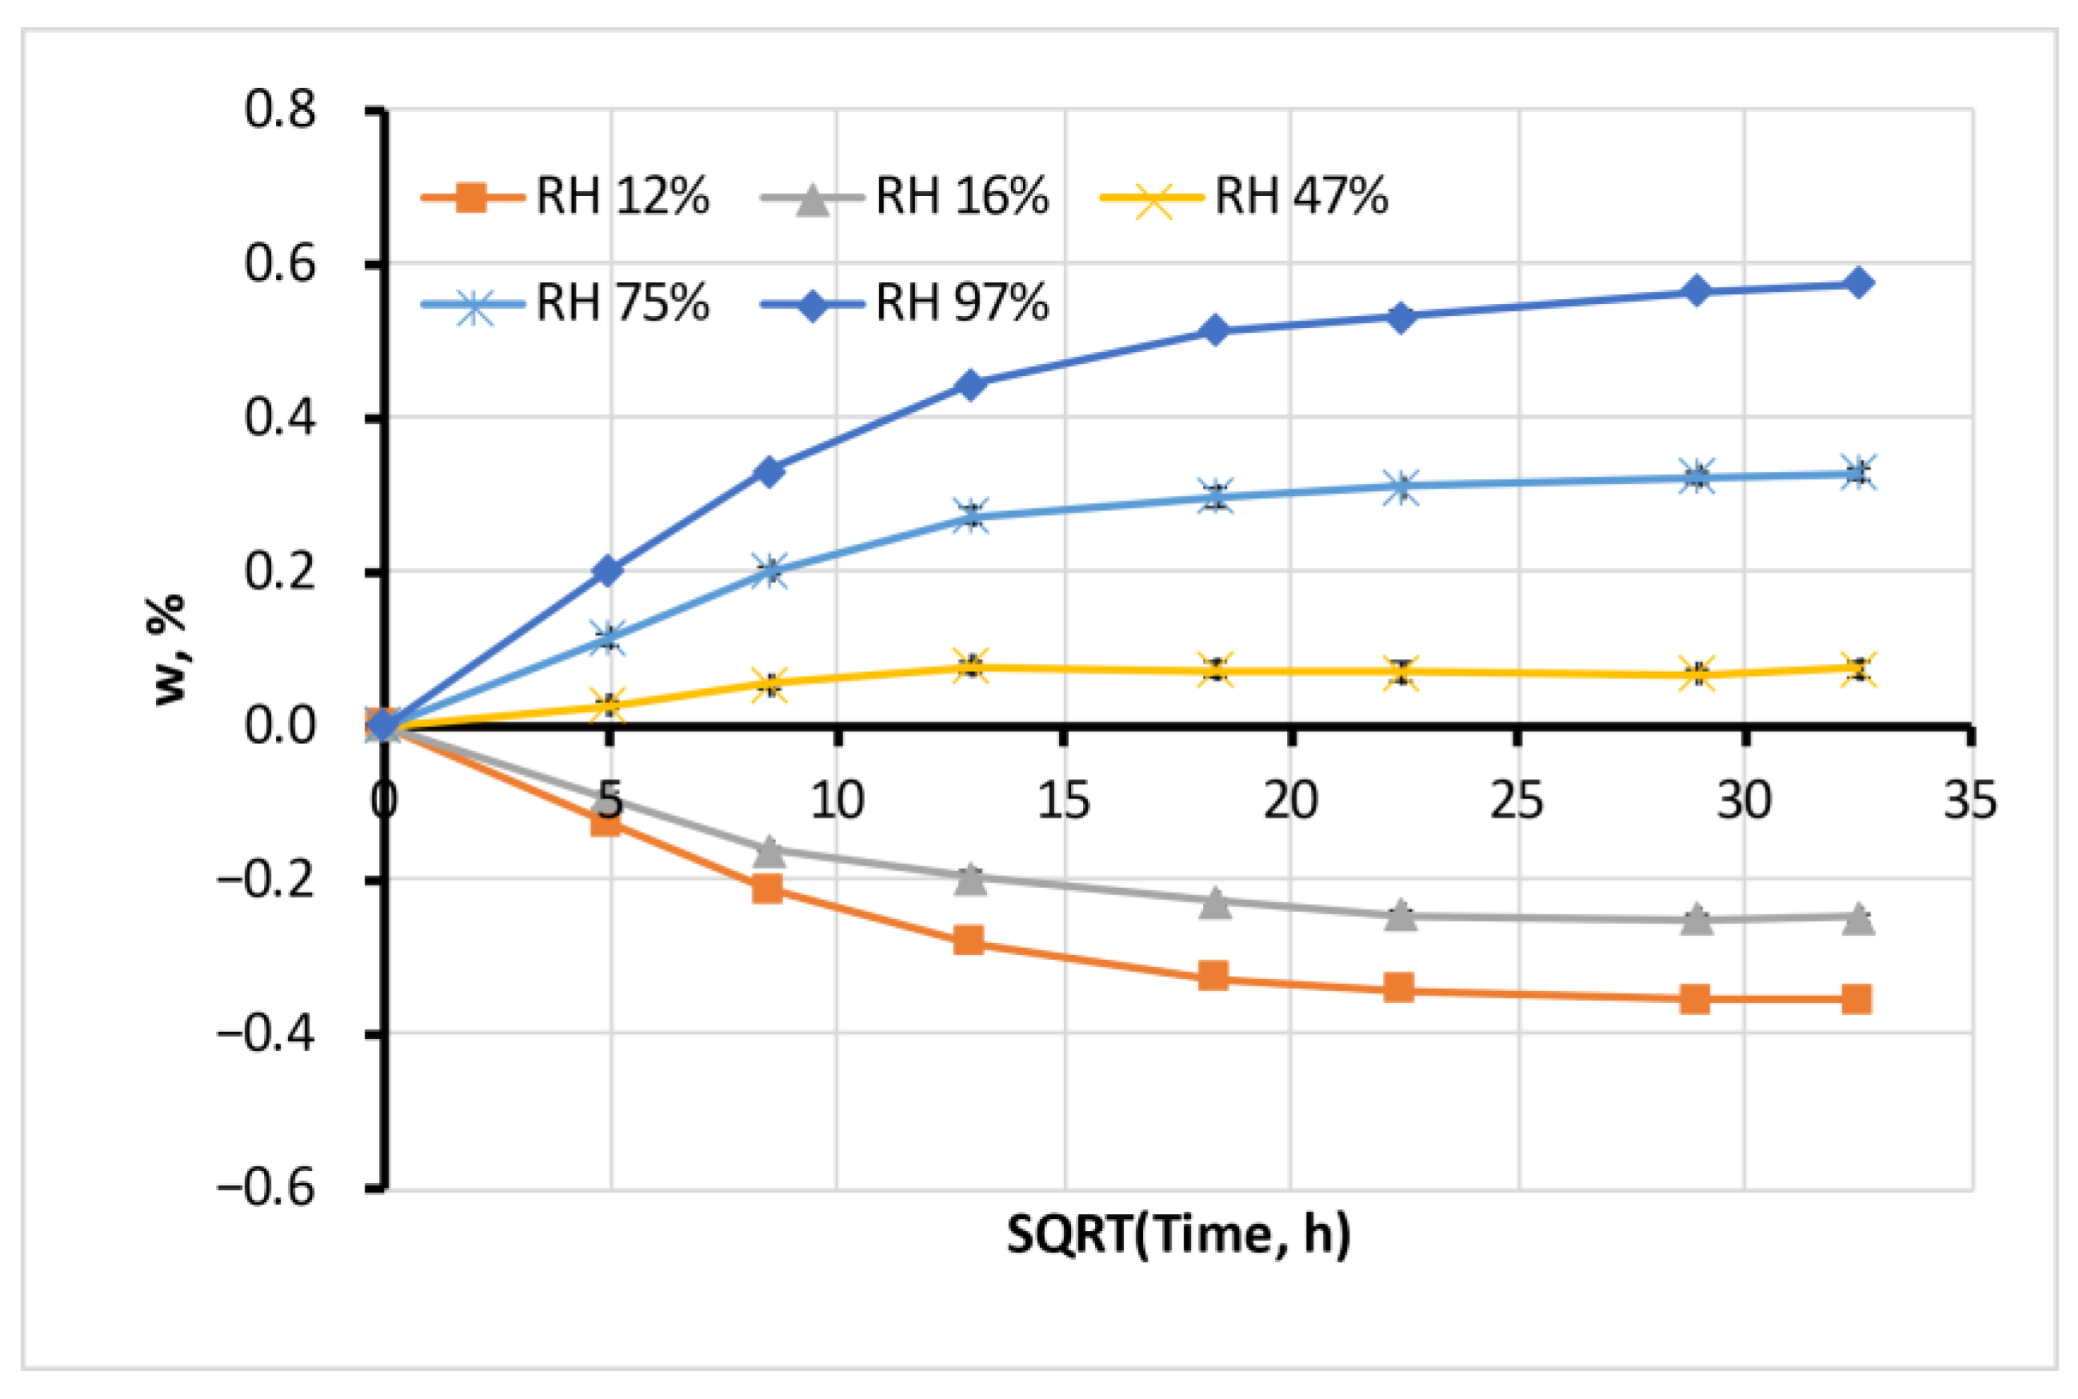
The sorption behaviour of all tested materials follows the classical Fick’s law. Figure 4 represents typical moisture sorption curves for Antero in atmospheres with various levels of RH. The sorption process had one stage, the sorption curves had initial linear segments, and the moisture content in samples reached equilibrium.
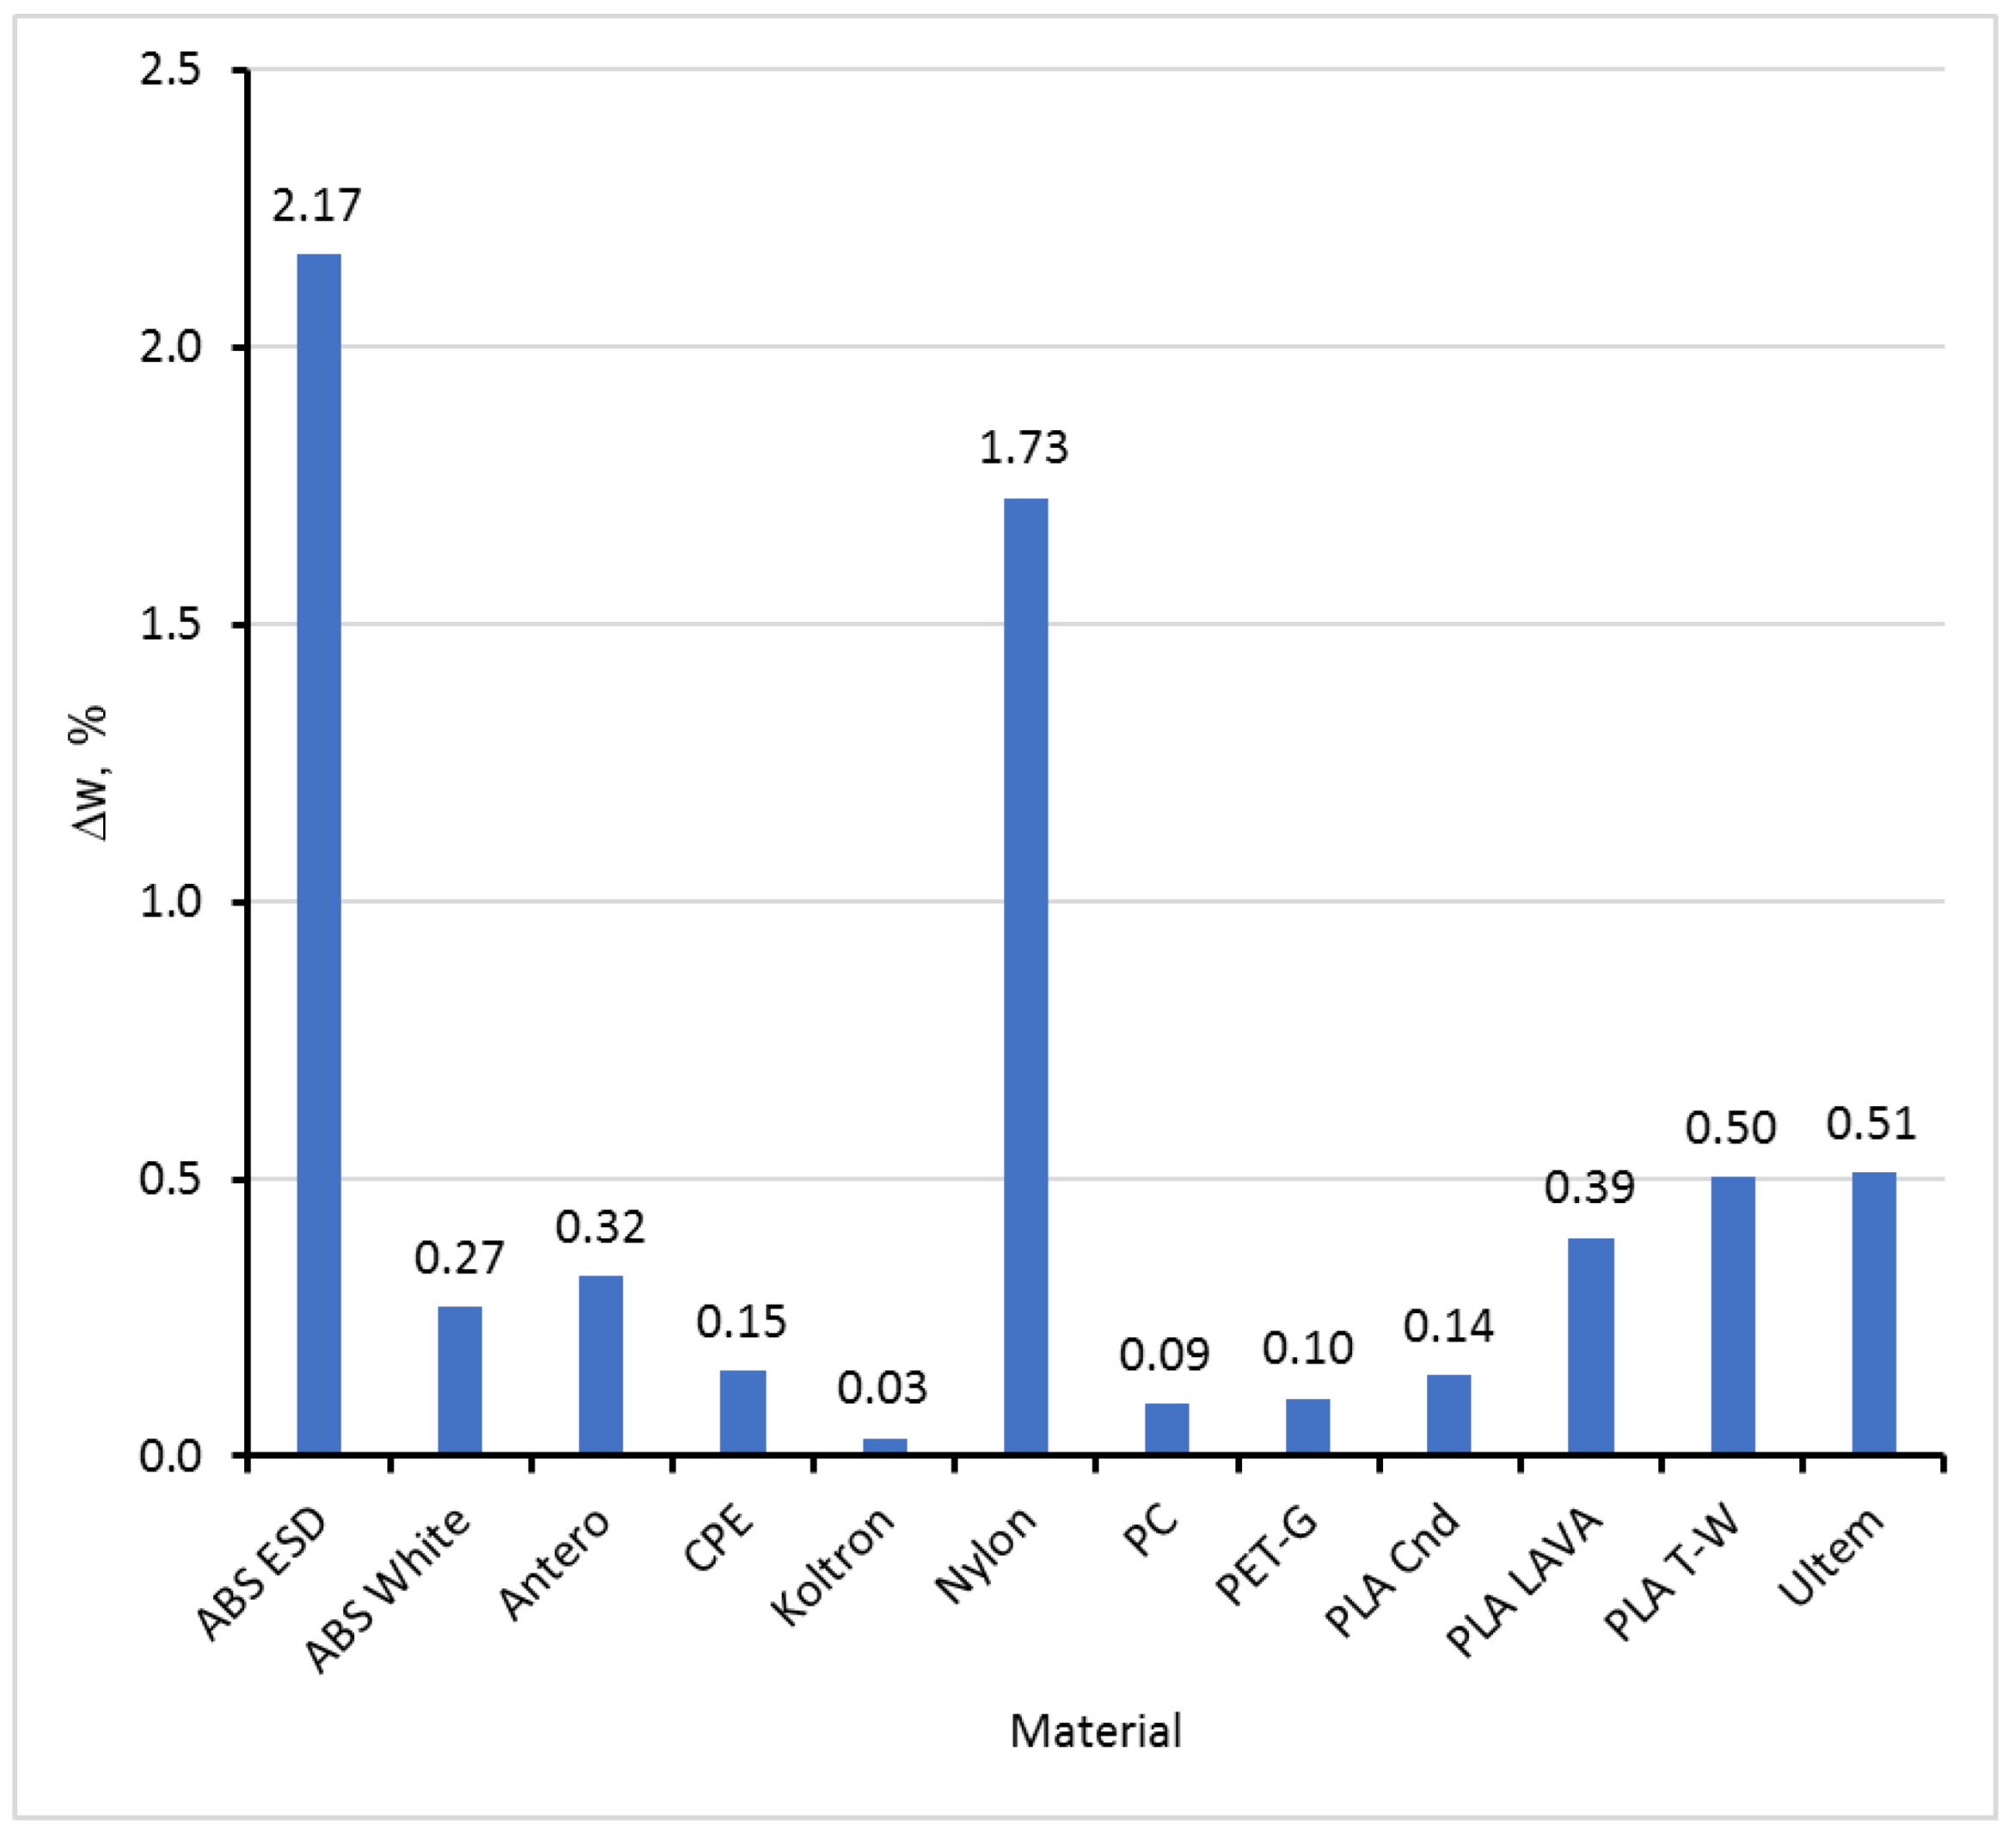
All filaments, as produced, had some unknown initial moisture content. The tested samples were not preliminarily dried before the sorption experiments. This fact explains why the filaments lost their mass in desiccators with a dry atmosphere. The ability of a material to absorb moisture could be characterised by the difference between the moisture content value obtained in the driest and wettest atmospheres. The moisture sorption capacity of the tested materials, Δw, in 24 h is presented in Figure 5.
Materials with low (ca. 0.1% or less), moderate (0.1–0.5%), and high (more than 0.5%) moisture absorption capacity in 24 h could be classified based on the data in Figure 5.
Two unknown variables in (5) characterising moisture sorption kinetics, w and D, were found using curve fitting on the experimental sorption data for all materials and all conditions. The aim function minimised during the fitting procedure was calculated as the average relative deviation. A set of equilibrium moisture content values for various values of RH give the sorption isotherm of a material. The linear approach to this dependence on RH is well known as Henry’s law. Nonlinear dependencies are known as Brunauer, Emmett, and Teller (also known as BET) classification. For practical applications, the following equation was used for both cases:
w = a RH c + b
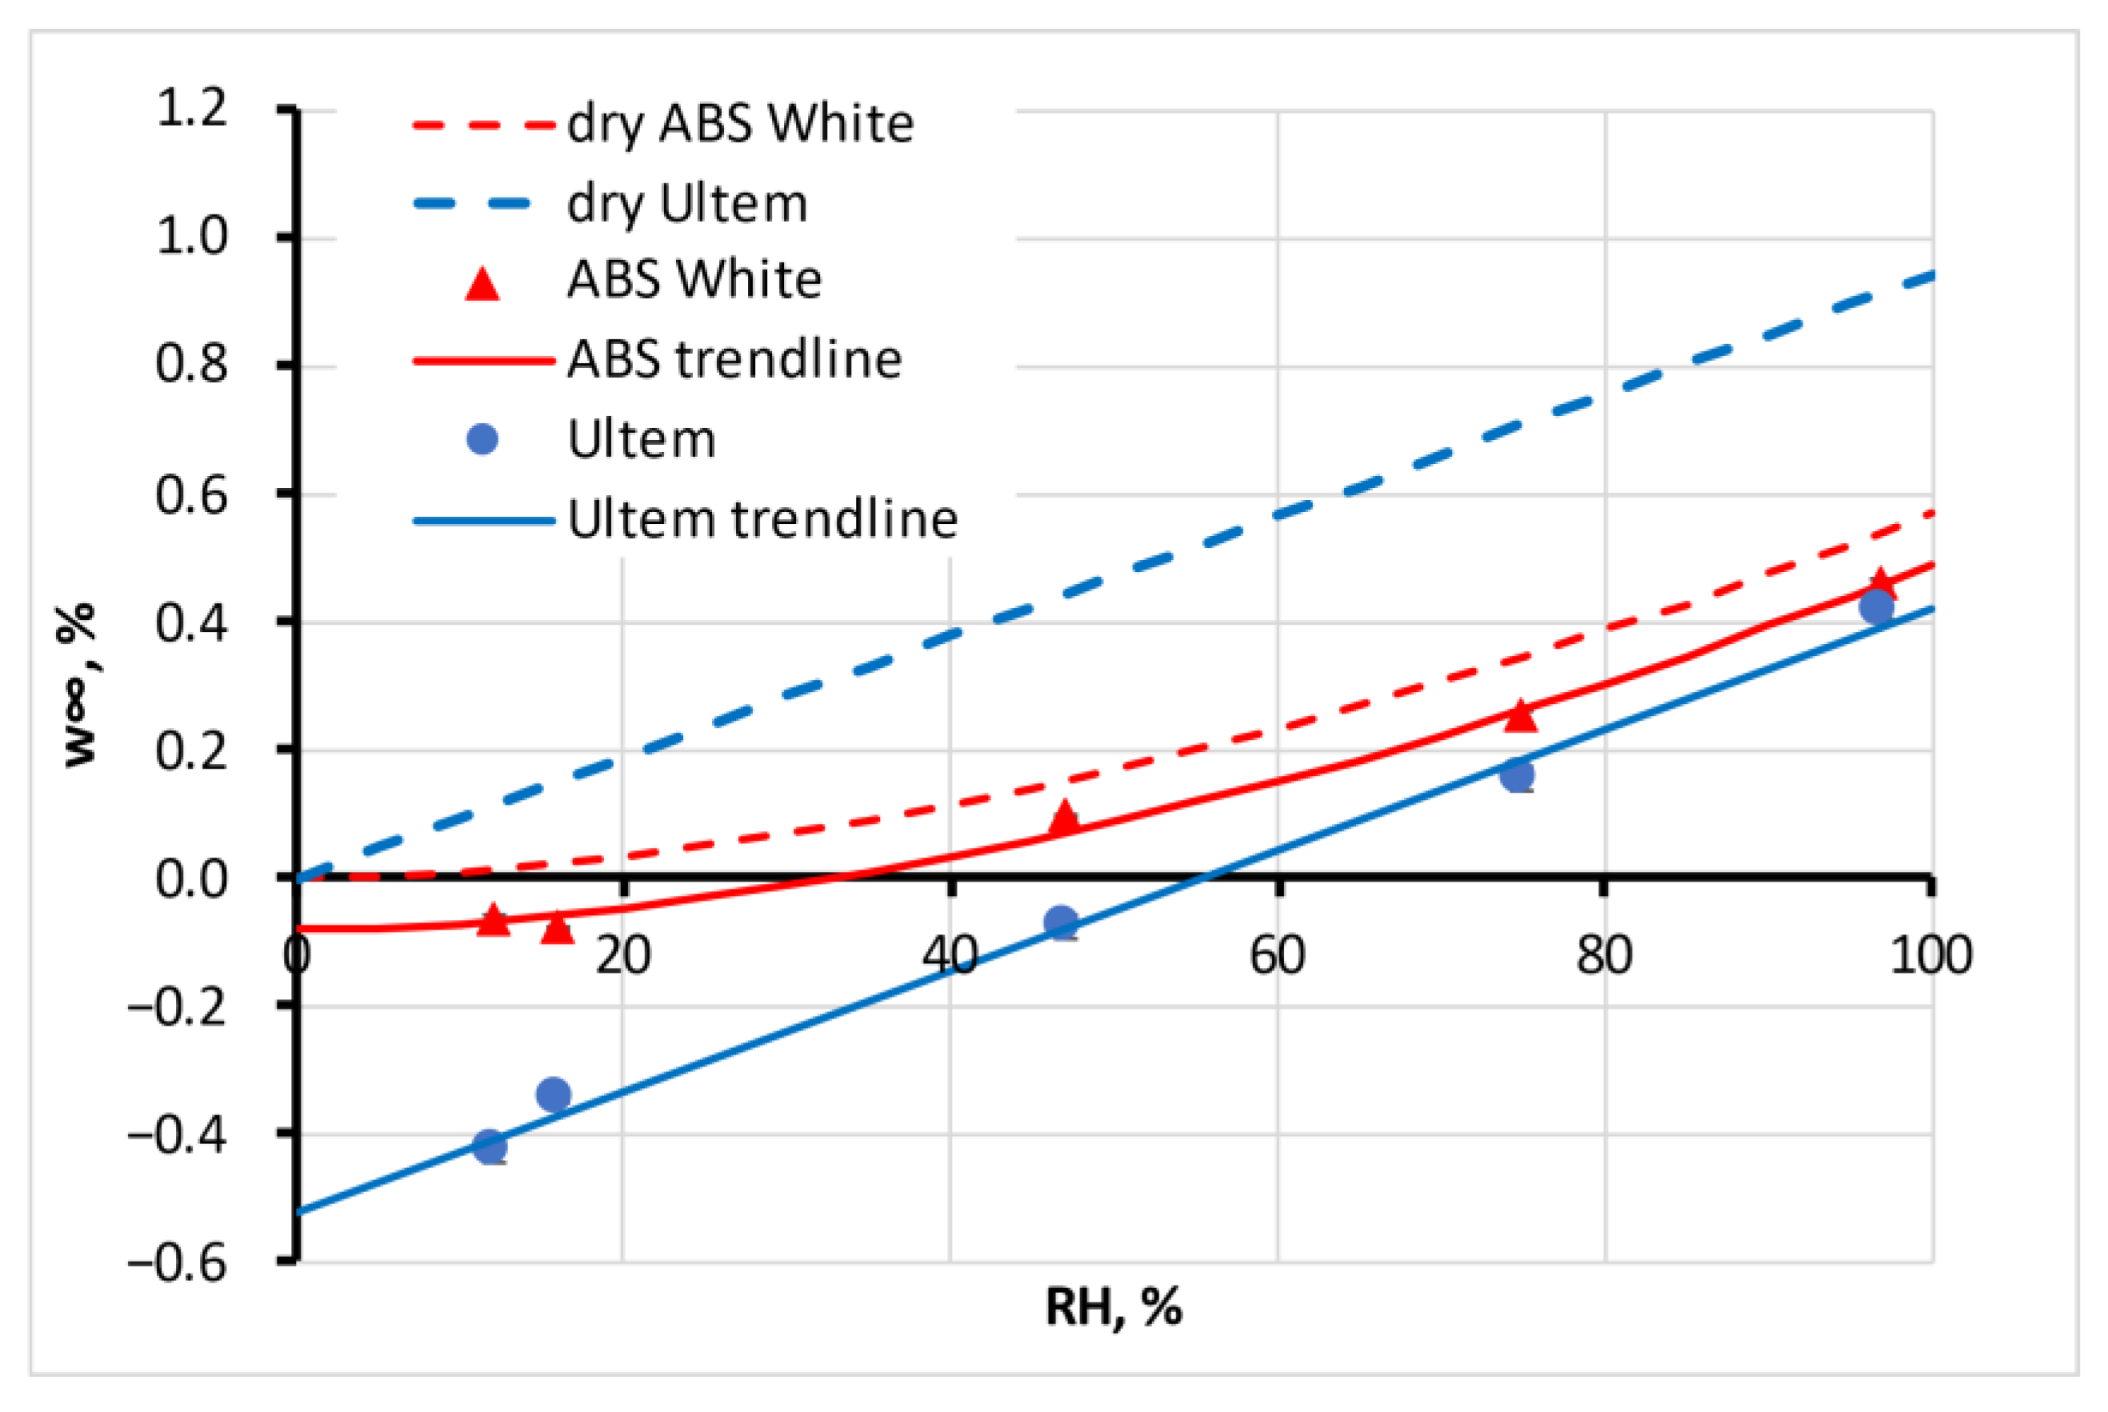
where a, b, and c are coefficients unique to each material. Typical sorption isotherms of Ultem (linear, Henry’s law) and ABS White (BET, Type 3) are presented in Figure 6. In the figure, experimental dots are shown, their approximations given by solid lines and shifted approximations for the materials if they should be initially dry (dashed lines). This shift means that the parameter b = 0.
The coefficients of the approximation (7) and maximal (in equilibrium) moisture sorption capacity Δw for all tested materials are presented in Table 2.
The isotherms for all materials are shifted down along the ordinate axis (parameter b is negative) because all of the tested filaments were not dry before the experiments but were used as produced by the manufacturers. The maximal moisture sorption capacity of the tested materials, Δw, for the equilibrium state is also presented in Table 2.
Comparing the maximal moisture absorption capacity in 24 h (Figure 5) or at equilibrium (Table 2) for the tested materials, it could be concluded that this parameter does not depend significantly on the material type, whether the material is hydrophobic or hydrophilic, or the crystallinity. An exception is Nylon, with its extremely high absorption capacity and possible chemical changes in its structure, such as hydrolysis during absorption [29]. Please note that the density of Nylon presented in Table 1 is very low compared with other tested materials. Active fillers such as carbon black, often not disclosed by manufacturers, do not change the maximal moisture absorption capacity for PLA LAVA or PLA Cnd, while more than an order of magnitude increases this parameter for ABS ESD with respect to ABS White. The density of ABS ESD is the lowest for the tested materials. The low density of Nylon and ABS ESD likely means a high free volume of the materials that is occupied by absorbed water and that provides the high moisture sorption capacity of both materials. More detailed and complex research is required to reveal the connections between the structure of filaments and their moisture absorption behaviour, especially considering possible recrystallisation and density changes, e.g., for PLA filament and printed samples, as discussed in [28].
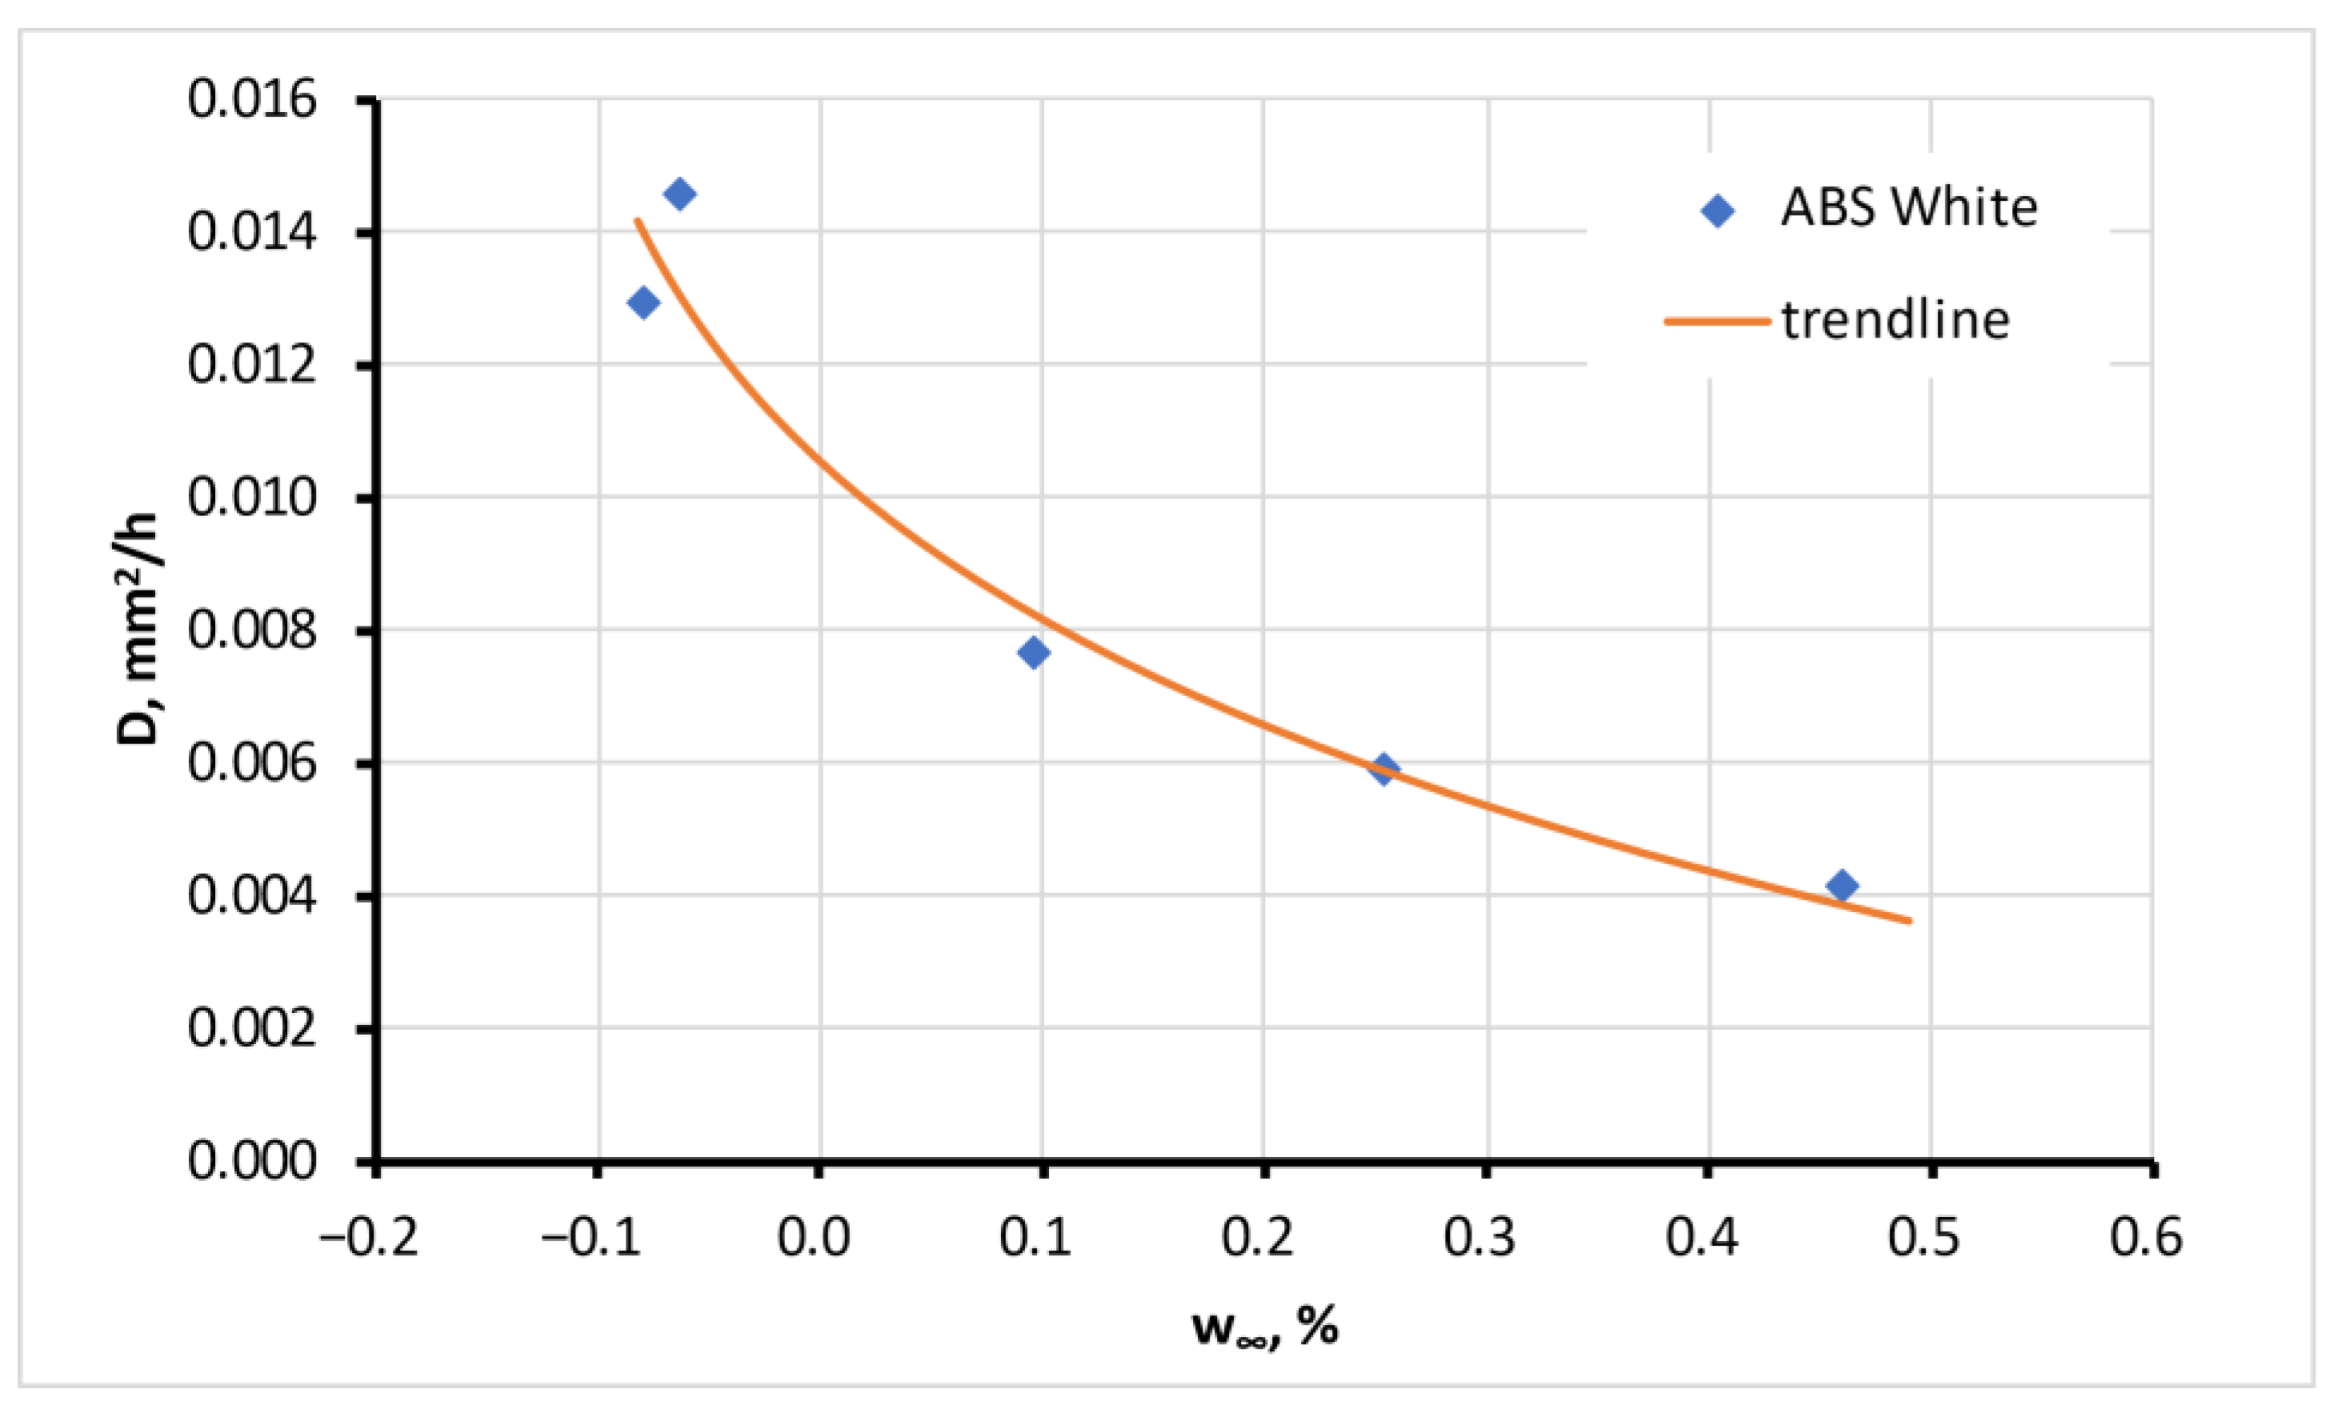
The second parameter found during the curve fitting of calculation (5) to experimental sorption curves was diffusivity, D. The coefficient could be assumed as independent of the moisture content for six tested materials. This independence was preliminarily supposed and expected according to Fick’s law. For the other six materials, the diffusion coefficient changed with the moisture concentration in the atmosphere. The dependence significantly (four times) decreased for four materials, including ABS White, as presented in Figure 7. However, on the other hand, there was 2–3 times the growth for PLA Lava and PET-G. The physical explanation of such behaviour requires additional research.
The dependence of the diffusion coefficient of w was approximated by the equation
D ( w ) = a D ( w w 0 ) β + D 0
where aD, w0, and β are parameters of the diffusion coefficient trendline presented in Table 3. For the materials with the independent diffusion coefficient D on w, its value is also given in the table.
The last evaluated parameter was the time taken for a sample to reach 80% of its equilibrium moisture content, w80, for the highest RH, which was 97% for long cylinders. The parameter was calculated using linear regression and is presented in Table 3. This parameter gives an approximate estimate of the time necessary to reach equilibrium for the filament in humid environments.

4.2. Swelling

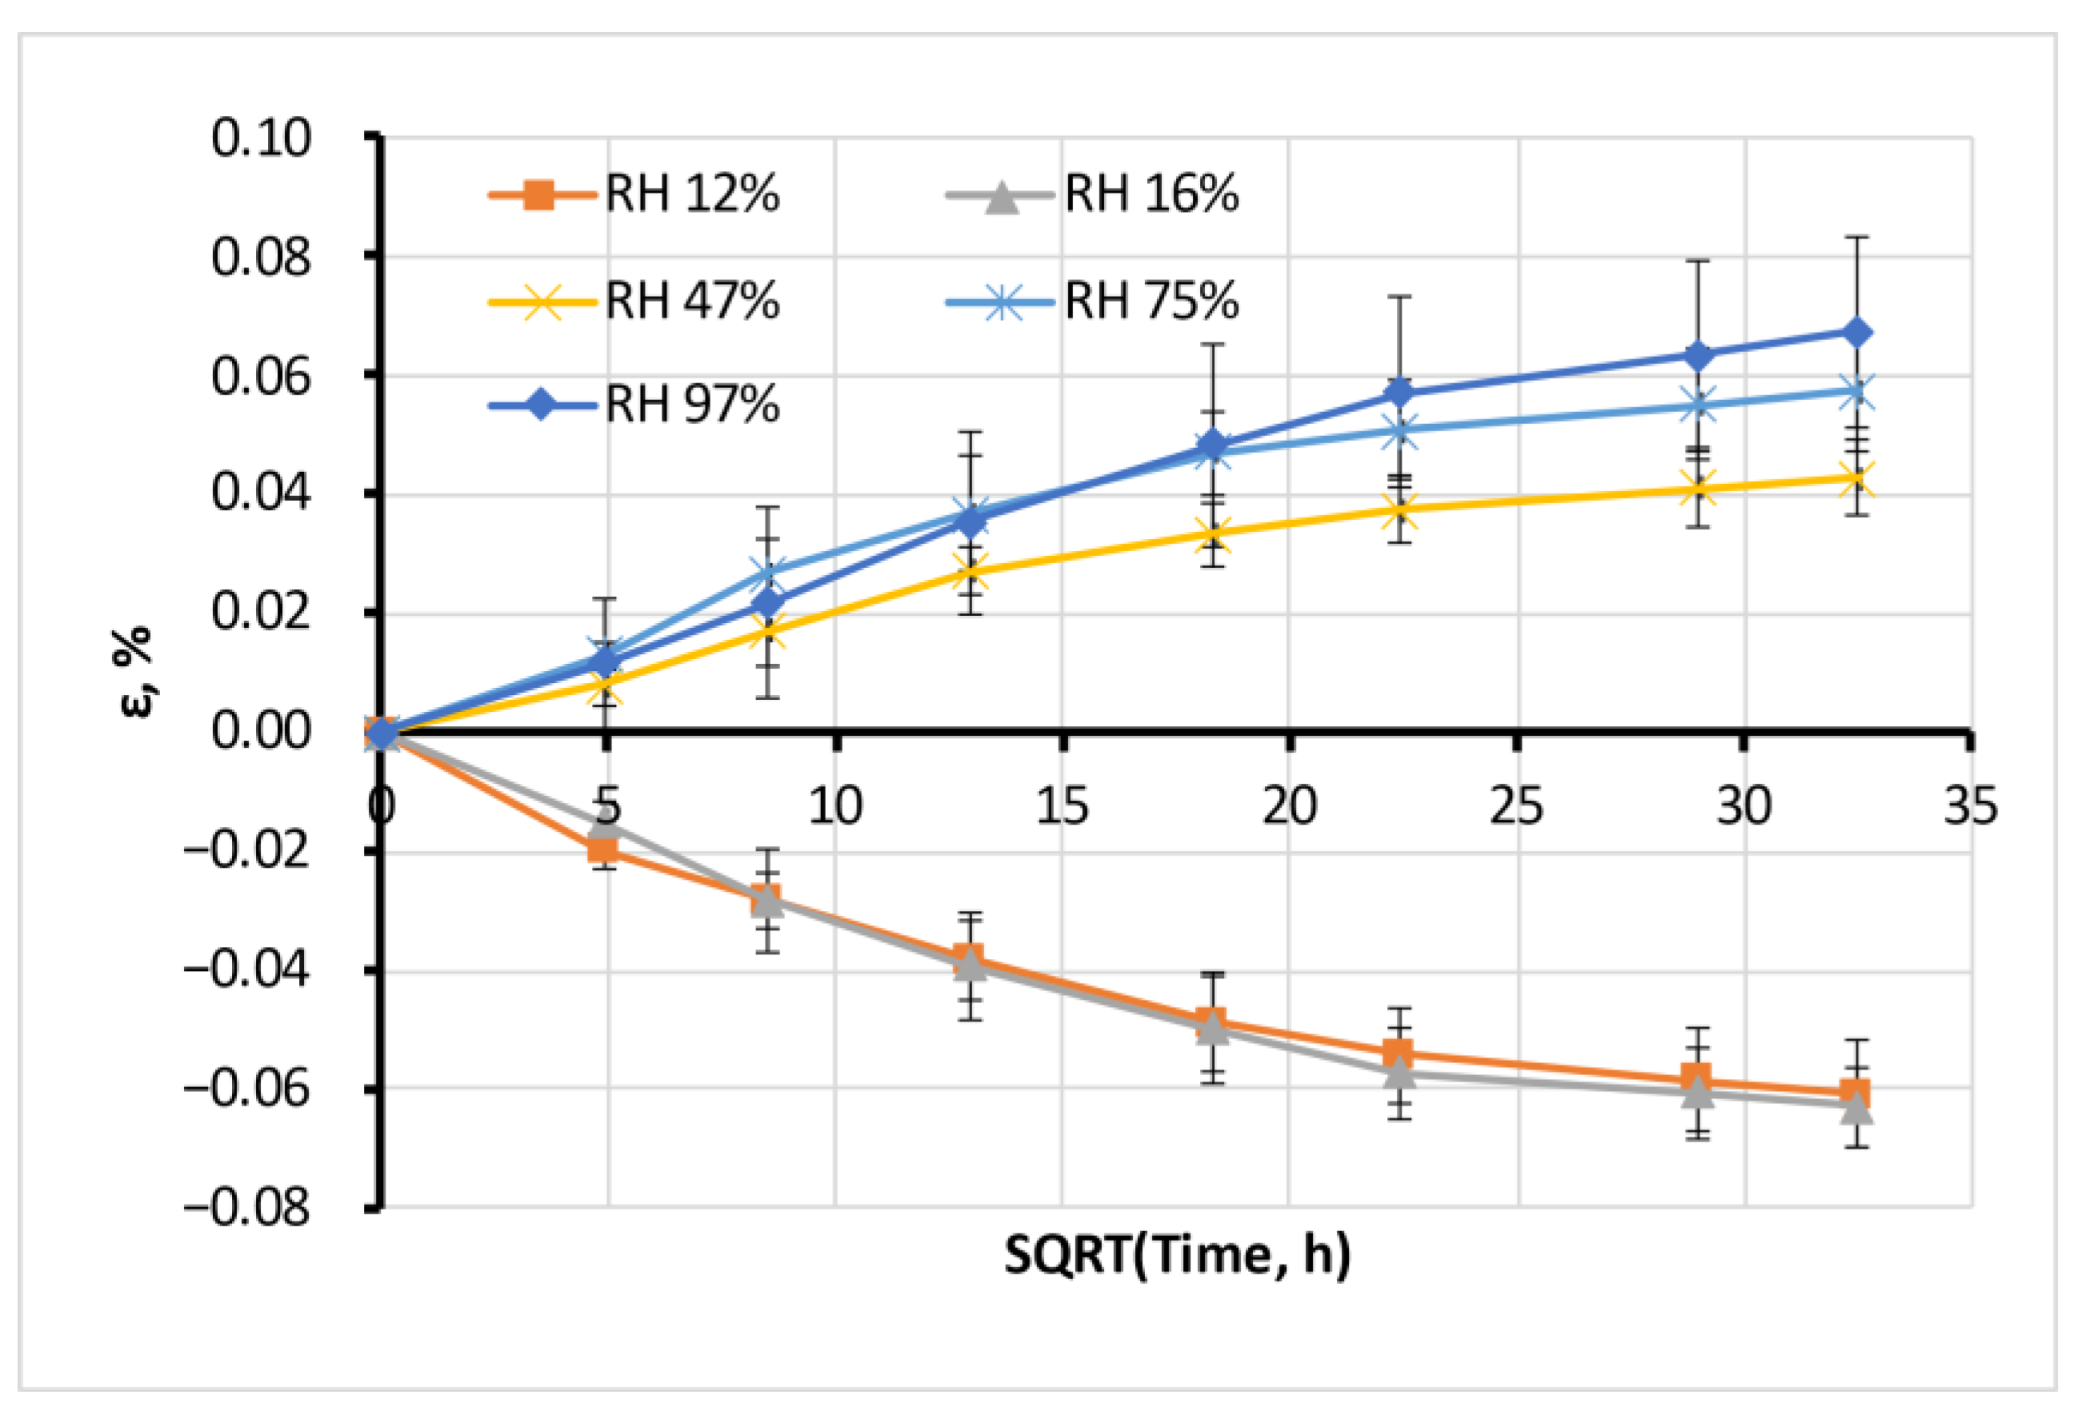
The moisture sorption of all tested filaments was accompanied by its swelling, measured on “long cylinder” samples. The typical swelling process for Antero is illustrated in Figure 8.
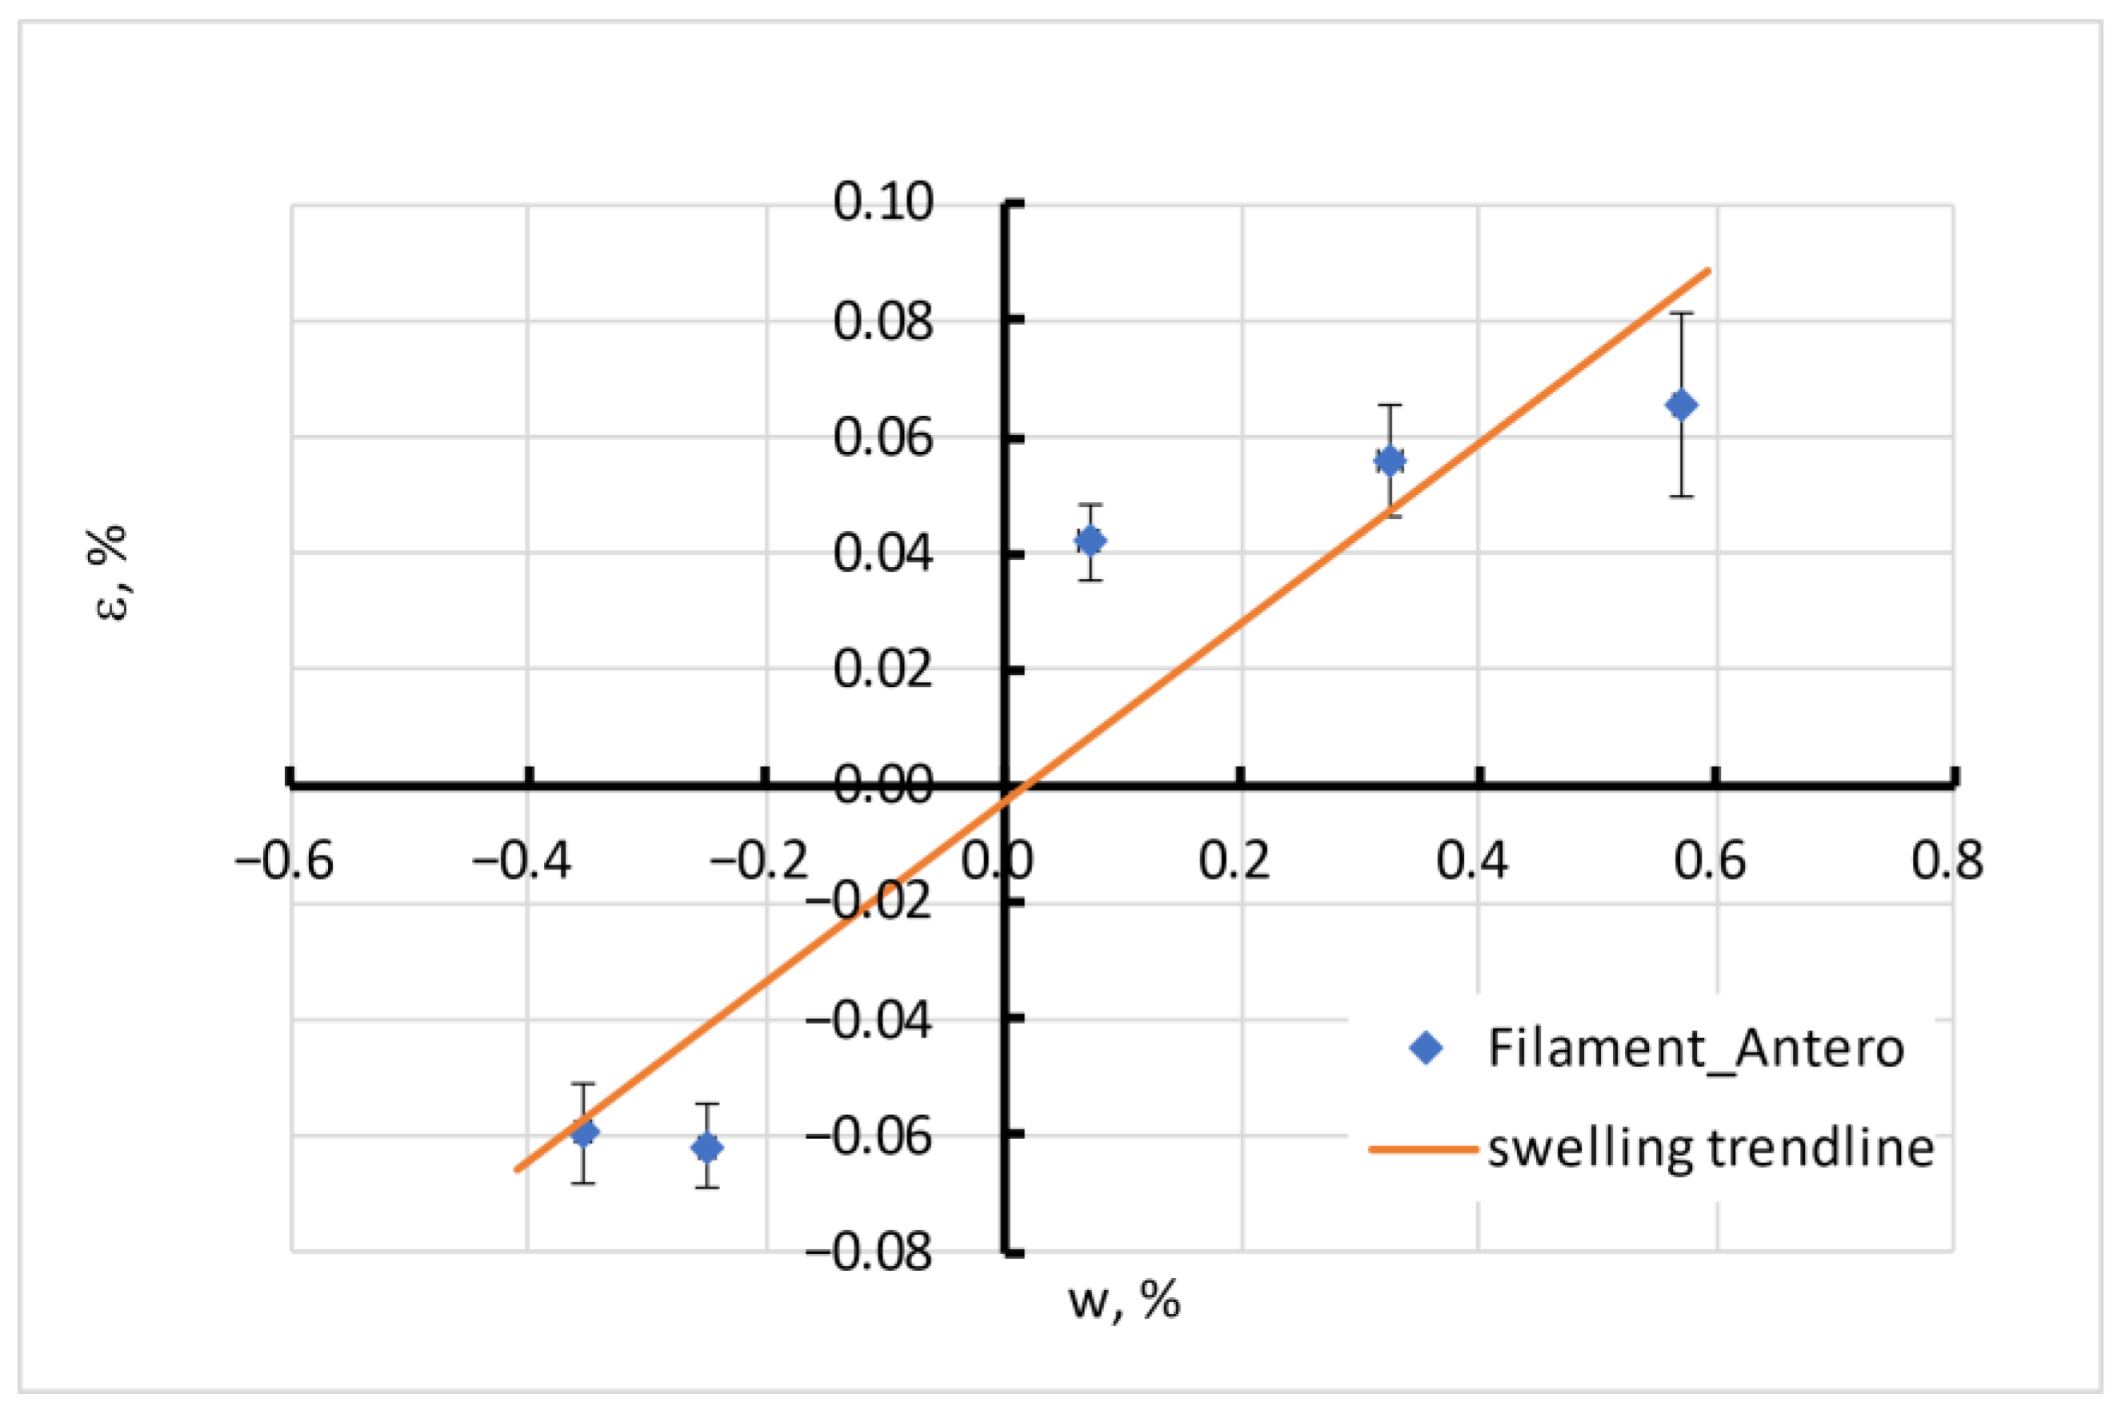
The swelling process, in general, follows the moisture absorption process. The swelling strain ε is proportional to the moisture content w in the material, as seen from the example of Antero material in Figure 9.
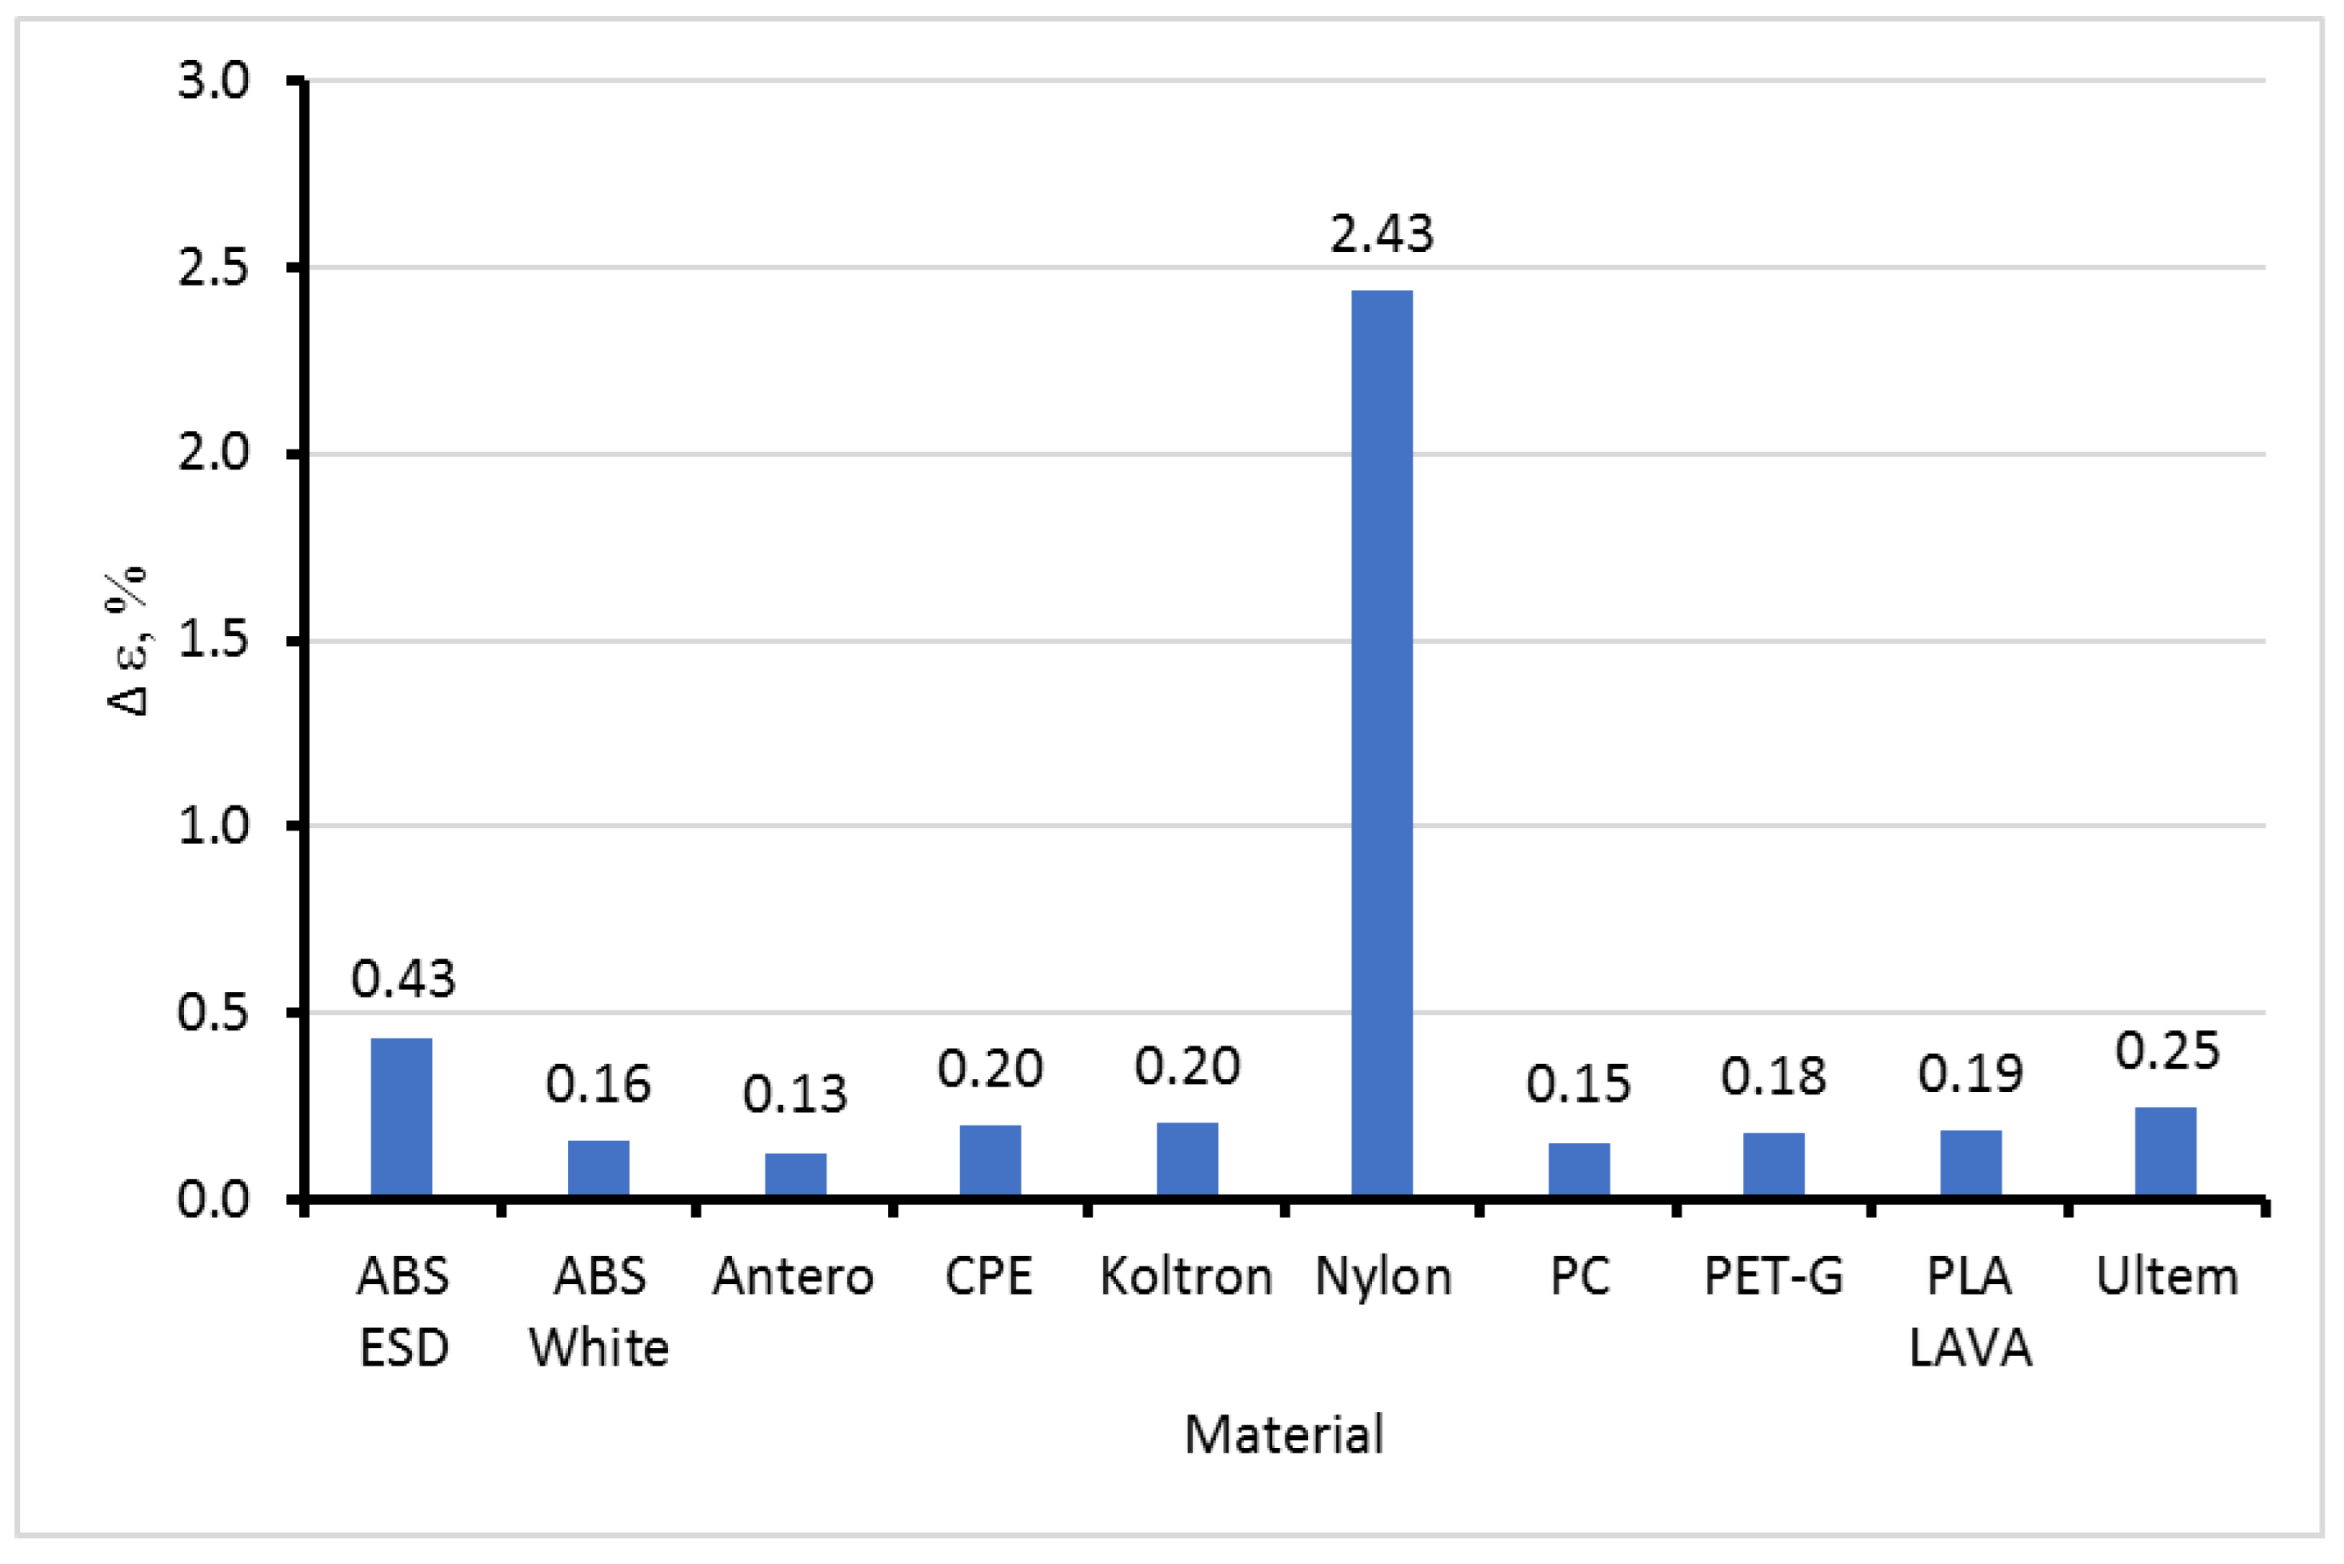
Negative swelling strain means a shrinkage corresponding to moisture desorption from a material. The maximal swelling ability of the materials in equilibrium Δε (analogous to the moisture sorption capacity) is presented in Figure 10.
The relationship between equilibrium moisture content and swelling strain ε was approximated by the linear function
ε = a w w + ε 0
where aw and ε0 are parameters presented in Table 4.
Most materials had a maximal swelling ability of 0.15−0.25%, which was not dependent on their structure and composition. Filled ABS ESD has a swelling ability significantly higher than that of ABS White. Nylon was an exception that shrank in humid environments by 2.43%.

4.3. Mechanical Tensile Tests

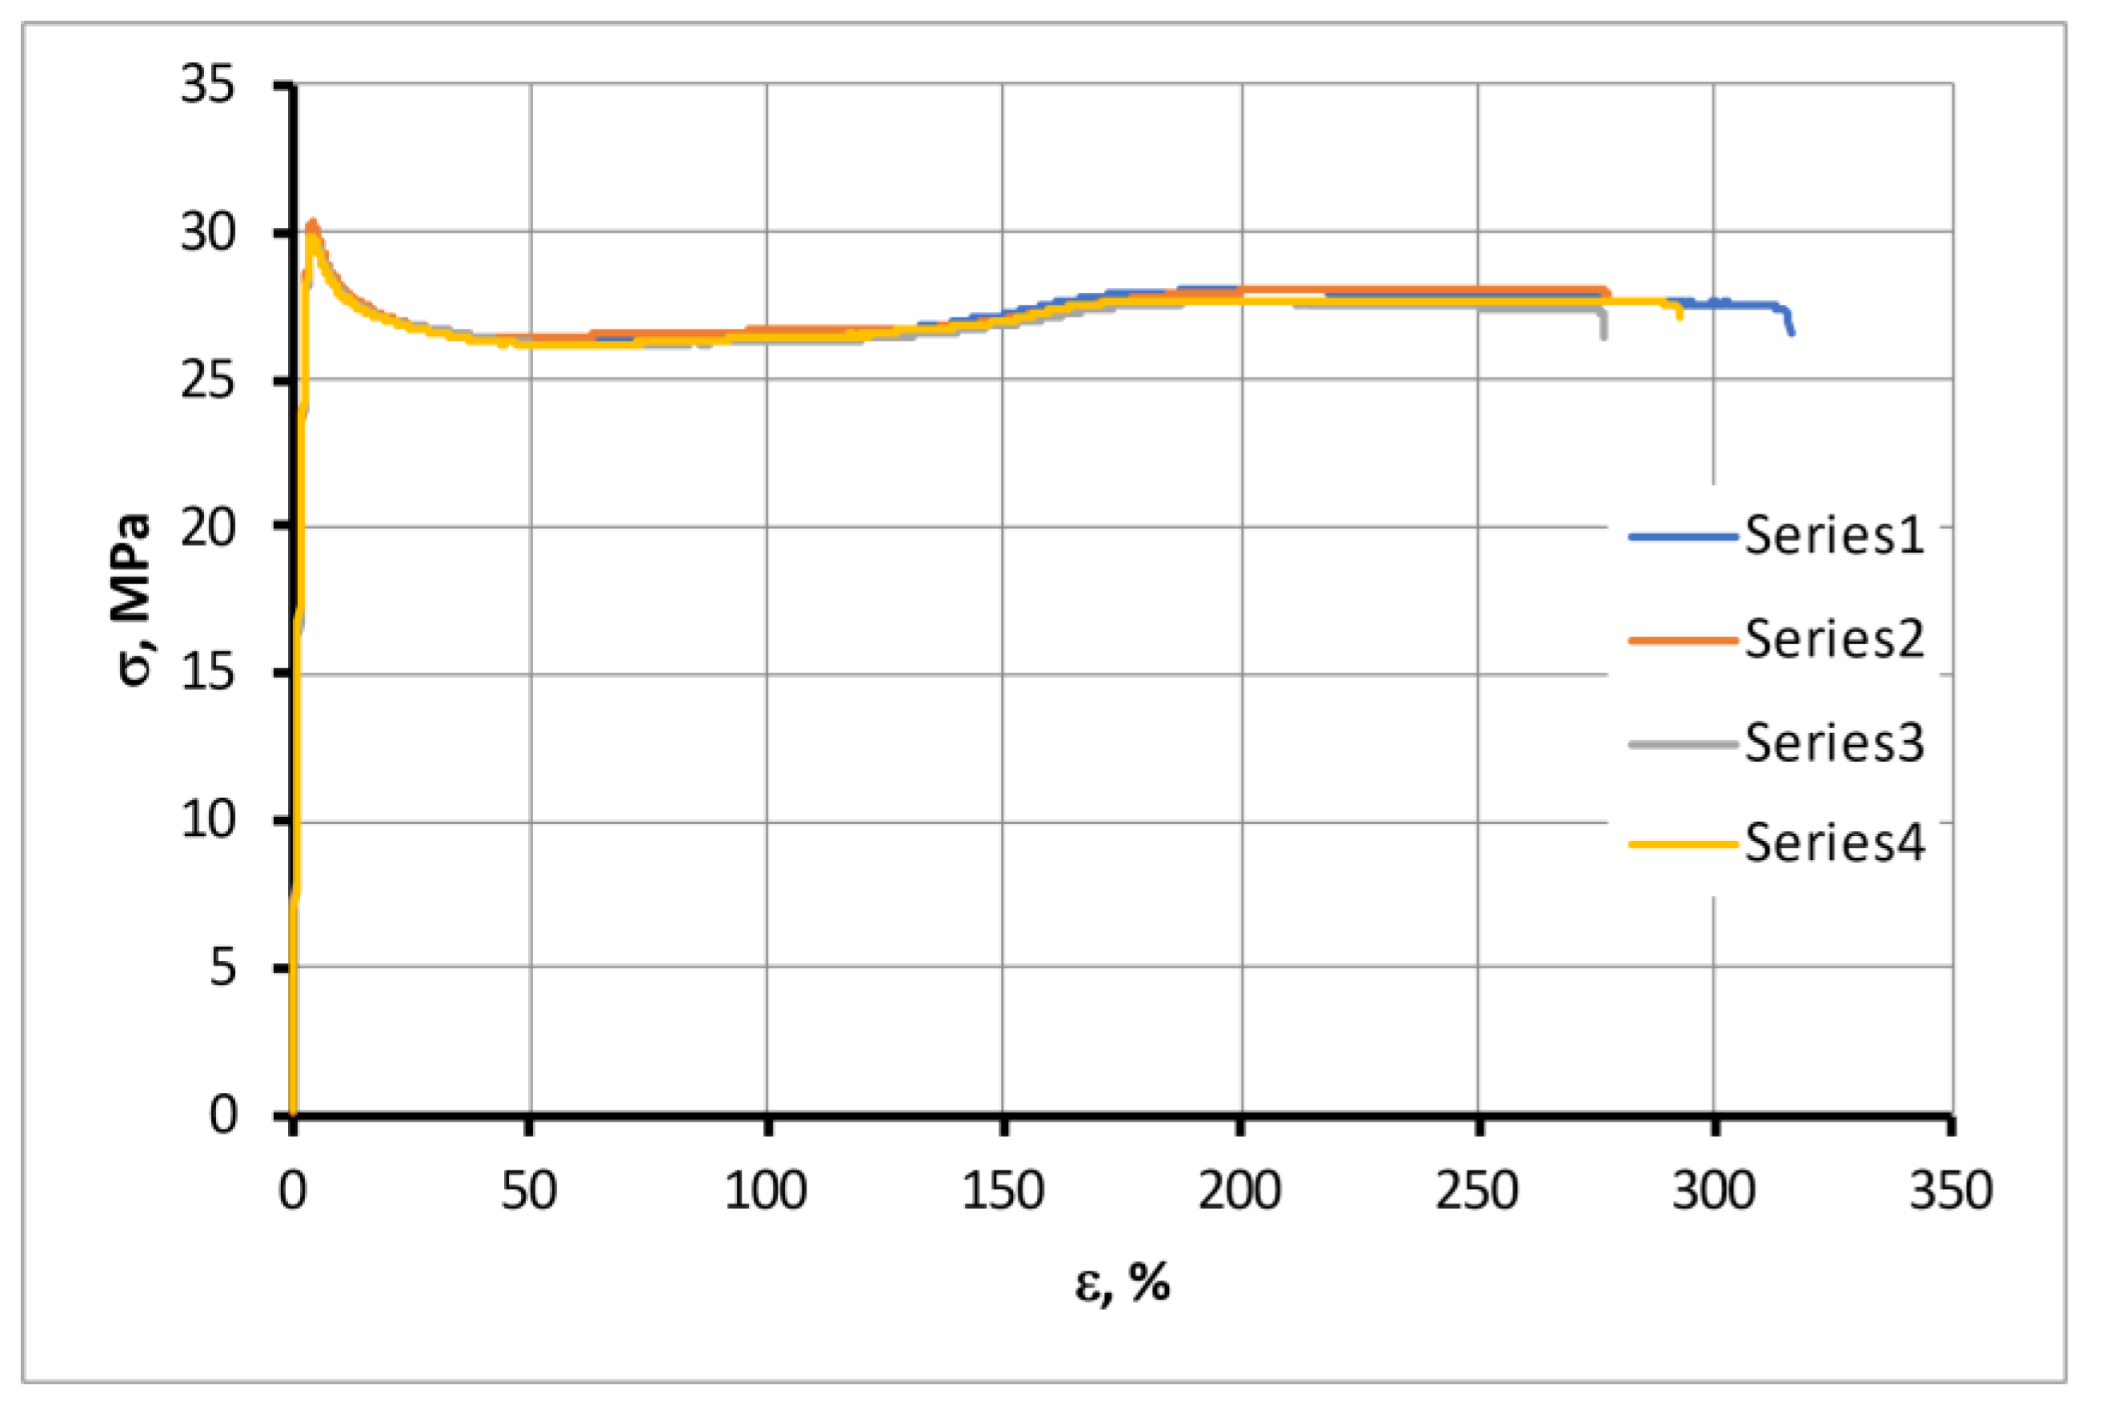
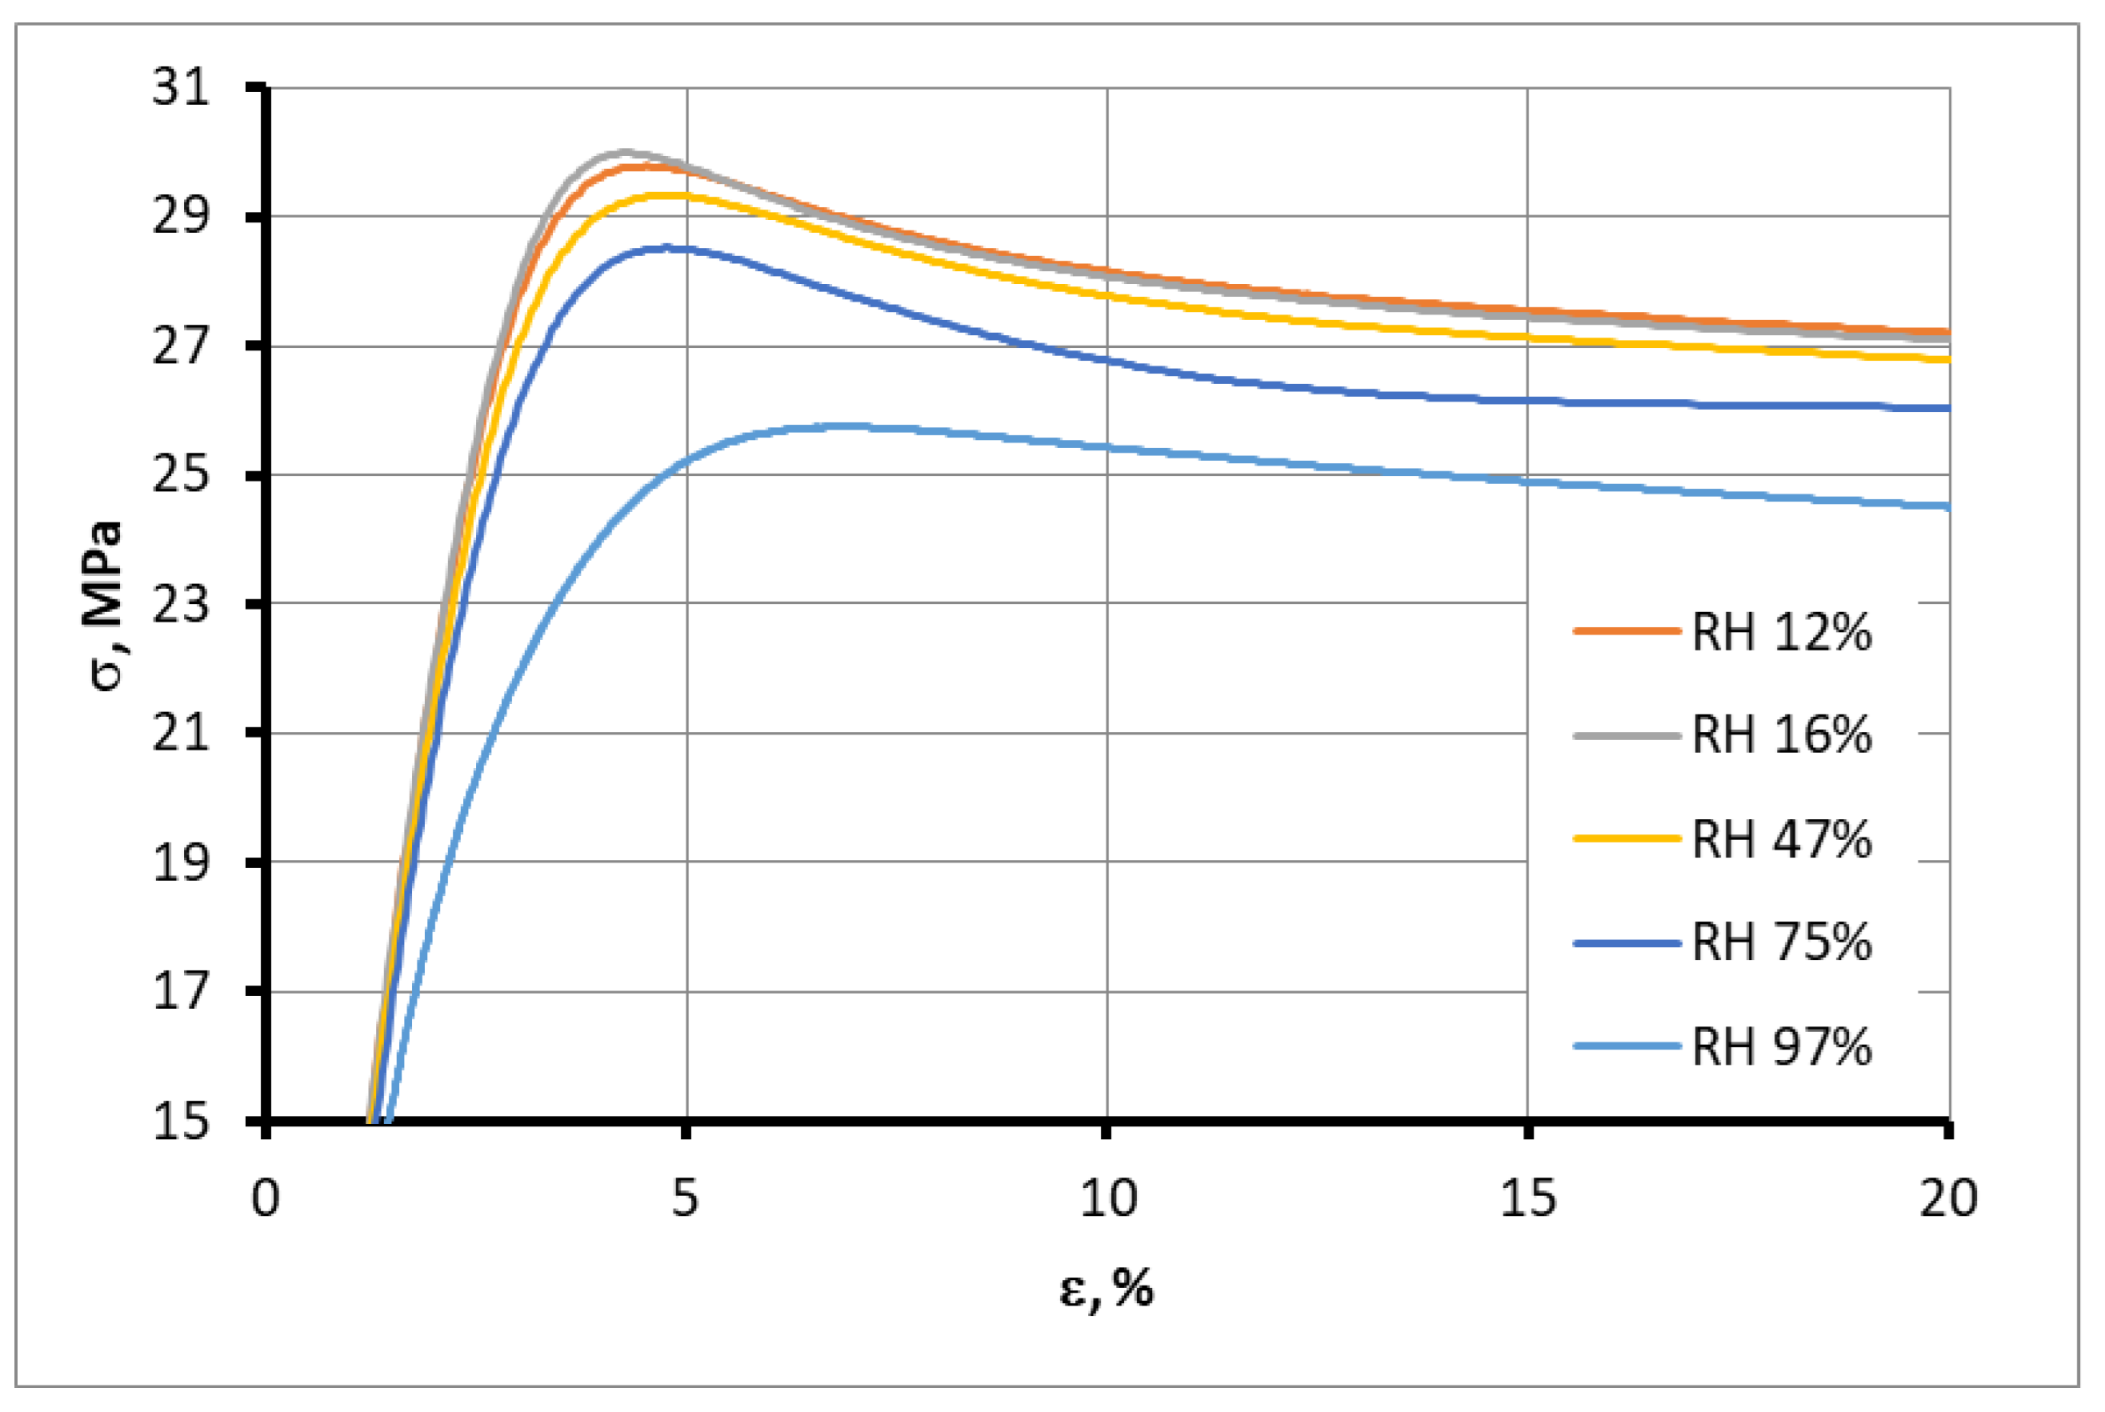
Mechanical tensile tests were performed on the samples moistened to saturation in the atmospheres mentioned above. This condition provides uniform moisture distribution across the sample section, which means an equilibrium state. Tension diagrams for four samples of ABS ESD moistened in an atmosphere with RH = 16%, as an example, are presented in Figure 11. The figure shows very little scatter in the data.
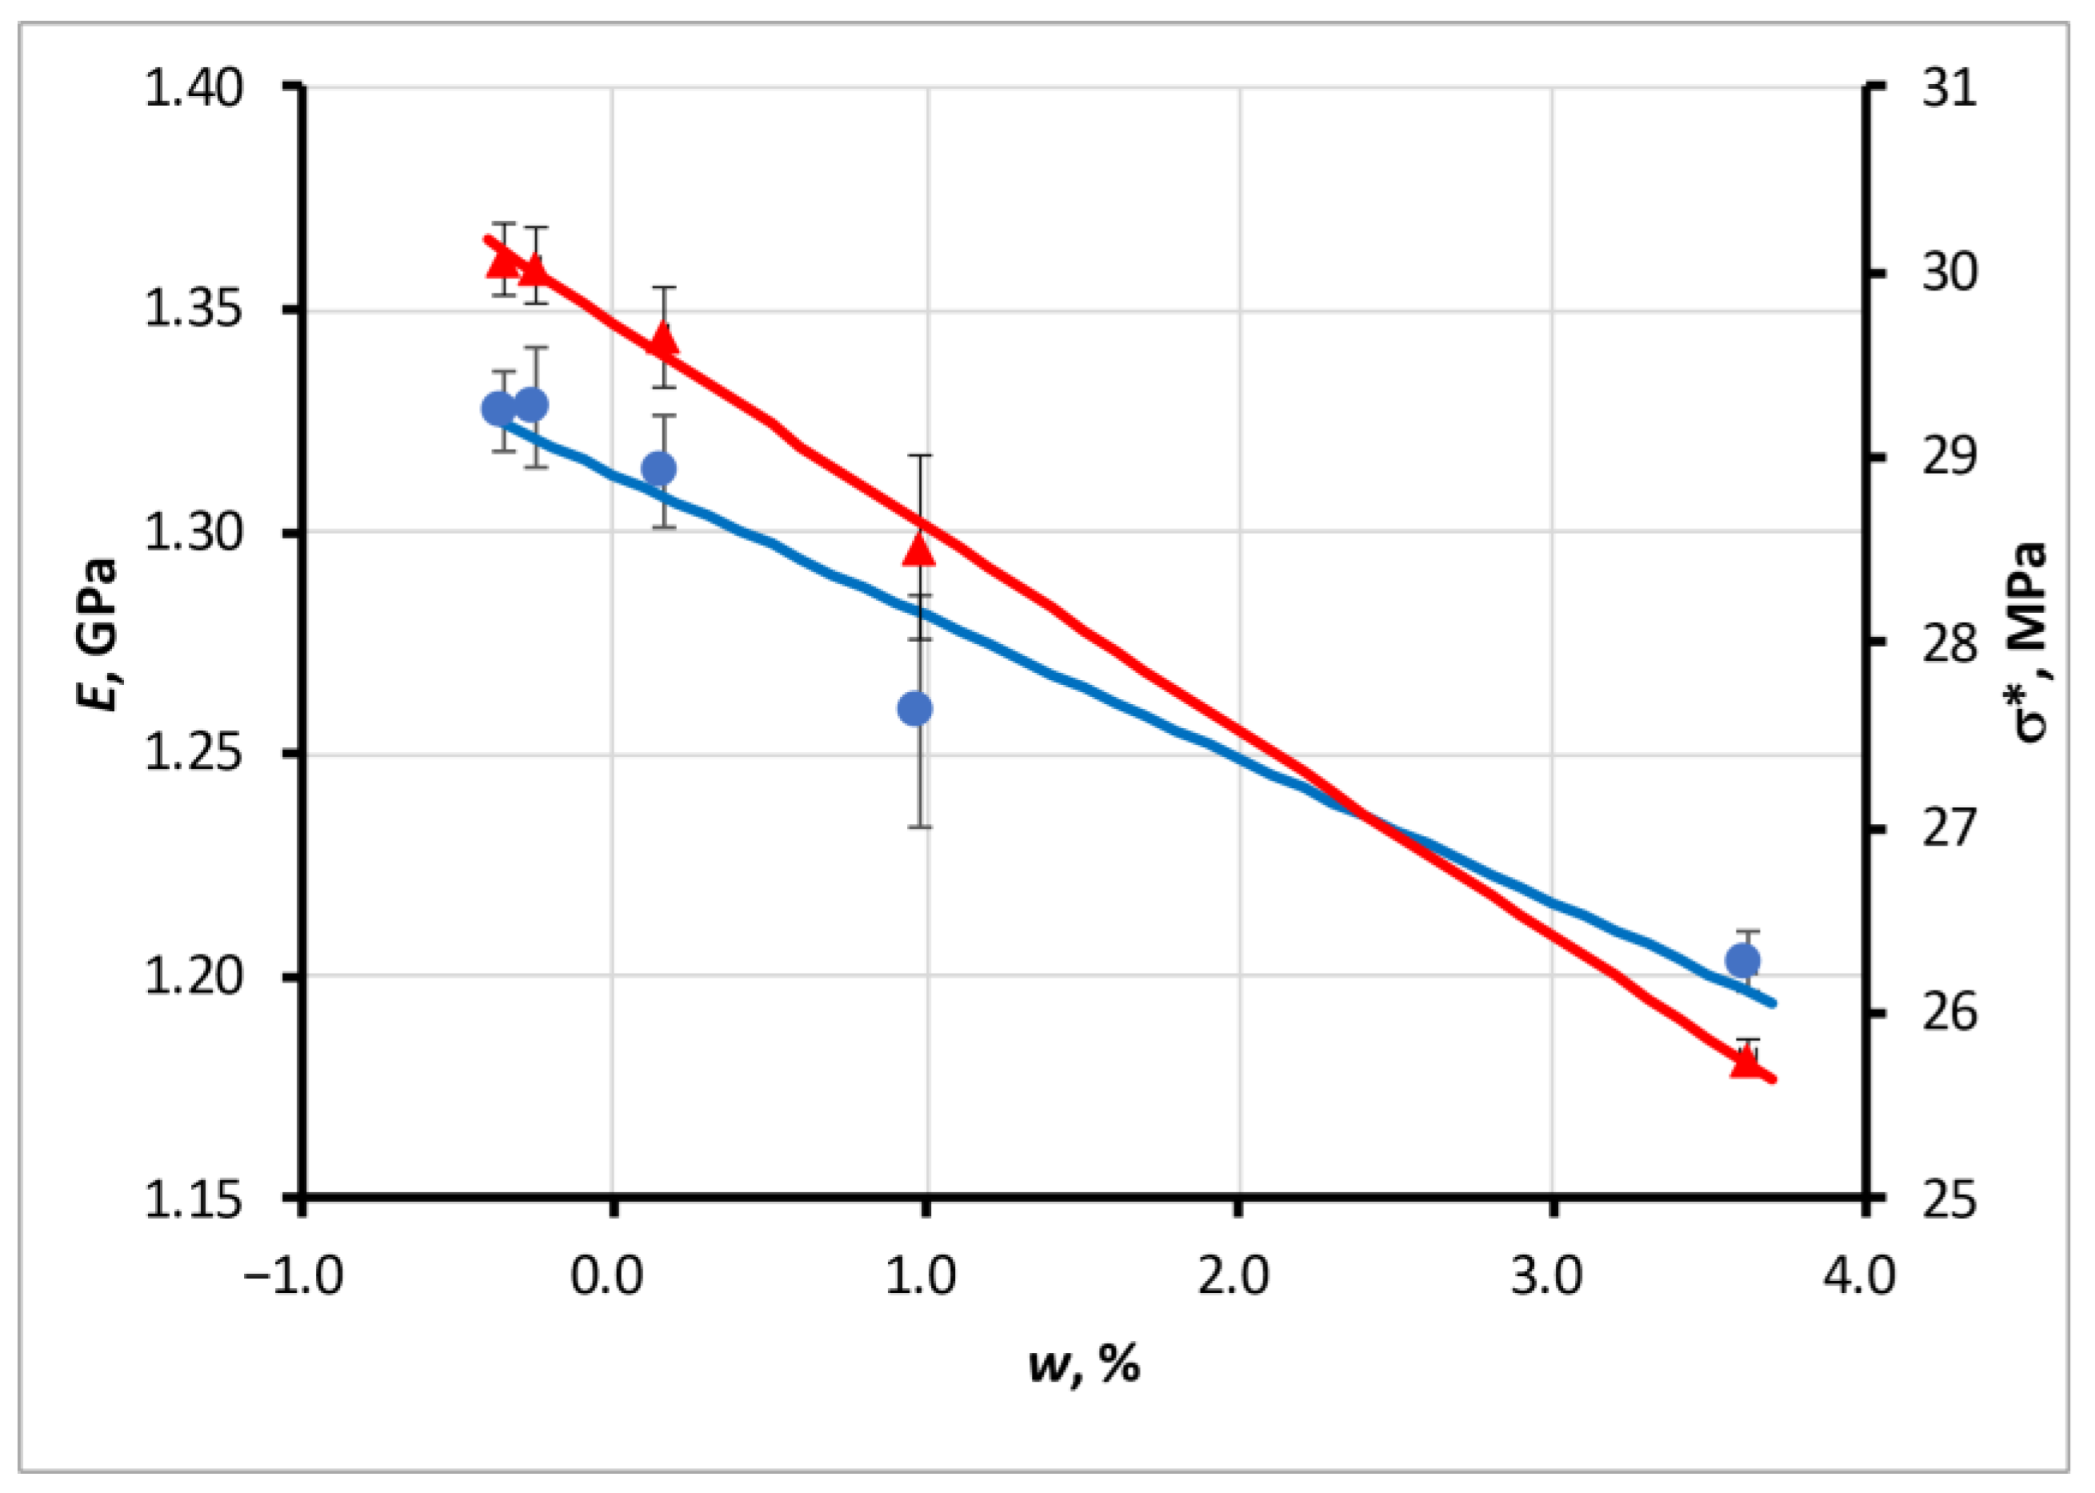
The initial segments of tension diagrams for representative samples with different moisture contents are presented in Figure 12. Significant changes in the slope of the diagrams proportional to the elastic modulus and tensile strength with moisture content indicate a strong dependence of the material properties on the moisture content.
Examples of changes in the elastic modulus E and strength σ* with moisture content for the ABS ESD material are presented in Figure 13.
The changes in the properties of the materials were approximated using the linear functions
E = a E w + E 0 σ * = a σ w + σ 0
with the parameters given in Table 5. The values of E0 and σ0 are the parameters of approximations that correspond to the materials in the initial state as produced.
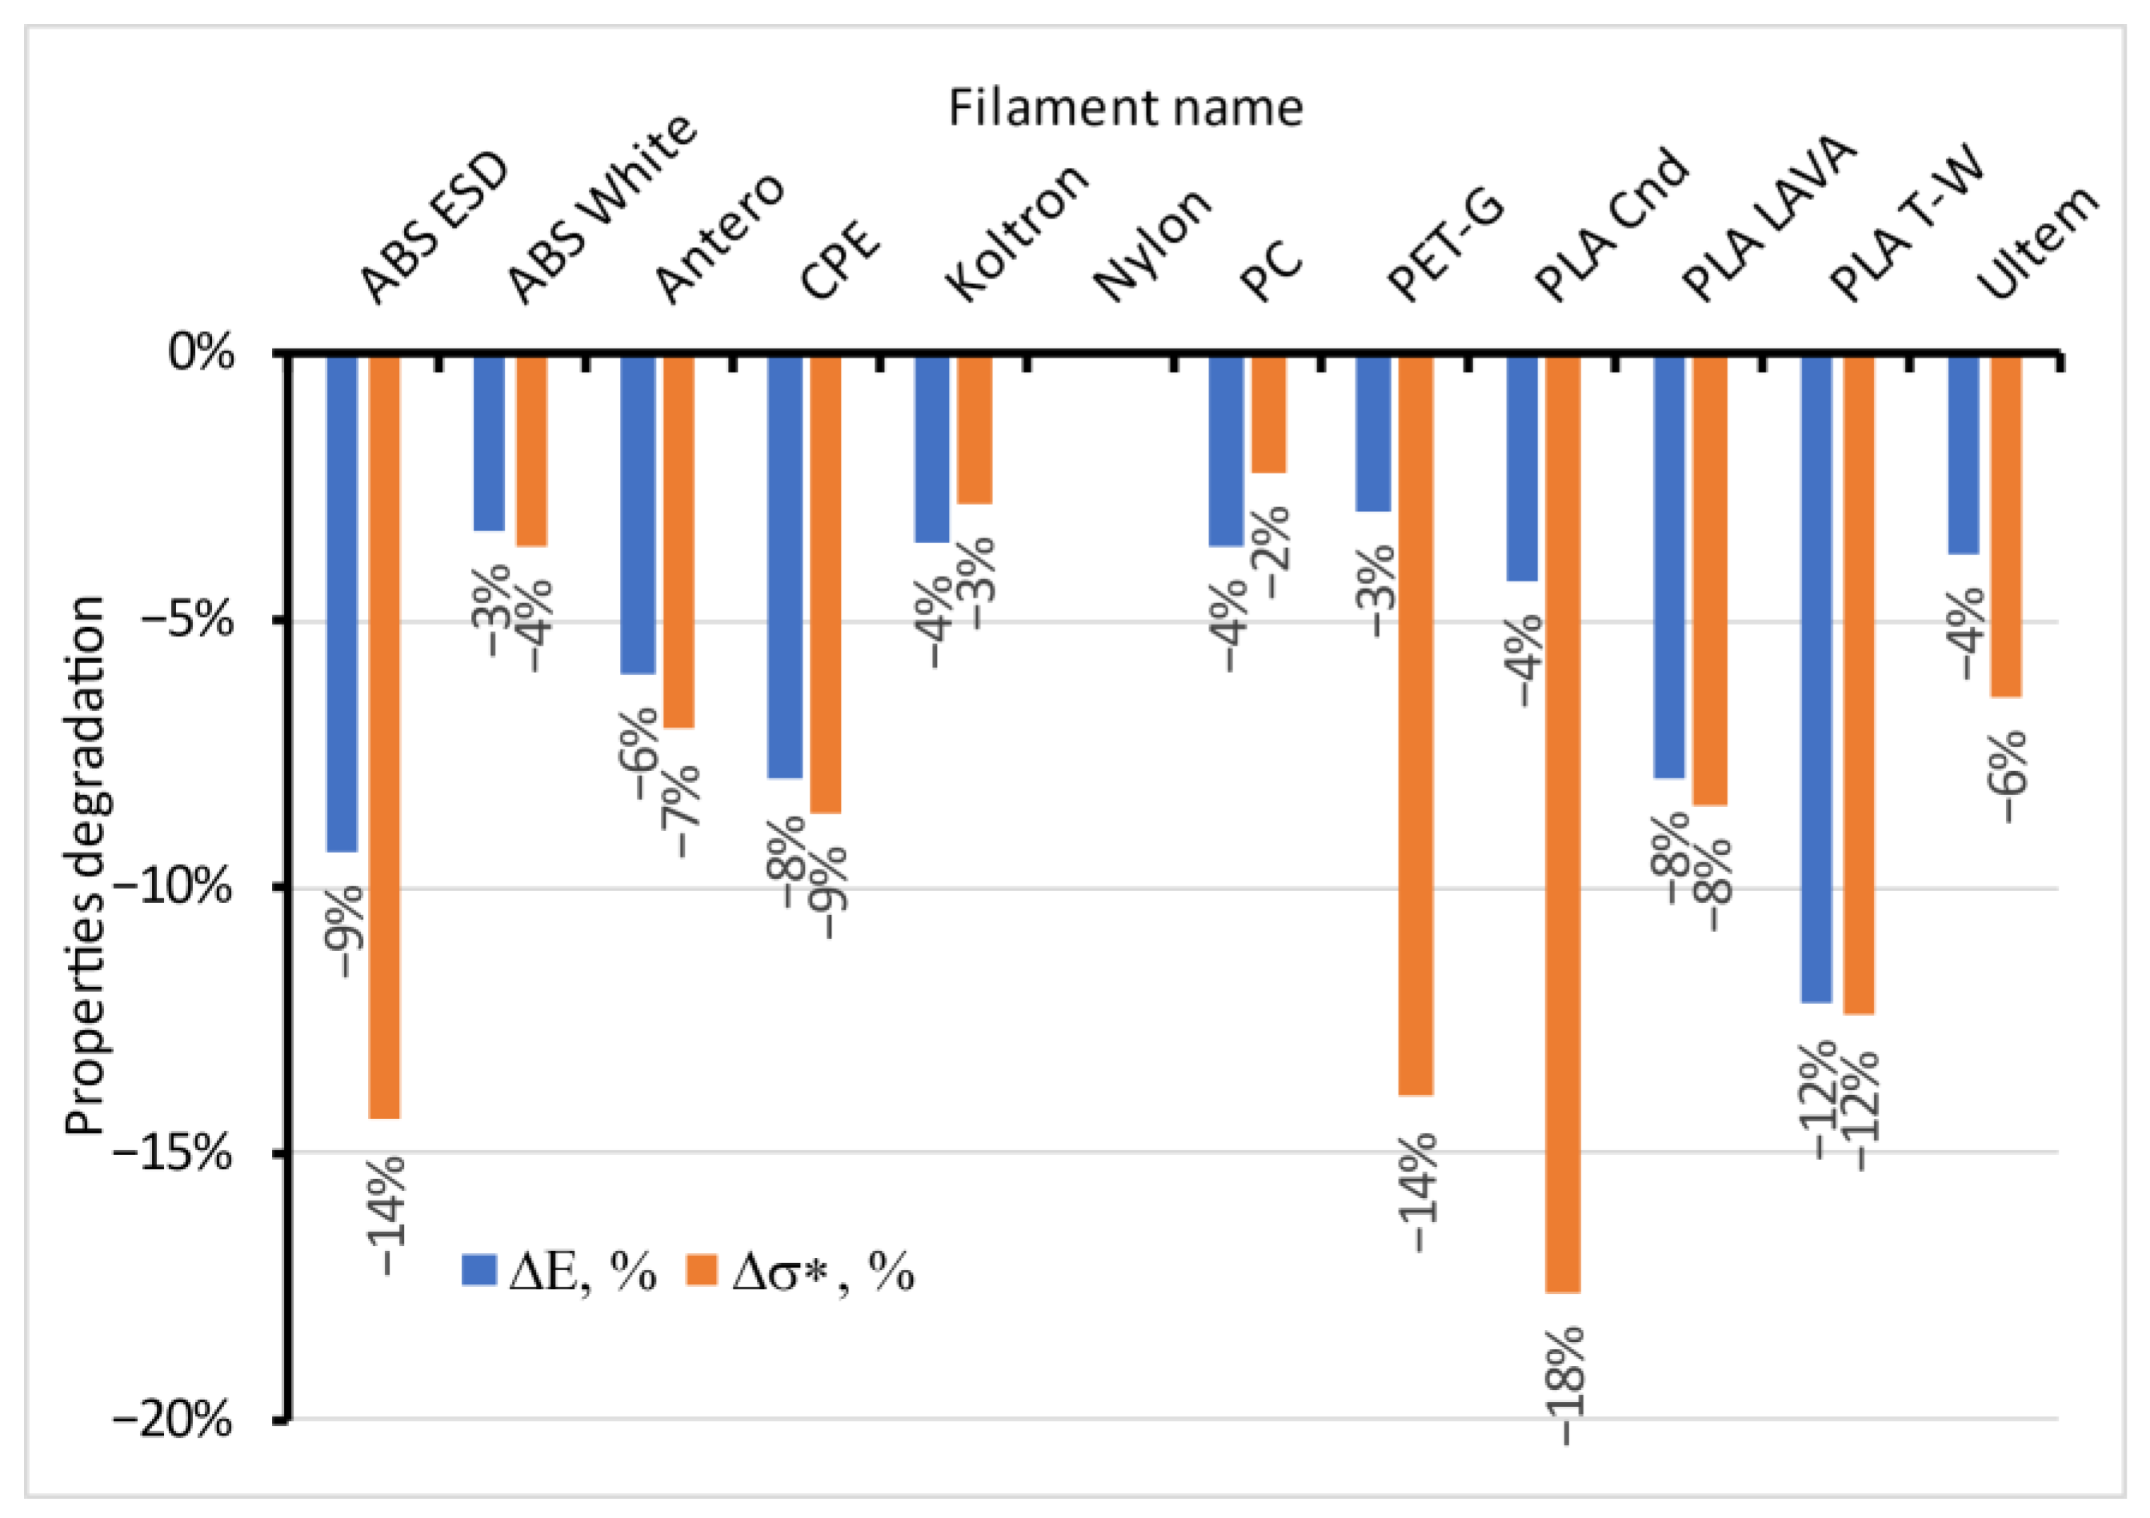
The maximal relative reduction in the properties of the moistened materials is presented in Figure 14. Elastic modulus and strength for ABS ESD are more moisture-sensitive than for pure ABS White. Filler particles likely provided the electrostatic discharge of this material, essentially changing its structure and affecting its sorption and mechanical properties. At the same time, conductive and colour-changing additives reinforced PLA Cnd and PLA LAVA. No evident dependence was revealed of the reduction in the properties of moistened materials on their crystallinity or hydrophilic/hydrophobic nature. The data for Nylon were excluded from the figure because the reduction in elastic modulus was 83% and in strength was 42% for this material, which confirms the degradation of the polymer’s structure with water absorption. Thus, significant values radically change the chart’s scale, and the reduction in properties for other materials is hardly distinguished.
Based on the presented data, all tested materials could be classified as having low (changes ca. 2–4% or less), moderate (5–9%), or high sensitivity to moisture (more than 10%) in terms of the reduction in mechanical properties. This reduction in the materials’ stiffness and strength with absorbed moisture from the atmosphere should be considered for responsible applications.

5. Conclusions

The experimental investigation and modelling of the water sorption process of 12 typical polymer filaments used for FFF were performed. The data necessary for predicting the effect of moisture on the mechanical properties of FFF structures were obtained.
  • The experimental investigation of the moisture sorption process of 12 typical filaments used for FFF was performed in humid atmospheres with an RH from 16 to 97% at room temperature. Materials with high moisture sorption capacity were revealed.
  • The solution of Fick’s second equation for the cylinder was obtained in series form. The convergence of the equation and possible simplified expressions were analysed.
  • Fick’s diffusion model was applied to all tested materials, and a set of sorption parameters were found. The obtained equilibrium moisture content of materials in the wide range of humid environments allowed their moisture sorption isotherms to be built. The isotherms were classified as linear according to Henry’s law for nine tested materials and nonlinear Type 3 (BET classification) for others. The moisture diffusivity in the tested materials dependent on the relative humidity of the atmosphere was evaluated. The diffusion coefficient was independent of the relative humidity of the atmosphere for six materials. It essentially decreased for four materials and grew for the other two.
  • The swelling of the filaments in a wet environment was investigated experimentally. Swelling strain changed linearly with the moisture content of the materials and reached up to 0.5% for some of them. The material that demonstrated the most swelling was Nylon, with a maximal swelling strain of up to 2.5%.
  • The possible degree of degradation of the mechanical properties of the filaments due to moisture absorption was estimated. Based on the presented data, all tested materials could be classified as having low (changes ca. 2–4% or less), moderate (5–9%), or high sensitivity to moisture (more than 10%) in terms of the reduction in mechanical properties. This reduction in the materials’ stiffness and strength with absorbed moisture from the atmosphere should be considered for responsible applications.
  • The molecular and sub-molecular structure of the polymers could affect the moisture sorption properties and could be changed during the absorption process, but further targeted research is necessary. Filler particles caused the increase in water sorption ability and degradation of the polymer in the ABS ESD case, while for PLA LAVA and PLA Cnd, it did not change or even strengthened the material.

Author Contributions

Conceptualisation, A.A.; methodology, A.A. and O.B.; validation, L.S., O.B. and A.A.; formal analysis, L.S. and A.A.; investigation, O.B.; data curation, L.S. and O.B.; writing—original draft preparation, L.S., O.B. and A.A.; writing—review and editing, O.B. and A.A.; visualisation, L.S.; supervision, A.A.; project administration, A.A.; funding acquisition, A.A. All authors have read and agreed to the published version of the manuscript.

Funding

This research was funded by the European Regional Development Fund, Project No. 1.1.1.1/19/A/031 “OPTITOOL, Decision Tool for Optimal Design of Smart Polymer Nanocomposite Structures Produced by 3D Printing”.

Institutional Review Board Statement

Not applicable.

Data Availability Statement

Data sharing not applicable.

Acknowledgments

Technician K. Pizova measured sorption and swelling on the “long cylinder” samples.

Conflicts of Interest

The authors declare no conflict of interest. The funders had no role in the design of the study; in the collection, analyses, or interpretation of data; in the writing of the manuscript; or in the decision to publish the results.

Abbreviations

Dis the diffusion coefficient.
r, zare radial and axial cylindrical coordinates.
tis time.
Ris the radius of a cylindrical specimen.
lis the specimen length.
U (r, z, t)is the moisture concentration at a sample point with cylindrical coordinates r, z at time t.
Q0is the initial moisture content in the specimen.
Qis the equilibrium moisture content in the specimen.
φ (r, z) is the initial moisture concentration in the specimen.
U0is the border moisture concentration.
is the Laplace operator.
r, zis the Laplace operator in a cylindrical coordinate system without an angular component.
α, λ, μare the eigenvalues of operators.
J0is a zero-order Bessel function.
γkis the k-root of the zero Bessel function.
A, B, and Care constants.
U ¯ t is the average moisture concentration in a specimen at time t.
Q (t)is the mass of moisture in a specimen at time t.
F0is the Fourier criterion.
Wtis the relative moisture content in the specimen at time t.
Ptis the sample weight at time t.
P0is the initial sample weight.
σ*is the material strength.
Eis the elastic modulus.

Appendix A

Appendix A.1. Formulation of the Problem

The solution to the diffusion problem for an infinite-length cylinder is given in classical books [24,25]. Many authors often use this solution to model the moisture sorption process in long fibres [26,27]. For the case of a finite-length cylinder, we have
U t = D 2 U r 2 + 1 r U r + 2 U z 2
with the initial condition
U t = 0 = φ r , z
The homogeneous border condition is as follows:
U z = 0 , l = 0
U r = R = 0
r , z , t U

Appendix A.2. Solution by the Method of the Separation of Variables

Let us find a solution to Equations (A1)–(A5) using the method of the separation of variables. A general solution is a product of three functions of three variables
U r , z , t = U r Z z T t
and the respective differential equations and their solutions are
T D T = U + 1 r U U + Z Z = λ 2
T + λ 2 D T = 0 T t = C e λ D t
Z + α 2 Z = 0 Z 0 = Z l = 0
Z = A sin α z + B cos α z
Substituting (A9) in (A8), it follows that B = 0 ;
Z m = A m sin π m z l ; α m = π m l
Equation (A10) is a solution of Equations (A1)–(A5) in the Z coordinate.
For the radial component U r , we have the equation
U + 1 r U + U λ 2 α 2 = 0
By entering the notation
μ 2 = λ 2 α 2
the previous equation could be rewritten as
U r + 1 r U r + U r μ 2 = 0
Bessel’s equation has the form
t 2 U + t U + t 2 ν 2 U = 0
and its solution is an expression
U = C 1 J ν t + C 2 Y ν ( t )
where J ν t is Bessel’s function, and Y ν t is von Neumann’s function. It is evident that when ν = 0 and replacing t = λ x , Equation (A13) is equivalent to Equation (A12). Using the properties of von Neumann’s function and taking into account (A5), one can obtain
U = J 0 μ r
which is a solution to Equation (A12).
It is seen from (A4) that J 0 μ k R = 0 and μ k R = γ k , where γ k represents the roots of the zero Bessel function.
Then,
μ k = γ k R
From (A11), it follows that
λ k , m 2 = μ k 2 + α m 2
and
λ k , m 2 = γ k R 2 + π m l 2
Taking into account (A6), (A7), (A10), and (A14)–(A16), the eigenfunction could be expressed as
U k , m = e λ k , m 2 D t sin α m z J 0 μ k r
where α m = π m l ; μ k = γ k R ; λ k , m 2 = γ k R 2 + π m l 2 .
The general solution for the concentration is a summation of the product of three functions
U r , z , t = k = 1 m = 1 C k , m e λ k , m 2 D t sin α m z J 0 μ k r
To find the constants C k , m , let us use the initial condition (A2).
U r , z , 0 = k = 1 m = 1 C k , m sin α m z J 0 μ k r = φ r , z
Let us replace r = Rxx = r/R; then,
U R x , z , 0 = k = 1 m = 1 C k , m sin α m z J 0 γ k x = φ R x , z
The orthogonality property of the Bessel functions could be used as follows:
0 1 J m μ i x J m μ k x x d x = 0 ; i k 1 2 J m μ i 2 = 1 2 J m + 1 μ i 2 ; i = k
Constants C k , m could be expressed as
C k , m = 0 l sin α m z 0 1 φ R x , z J 0 γ k x x d x d z 0 l sin 2 α m z d z 0 1 x J 0 2 γ k x d x
where
0 l sin α m z d z = 1 α m cos α m z 0 l = 1 cos α m l α m
0 l sin 2 α m z d z = 1 α m 0 l sin 2 α m z d α m z = l 2 sin 2 α m l 4 α m
and
0 1 x J 0 2 γ k x d x = 1 2 J 1 γ k 2
Taking into account (A19) and (A20), the constants are
C k , m = 8 α m 0 l sin α m z 0 1 φ R x , z J 0 γ k x x d x d z 2 α m l sin 2 α m l J 1 2 γ k .
Then, the general solution (A17) could be rewritten as
U x R , z , t = k = 1 m = 1 8 α m 0 l sin α m z 0 1 φ R x , z J 0 γ k x x d x d z 2 α m l sin 2 α m l J 1 2 γ k e λ k , m 2 D t sin α m z J 0 μ k r
or remind x = r R
U r , z , t = k = 1 m = 1 8 α m 0 l sin α m z 0 R φ r , z J 0 μ k r r R d r R d z 2 α m l sin 2 α m l J 1 2 μ k R e λ k , m 2 D t sin α m z J 0 μ k r .
Simplify
U r , z , t = k = 1 m = 1 8 α m sin α m z e λ k , m 2 D t J 0 μ k r R 2 2 α m l sin 2 α m l J 1 2 μ k R 0 l sin α m z 0 R φ r , z J 0 μ k r r d r d z
Let us suppose that the initial moisture distribution in the cylinder is uniform φ r , z = φ 0 = c o n s t . Instead of (A21), we can write
U r , z , t = k = 1 m = 1 8 α m sin α m z e λ k , m 2 D t J 0 μ k r φ 0 R 2 2 α m l sin 2 α m l J 1 2 μ k R 0 l sin α m z d z 0 R J 0 μ k r r d r
Let us use variables μ k R = z 0 and μ k r = z . Then,
0 R r J 0 μ k r d r = 1 μ k 2 0 R μ k r μ k J 0 μ k r d μ k r = 1 μ k 2 0 z 0 z J 0 z d z = z μ k 2 J 1 z 0 z 0 = z 0 μ k 2 J 1 z 0 = R μ k J 1 μ k R
as J 1 x = 1 2 x 1 2 x 3 1 2 2 + 1 2 x 5 1 2 2 2 3 and J 1 0 = 0 , taking into account (A18), we obtain
U r , z , t = k = 1 m = 1 8 α m sin α m z e λ k , m 2 D t J 0 μ k r φ 0 R J 1 μ K R 1 cos α m l R 2 2 α m l sin 2 α m l J 1 2 μ k R μ k α m = k = 1 m = 1 8 φ 0 1 cos α m l sin α m z e λ k , m 2 D t J 0 μ k r μ k R 2 α m l sin 2 α m l J 1 μ k R U r , z , t = k = 1 m = 1 8 φ 0 1 cos α m l sin α m z J 0 μ k r μ k R 2 α m l sin 2 α m l J 1 μ k R e λ k , m 2 D t .
Let us designate U ¯ t as the average moisture concentration and Q (t) as the amount (mass) of moisture in a specimen at time t. Then,
U ¯ t = 2 π π R 2 l 0 R 0 l U r , z , t r d r d z
Q = 2 π 0 R 0 l U r , z , t r d r d z
Q = k = 1 m = 1 8 φ 0 1 cos α m l e λ k , m 2 D t 2 π μ k R 2 α m l sin 2 α m l J 1 μ k R 0 R r J 0 μ k r d r 0 l sin α m z d z = k = 1 m = 1 8 φ 0 1 cos α m l e λ k , m 2 D t 2 π R μ k J 1 μ k R 1 cos α m l α m μ k R 2 α m l sin 2 α m l J 1 μ k R ; Q = k = 1 m = 1 16 φ 0 π 1 cos α m l 2 μ k 2 α m 2 α m l sin 2 α m l e λ k , m 2 D t ,
where
α m = π m l ;   μ k = γ k R ;   λ k , m 2 = γ k R 2 + π m l 2 ;   J 0 γ k = 0

Appendix A.3. Solution in the Case of Inhomogeneous Boundary Conditions

Let us consider a case of inhomogeneous boundary conditions
U t = 0 = φ r , z ;   U r = R ; z = 0 , l = U 0 ;   r , z , t U < .
Let us introduce a variable U * r , z , t = U r , z , t U 0 .
Equation (A1) takes the form
U * t = D 2 U * r 2 + 1 r U * r + 2 U * z 2
Condition (A26) could be rewritten as
U * r , z , 0 = φ r , z U 0 = φ * r , z ;   U * r = R ; z = 0 , l = 0 .
It is evident that Equation (A27) with condition (A28) has the solution
U * r , z , t = k = 1 m = 1 8 α m sin α m z e λ k , m 2 D t J 0 μ k r R 2 2 α m l sin 2 α m l J 1 2 μ k R 0 l sin α m z 0 R φ * J 0 μ k r r d r d z = k = 1 m = 1 8 α m sin α m z e λ k , m 2 D t J 0 μ k r R 2 2 α m l sin 2 α m l J 1 μ k R 0 l sin α m z 0 R φ r , z J 0 μ k r r d r d z k = 1 m = 1 8 α m sin α m z e λ k , m 2 D t J 0 μ k r U 0 R 2 2 α m l sin 2 α m l J 1 2 μ k R 0 l sin α m z d z 0 R J 0 μ k r r d r .
Then,
U r , z , t = U 0 1 k = 1 m = 1 8 sin α m z e λ k , m 2 D t J 0 μ k r 1 cos α m l μ k R 2 α m l sin 2 α m l J 1 μ k R + k = 1 m = 1 8 α m sin α m z e λ k , m 2 D t J 0 μ k r R 2 2 α m l sin 2 α m l J 1 2 μ k R 0 l sin α m z 0 R φ J 0 μ k r r d r d z
In the case of φ r , z = φ 0 = c o n s t , Equation (A29) could be rewritten as
U r , z , t = U 0 1 k = 1 m = 1 8 sin α m z e λ k , m 2 D t J 0 μ k r 1 cos α m l μ k R 2 α m l sin 2 α m l J 1 μ k R + φ 0 k = 1 m = 1 8 sin α m z e λ k , m 2 D t J 0 μ k r 1 cos α m l μ k R 2 α m l sin 2 α m l J 1 μ k R .

Appendix A.4. Calculation of Relative Concentration

Let us consider the diffusion equation in the one-dimensional case in Cartesian coordinates U t = D 2 U x 2 . Let us also substitute U t with δ U t t and 2 U x 2 with δ U l l 2 , where subscripts t and l represent the concentration changes with time and coordinates. Then, the equation could be rewritten as δ U t δ U l = D t l 2 . If the concentration distributions are similar, the similarity is preserved under the condition D t l 2 = c o n s t . Expression D t l 2 is a dimensionless generalised variable, often called the Fourier criterion (or Fourier number) (A26), denoted as Fo . This criterion means generalised time and can also be called the homochronity number or homochronism criterion.
Let us consider a relative variable
U r , z , t U 0 φ 0 U 0 = k = 1 m = 1 8 sin α m z e λ k , m 2 D t J 0 μ k r 1 cos α m l μ k R 2 α m l sin 2 α m l J 1 μ k R .
The normalised or relative radius can be written as
ρ = r R
and generalised Fourier variable
Fo = D t R 2
μ k R = γ k
μ k r = γ k ρ
Substituting (A32)–(A35) in (A31), we can obtain
U r , z , t U 0 φ 0 U 0 = k = 1 m = 1 8 sin α m z 1 cos α m l e λ k , m 2 Fo R 2 J 0 γ k ρ γ k 2 α m l sin 2 α m l J 1 γ k
We can rearrange
U r , z , t U 0 φ 0 U 0 = U 0 U r , z , t U 0 φ 0 = U 0 φ 0 + φ 0 U r , z , t U 0 φ 0 = 1 + φ 0 U r , z , t U 0 φ 0 = 1 U r , z , t φ 0 U 0 φ 0
and instead of (A36) can obtain
U r , z , t φ 0 U 0 φ 0 = 1 k = 1 m = 1 8 sin α m z 1 cos α m l e λ k , m 2 Fo R 2 J 0 γ k ρ γ k 2 α m l sin 2 α m l J 1 γ k
Let us remember that the average concentration in the cylinder is expressed by (A23). Taking into account (A18) and (A37), we can obtain
U ¯ t φ 0 U 0 φ 0 = 1 k = 1 m = 1 16 1 cos α m l 2 e λ k , m 2 Fo R 2 γ k 2 α m l 2 α m l sin 2 α m l
and, finally,
U ¯ t U 0 φ 0 U 0 = k = 1 m = 1 16 1 cos α m l 2 γ k 2 α m l 2 α m l sin 2 α m l exp λ k , m 2 Fo R 2

Appendix A.5. Calculation of Diffusion Characteristics

If Q is the amount of water (mass) diffused into the entire specimen, then Q = π R 2 l U ¯ and
U ¯ = U 0 U 0 φ 0 k = 1 m = 1 16 1 cos α m l 2 γ k 2 α m l 2 α m l sin 2 α m l exp λ k , m 2 F 0 R 2
Q 0 = π R 2 l φ 0 ;   Q = π R 2 l U 0
Q = Q 16 Q Q 0 l k = 1 m = 1 exp λ k , m 2 R 2 Fo 1 cos α m l 2 γ k 2 α m 2 α m l sin 2 α m l
Let us take into account that sin 2 α m l = 0 and cos 2 α m l = 1 m . Then, finally, the total amount of water diffused into the entire cylinder with time is expressed as
Q = Q + 8 Q 0 Q π 2 k = 1 m = 1 exp λ k , m 2 R 2 Fo m 2 γ k 2 1 1 m 2
or
Q = Q + 8 Q 0 Q π 2 k = 1 m = 1 exp λ k , m 2 D t m 2 γ k 2 1 1 m 2 ,   λ k , m 2 = γ k R 2 + π m l 2 .
The roots, γk, of the zero Bessel function, J0, should be known in order to calculate the total amount of water diffused into the entire cylinder. Five values of the roots are commonly used and can be found in many sources, e.g., [30]:
γ 1 = 2.4048 γ 2 = 5.5201 γ 3 = 8.6537 γ 4 = 11.7915 γ 5 = 14.9309 .
More root values may be used to converge the sum (A41) for the initial stage of the sorption process. Fifteen values are given in Table A1, taken from [31].
Table A1. Zeros, γk, of Bessel functions, J0 [31] (in columns).
kγkkγkkγk
12.40483618.071061133.77582
25.52008721.211641236.91710
38.65373824.352471340.05843
411.79153927.493481443.19979
514.930921030.634611546.34119
More values needed to calculate the moisture sorption by a thin cylinder, such as a filament or fibre with high diffusivity, are given in Table A2 and can be found in [32] or [33].
Table A2. Zeros of Bessel functions [32] (in rows).
2.404825565.520078118.6537279111.7915344414.93091771
18.0710639721.2116366324.3524715327.4934791330.63460647
33.7758202136.9170983540.0584257643.1997917146.34118837
49.482609952.6240518455.7655107658.9069839362.04846919
65.189964868.3314693371.472981674.6145006477.75602563
80.8975558784.0390907887.1806298490.3221726493.46371878
Discussion of the accuracy of the presented root values and the convergence of sum (A41) is outside of the scope of the given research topic.

References

  1. Prashar, G.; Vasudev, H.; Bhuddhi, D. Additive manufacturing: Expanding 3D printing horizon in industry 4.0. Int. J. Interact. Des. Manuf. (IJIDeM) 2022, 1–15. [Google Scholar] [CrossRef]
  2. Singh, S.; Singh, G.; Prakash, C.; Ramakrishna, S. Current status and future directions of fused filament fabrication. J. Manuf. Process. 2020, 55, 288–306. [Google Scholar] [CrossRef]
  3. Kumar, S.; Singh, R.; Singh, T.P.; Batish, A. Fused filament fabrication: A comprehensive review. J. Thermoplast. Compos. Mater. 2020, 36, 794–814. [Google Scholar] [CrossRef]
  4. Dey, A.; Roan Eagle, I.N.; Yodo, N. A Review on Filament Materials for Fused Filament Fabrication. J. Manuf. Mater. Process. 2021, 5, 69. [Google Scholar] [CrossRef]
  5. Bulderberga, O.; Aniskevich, A. Printing characteristics, properties, and applications of the most used basic and professional filaments. Zenodo 2021. [Google Scholar] [CrossRef]
  6. Valerga, A.P.; Batista, M.; Salguero, J.; Girot, F. Influence of PLA Filament Conditions on Characteristics of FDM Parts. Materials 2018, 11, 1322. [Google Scholar] [CrossRef] [PubMed] [Green Version]
  7. Aniskevich, A.; Zīle, E.; Bulderberga, O.; Zeleniakiene, D. Mechanical characterisation of some polymers used in 3D printing. In Proceedings of the 20th European Conference on Composite Materials: Composites Meet Sustainability, Lausanne, Switzerland, 26–30 June 2022; pp. 1196–1203. [Google Scholar]
  8. Zīle, E.; Zeleniakiene, D.; Aniskevich, A. Characterization of Polylactic Acid Parts Produced Using the Fused Deposition Modelling. Mech. Compos. Mater. 2022, 58, 169–180. [Google Scholar] [CrossRef]
  9. Wang, Z.; Yin, X.; Wang, L. An experimental investigation on the tensile properties of PEEK-PEI sandwich structures prepared via fused filament fabrication. High Perform. Polym. 2022, 35, 276–294. [Google Scholar] [CrossRef]
  10. El Magri, A.; El Mabrouk, K.; Vaudreuil, S. Preparation and characterization of poly(ether ether ketone)/poly(ether imide) [PEEK/PEI] blends for fused filament fabrication. J. Mater. Sci. 2021, 56, 14348–14367. [Google Scholar] [CrossRef]
  11. Dua, R.; Rashad, Z.; Spears, J.; Dunn, G.; Maxwell, M. Applications of 3D-Printed PEEK via Fused Filament Fabrication: A Systematic Review. Polymers 2021, 13, 4046. [Google Scholar] [CrossRef]
  12. Aniskevich, A.N. Experimental study of sorption of moisture in ÉDT-10 epoxy binder. Mech. Compos. Mater. 1985, 20, 670–674. [Google Scholar] [CrossRef]
  13. Aniskevich, A.N. Moisture absorption and desorption by a unidirectional organoplastic under steady temperature-humidity conditions. Mech. Compos. Mater. 1986, 22, 383–388. [Google Scholar] [CrossRef]
  14. Chabaud, G.; Castro, M.; Denoual, C.; Le Duigou, A. Hygromechanical properties of 3D printed continuous carbon and glass fibre reinforced polyamide composite for outdoor structural applications. Addit. Manuf. 2019, 26, 94–105. [Google Scholar] [CrossRef]
  15. Zaldivar, R.J.; McLouth, T.D.; Ferrelli, G.L.; Patel, D.N.; Hopkins, A.R.; Witkin, D. Effect of initial filament moisture content on the microstructure and mechanical performance of ULTEM® 9085 3D printed parts. Addit. Manuf. 2018, 24, 457–466. [Google Scholar] [CrossRef]
  16. Aniskevich, A.N.; Yanson, Y.O. Study of moisture absorption by an organoplastic. Mech. Compos. Mater. 1991, 26, 455–462. [Google Scholar] [CrossRef]
  17. Kakanuru, P.; Pochiraju, K. Moisture Ingress and Degradation of Additively Manufactured PLA, ABS and PLA/SiC Composite Parts. Addit. Manuf. 2020, 36, 101529. [Google Scholar] [CrossRef]
  18. Haghighi-Yazdi, M.; Tang, J.K.Y.; Lee-Sullivan, P. Moisture uptake of a polycarbonate blend exposed to hygrothermal aging. Polym. Degrad. Stab. 2011, 96, 1858–1865. [Google Scholar] [CrossRef]
  19. Kim, E.; Shin, Y.-J.; Ahn, S.-H. The effects of moisture and temperature on the mechanical properties of additive manufacturing components: Fused deposition modeling. Rapid Prototyp. J. 2016, 22, 887–894. [Google Scholar] [CrossRef]
  20. Lay, M.; Thajudin, N.L.N.; Hamid, Z.A.A.; Rusli, A.; Abdullah, M.K.; Shuib, R.K. Comparison of physical and mechanical properties of PLA, ABS and nylon 6 fabricated using fused deposition modeling and injection molding. Compos. Part B Eng. 2019, 176, 107341. [Google Scholar] [CrossRef]
  21. Glaskova-Kuzmina, T.; Aniskevich, A.; Martone, A.; Giordano, M.; Zarrelli, M. Effect of moisture on elastic and viscoelastic properties of epoxy and epoxy-based carbon fibre reinforced plastic filled with multiwall carbon nanotubes. Compos. Part A Appl. Sci. Manuf. 2016, 90, 522–527. [Google Scholar] [CrossRef]
  22. Aiello, M.A.; Leone, M.; Aniskevich, A.N.; Starkova, O.A. Moisture Effects on Elastic and Viscoelastic Properties of CFRP Rebars and Vinylester Binder. J. Mater. Civ. Eng. 2006, 18, 686–691. [Google Scholar] [CrossRef]
  23. Glaskova-Kuzmina, T.; Aniskevich, A.; Papanicolaou, G.; Portan, D.; Zotti, A.; Borriello, A.; Zarrelli, M. Hydrothermal aging of an epoxy resin filled with carbon nanofillers. Polymers 2020, 12, 1153. [Google Scholar] [CrossRef] [PubMed]
  24. Crank, J. The Mathematics of Diffusion; Clarendon Press: Oxford, UK, 1975. [Google Scholar]
  25. Barrer, R.M. Diffusion in and through Solids; The University Press: Cambridge, UK; Macmillan: New York, NY, USA, 1941; p. 464. [Google Scholar]
  26. Gagani, A.; Krauklis, A.; Echtermeyer, A.T. Anisotropic fluid diffusion in carbon fiber reinforced composite rods: Experimental, analytical and numerical study. Mar. Struct. 2018, 59, 47–59. [Google Scholar] [CrossRef]
  27. Gagani, A.I.; Krauklis, A.E.; Echtermeyer, A.T. Orthotropic fluid diffusion in composite marine structures. Experimental procedure, analytical and numerical modelling of plates, rods and pipes. Compos. Part A Appl. Sci. Manuf. 2018, 115, 196–205. [Google Scholar] [CrossRef]
  28. Bute, I.; Tarasovs, S.; Vidinejevs, S.; Vevere, L.; Sevcenko, J.; Aniskevich, A. Thermal properties of 3D printed products from the most common polymers. Int. J. Adv. Manuf. Technol. 2023, 124, 2739–2753. [Google Scholar] [CrossRef]
  29. Krauklis, A.E.; Karl, C.W.; Rocha, I.B.C.M.; Burlakovs, J.; Ozola-Davidane, R.; Gagani, A.I.; Starkova, O. Modelling of Environmental Ageing of Polymers and Polymer Composites&mdash;Modular and Multiscale Methods. Polymers 2022, 14, 216. [Google Scholar]
  30. Weisstein, E.W. Bessel Function Zeros. Available online: https://mathworld.wolfram.com/BesselFunctionZeros.html (accessed on 20 November 2021).
  31. Mokry, M. Theory of subsonic wall interference in a cylindrical-boundary wind tunnel revisited. In Proceedings of the 39th Aerospace Sciences Meeting and Exhibit, Reno, NV, USA, 8–11 January 2001. [Google Scholar] [CrossRef]
  32. user402217. Zeros of Bessel Functions. 2017. Available online: https://math.stackexchange.com/q/2233539 (accessed on 19 December 2021).
  33. Harrison, J. Fast and Accurate Bessel Function Computation. In Proceedings of the 19th IEEE Symposium on Computer Arithmetic, Portland, OR, USA, 8–10 June 2009; pp. 104–113. [Google Scholar]
Figure 1. Modelled sorption with the different numbers of summands k and m.
Polymers 15 02600 g001
Figure 2. Modelled sorption using VBA add-in with different length-to-radius ratios, l/R.
Polymers 15 02600 g002
Figure 3. Categories of tested materials and their functionality.
Polymers 15 02600 g003
Figure 4. Average water sorption of Antero filament. Error bars are small and hardly visible.
Polymers 15 02600 g004
Figure 5. Maximal moisture sorption capacity of the tested materials, Δw, in 24 h.
Polymers 15 02600 g005
Figure 6. Sorption isotherm of Ultem (linear, Henry’s law, blue line, circles ) and ABS White (BET, Type 3, red line, triangles ). Shifted approximations are for the materials if they should be initially dry (dashed lines). Error bars are small and hardly visible.
Polymers 15 02600 g006
Figure 7. Diffusion coefficient of ABS White material depending on equilibrium moisture content, w. Error bars are small and hardly visible.
Polymers 15 02600 g007
Figure 8. Average swelling of Antero material.
Polymers 15 02600 g008
Figure 9. Equilibrium swelling of Antero.
Polymers 15 02600 g009
Figure 10. Maximal swelling ability (strain) of tested materials.
Polymers 15 02600 g010
Figure 11. Tension diagrams for four ABS ESD samples moistened in an atmosphere with RH = 16%.
Polymers 15 02600 g011
Figure 12. Initial segments of tension diagrams for representative samples of ABS ESD with different moisture contents.
Polymers 15 02600 g012
Figure 13. Example of changes in the elastic modulus E (blue line, circles ) and strength σ* (red line, triangles ) with moisture content for the ABS ESD material.
Polymers 15 02600 g013
Figure 14. The maximal relative reduction in the elastic modulus and strength of the moistened materials.
Polymers 15 02600 g014
Table 1. Filament types and notations used in this research (in alphabetic order).
NotationPolymerIndustrial NameSupplierDensity, kg/m3 [28]
ABS Black *Acrylonitrile butadiene styreneUltimaker ABS (black)Ultimaker, Utrecht, Netherlands1124 ± 1
ABS ESD *Acrylonitrile butadiene styreneABS-ESDKIMYA, Nantes, France1060 ± 2
ABS WhiteAcrylonitrile butadiene styreneUltimaker ABS (white)Ultimaker, Utrecht, Netherlands1124 ± 1
AnteroPolyetherketoneketoneAntero 800NAStratasys, MN, USA1199 ± 3
CPEChlorinated polyethyleneUltimaker CPE (white)Ultimaker, Utrecht, Netherlands1273 ± 2
Koltron *Polyvinylidene fluorideKoltron G1Add:North, Fagersta, Sweden1750 ± 8
NylonPolyamide 6/66Ultimaker Nylon Ultimaker, Utrecht, Netherlands1103 ± 6
PCPolycarbonateUltimaker PC (white)Ultimaker, Utrecht, Netherlands1191 ± 1
PET-GPolyethylene terephthalate glycolPET g (white)Devil Design, Mikołów, Poland1276 ± 3
PLA CndPolylactic acidConductive PLAProtoplant, WA, USA1212 ± 2
PLA LAVAPolylactic acidTri Color Change-LavaHELLO3D, Shenzhen, China1246 ± 1
PLA T-W *Polylactic acidUltimaker Tough PLA (white)Ultimaker, Utrecht, Netherlands1227 ± 2
UltemPolyetherimideULTEM™ 9085 Resin CGStratasys, MN, USA1173 ± 1
* “Short” cylinder samples.
Table 2. Coefficients of the approximation (7) for all tested materials.
Filament NotationIsotherm TypeSorption Isotherm CoefficientsAim FunctionΔw
abc
ABS ESDBET theory, type 34.145−0.3043.50.1153.865
ABS WhiteBET theory, type 30.572−0.0821.760.0120.157
AnteroHenry’s law1−0.40810.0210.925
CPEHenry’s law0.698−0.21210.0010.519
KoltronBET theory, type 30.126−0.0171.70.0050.125
NylonBET theory, type 38.689−0.50320.238.127
PC WhiteHenry’s law0.582−0.24210.0330.55
PET-GHenry’s law0.632−0.20110.0430.696
PLA CndHenry’s law0.898−0.46910.0190.8
PLA LAVAHenry’s law0.817−0.2110.0180.724
PLA T-WHenry’s law0.795−0.37810.420.706
UltemHenry’s law0.944−0.52210.0210.844
Table 3. Diffusivity and time to reach 80% moisture content of the materials.
Filament NotationD, mm2/haD, (%)−1w0, %βD0, mm2/hAim Function or Average Deviation ValuesTime to Reach w80, h
ABS ESD −0.99121.00000.0053−0.44360.0013178
ABS White −0.0660.0680.077−0.1430.0007101
Antero0.00245 0.00011181
CPE0.00247 0.00003165
Koltron −0.00480.00330.3044−0.01700.0001550
Nylon0.001 0.00060360
PC0.00472 0.0003892
PET-G 0.003350.001281.00000−0.201040.00011125
PLA Cnd −0.00490.00691.0000−0.46950.0002164
PLA LAVA 0.007820.005061.00000−0.209660.0005946
PLA T-W0.0151 0.0005227
Ultem0.00399 0.0001389
Table 4. Parameters of equilibrium swelling strain dependence on moisture content.
Filament Notationaw, (%)−1ε0, %Aim Function
ABS ESD0.1080.0030.067
ABS White0.3430.0210.016
Antero0.154−0.0030.017
CPE0.365−0.0410.017
Koltron1.787−0.0210.051
Nylon−0.2950.1660.477
PC0.308−0.0220.021
PET-G0.2950.0010.029
PLA LAVA0.285−0.0110.034
Ultem0.4020.0330.05
Table 5. Mechanical properties of moistened filaments.
Filament NotationE, GPaσ*, MPa
aEE0aσσ0
ABS ESD−0.0321.313−1.10429.727
ABS White−0.1071.705-1.66539.589
Antero0.0102.774−6.58983.442
CPE−0.1231.774−8.54859.694
Koltron−0.0031.114−5.03125.015
Nylon−0.2852.377−11.155204.379
PC−0.0671.946−2.53763.190
PET-G−0.0851.967−11.24154.916
PLA Cnd−0.0731.962−6.38127.415
PLA LAVA−0.2412.716−5.32850.505
PLA T-W−0.3132.487−7.84045.815
Ultem−0.0282.309−6.14984.017
Disclaimer/Publisher’s Note: The statements, opinions and data contained in all publications are solely those of the individual author(s) and contributor(s) and not of MDPI and/or the editor(s). MDPI and/or the editor(s) disclaim responsibility for any injury to people or property resulting from any ideas, methods, instructions or products referred to in the content.