Article

Self-Monitoring Performance of 3D-Printed Poly-Ether-Ether-Ketone Carbon Nanotube Composites

1
Department of Enterprise Engineering Mario Lucertini, University of Rome Tor Vergata, and INSTM Research Unit Roma Tor Vergata, via del Politecnico 1, 00133 Rome, Italy
2
Department of Engineering, Pegaso Telematic University, 80143 Naples, Italy
3
Department of Engineering, University of Naples Partenope, 80133 Naples, Italy
*
Authors to whom correspondence should be addressed.
Polymers 2023, 15(1), 8; https://doi.org/10.3390/polym15010008
Submission received: 22 November 2022 / Revised: 10 December 2022 / Accepted: 13 December 2022 / Published: 20 December 2022

Abstract

:
In this paper, poly-ether-ether-ketone (PEEK) carbon-nanotube (CNT) self-monitoring composites at different levels of filler loading (i.e., 3, 5 and 10% by weight) have been extruded as 3D-printable filaments, showing gauge factor values of 14.5, 3.36 and 1.99, respectively. CNT composite filaments of 3 and 5 wt% were 3D-printed into tensile samples, while the PEEK 10CNT filament was found to be barely printable. The 3D-printed PEEK 3CNT and PEEK 5CNT composites presented piezo-resistive behavior, with an increase in electrical resistance under mechanical stress, and showed an average gauge factor of 4.46 and 2.03, respectively. Mechanical tests highlighted that 3D-printed samples have a laminate-like behavior, presenting ultimate tensile strength that is always higher than 60 MPa, hence they offer the possibility to detect damages in an orthogonal direction to the applied load wit high sensitivity.

1. Introduction

Self-monitoring is the intrinsic ability of a material or structure to detect occurring stress, deformation or damage without the use of external sensors [1,2,3]. Self-monitoring materials are one type of the so-called multifunctional materials, which are characterized by their ability to offer more than a single specific function by means of their specific composition and microstructure. Self-monitoring materials are very important in structural health monitoring (SHM), by which the mechanical integrity of structures or components is checked and assured continuously. A well-performed SHM can bring many beneficial effects in terms of user safety and maintenance costs (as programmed interventions can be scheduled), as well as allowing for the immediate acknowledgment and prevision of residual life when sudden and catastrophic events occur. Traditionally, SHM is achieved through the use of external sensors (strain gauge, fiber optics, accelerometers, etc. [4,5,6]) which, despite offering a high performance, represent an added cost, require cable wiring, are time-consuming during manufacturing, and increase the weight of the final components. The latter feature makes their use a non-environmentally sustainable solution in all applications where a low weight is essential to save fuel/battery charge and to lower CO2 emissions (i.e., aerospace, automotive or transport). SHM achieved by using by self-monitoring materials can therefore be an innovative sustainable solution.
In recent years, the advent of additive manufacturing (AM), also known as 3D printing, has drastically boosted the development of new products and technical systems. Freedom in mechanical design, followed by the possibility to manufacture complicated geometries, are the key features of this technique. Among the vast universe of polymer 3D printing, the AM of polymers with superior mechanical, physical and chemical properties, such as so-called high-performance polymers (polyether-ether-ketone PEEK, polyether-ketone-ketone PEKK, polyether-ketone-ether-ketone PEKEK, polyether-imide PEI, etc.), is becoming predominant in many engineering applications in the aerospace, automotive and biomedical sectors [7,8,9,10]. Fused filament fabrication (FFF) is, in most cases, the only 3D-printing technique suitable for the additive manufacturing of these materials, and the recent literature has made it clear that the mechanical properties, performance and failure mode of the printed parts are highly dependent on many process parameters (such as the layout, orientation, infill, parameters, etc.) [11,12]. Moreover, in some cases, despite working with ductile polymers, 3D-printed structures can undergo a more brittle-like, and thus unpredictable, fracture [13]. Therefore, it appears clear how SHM can become important, if not vital, when dealing with 3D-printed polymeric structures. On the other hand, the integration of sensors during the printing job is hard, if not impossible, particularly in the case of high-performing polymers, as they are generally processed at very high temperatures (i.e., >350 °C, which is not sustainable for most electronics and sensors) in closed chambers. The application of sensors after printing is definitely even less efficient. The 3D printing of self-monitoring PEEK is therefore a possible unique solution and appealing target.
Self-monitoring polymeric composite materials are most commonly based on piezo resistivity, i.e., the ability of a material to show a variation of electrical resistivity under strain or damage. For polymers, this property is achieved by manufacturing (nano)composites with specific compositions and microstructures so that a certain degree of electrical conductivity is reached. This is usually conducted through the addition of electrically conductive fillers to the insulating polymeric matrix to reach percolation. The electrical percolation threshold is the critical filler concentration at which the insulator–conductor transition occurs and the conductivity increases sharply by several orders of magnitude due to the formation of a three-dimensional network connected by a contact or tunnelling effect [14]. The percolation threshold value is determined by several parameters, such as the matrix-filler system [15,16,17], filler alignment and distribution [18], filler agglomeration and dispersion [19], as well as processing conditions [20]. Different nanoparticles have been used in the literature to produce electrical conductive 3D-printed thermoplastic-based composites, e.g., carbon black (CB) [21,22], graphene oxide [23], reduced graphene oxide [24], graphene [25,26], carbon fibers [27,28] and carbon nanotubes [29,30]. When a percolating system is deformed, a combination of the deformation of the filler and the modification of the conductive network occurs, and the electrical resistivity of the material changes, giving rise to piezo-resistive behavior [31].
Among different conductive fillers, carbon nanotubes (CNTs) are widely used due to their very high electrical conductivity and low percolation threshold associated with their aspect ratio (ratio of length to diameter) [32]. Particles with a high aspect ratio, indeed, have a higher surface area per unit volume and therefore percolate at a lower content [33]. In CNT-loaded polymer composites, percolation thresholds varying from 0.05 to 5 wt% have been reported in different thermoplastic matrices [34]. The mixing process is also a crucial factor in the determination of the resulting electrical properties. There are several processes to obtain a good dispersion of CNTs, including ultra-sonication with a polymeric dispersant and mechanical mixing (i.e., twin screw mixer, three-roll milling [35].
PEEK–CNT composites produced via various techniques have been reported to present a percolation threshold between 1 and 5 wt% and have been employed as high-performance EMI shielding and electrostatic discharge materials for advanced technological applications [25].
FFF printing of piezo-resistive composites has been sparingly investigated in the literature. The self-monitoring performances of commercial carbon black (CB)-filled acrylonitrile-butadiene-styrene (ABS) filaments were investigated in [36], and the influence of printing parameters has been assessed. ABS, with the addition of 1 to 10 wt% CNT, has been manufactured and 3D-printed, and the sensitivity to an applied deformation has been investigated in static, cyclic and creep testing [37,38]. Multi-material FFF printing to place the responsive material only where needed has been investigated on poly-lactic acid (PLA) and CB systems [39], with flexible polymeric matrices [40,41,42], and ABS–CNT composite testing [43]. A limited amount of research, however, is available on self-monitoring materials based on high-performance 3D-printed polymers, constituting a missed opportunity to employ innovative solutions to SHM in high-performance and weight-critical sectors, such as the aerospace or biomedical sectors. Nanocomposites based on thermoplastic polyurethane (TPU) [44] and thermoplastic polyimide (TPI) [45] have been investigated. Andrew et al. [46] proved that 3D-printed PEEK reinforced with 30 wt% carbon fibers has self-monitoring properties with a gauge factor ranging from 3.1 to 5.2.
In this paper, the preparation of piezo-resistive PEEK filaments and the FFF 3D printing of self-monitoring specimens are described for the first rime. Piezo-resistive PEEK filaments were manufactured by the addition of multiwalled carbon nanotubes (CNTs) to PEEK powder. The self-monitoring behavior of both filaments and 3D-printed parts were assessed, and the mutual influence of mechanical, morphological and thermal properties was investigated.

2. Materials and Methods

PEEK–CNT composites were prepared starting from PEEK powder (PEEK 90G, Victrex, Thornton Cleveleys, UK) and carbon nanotubes at different filler loading levels, i.e., 3, 5 and 10 wt%. Commercial multiwall carbon nanotubes were employed (NC7000, Nanocyl, Sambreville, Belgium) with an average diameter of 9.5 nm, length of 1.5 μm and a 250–300 m2/g surface area. After dry powder mixing, PEEK–CNT composites were extruded into filaments (1.75 mm diameter) using a single-screw extruder (Filabot series EX2, Filabot, Barre, VT, USA).
The filaments were 3D-printed using an APIUM P155 3D printer (Apium Additive Technologies GmbH, Karlsruhe, Germany) with the following parameters: nozzle temperature 460 °C; build platform temperature, 150 °C; printing speed, 160 mm/min; nozzle diameter, 0.6 mm, layer height, 0.20 mm; and infill percentage, 100%. The 3D models were constructed via SolidWorks (Dassault Systèmes, Vélizy-Villacoublay, France) CAD software, and the G-code was generated using Simplify3D slicing software (Simplify3D, Cincinnati, OH, USA). The composite filaments were 3D-printed into tensile test samples of standard type IV dog-bone geometry according to ASTM D638 [47] (gauge length: 25 mm; overall length: 115 mm; width at narrow section: 6 mm; thickness: 3 mm, see Figure 1c) with a 0° infill raster angle, i.e., all the extruded material parallel to the direction of the applied load during the tensile test.
Electrical percolation was evaluated by measuring the electrical resistivity of 200 mm long filament samples with a digital multimeter (DMM 2700, Keithley, Cleveland, OH, USA) interfaced via software to a PC. Electrical contacts made of copper wires were applied to the specimen ends using a conductive ink (Loctite EDAG 6017SS E&C, Henkel, Dusseldorf, Germany). Volume resistivity was calculated according to Equation (1)
ρ = R A L
where ρ is the volume resistivity in (Ω·cm), R is measured electrical resistance (Ω), A is the sample cross-section (cm2) and L is the distance between electrodes (cm).
The self-monitoring performances of both the filaments and the 3D-printed parts were assessed by measuring the electrical resistance (Keithley DMM 2700 digital multimeter) during the tensile test (Instron 5869, Instron, Norwood, OH, USA, equipped with a 50 kN load cell and tensile grips, crosshead deformation speed of 5%/min). Cyclic tests were performed on 3D-printed samples following a loading–unloading tensile cycling procedure, increasing the amplitude by 5 MPa for each cycle.
Electron scanning microscopy (SEM) micrographs of the gold-sputtered cross-sections of the tensile fractured filaments were acquired using FEG-SEM (Leo supra 35, Zeiss, Wetzlar, Germany). Optical microscopy observations on tensile fractured 3D-printed samples using a stereoscopic zoom microscope (Nikon SMZ-U, Minato, Japan) were performed too.

3. Results and Discussion

3.1. Electrical Resistivity

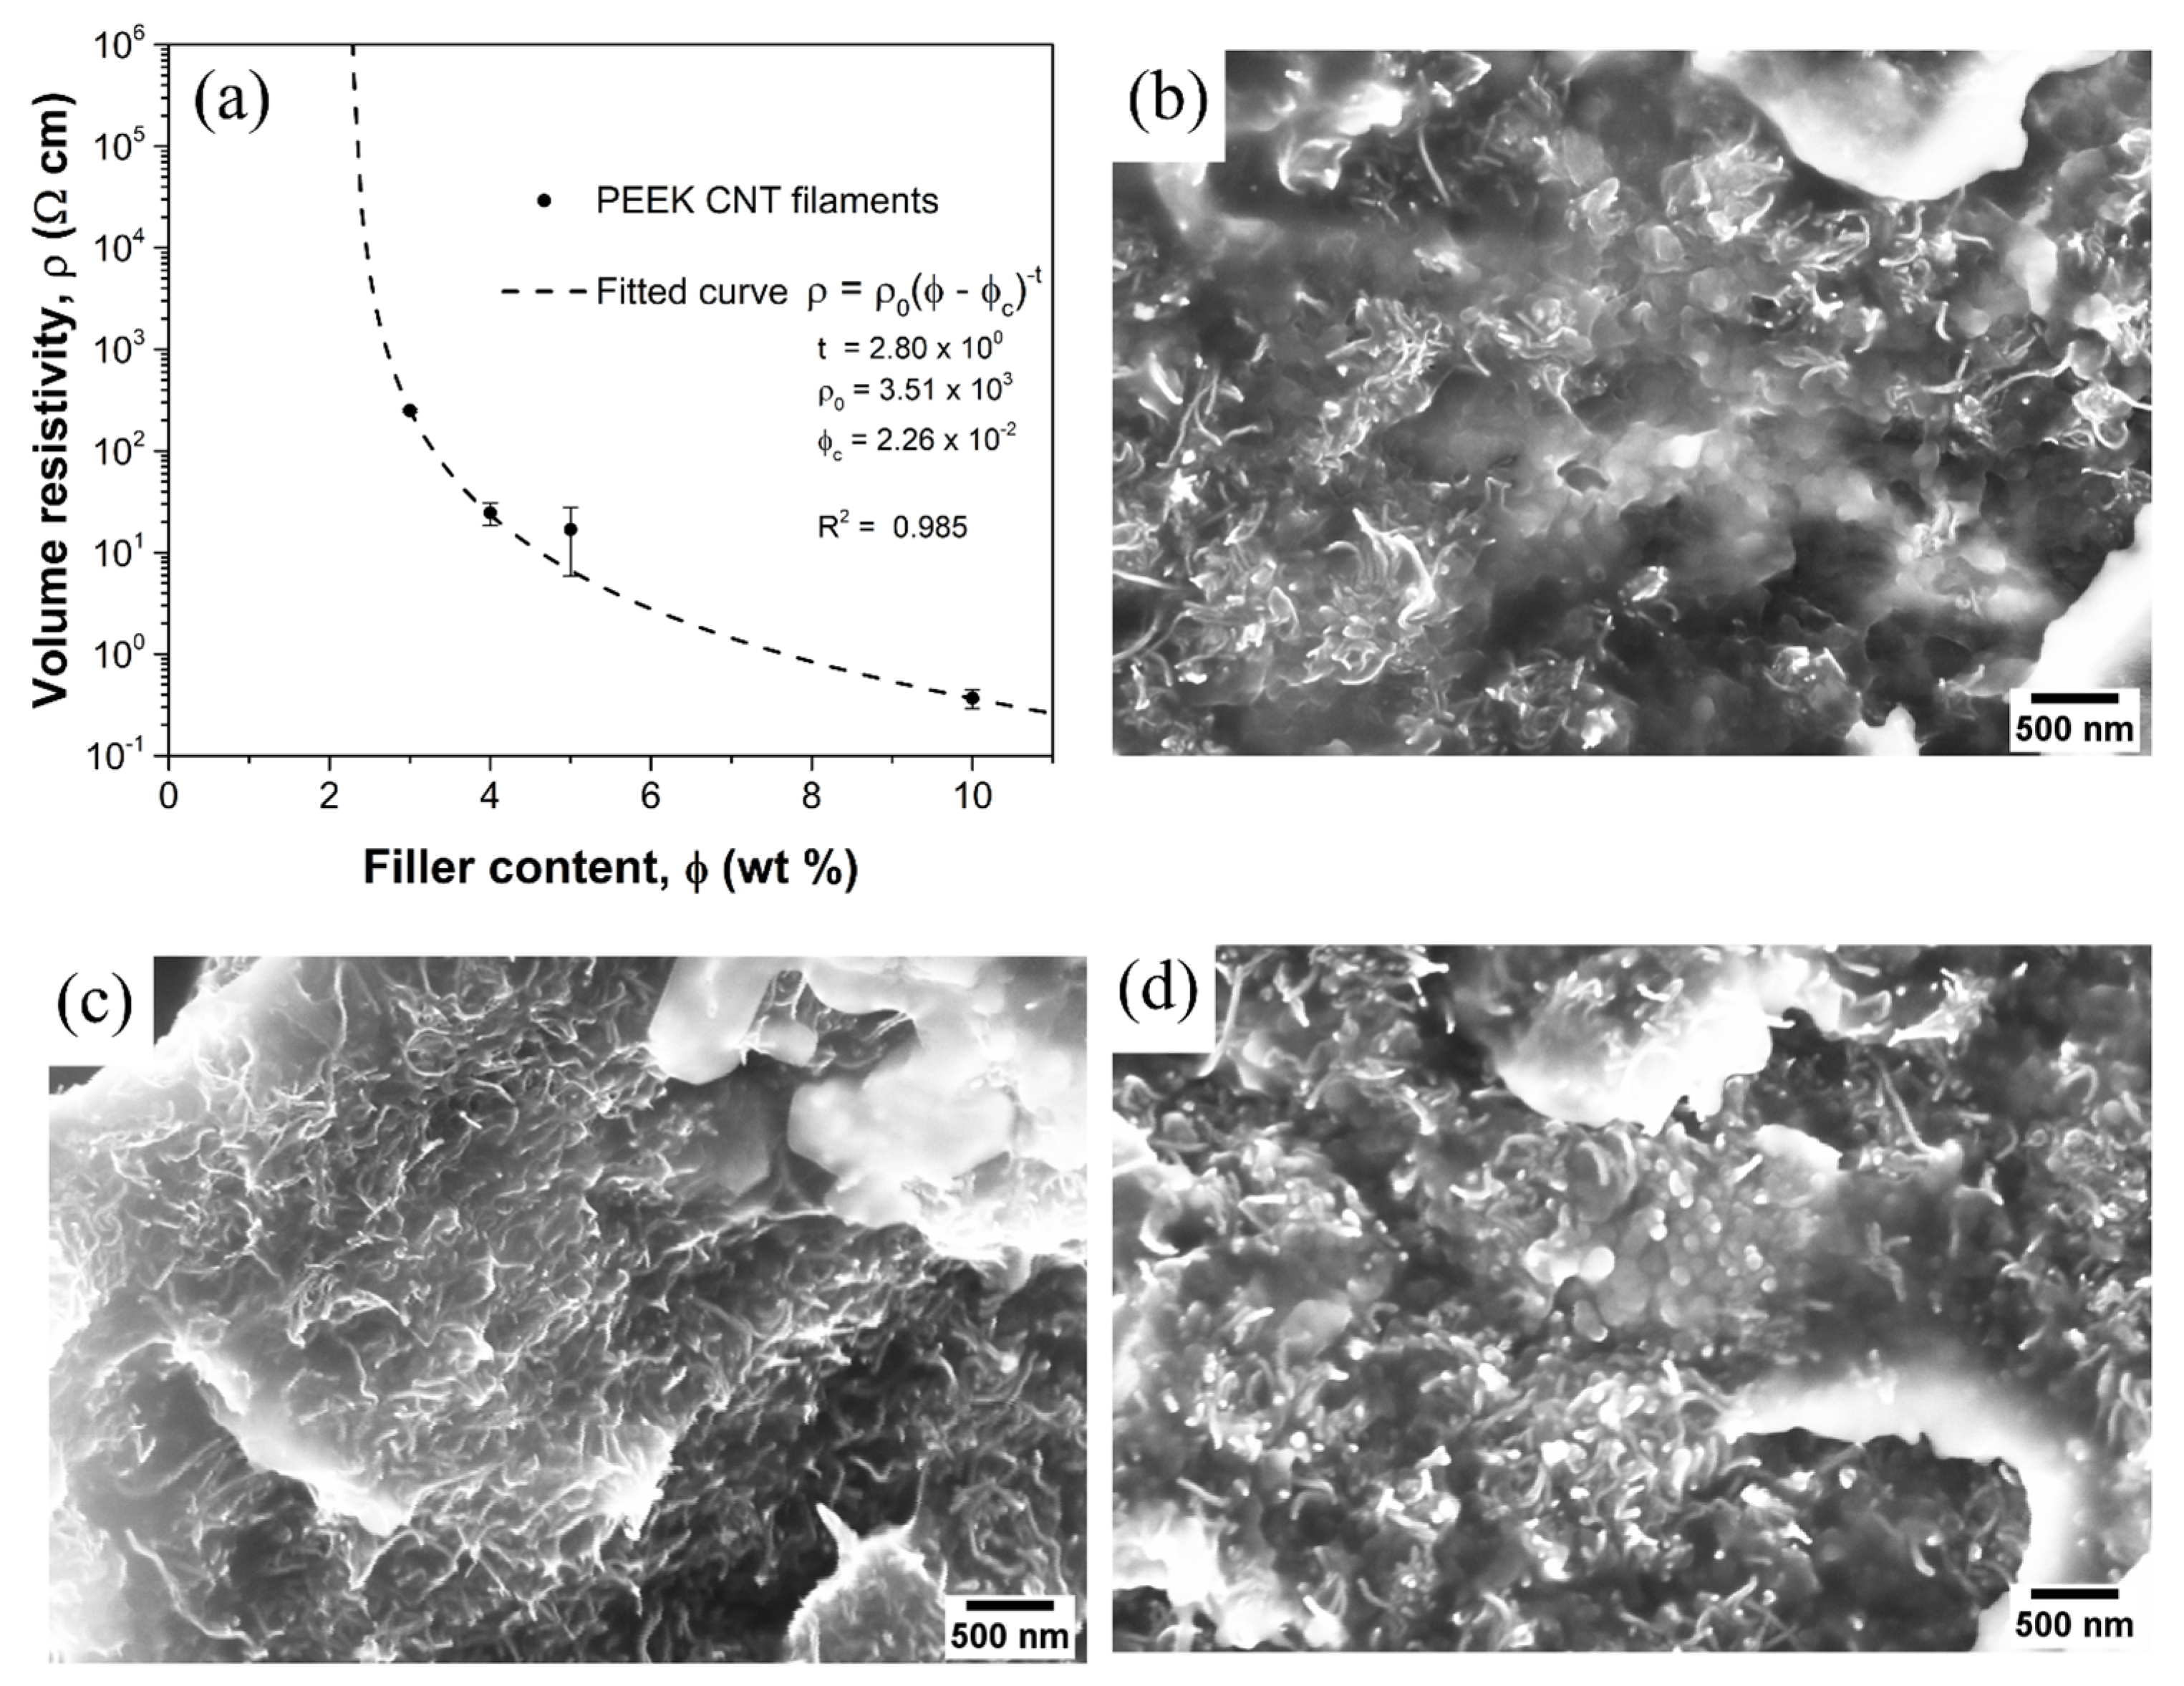
Filaments of different compositions (i.e., 0, 3, 5 and 10 wt% CNT) were extruded (Figure 1a) and measured to assess their electrical resistance.
From the electrical resistance measurements, it was found that 3 wt% of CNT produces an average resistivity of 251 Ω·cm (with a sample standard deviation (SSD) of 9 Ω·cm), 5 wt% of CNT produces a resistivity of 16.9 Ω·cm (SSD of 0.8 Ω·cm), and 10 wt% of CNT produces a resistivity of 0.368 Ω·cm (SSD of 0.077 Ω·cm). As expected, the increase in filler content entails a decrease in resistivity due to the formation of a percolating network of particles with decreasing interparticle resistance.
Figure 2a displays the measured volume resistivity as a function of filler content. The measured data, with the addition of those coming from 2 wt% CNT and 4 wt% CNT-loaded filaments, prepared in the same way, were fitted using the classic percolation power law in Equation (2) [14]
ρ = ρ 0   ( ϕ ϕ c ) t  
where ρ 0 is a proportionality constant, ϕ is the mass filler content, ϕ c is the percolation threshold and t is the critical exponent. The fitted value for the critical exponent t is 2.80 (with a fitting standard error of 0.33), which is compatible with the literature, for the PEEK–CNT composite systems [48]. The critical exponent is theoretically independent of the specific matrix-filler system and depends only on dimensionality [14], with a theoretical universal value of 1.6–2.0 for three-dimensional systems [48]. Experimentally, however, the distribution of the conductive filler within the insulating matrix gives rise to system-dependent critical exponents [20,49,50] with values up to 3 [51], depending on the filler dimensions, aspect ratio and processing conditions. In the case of needle-like fillers, such as CNT, the percolation threshold is expected to occur at a lower filler content than it would in the case of filler with a different aspect ratio [33,52,53].
The fitting curve shows the percolation threshold ϕ c occurs at 2.26 wt% (fitting error of 0.02 wt%), which is compatible with the values reported in the literature for thermoplastic matrices [34,54,55], especially for highly crystalline polymers, such as high-density polyethylene [56] and polypropylene [57]. The formation of the filler network, on the other hand, is influenced by the crystalline regions (PEEK is a high crystalline polymer), as CNTs selectively aggregate and segregate in amorphous regions [58]. They also preferentially distribute in the center of spherulites and crystallites (often promoting nucleation) [59]. Such occurrences have been reported in semi-crystalline polymers, regardless of the type of polymer matrix [59].
All the produced filaments are therefore above the percolation threshold but with different levels of network density and electrical conductivity, which are expected to greatly affect the piezo-resistive behavior of the composites [60].
SEM micrographs on the composite filaments (Figure 2b–d) show the carbon nanotubes appearing randomly and being homogeneously dispersed throughout the PEEK matrix without extensive aggregates. The filler network density, as expected, increases with an increase in filler content, which is the key factor in determining the piezo-resistive sensitivity of the composites. The scarcity of aggregates, granted by the applied shear during the extrusion process which overcomes the CNT-to-CNT van der Waals forces, plays a key role in the determination of the processing, mechanical and electrical properties of the composite. Agglomerates are indeed known to do the following: (i) cause issues during melt processing, i.e., 3D printing; (ii) hinder proper load transfer and act as stress concentrators; and (iii) reduce the number of individual CNTs contributing to the percolation network [61]. Finally, the negligible presence of porosity has been found in the filaments.

3.2. Self-Monitoring Performances of PEEK Filaments

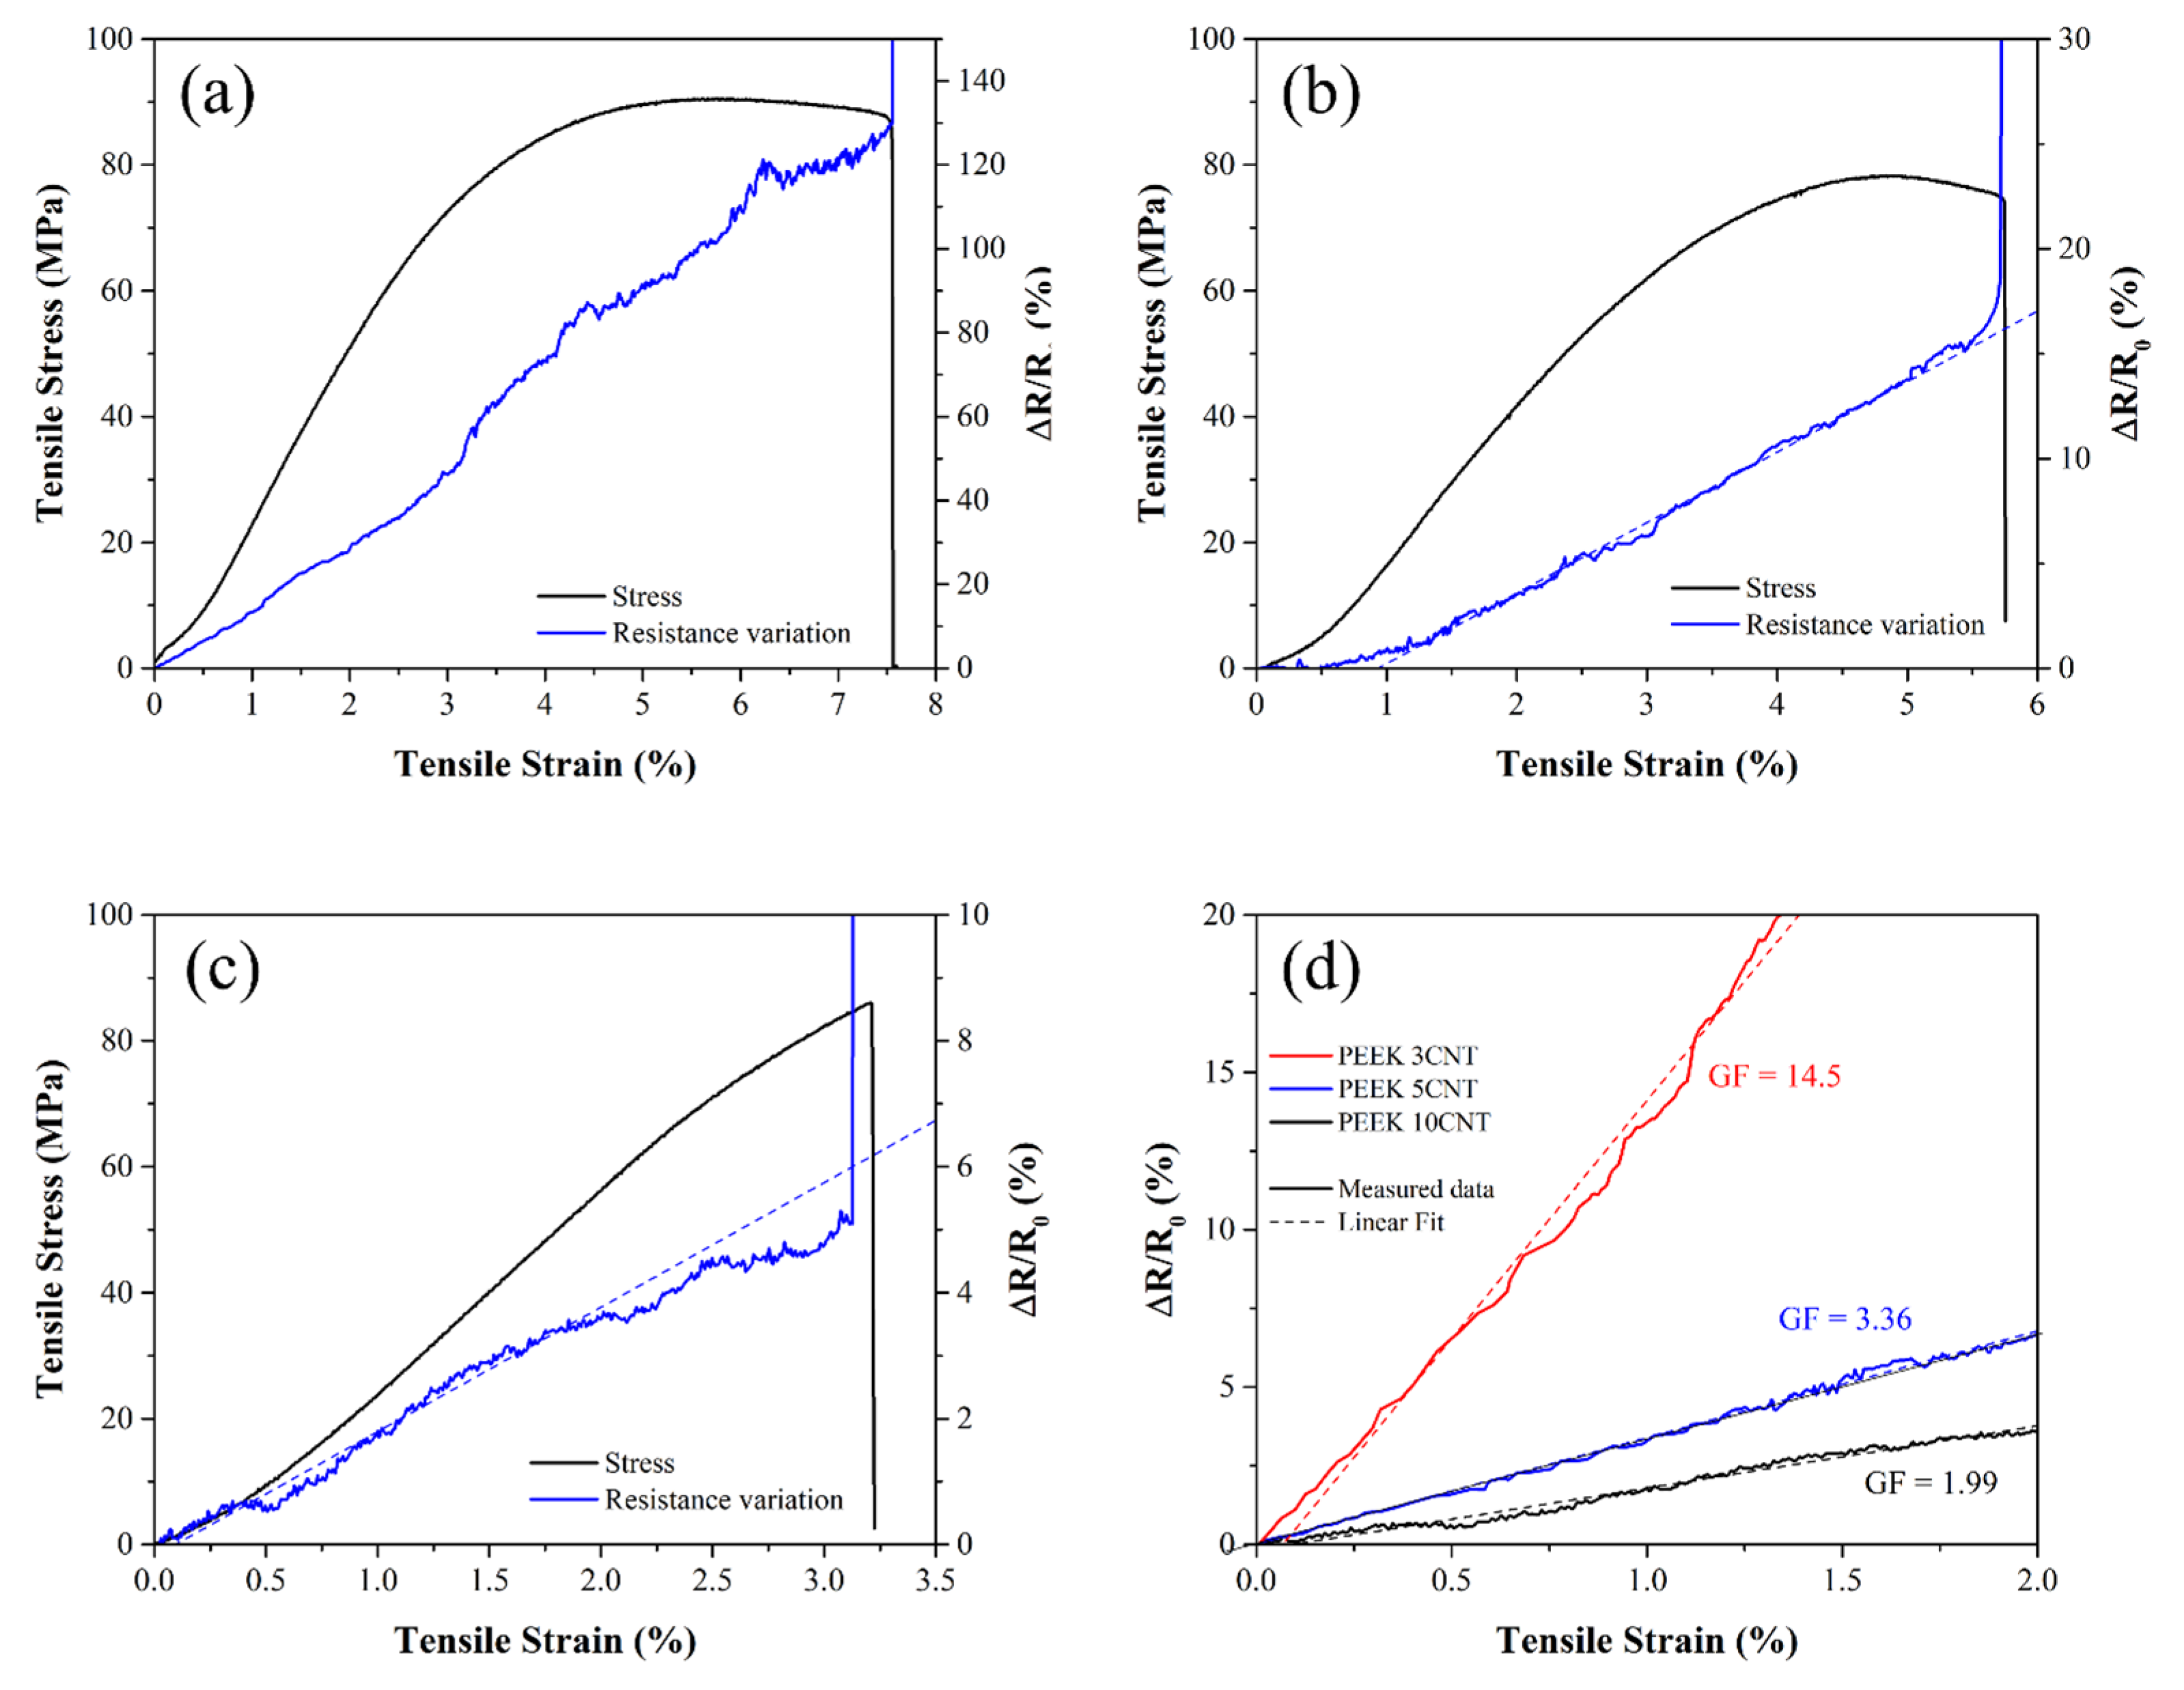
Figure 3a−c reports the results of the self-monitoring tests carried out on filaments with different CNT loading levels. Each graph reports the stress (σ) vs. strain ( ε ) curves, as well as the electrical resistance variation vs. strain curves for each type of sample. Electrical resistance variation was calculated as   Δ R / R 0 = ( R R 0 ) / R 0 , where R is the measured resistance during the test and R0 is the resistance in the unloaded state. The gauge factor (GF) of the system, which can be considered the figure of merit of the self-monitoring performance, is reported in Equation (3) where ε is the mechanical strain.
G F = Δ R R 0 ε  
All filaments show piezo-resistive behavior, as the electrical resistance increases under increasing strain. Under low strain, the electrical resistance varies almost linearly with the strain in all samples, showing the possibility to linearly correlate the measured electrical resistance with the deformation, giving rise to self-monitoring properties. In Figure 3d, a comparison of the piezo-resistive behavior in the linear elastic region of the three compositions is presented. The 3, 5 and 10 wt% CNT-loaded filaments showed average gauge factors of 14.5, 3.36 and 1.99 (see Table 1), respectively, which are equal to or higher than that of commercial metal strain gauge (GF = 2). All the prepared composites show promising self-monitoring performances in the linear elastic region.
The difference in the GF and sensitivity of the samples can be ascribed to the difference in filler content, which in turn influences the interparticle distance. The interparticle distance in the undeformed system is indeed a crucial factor in the determination of the electrical current flow and, thus, piezo-resistive behavior [62]. The piezo-resistive effect of the CNT-loaded polymers can indeed be related to the following three main factors: (i) the variation in the interparticle distance and the number of CNT–CNT contacts due to filler rotation, reorientation and separation, which lead to an alteration in conductivity; (ii) the variation in tunnelling resistance, namely the resistance in electron-conductivity between non-contacting particles through the tunnelling effect; and (iii) the deformation of the nanotubes, which gives rise to the intrinsic piezo-resistivity of the filler [62,63,64]. While (i) can be considered predominant in the determination of the piezoelectric behavior in systems with an amount of filler above percolation, tunnelling can play a major role when filler concentration is around the percolation threshold. The (iii) mechanism is generally negligible in polymeric composites.
PEEK 3CNT samples were proven to be just above percolation; therefore, they are expected to present a lower density network with few available pathways and a consequent high sensitivity to system alterations, resulting in a very high GF [65]. Denser systems, on the other hand, are characterized by a higher redundancy of pathways; therefore, the applied stress, while affecting the internal distribution of the fillers, does not greatly affect electron flow [66]. This is the case of PEEK 10CNT samples, which are significantly above percolation (very low volume resistivity in the unstressed state) and, coherently, offer a lower gauge factor and self-monitoring sensitivity. As a general remark, it has to be remembered that CNT-based composites always present lower sensitivity than other systems loaded with carbon black or graphene nanoplatelets [60], as the needle-like geometrical shape and the very high aspect ratio of the nanotubes (up to about 1000), while allowing for a lower percolation threshold [33,52,53], causes the particles to maintain contact during deformation through sliding; therefore, they resist separation [67]. Moreover, high aspect ratio particles may be in contact with several other CNTs along its length, thus adding to the redundancy, and form a network with fewer tunnelling contacts compared to lower aspect ratio filler systems (like carbon black).
Above the elastic region, at higher strain levels (i.e., >2%), the electrical resistance variation generally loses linearity and becomes noisy as a result of the irreversible changes in the percolation network caused by PEEK plastic deformation and polymer chains’ reorientation. This is particularly evident in the PEEK 3CNT sample at around 3% strain (Figure 3a). Finally, shortly before mechanical failure, electrical resistance experiences a sudden increase to become infinite when material continuity is interrupted.

3.3. Self-Monitoring Performances of 3D-Printed PEEK

The 3 and 5 wt% CNT composite filaments were 3D-printed into tensile samples (Figure 1b) for mechanical and self-monitoring characterization. On the other hand, due to its high filler loading levels, the PEEK 10CNT filament was found to be barely printable, so the quality of the resulting 3D-printed specimens was considered unsatisfactory, and the samples were discarded. The addition of a high amount of CNT, in fact, resulted in a decrease in the flowability of the composite due to the strong particle–particle and filler–matrix interactions [68]. Moreover, PEEK 10CNT filaments were stiff and brittle; therefore, proper feeding, melting and deposition were not possible. The feeding mechanism, indeed, consists of a pinch-roll system in which the solid filament is gripped and pushed through a guiding tube to the heated nozzle. Therefore, the solid filament itself acts as a plunger to extrude the molten polymer through the nozzle. The combination of high viscosity, leading to a higher downstream pressure acting on the filament, and the stiffness and brittleness of the material resulted in the failure of the filament inside the guiding tube due to buckling [69].
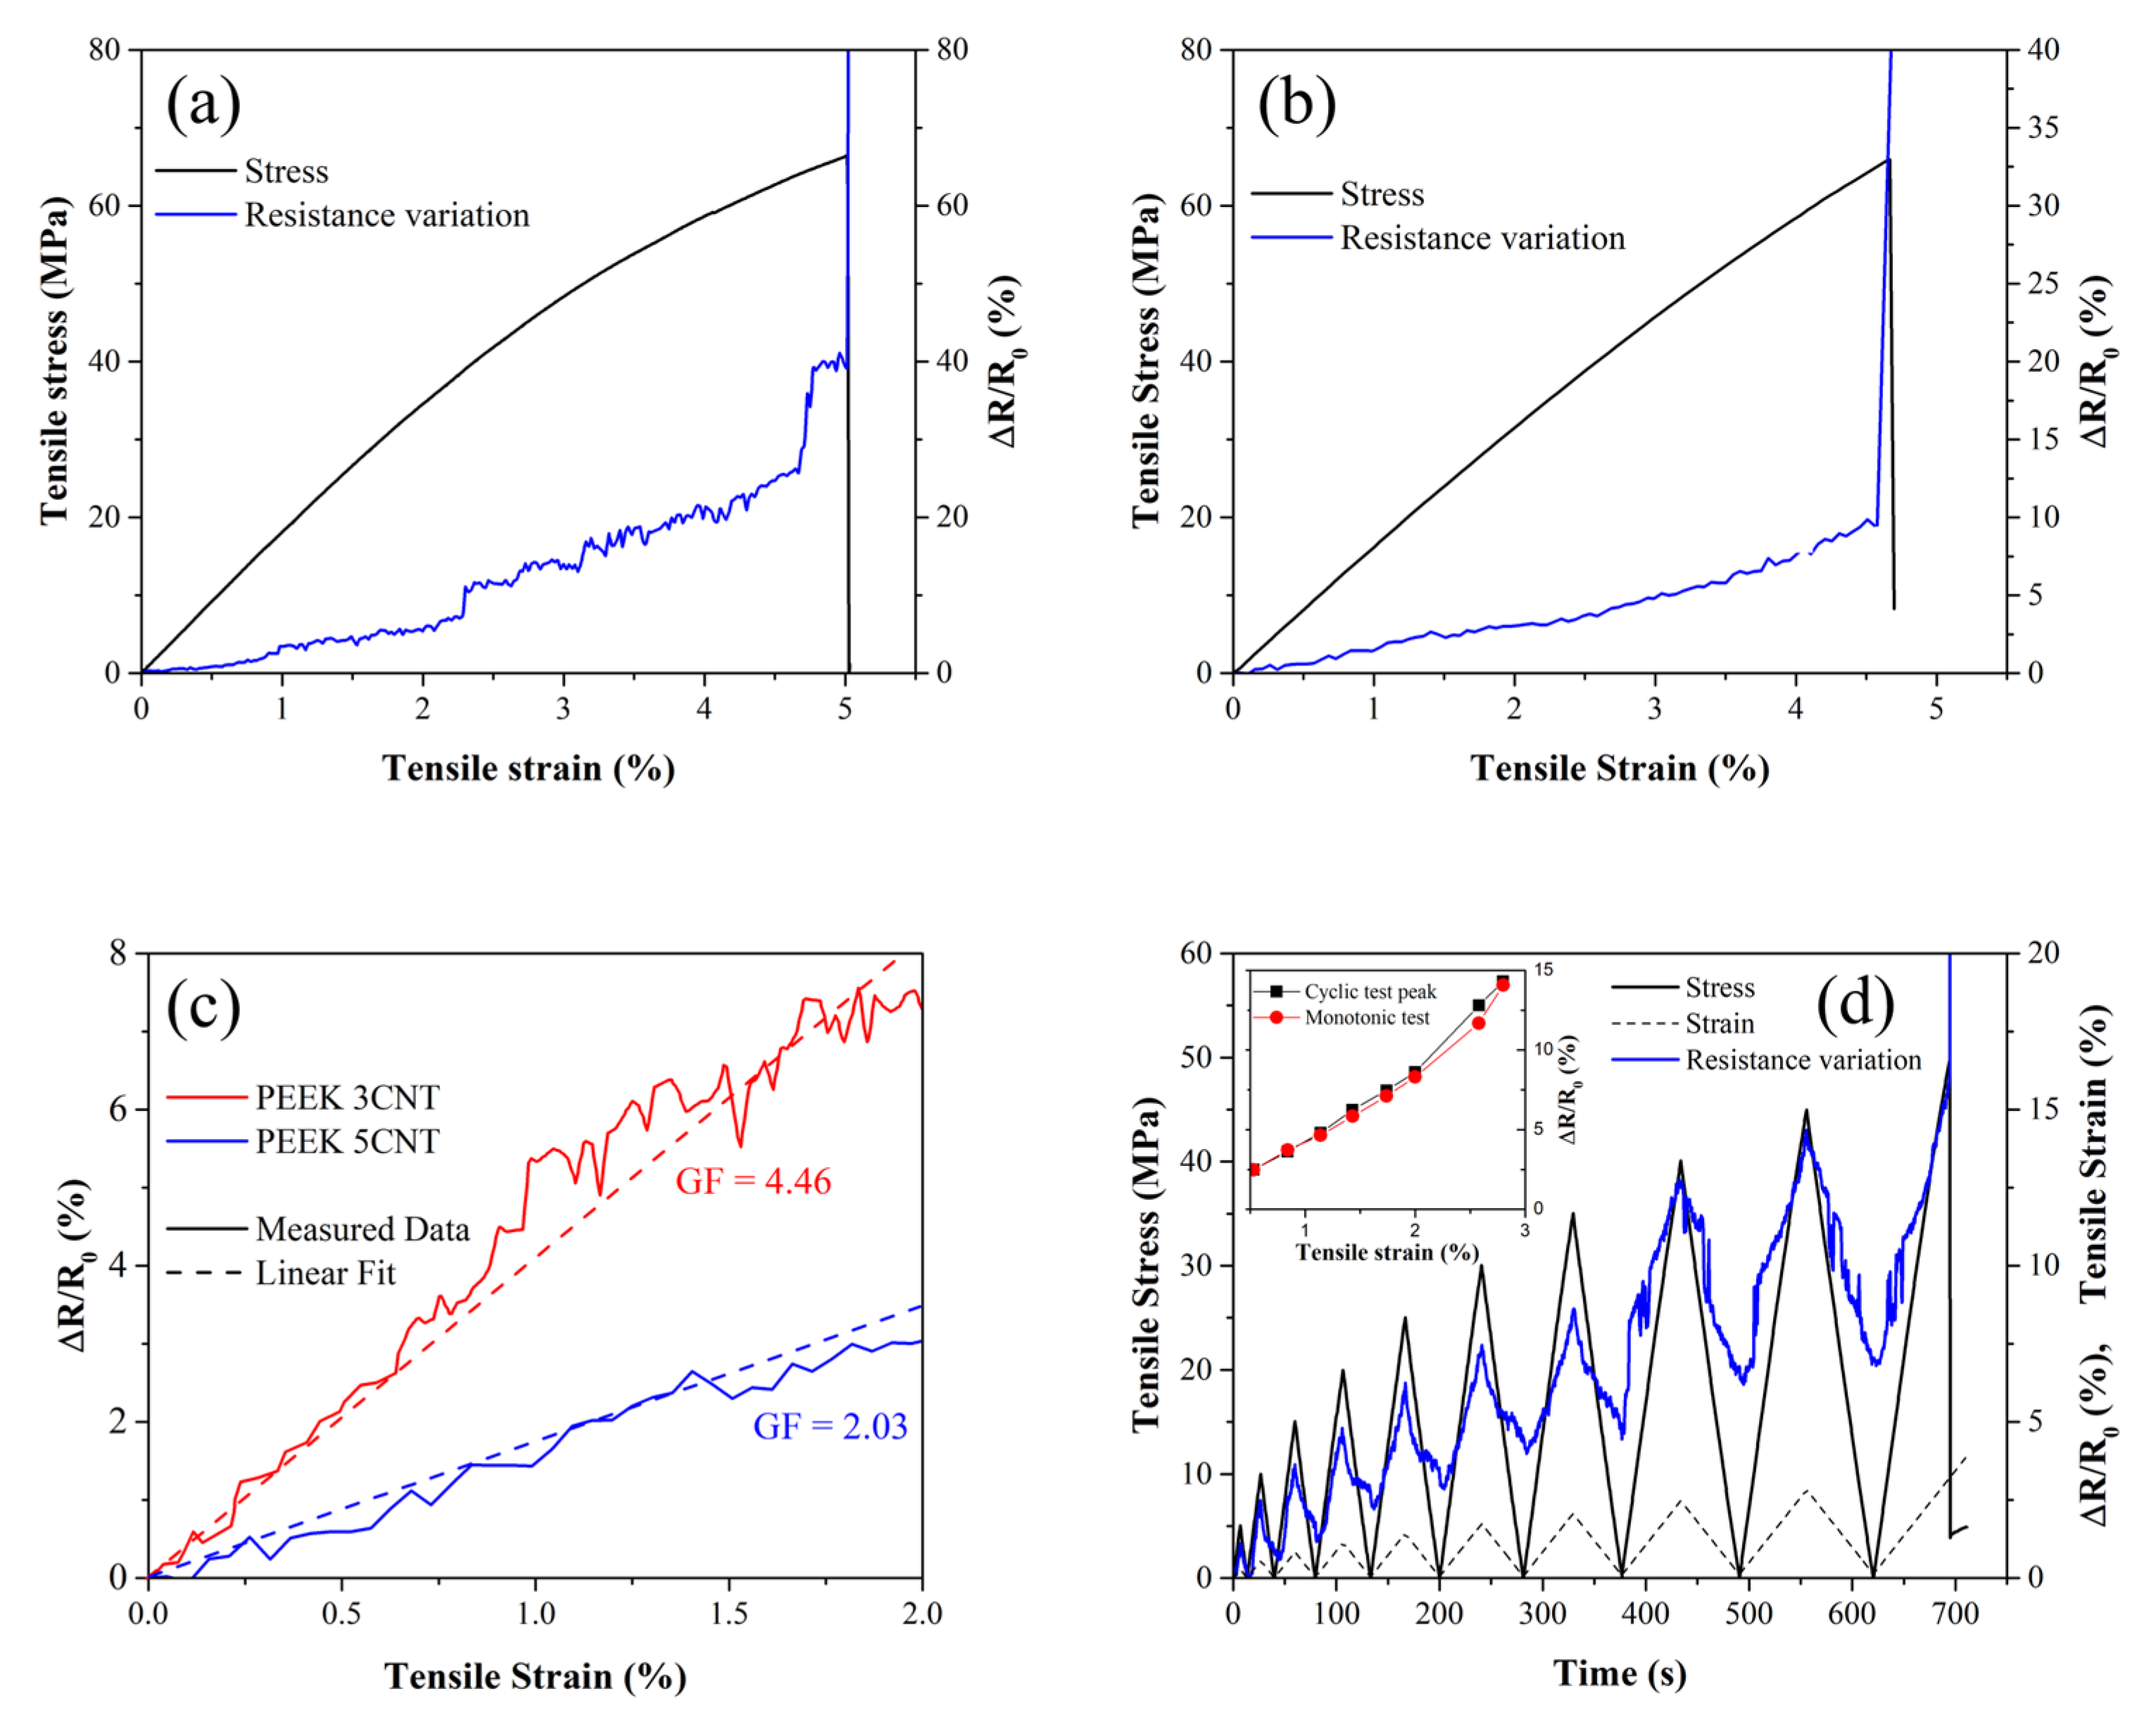
The results of the self-monitoring characterization of the 3D-printed PEEK 3CNT and PEEK 5CNT samples are reported in Figure 4a,b, while a comparison of the linear region of the curves is presented in Figure 4c,d. The composites present piezo-resistive behavior with an increase in electrical resistance under mechanical stress (i.e., 20.9% and 7.3% resistance increase for PEEK 3CNT and 5CNT, respectively, at a strain of 4%). PEEK 3CNT and PEEK 5CNT show an average GF of 4.46 and 2.03, respectively.
Comparing the gauge factors in Table 1, it is clear that those of the 3D-printed samples are lower than that of the relevant filaments. It is important to point out, however, that the self-monitoring performance and the mechanical behavior of the filaments and 3D-printed samples cannot be directly compared, as the mechanism of electrical current flow is deeply different in the two cases and the 3D-printed samples mechanically behave as a multilayer structure. In fact, while the electrical resistance variation of the single filaments directly referrs to its composition and microstructure through the variation of CNT distribution within the matrix, in the 3D-printed samples, overall   Δ R / R 0 is the result of different concurring mechanisms as the current may flow through different paths.
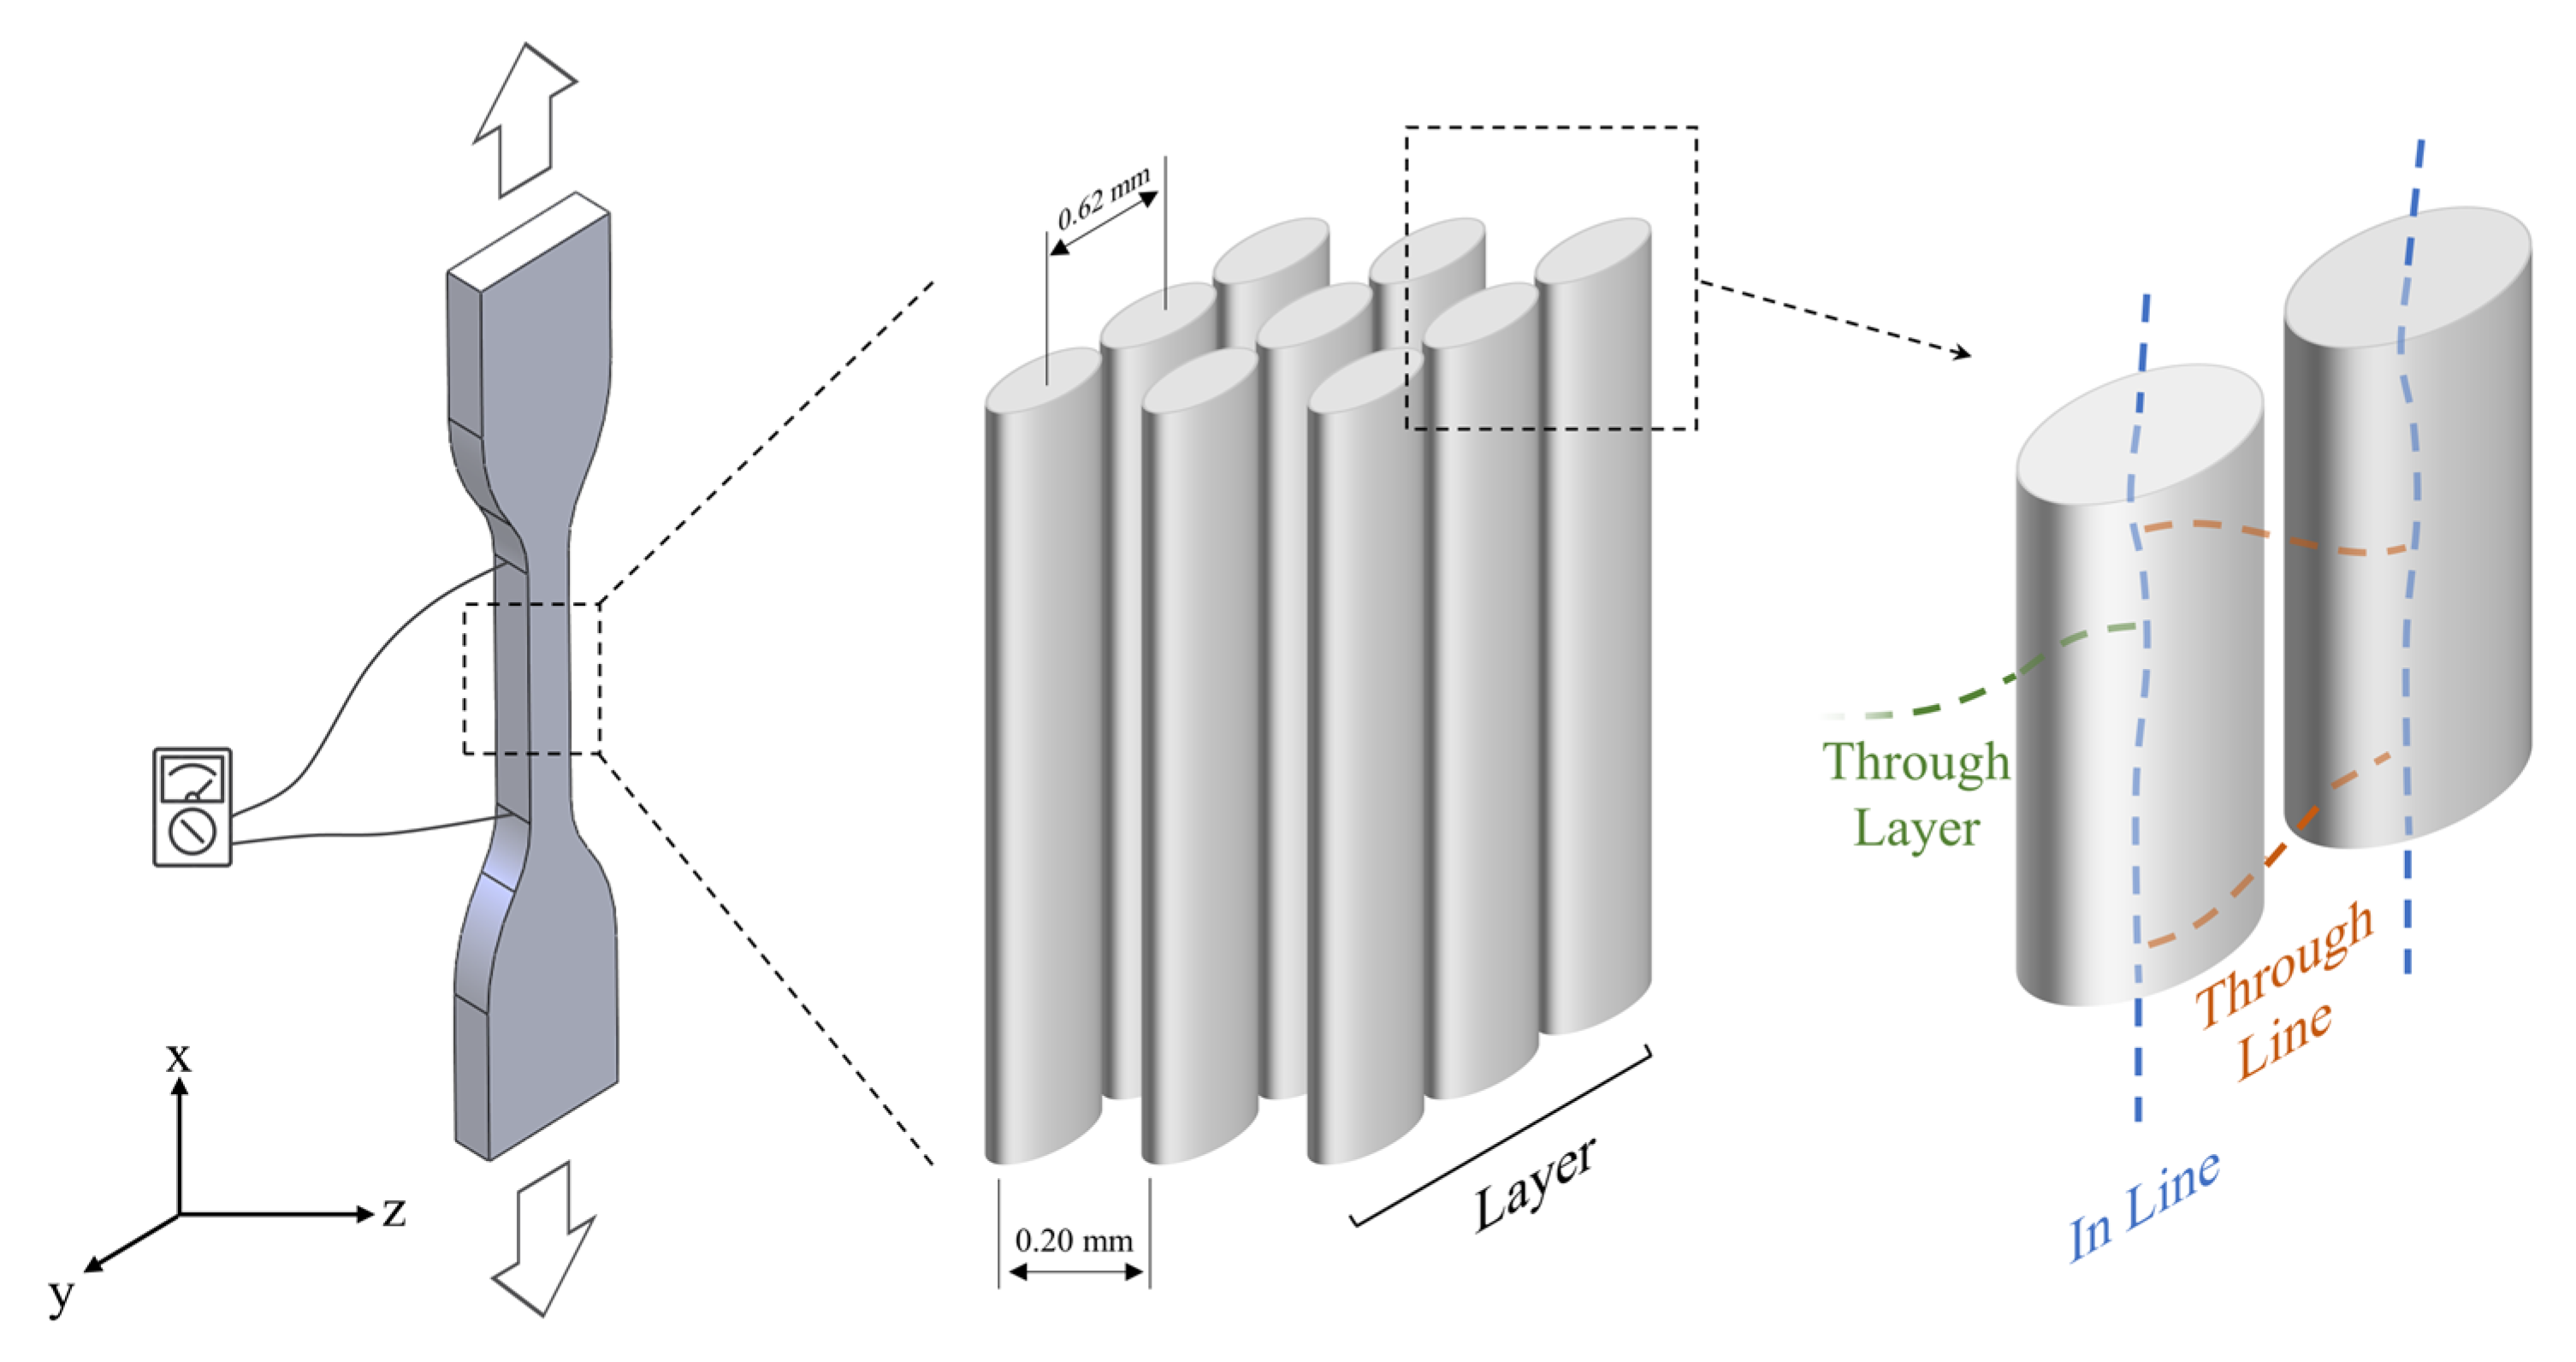
Figure 5 proposes a schematic of possible current pathways within the 3D-printed sample, which are made of a stack of layers, with each layer composed by parallel conductive filaments parallel to the sample longitudinal axis. This morphology is due to the specific 3D-printing parameters used, namely 100% infill with a 0° raster angle. It has to be noted that different filament depositions lead to a different morphology and, consequently, different mechanical and electrical conductivity performances [22,36,70]. In our case, three major conduction pathways are available in the 3D-printed samples: (i) in-line conductivity along the length of the extruded filaments; (ii) through-line conductivity occurring within each layer between adjacent extruded filaments; and (iii) through-layer conductivity, with electron flow between the adjacent layers (Figure 5).
According to the proposed schematics, mechanical strain affects the three conduction pathways in different ways. In-line conductivity, with pathways running in continuous material, will be mainly affected by CNT redistribution and separation and is not dependent on the 3D-printing process. On the other hand, the presence of porosity and line–line separation will reduce the through-line conductivity, while delamination of the adjacent layers will impact the through-layer conductivity. The first mechanism is expected to play a major role in piezo-resistive behavior and to be responsible for the global   Δ R / R 0 vs. strain trend, while delamination and line–line separation cause local oscillations or step-like increases in electrical resistance, which are not accompanied by any event on the mechanical curve (i.e., Figure 4a at 2.2% and 4.7% strain).
Both through-line and through-layer conductivity are strictly dependent on the 3D-printing process. Indeed, during material deposition through the nozzle, the bonding process between adjacent lines and layers is driven by residual thermal energy in the material, which yields polymer chain diffusion across the interface [71]. Nozzle, bed and chamber temperatures, together with layer height and printing speed, are key factors in governing the extrusion and bonding process [72]. It is therefore clear how a shorter time interval between the deposition of two adjacent lines, compared to the interval between adjacent layers, involves greater residual thermal energy [11], and therefore determines a higher line-to-line bond strength compared to the poorer layer-to-layer bond. It is reported in the literature that inter-layer voids and adhesion greatly affect in-plane electrical conductivity, both in direct and alternating currents, while through-line conduction is affected to a lesser extent [73]. Even though the latter two conduction modes pose higher resistance to current flow, they still contribute to the overall equivalent resistance measured during the self-monitoring tests. If delamination or line debonding occur due to mechanical stress, the sudden interruption of the conduction pathways determines a jump in the measured electrical resistance variation. On the other hand, the interruption of those interfaces would not affect the mechanical response of the material because the interfaces are orthogonal to the applied stress and do not bear any load.
It can be concluded that delamination of 3D-printed layers produces the same effects on self-monitoring performance as those observed during the delamination of self-monitoring fiber-reinforced composite laminates [66]. The reported laminate-like behavior offers a possibility to detect damages in the direction orthogonal to the applied load and to increase the sensitivity of the composite material to the applied strain.
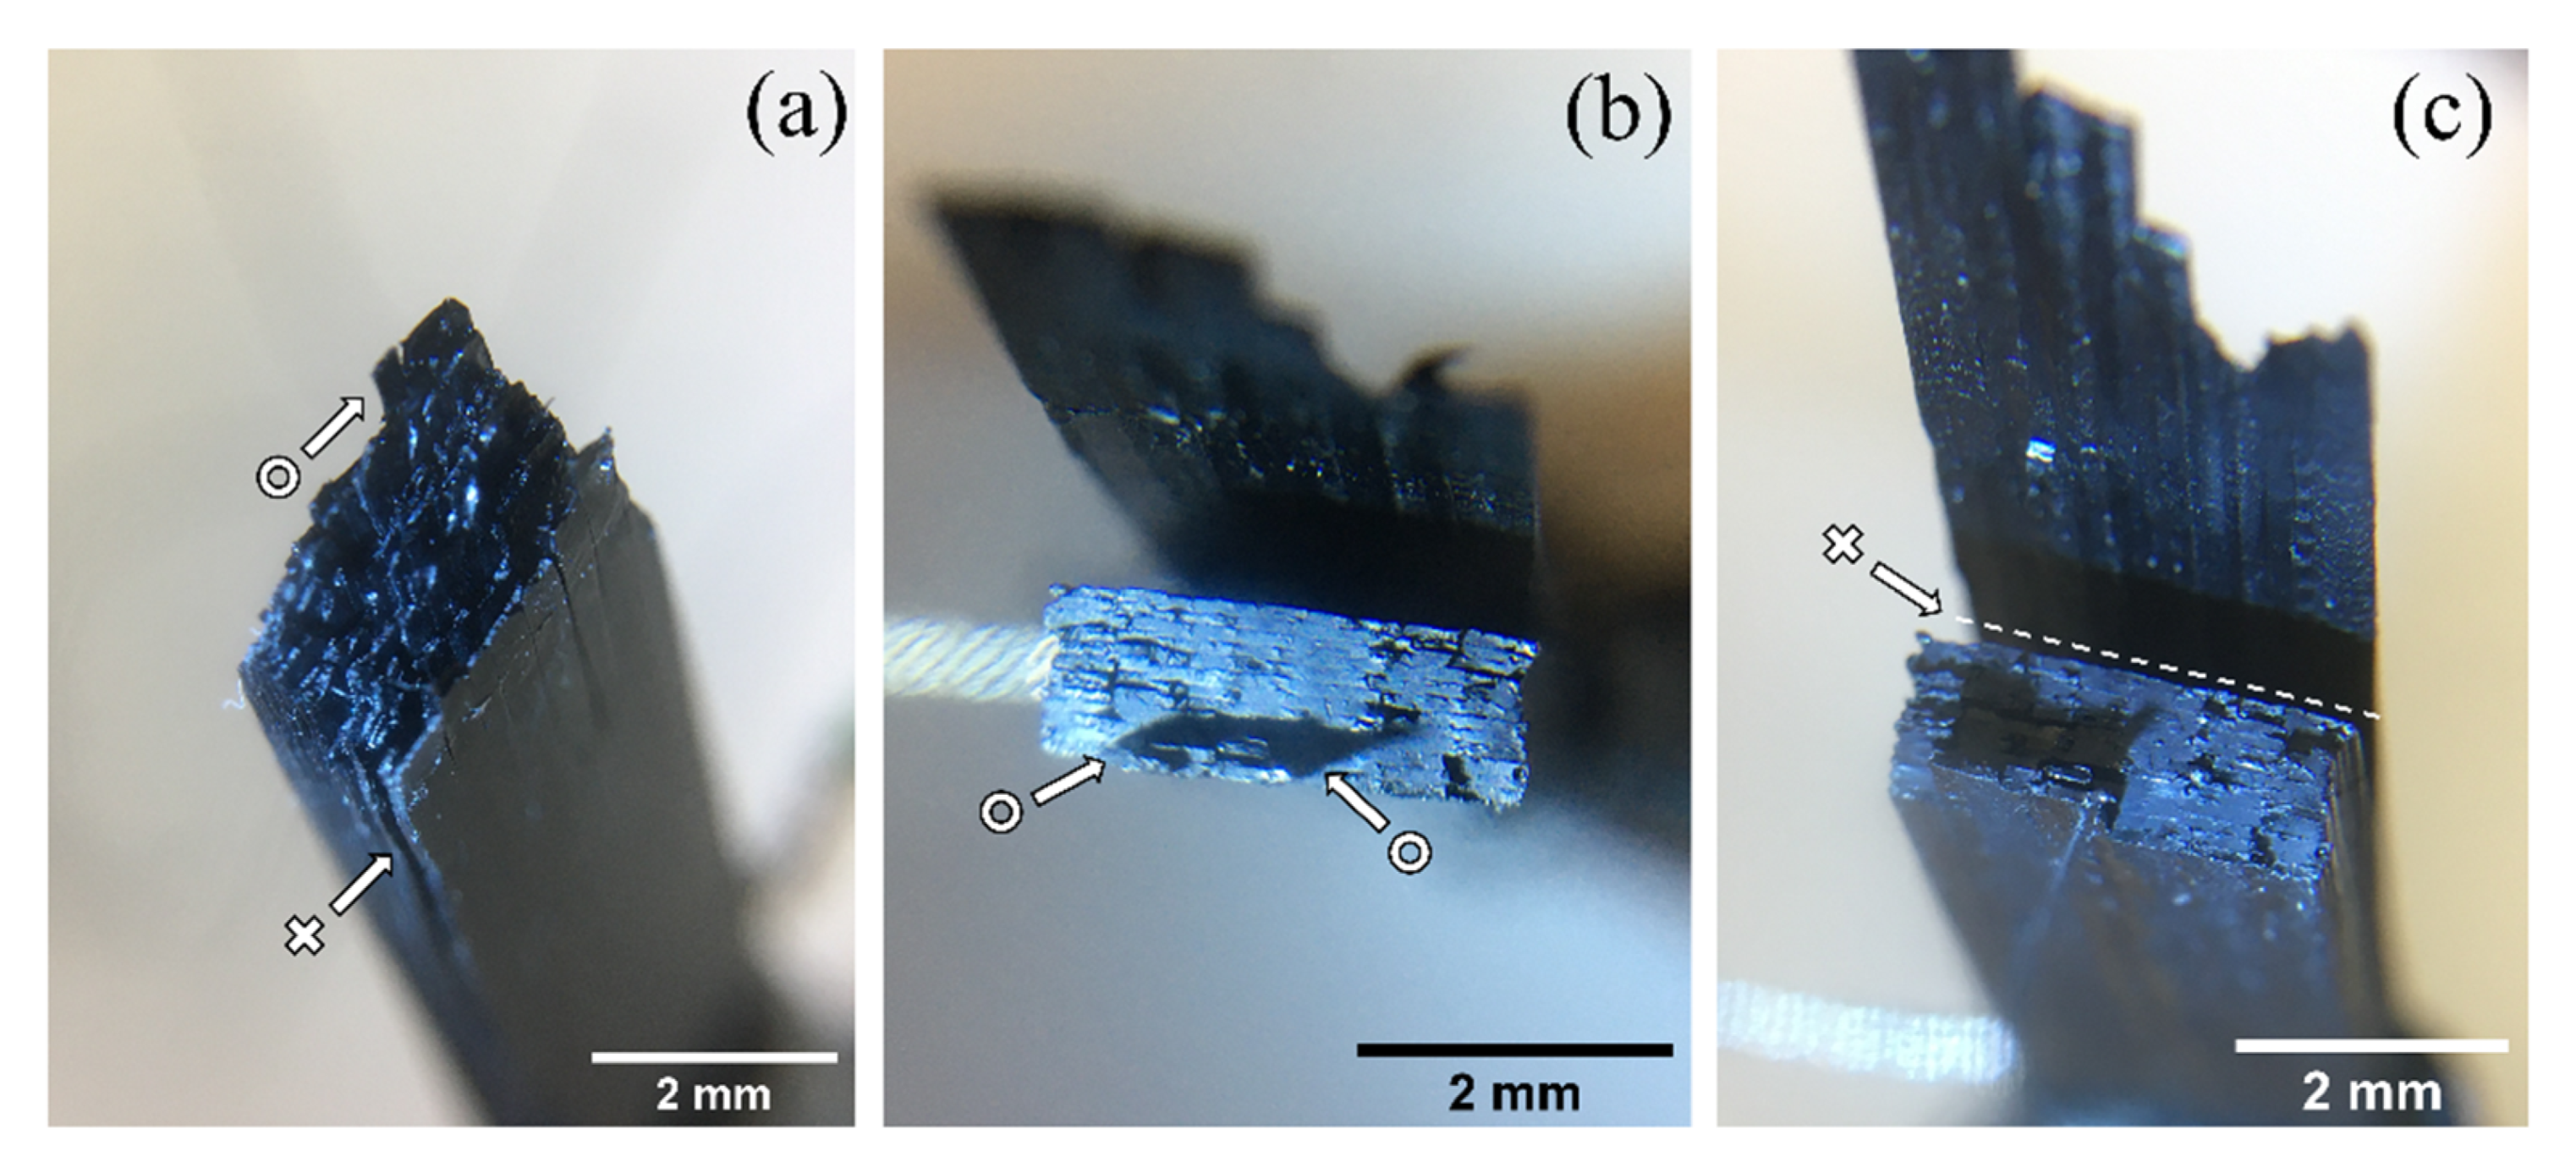
The optical observation of the PEEK 3CNT 3D specimens after the tensile test (Figure 6) yields a better understanding of its mechanical and self-monitoring behavior (Figure 4a).
The presence of layer–layer delamination (highlighted with crosses) and line–line delamination within a single layer (highlighted with circles) is highlighted in the figure. As expected, the micrographs evidence that layer–layer delamination is more prevalent than line–line separation because, in the former, both polymer adhesion and inter-diffusion are weaker, according to the aforementioned temperature-driven bonding process. The extensive delamination of Figure 6b,c, in fact, occurs between the first and second printed layer, where the thermal mismatch is maximum. In fact, the first layer is deposited onto the printing plate and actively heated at 130 °C, causing the material to undergo rapid cooling. The mismatch causes reduced interlayer adhesion [74] and possible differential thermal contraction, which facilitate delamination during tensile testing.
The cyclic tests carried out on PEEK 3CNT (Figure 4d) highlight valuable and interesting self-monitoring behavior. The electrical resistance variation, in fact, is able to follow the mechanical stress and strain up to the final fracture, with no recorded electrical delay. Unlike some cases in the literature [75,76], no double or asymmetric peaks were recorded, highlighting a monotonic electrical response to mechanical strain. Comparing the maximum Δ R / R 0 value recorded in each cycle with the values measured during monotonic testing (see Figure 4a) at the same tensile strain, it is possible to observe that the two values are perfectly comparable, as shown in the inset of Figure 4d. This behavior highlights a promising reliability of the system as a self-monitoring component also in cyclic loading conditions, as the maximum resistance value measured appears to be dependent only on the applied stress/strain. On the other hand, the   Δ R / R 0 value in the unloaded state (i.e., the valley of each cycle) appears to increase with each loading cycle. This behavior highlights a residual resistance variation which is ascribable to irreversible electrical path changes in the material, such as the rearrangement of the carbon nanotubes, cracks or local plastic deformation [77]. Finally, as strain gets closer to failure and delamination and cracks increase within the material, the   Δ R / R 0 curve tends to lose linearity and become noisy until fracture, in accordance with the quasi-static tensile testing results.

4. Conclusions

Self-monitoring PEEK–CNT nanocomposites at different filler loading levels (3, 5 and 10% by weight) have been extruded in filaments and 3D-printed via the FFF process. All the filaments show piezo-resistive behavior with an increase in electrical resistance when subjected to tensile stress, with a far higher sensitivity with respect to the typically employed strain gauges. These composite materials can be easily produced allowing for industrial-scale filament productions. Only 3 and 5 wt% formulations turned out to be 3D-printable due to the excessive brittleness of 10 wt% loaded filaments. All the 3D-printed samples showed self-monitoring behavior with decreased sensitivity with respect to the filaments, mainly due to the infill pattern and printing defects, which affect electrical conduction pathways. Three-dimensional-printed PEEK 3CNT samples that presented higher sensitivity were subjected to cyclic test, showing promising features for their use in health-monitoring structures.

Author Contributions

Conceptualization, M.B. and F.N.; Methodology, M.B.; Validation, L.P., M.B. and F.N.; Formal Analysis, L.P.; Investigation, L.P.; Resources, F.F., R.L. and F.N.; Writing—original draft, L. P., F.N.; Writing—review and editing, F.N., L.P. and M.B.; Visualization, L.P.; Supervision, F.F., R.L. and F.N. All authors have read and agreed to the published version of the manuscript.

Funding

This research received no external funding.

Institutional Review Board Statement

Not applicable.

Informed Consent Statement

Not applicable.

Data Availability Statement

The data presented in this study are available on request from the corresponding author.

Conflicts of Interest

The authors declare no conflict of interest.

References

  1. Chung, D.D.L. Self-monitoring structural materials. Mater. Sci. Eng. R Rep. 1998, 22, 57–78. [Google Scholar] [CrossRef]
  2. Flandin, L.; Bréchet, Y.; Cavaillé, J.Y. Electrically conductive polymer nanocomposites as deformation sensors. Compos. Sci. Technol. 2001, 61, 895–901. [Google Scholar] [CrossRef]
  3. Nanni, F.; Ruscito, G.; Puglia, D.; Terenzi, A.; Kenny, J.M.; Gusmano, G. Effect of carbon black nanoparticle intrinsic properties on the self-monitoring performance of glass fibre reinforced composite rods. Compos. Sci. Technol. 2011, 71, 1–8. [Google Scholar] [CrossRef] [Green Version]
  4. Gomez, J.; Zubia, J.; Aranguren, G.; Arrue, J.; Poisel, H.; Saez, I. Comparing polymer optical fiber, fiber Bragg grating, and traditional strain gauge for aircraft structural health monitoring. Appl. Opt. 2009, 48, 1436–1443. [Google Scholar] [CrossRef]
  5. García, I.; Zubia, J.; Durana, G.; Aldabaldetreku, G.; Illarramendi, M.A.; Villatoro, J. Optical Fiber Sensors for Aircraft Structural Health Monitoring. Sensors 2015, 15, 15494–15519. [Google Scholar] [CrossRef] [PubMed] [Green Version]
  6. Zhu, L.; Fu, Y.; Chow, R.; Spencer, B.F.; Park, J.W.; Mechitov, K. Development of a High-Sensitivity Wireless Accelerometer for Structural Health Monitoring. Sensors 2018, 18, 262. [Google Scholar] [CrossRef]
  7. Banerjee, K.; Debroy, M.; Balla, V.K.; Bodhak, S. Recent progress in 3D-printed polyaryletherketone (PAEK)-based high-performance polymeric implants for musculoskeletal reconstructions. J. Mater. Res. 2021, 36, 3877–3893. [Google Scholar] [CrossRef]
  8. De Leon, A.C.; Chen, Q.; Palaganas, N.B.; Palaganas, J.O.; Manapat, J.; Advincula, R.C. High performance polymer nanocomposites for additive manufacturing applications. React. Funct. Polym. 2016, 103, 141–155. [Google Scholar] [CrossRef]
  9. Advincula, R.C. 3D Printing High Performance Polymers and the Oil and Gas Industry. In Proceedings of the CORROSION 2019, Nashville, TN, USA, 24 March 2019. [Google Scholar]
  10. Weyhrich, C.W.; Long, T.E. Additive manufacturing of high-performance engineering polymers: Present and future. Polym. Int. 2022, 71, 532–536. [Google Scholar] [CrossRef]
  11. Sgrulletti, M.; Bragaglia, M.; Giarnetti, S.; Paleari, L.; Nanni, F. Understanding the impact of Fused Filament Fabrication conditions on the microstructure and tensile properties of polyamide 6 by thermal and optical live monitoring. Mater. Today Commun. 2021, 28, 102679. [Google Scholar] [CrossRef]
  12. Popescu, D.; Zapciu, A.; Amza, C.; Baciu, F.; Marinescu, R. FDM process parameters influence over the mechanical properties of polymer specimens: A review. Polym. Test. 2018, 69, 157–166. [Google Scholar] [CrossRef]
  13. Rinaldi, M.; Ghidini, T.; Nanni, F. Fused filament fabrication FFF of polyetheretherketone (PEEK)/Multi-Walled Carbon Nanotube (MWCNT) nanocomposites: The effect of thermally conductive nanometric filler on the printability and related properties. Polym. Int. 2021, 70, 1080–1089. [Google Scholar] [CrossRef]
  14. Bunde, A.; Dieterich, W. Percolation in composites. J. Electroceramics 2000, 5, 81–92. [Google Scholar] [CrossRef]
  15. Saar, M.O.; Manga, M. Continuum percolation for randomly oriented soft-core prisms. Phys. Rev. E 2002, 65, 056131. [Google Scholar] [CrossRef] [PubMed] [Green Version]
  16. Tianchen, Y.; Jian, Y.; Ruigang, S.; Youngs, I.J. A geometric percolation model for non-spherical excluded volumes. J. Phys. D. Appl. Phys. 2003, 36, 738. [Google Scholar] [CrossRef]
  17. Jang, D.; Yoon, H.N.; Nam, I.W.; Lee, H.K. Effect of carbonyl iron powder incorporation on the piezoresistive sensing characteristics of CNT-based polymeric sensor. Compos. Struct. 2020, 244, 112260. [Google Scholar] [CrossRef]
  18. Du, F.; Fischer, J.E.; Winey, K.I. Effect of nanotube alignment on percolation conductivity in carbon nanotube/polymer composites. Phys. Rev. B—Condens. Matter Mater. Phys. 2005, 72, 121404. [Google Scholar] [CrossRef] [Green Version]
  19. Aguilar, J.O.; Bautista-Quijano, J.R.; Avilés, F. Influence of carbon nanotube clustering on the electrical conductivity of polymer composite films. Express Polym. Lett. 2010, 4, 292–299. [Google Scholar] [CrossRef]
  20. Kovacs, J.Z.; Velagala, B.S.; Schulte, K.; Bauhofer, W. Two percolation thresholds in carbon nanotube epoxy composites. Compos. Sci. Technol. 2007, 67, 922–928. [Google Scholar] [CrossRef] [Green Version]
  21. Vidakis, N.; Petousis, M.; Tzounis, L.; Velidakis, E.; Mountakis, N.; Grammatikos, S.A. Polyamide 12/Multiwalled Carbon Nanotube and Carbon Black Nanocomposites Manufactured by 3D Printing Fused Filament Fabrication: A Comparison of the Electrical, Thermoelectric, and Mechanical Properties. C 2021, 7, 38. [Google Scholar] [CrossRef]
  22. Zhang, J.; Yang, B.; Fu, F.; You, F.; Dong, X.; Dai, M. Resistivity and Its Anisotropy Characterization of 3D-Printed Acrylonitrile Butadiene Styrene Copolymer (ABS)/Carbon Black (CB) Composites. Appl. Sci. 2017, 7, 20. [Google Scholar] [CrossRef] [Green Version]
  23. Qian, Y.; Li, C.; Qi, Y.; Zhong, J. 3D printing of graphene oxide composites with well controlled alignment. Carbon N. Y. 2021, 171, 777–784. [Google Scholar] [CrossRef]
  24. Zhang, D.; Chi, B.; Li, B.; Gao, Z.; Du, Y.; Guo, J.; Wei, J. Fabrication of highly conductive graphene flexible circuits by 3D printing. Synth. Met. 2016, 217, 79–86. [Google Scholar] [CrossRef]
  25. Foster, C.W.; Down, M.P.; Zhang, Y.; Ji, X.; Rowley-Neale, S.J.; Smith, G.C.; Kelly, P.J.; Banks, C.E. 3D Printed Graphene Based Energy Storage Devices. Sci. Rep. 2017, 7, 42233. [Google Scholar] [CrossRef]
  26. Wei, X.; Li, D.; Jiang, W.; Gu, Z.; Wang, X.; Zhang, Z.; Sun, Z. 3D Printable Graphene Composite. Sci. Rep. 2015, 5, 11181. [Google Scholar] [CrossRef] [Green Version]
  27. Tekinalp, H.L.; Kunc, V.; Velez-Garcia, G.M.; Duty, C.E.; Love, L.J.; Naskar, A.K.; Blue, C.A.; Ozcan, S. Highly oriented carbon fiber–polymer composites via additive manufacturing. Compos. Sci. Technol. 2014, 105, 144–150. [Google Scholar] [CrossRef] [Green Version]
  28. Huang, P.; Xia, Z.; Cui, S. 3D printing of carbon fiber-filled conductive silicon rubber. Mater. Des. 2018, 142, 11–21. [Google Scholar] [CrossRef]
  29. Gnanasekaran, K.; Heijmans, T.; van Bennekom, S.; Woldhuis, H.; Wijnia, S.; de With, G.; Friedrich, H. 3D printing of CNT- and graphene-based conductive polymer nanocomposites by fused deposition modeling. Appl. Mater. Today 2017, 9, 21–28. [Google Scholar] [CrossRef]
  30. Ivanov, E.; Kotsilkova, R.; Xia, H.; Chen, Y.; Donato, R.K.; Donato, K.; Godoy, A.P.; Di Maio, R.; Silvestre, C.; Cimmino, S.; et al. PLA/Graphene/MWCNT composites with improved electrical and thermal properties suitable for FDM 3D printing applications. Appl. Sci. 2019, 9, 1209. [Google Scholar] [CrossRef] [Green Version]
  31. Zhang, W.; Dehghani-Sanij, A.A.; Blackburn, R.S. Carbon based conductive polymer composites. J. Mater. Sci. 2007, 42, 3408–3418. [Google Scholar] [CrossRef]
  32. Celzard, A.; McRae, E.; Deleuze, C.; Dufort, M. Critical concentration in percolating systems containing a high-aspect-ratio filler. Phys. Rev. B 1996, 53, 6209. [Google Scholar] [CrossRef]
  33. Hu, N.; Masuda, Z.; Yan, C.; Yamamoto, G.; Fukunaga, H.; Hashida, T. The electrical properties of polymer nanocomposites with carbon nanotube fillers. Nanotechnology 2008, 19, 10. [Google Scholar] [CrossRef] [PubMed] [Green Version]
  34. Bauhofer, W.; Kovacs, J.Z. A review and analysis of electrical percolation in carbon nanotube polymer composites. Compos. Sci. Technol. 2009, 69, 1486–1498. [Google Scholar] [CrossRef]
  35. Khalid, H.R.; Jang, D.; Abbas, N.; Haider, M.S.; Bukhari, S.N.A.; Mirza, C.R.; Elboughdiri, N.; Ahmad, F. Electrical Stability and Piezoresistive Sensing Performance of High Strain-Range Ultra-Stretchable CNT-Embedded Sensors. Polymers 2022, 14, 1366. [Google Scholar] [CrossRef] [PubMed]
  36. Dawoud, M.; Taha, I.; Ebeid, S.J. Strain sensing behaviour of 3D printed carbon black filled ABS. J. Manuf. Process. 2018, 35, 337–342. [Google Scholar] [CrossRef]
  37. Dul, S.; Fambri, L.; Pegoretti, A. Filaments Production and Fused Deposition Modelling of ABS/Carbon Nanotubes Composites. Nanomaterials 2018, 8, 49. [Google Scholar] [CrossRef] [PubMed] [Green Version]
  38. Dul, S.; Pegoretti, A.; Fambri, L. Fused Filament Fabrication of Piezoresistive Carbon Nanotubes Nanocomposites for Strain Monitoring. Front. Mater. 2020, 7, 12. [Google Scholar] [CrossRef] [Green Version]
  39. Maurizi, M.; Slavič, J.; Cianetti, F.; Jerman, M.; Valentinčič, J.; Lebar, A.; Boltežar, M. Dynamic measurements using FDM 3D-printed embedded strain sensors. Sensors 2019, 19, 2661. [Google Scholar] [CrossRef] [Green Version]
  40. Nassar, H.; Ntagios, M.; Navaraj, W.T.; Dahiva, R. Multi-Material 3D Printed Bendable Smart Sensing Structures. In Proceedings of the IEEE Sensors, New Delhi, India, 28–31 October 2018. [Google Scholar] [CrossRef] [Green Version]
  41. Georgopoulou, A.; Vanderborght, B.; Clemens, F. Multi-material 3D Printing of Thermoplastic Elastomers for Development of Soft Robotic Structures with Integrated Sensor Elements. Ind. Addit. Manuf. 2021, 67–81. [Google Scholar] [CrossRef]
  42. Emon, M.O.F.; Alkadi, F.; Philip, D.G.; Kim, D.H.; Lee, K.C.; Choi, J.W. Multi-material 3D printing of a soft pressure sensor. Addit. Manuf. 2019, 28, 629–638. [Google Scholar] [CrossRef]
  43. Paleari, L.; Bragaglia, M.; Mariani, M.; Nanni, F. Acrylonitrile butadiene styrene—Carbon nanotubes nanocomposites for 3D printing of health monitoring components. J. Reinf. Plast. Compos. 2022, 07316844221141364. [Google Scholar] [CrossRef]
  44. Kim, M.; Jung, J.; Jung, S.; Moon, Y.H.; Kim, D.-H.; Kim, J.H. Piezoresistive Behaviour of Additively Manufactured Multi-Walled Carbon Nanotube/Thermoplastic Polyurethane Nanocomposites. Materials 2019, 12, 2613. [Google Scholar] [CrossRef] [PubMed] [Green Version]
  45. Ye, W.; Wu, W.; Hu, X.; Lin, G.; Guo, J.; Qu, H.; Zhao, J. 3D printing of carbon nanotubes reinforced thermoplastic polyimide composites with controllable mechanical and electrical performance. Compos. Sci. Technol. 2019, 182, 107671. [Google Scholar] [CrossRef]
  46. Andrew, J.J.; Alhashmi, H.; Schiffer, A.; Kumar, S.; Deshpande, V.S. Energy absorption and self-sensing performance of 3D printed CF/PEEK cellular composites. Mater. Des. 2021, 208, 109863. [Google Scholar] [CrossRef]
  47. ASTM D638-14; Standard Test Method for Tensile Properties of Plastics. ASTM International: West Conshohocken, PA, USA, 2014.
  48. Mohiuddin, M.; Hoa, S.V. Temperature dependent electrical conductivity of CNT–PEEK composites. Compos. Sci. Technol. 2011, 72, 21–27. [Google Scholar] [CrossRef]
  49. Kogut, P.M.; Straley, J.P. Distribution-induced non-universality of the percolation conductivity exponents. J. Phys. C Solid State Phys. 1979, 12, 2151. [Google Scholar] [CrossRef]
  50. Vionnet-Menot, S.; Grimaldi, C.; Maeder, T.; Strässler, S.; Ryser, P. Tunneling-percolation origin of nonuniversality: Theory and experiments. Phys. Rev. B—Condens. Matter Mater. Phys. 2005, 71, 064201. [Google Scholar] [CrossRef] [Green Version]
  51. Weber, M.; Kamal, M.R. Estimation of the volume resistivity of electrically conductive composites. Polym. Compos. 1997, 18, 711–725. [Google Scholar] [CrossRef]
  52. Logakis, E.; Pissis, P.; Pospiech, D.; Korwitz, A.; Krause, B.; Reuter, U.; Pötschke, P. Low electrical percolation threshold in poly(ethylene terephthalate)/multi-walled carbon nanotube nanocomposites. Eur. Polym. J. 2010, 46, 928–936. [Google Scholar] [CrossRef]
  53. Al-Saleh, M.H.; Sundararaj, U. A review of vapor grown carbon nanofiber/polymer conductive composites. Carbon N. Y. 2009, 47, 2–22. [Google Scholar] [CrossRef]
  54. Socher, R.; Krause, B.; Müller, M.T.; Boldt, R.; Pötschke, P. The influence of matrix viscosity on MWCNT dispersion and electrical properties in different thermoplastic nanocomposites. Polymer 2012, 53, 495–504. [Google Scholar] [CrossRef]
  55. Jyoti, J.; Basu, S.; Singh, B.P.; Dhakate, S.R. Superior mechanical and electrical properties of multiwall carbon nanotube reinforced acrylonitrile butadiene styrene high performance composites. Compos. Part B Eng. 2015, 83, 58–65. [Google Scholar] [CrossRef]
  56. Valentino, O.; Sarno, M.; Rainone, N.G.; Nobile, M.R.; Ciambelli, P.; Neitzert, H.C.; Simon, G.P. Influence of the polymer structure and nanotube concentration on the conductivity and rheological properties of polyethylene/CNT composites. Phys. E Low-Dimensional Syst. Nanostructures 2008, 40, 2440–2445. [Google Scholar] [CrossRef]
  57. Tjong, S.C.; Liang, G.D.; Bao, S.P. Electrical behavior of polypropylene/multiwalled carbon nanotube nanocomposites with low percolation threshold. Scr. Mater. 2007, 57, 461–464. [Google Scholar] [CrossRef]
  58. Huang, C.; Bai, H.; Xiu, H.; Zhang, Q.; Fu, Q. Matrix crystallization induced simultaneous enhancement of electrical conductivity and mechanical performance in poly(l-lactide)/multiwalled carbon nanotubes (PLLA/MWCNTs) nanocomposites. Compos. Sci. Technol. 2014, 102, 20–27. [Google Scholar] [CrossRef]
  59. Wang, J.; Kazemi, Y.; Wang, S.; Hamidinejad, M.; Mahmud, M.B.; Pötschke, P.; Park, C.B. Enhancing the electrical conductivity of PP/CNT nanocomposites through crystal-induced volume exclusion effect with a slow cooling rate. Compos. Part B Eng. 2020, 183, 107663. [Google Scholar] [CrossRef]
  60. Bragaglia, M.; Paleari, L.; Lamastra, F.R.; Puglia, D.; Fabbrocino, F.; Nanni, F. Graphene nanoplatelet, multiwall carbon nanotube, and hybrid multiwall carbon nanotube–graphene nanoplatelet epoxy nanocomposites as strain sensing coatings. J. Reinf. Plast. Compos. 2021, 40, 632–643. [Google Scholar] [CrossRef]
  61. Villmow, T.; Kretzschmar, B.; Pötschke, P. Influence of screw configuration, residence time, and specific mechanical energy in twin-screw extrusion of polycaprolactone/multi-walled carbon nanotube composites. Compos. Sci. Technol. 2010, 70, 2045–2055. [Google Scholar] [CrossRef] [Green Version]
  62. Wichmann, M.H.G.; Buschhorn, S.T.; Gehrmann, J.; Schulte, K. Piezoresistive response of epoxy composites with carbon nanoparticles under tensile load. Phys. Rev. B—Condens. Matter Mater. Phys. 2009, 80, 245437. [Google Scholar] [CrossRef]
  63. Li, B.; Zhong, W.H. Review on polymer/graphite nanoplatelet nanocomposites. J. Mater. Sci. 2011, 46, 5595–5614. [Google Scholar] [CrossRef]
  64. Amjadi, M.; Yoon, Y.J.; Park, I. Ultra-stretchable and skin-mountable strain sensors using carbon nanotubes-Ecoflex nanocomposites. Nanotechnology 2015, 26, 375501. [Google Scholar] [CrossRef] [PubMed] [Green Version]
  65. Luo, S.; Liu, T. Graphite nanoplatelet enabled embeddable fiber sensor for in situ curing monitoring and structural health monitoring of polymeric composites. ACS Appl. Mater. Interfaces 2014, 6, 9314–9320. [Google Scholar] [CrossRef] [PubMed]
  66. Paleari, L.; Bragaglia, M.; Fabbrocino, F.; Nanni, F. Structural Monitoring of Glass Fiber/Epoxy Laminates by Means of Carbon Nanotubes and Carbon Black Self-Monitoring Plies. Nanomaterials 2021, 11, 1543. [Google Scholar] [CrossRef] [PubMed]
  67. De la Vega, A.; Kinloch, I.A.; Young, R.J.; Bauhofer, W.; Schulte, K. Simultaneous global and local strain sensing in SWCNT-epoxy composites by Raman and impedance spectroscopy. Compos. Sci. Technol. 2011, 71, 160–166. [Google Scholar] [CrossRef]
  68. Nadiv, R.; Fernandes, R.M.F.; Ochbaum, G.; Dai, J.; Buzaglo, M.; Varenik, M.; Biton, R.; Furó, I.; Regev, O. Polymer nanocomposites: Insights on rheology, percolation and molecular mobility. Polymer 2018, 153, 52–60. [Google Scholar] [CrossRef]
  69. Venkataraman, N.; Rangarajan, S.; Matthewson, M.J.; Harper, B.; Safari, A.; Danforth, S.C.; Wu, G.; Langrana, N.; Guceri, S.; Yardimci, A. Feedstock material property--process relationships in fused deposition of ceramics (FDC). Rapid Prototyp. J. 2000, 6, 244–253. [Google Scholar] [CrossRef]
  70. Wu, W.; Geng, P.; Li, G.; Zhao, D.; Zhang, H.; Zhao, J. Influence of Layer Thickness and Raster Angle on the Mechanical Properties of 3D-Printed PEEK and a Comparative Mechanical Study between PEEK and ABS. Materials 2015, 8, 5834–5846. [Google Scholar] [CrossRef] [Green Version]
  71. Bellehumeur, C.; Li, L.; Sun, Q.; Gu, P. Modeling of bond formation between polymer filaments in the fused deposition modeling process. J. Manuf. Process. 2004, 6, 170–178. [Google Scholar] [CrossRef]
  72. Sun, Q.; Rizvi, G.M.; Bellehumeur, C.T.; Gu, P. Effect of processing conditions on the bonding quality of FDM polymer filaments. Rapid Prototyp. J. 2008, 14, 72–80. [Google Scholar] [CrossRef]
  73. Hohimer, C.J.; Petrossian, G.; Ameli, A.; Mo, C.; Pötschke, P. 3D printed conductive thermoplastic polyurethane/carbon nanotube composites for capacitive and piezoresistive sensing in soft pneumatic actuators. Addit. Manuf. 2020, 34, 101281. [Google Scholar] [CrossRef]
  74. Yang, C.; Tian, X.; Li, D.; Cao, Y.; Zhao, F.; Shi, C. Influence of thermal processing conditions in 3D printing on the crystallinity and mechanical properties of PEEK material. J. Mater. Process. Technol. 2017, 248, 1–7. [Google Scholar] [CrossRef]
  75. Cao, X.; Wei, X.; Li, G.; Hu, C.; Dai, K.; Guo, J.; Zheng, G.; Liu, C.; Shen, C.; Guo, Z. Strain sensing behaviors of epoxy nanocomposites with carbon nanotubes under cyclic deformation. Polymer 2017, 112, 1–9. [Google Scholar] [CrossRef]
  76. Zhang, R.; Deng, H.; Valenca, R.; Jin, J.; Fu, Q.; Bilotti, E.; Peijs, T. Strain sensing behaviour of elastomeric composite films containing carbon nanotubes under cyclic loading. Compos. Sci. Technol. 2013, 74, 1–5. [Google Scholar] [CrossRef]
  77. Bautista-Quijano, J.R.; Avilés, F.; Aguilar, J.O.; Tapia, A. Strain sensing capabilities of a piezoresistive MWCNT-polysulfone film. Sensors Actuators A Phys. 2010, 159, 135–140. [Google Scholar] [CrossRef]
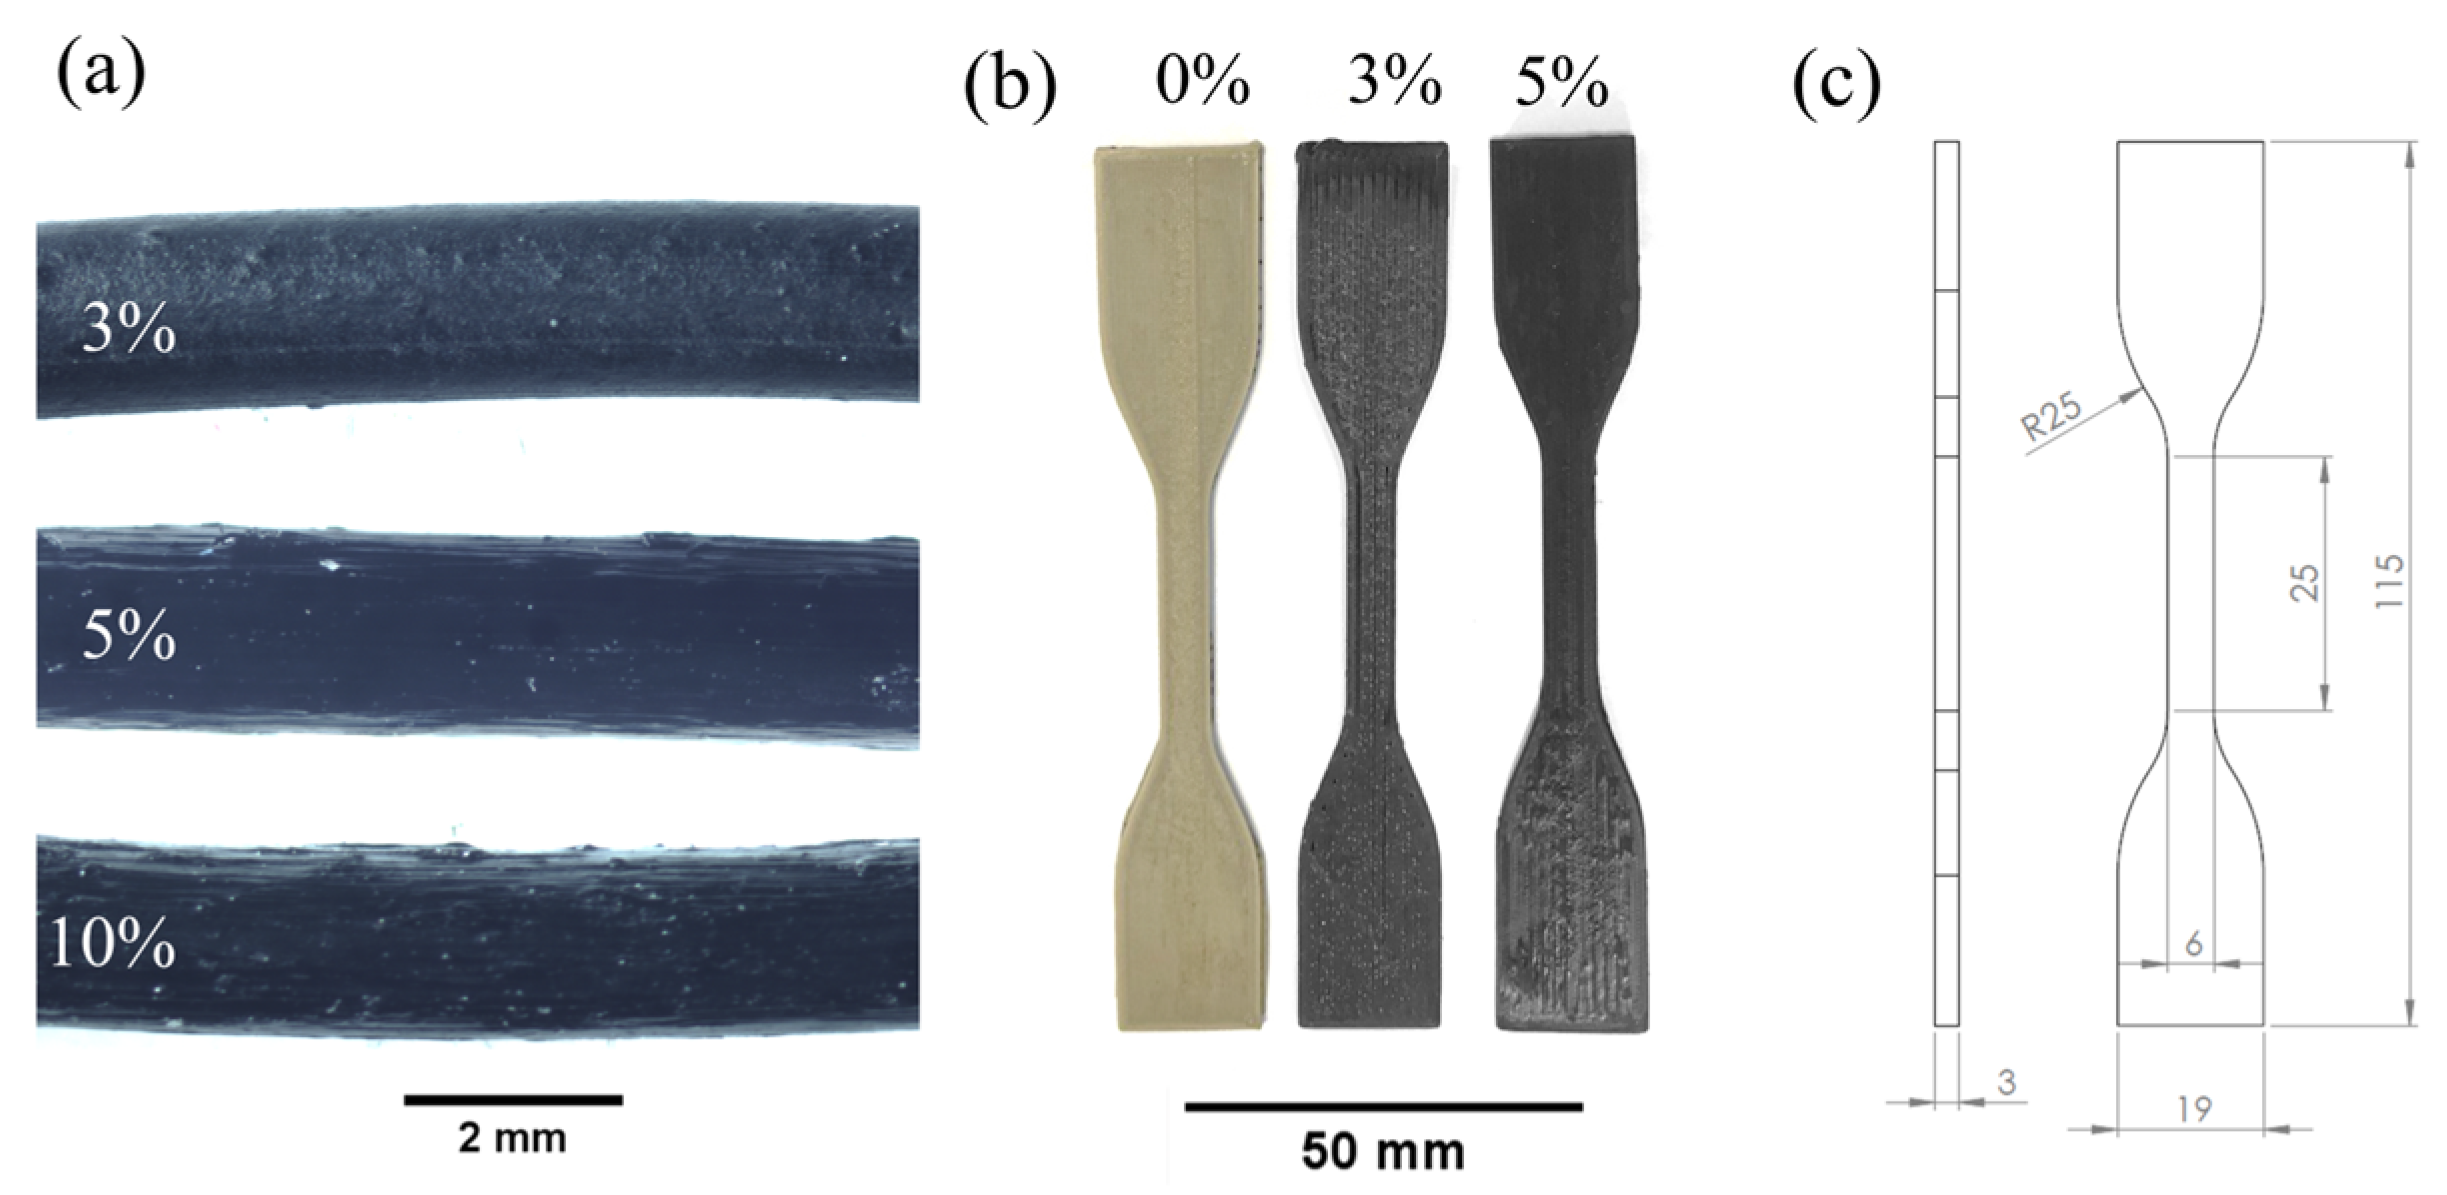
Figure 1. (a) Extruded filaments; (b) 3D-printed samples; (c) tensile specimen dimensions.
Polymers 15 00008 g001
Figure 2. (a) Volume resistivity as a function of CNT amount for all filaments; SEM micrographs on tensile tested (b) PEEK 3CNT, (c) PEEK 5CNT and (d) PEEK 10CNT filaments.
Polymers 15 00008 g002
Figure 3. Tensile stress (black line) and electrical resistance (blue line) curves as a function of strain for (a) PEEK 3CNT, (b) PEEK 5CNT, and (c) PEEK 10CNT filament samples and (d) comparison of the electrical resistance variation for the filament samples with computed gauge factors.
Polymers 15 00008 g003
Figure 4. Tensile stress (black line) and electrical resistance (blue line) curves as a function of strain for (a) PEEK 3CNT 3D-printed sample and (b) PEEK 5CNT 3D-printed sample; (c) comparison of the electrical resistance variation with computed gauge factors; (d) self-monitoring performances of PEEK 3CNT 3D-printed sample for cyclic loadings; inset: comparison between the maximum values reached in each cycle and the values obtained with monotonic testing.
Polymers 15 00008 g004
Figure 5. Schematic of the 3D-printed tensile specimens’ morphology and electrical conduction pathways.
Polymers 15 00008 g005
Figure 6. Optical microscopy on fracture surfaces of two different PEEK 3CNT 3D-printed samples ((a) sample 1, and (b,c) sample 2) showing line–line delamination (circle) and layer–layer delamination (cross).
Polymers 15 00008 g006
Table 1. Gauge factor for filaments and 3D-printed samples (with sample standard deviation).
Gauge Factor
Filaments3D-Printed Samples
PEEK Neatn.a.n.a.
PEEK 3CNT14.5 (±0.9)4.46 (±0.43)
PEEK 5CNT3.36 (±0.31)2.03 (±0.29)
PEEK 10CNT1.99 (±0.24)n.a.
n.a.—not available.
Disclaimer/Publisher’s Note: The statements, opinions and data contained in all publications are solely those of the individual author(s) and contributor(s) and not of MDPI and/or the editor(s). MDPI and/or the editor(s) disclaim responsibility for any injury to people or property resulting from any ideas, methods, instructions or products referred to in the content.