
Multi-Parameter Optimization of 3D Printing Condition for Enhanced Quality and Strength


Abstract
:
1. Introduction
Objective and Motivation
2. Materials and Methods
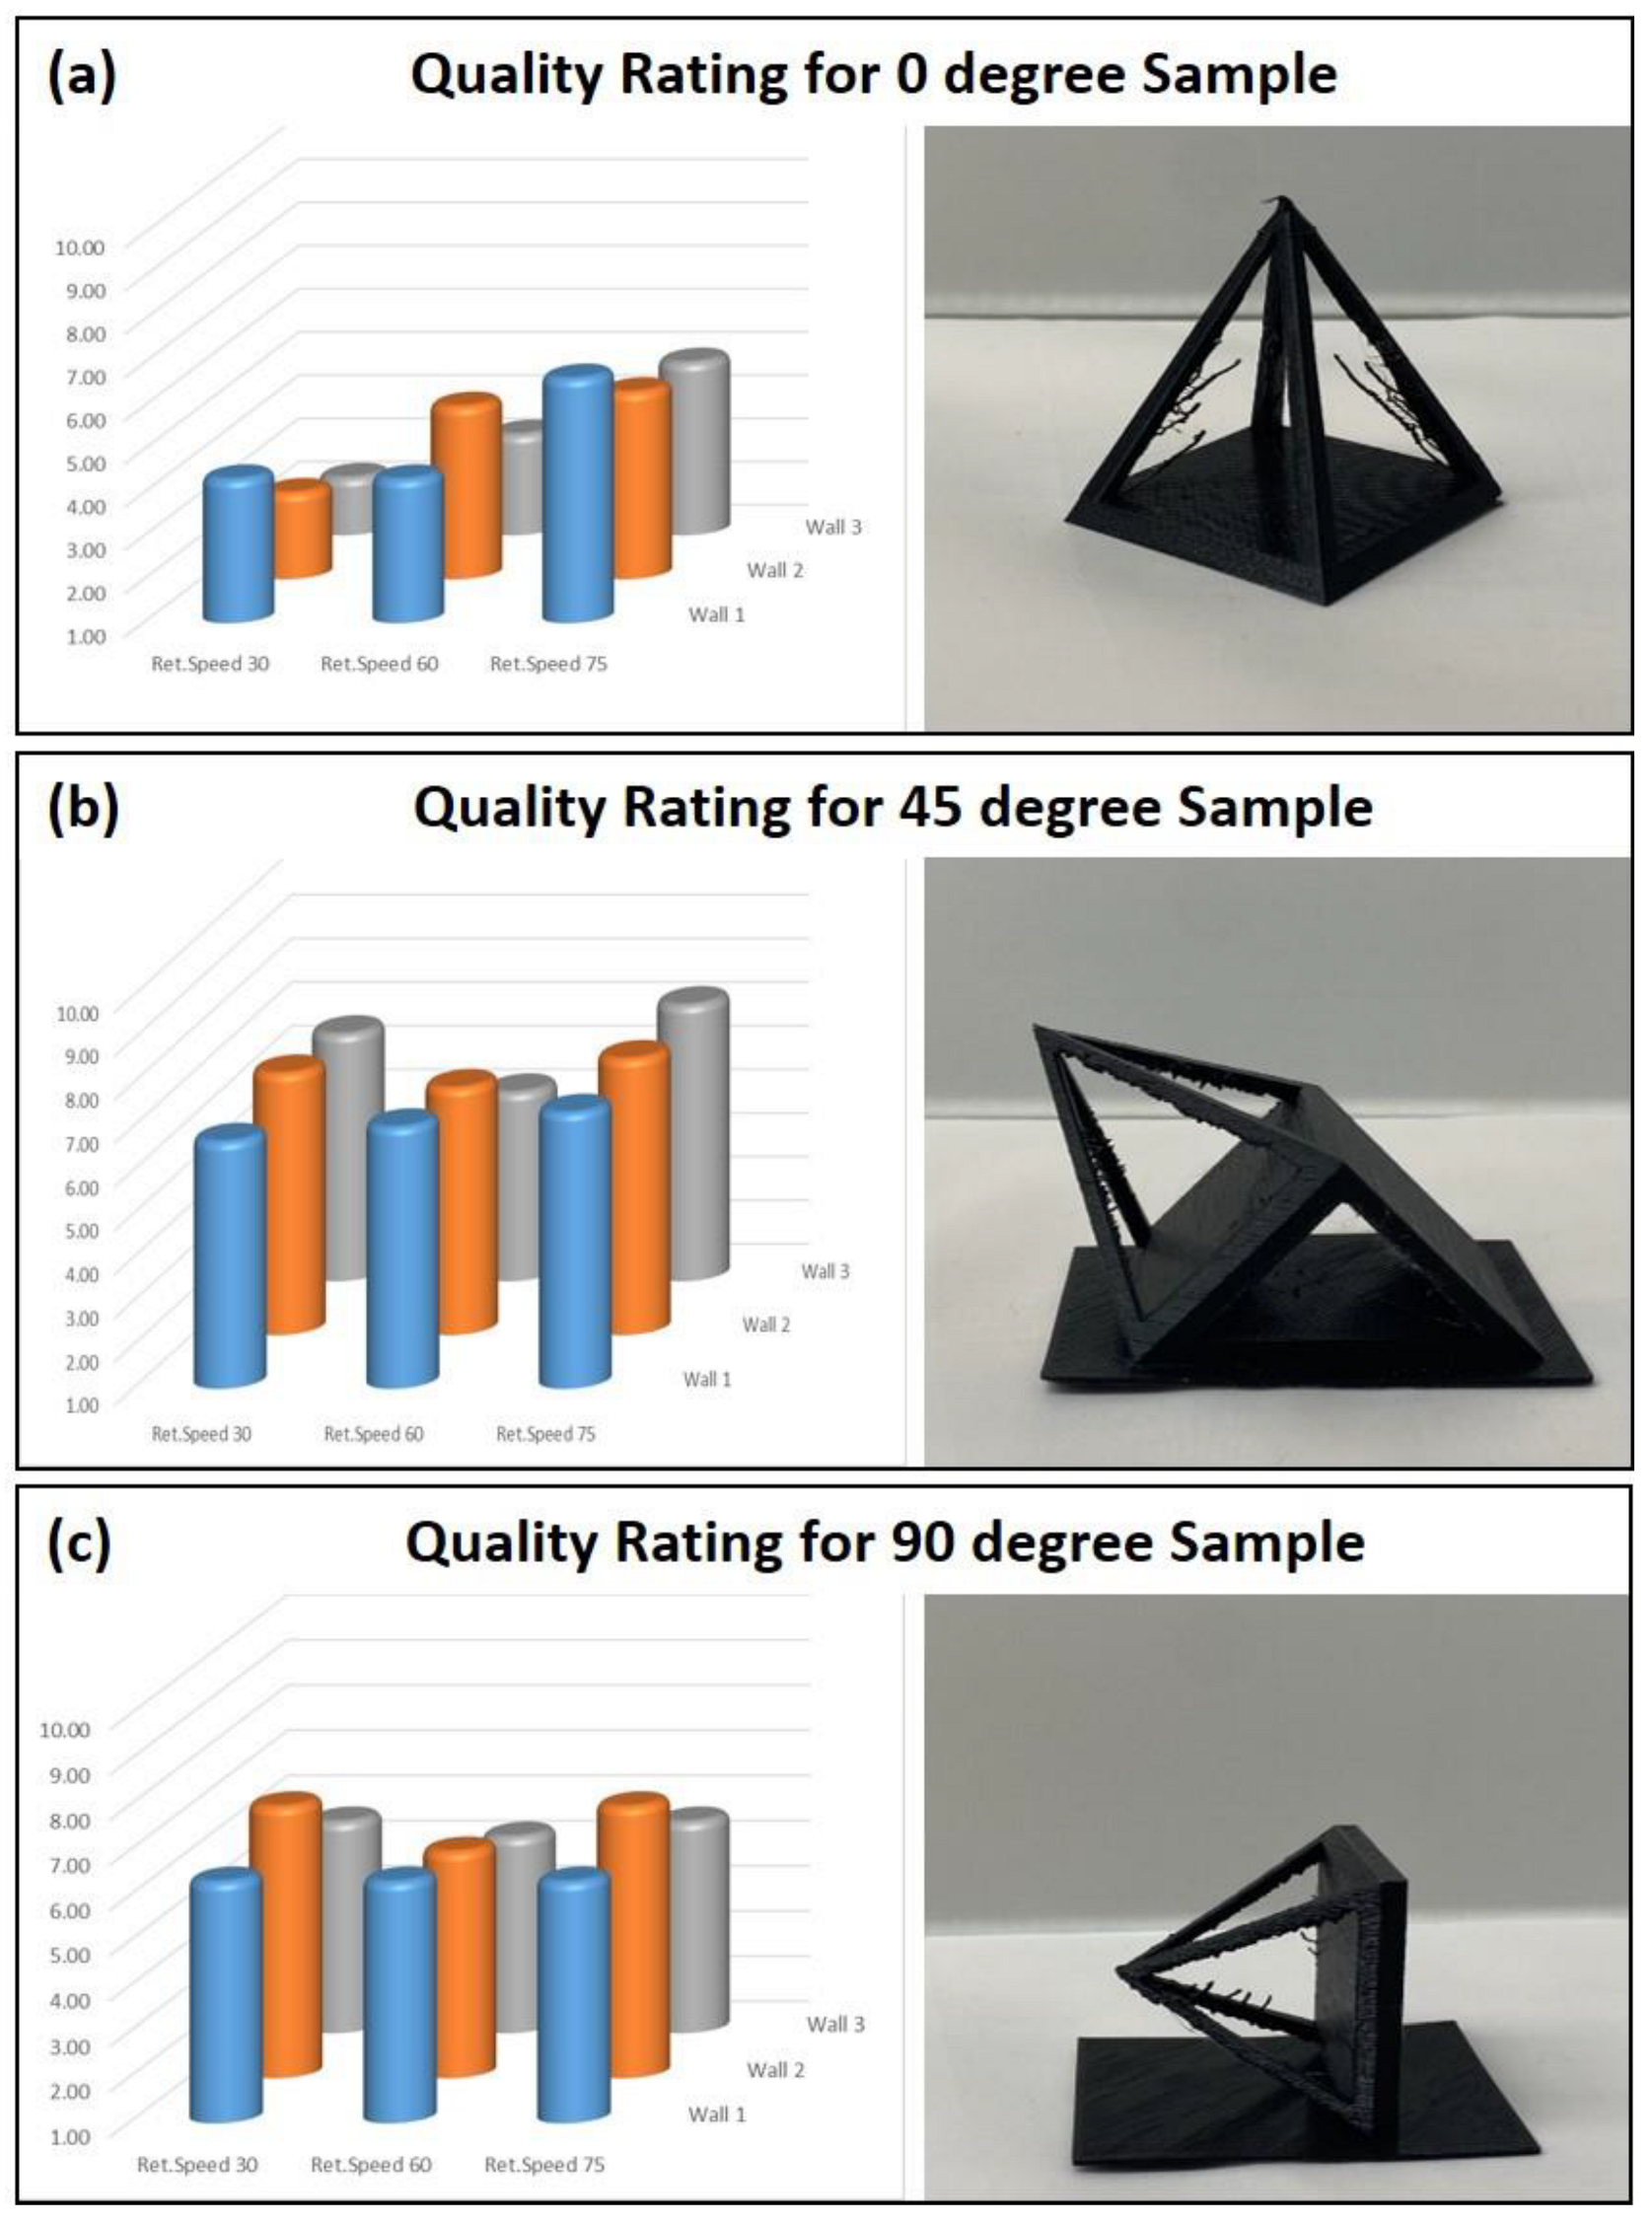
3. Results
4. Conclusions
Author Contributions
Funding
Institutional Review Board Statement
Informed Consent Statement
Data Availability Statement
Conflicts of Interest
References
- Woodford, C. How do 3D Printers Work? Explain That Stuff. Available online: https://www.explainthatstuff.com/how-3d-printers-work.html (accessed on 9 February 2022).
- What Is Additive Manufacturing? Available online: https://www.ge.com/additive/additive-manufacturing (accessed on 9 February 2022).
- Sukindar, N.A.; Mohd Ariffin, M.K.A.; Baharudin, B.T.; Jaafar, C.N.A.; Shah Ismail, M.I. Optimization of the Parameters for Surface Quality of the Open-source 3D Printing. J. Mech. Eng. 2017, SI3, 33–43. [Google Scholar]
- Hu, Q.; Feng, D.; Zhang, H.; Yao, Y.; Aburaia, M.; Lammer, H. Oriented to multi-branched structure unsupported 3D printing method research. Materials 2020, 13, 2023. [Google Scholar] [CrossRef] [PubMed]
- Ko, M.; Kang, H.; Kim, J.u.; Lee, Y.; Hwang, J.-E. How to Measure Quality of Affordable 3D Printing: Cultivating Quantitative Index in the User Community. In Proceedings of the International Conference on Human-Computer Interaction, Paris, France, 14–16 September 2016. [Google Scholar] [CrossRef]
- Stringing or Oozing. Available online: https://www.simplify3d.com/support/print-quality-troubleshooting/stringing-or-oozing/ (accessed on 8 February 2022).
- Alsoufi, M.S.; Elsayed, A.E. Surface roughness quality and dimensional accuracy—A comprehensive analysis of 100% infill printed parts fabricated by a personal/Desktop cost-effective FDM 3D printer. Mater. Sci. Appl. 2018, 9, 11–40. [Google Scholar] [CrossRef] [Green Version]
- Poudel, L.; Sha, Z.; Zhou, W. Mechanical strength of chunk-based printed parts for cooperative 3D printing. Proced. Manuf. 2018, 26, 962–972. [Google Scholar] [CrossRef]
- Johnson, G.; French, J. Evaluation of Infill Effect on Mechanical Properties of Consumer3D. Available online: https://search.proquest.com/openview/243ff86fe1cc3fc67ab855d6fa236e92/1.pdf?pq-origsite=gscholar&cbl=4365212 (accessed on 8 February 2022).
- Johnson, G.A.; French, J.J. Evaluation of Infill Effect on Mechanical Properties of Consumer 3D Printing Materials. Adv. Technol. Innov. 2018, 3, 179–184. [Google Scholar]
- Tontowi, A.E.; Ramdani, L.; Erdizon, R.V.; Baroroh, D.K. Optimization of 3D-Printer process parameters for improving quality of Polylactic acid printed part. Int. J. Eng. Technol. 2017, 9, 589–600. [Google Scholar] [CrossRef] [Green Version]
- Arnold, C.; Monsees, D.; Hey, J.; Schweyen, R. Surface quality of 3D-Printed models as a function of various printing parameters. Materials 2019, 12, 1970. [Google Scholar] [CrossRef] [PubMed] [Green Version]
- Wang, P.; Zou, B.; Xiao, H.; Ding, S.; Huang, C. Effects of printing parameters of fused deposition modeling on mechanical properties, surface quality, and microstructure of PEEK. J. Mater. Process. Technol. 2019, 271, 62–74. [Google Scholar] [CrossRef]
- 3D Printerly. Speed vs. Quality: Do Lower Speeds Make Prints Better? Available online: https://3dprinterly.com/speed-vs-quality-do-lower-speeds-make-prints-better/ (accessed on 8 February 2022).
- Lunt, J. Large-scale production, properties and commercial app. Polym. Degrad. Stab. 1998, 3910, 145–152. [Google Scholar] [CrossRef]
- Auras, R.A.; Lim, L.T.; Selke, S.E.; Tsuji, H. Poly (Lactic Acid): Synthesis, Structures, Properties, Processing, and Applications, 1st ed.; John Wiley & Sons: Hoboken, NJ, USA, 2011; pp. 293–307. ISBN 978-0-470-29366-9. [Google Scholar]
- Rydz, J.; Sikorska, W.; Kyulavska, M.; Christova, D. Polyester-based (bio)degradable polymers as environmentally friendly materials for sustainable development. Int. J. Mol. Sci. 2015, 16, 564–596. [Google Scholar] [CrossRef] [PubMed] [Green Version]
- Drumright, R.E.; Gruber, P.R.; Henton, D.E. Polylactic acid technology. Adv. Mat. 2000, 12, 1841–1846. [Google Scholar] [CrossRef]
- Garlotta, D. A Literature Review of Poly (Lactic Acid). J. Polym. Environ. 2002, 9, 63–64. [Google Scholar] [CrossRef]
- Beltrán, F.R.; Arrieta, M.P.; Moreno, E.; Gaspar, G.; Muneta, L.M.; Carrasco-Gallego, R.; Yáñez, S.; Hidalgo-Carvajal, D.; de la Orden, M.U.; Martínez Urreaga, J. Evaluation of the Technical Viability of Distributed Mechanical Recycling of PLA 3D Printing Wastes. Polymers 2021, 13, 1247. [Google Scholar] [CrossRef] [PubMed]
- Shuai, C.; Yang, W.; Feng, P.; Peng, S.; Pan, H. Accelerated degradation of HAP/PLLA bone scaffold by PGA blending facilitates bioactivity and osteoconductivity. Bioact. Mater. 2021, 6, 490–502. [Google Scholar] [CrossRef] [PubMed]
- Ćwikła, G.; Grabowik, C.; Kalinowski, K.; Paprocka, I.; Ociepka, P. The influence of printing parameters on selected mechanical properties of FDM/FFF 3D-printed parts. In Proceedings of the IOP Conference Series: Materials Science and Engineering, Busan, Korea, 25–27 August 2017; Volume 227, p. 012033. [Google Scholar]
- Buj-Corral, I.; Domínguez-Fernández, A.; Durán-Llucià, R. Influence of print orientation on surface roughness in fused deposition modeling (FDM) processes. Materials 2019, 12, 3834. [Google Scholar] [CrossRef] [PubMed] [Green Version]
- Vanaei, H.R.; Khelladi, S.; Deligant, M.; Shirinbayan, M.; Tcharkhtchi, A. Numerical Prediction for Temperature Profile of Parts Manufactured using Fused Filament Fabrication. J. Manuf. Process. 2022, 76, 548–558. [Google Scholar] [CrossRef]
- Mousavi Nejad, Z.; Zamanian, A.; Saeidifar, M.; Vanaei, H.R.; Salar Amoli, M. 3D Bioprinting of Polycaprolactone-Based Scaffolds for Pulp-Dentin Regeneration: Investigation of Physicochemical and Biological Behavior. Polymers 2021, 13, 4442. [Google Scholar] [CrossRef] [PubMed]
- Wang, W.M.; Zanni, C.; Kobbelt, L. Improved surface quality in 3D printing by optimizing the printing direction. Comput. Graph. Forum 2016, 35, 59–70. [Google Scholar] [CrossRef]


| Print Setting | Constant Print Settings |
|---|---|
| Bed Temperature | 60 °C |
| Layer Height | 0.1 mm |
| Extruder Temperature | 215 °C |
| Shape | Rectangular |
| Infill | 100% |
| Infill Speed | 70 mm/s |
| Fill Angle | 45° |
| Filament Type | PLA |
| Angle 0° | Angle 45° | Angle 90° | ||||||
|---|---|---|---|---|---|---|---|---|
| Sample | Retraction Speed (mm/s) | Walls | Sample | Retraction Speed (mm/s) | Walls | Sample | Retraction Speed (mm/s) | Walls |
| Sample 1 | 30 | 1 | Sample 10 | 30 | 1 | Sample 19 | 30 | 1 |
| Sample 2 | 30 | 2 | Sample 11 | 30 | 2 | Sample 20 | 30 | 2 |
| Sample 3 | 30 | 3 | Sample 12 | 30 | 3 | Sample 21 | 30 | 3 |
| Sample 4 | 60 | 1 | Sample 13 | 60 | 1 | Sample 22 | 60 | 1 |
| Sample 5 | 60 | 2 | Sample 14 | 60 | 2 | Sample 23 | 60 | 2 |
| Sample 6 | 60 | 3 | Sample 15 | 60 | 3 | Sample 24 | 60 | 3 |
| Sample 7 | 75 | 1 | Sample 16 | 75 | 1 | Sample 25 | 75 | 1 |
| Sample 8 | 75 | 2 | Sample 17 | 75 | 2 | Sample 26 | 75 | 2 |
| Sample 9 | 75 | 3 | Sample 18 | 75 | 3 | Sample 27 | 75 | 3 |
| Angle 90° | Angle 0° | ||||
|---|---|---|---|---|---|
| Samples # | Retraction Speed (mm/s) | Walls | Samples # | Retraction Speed (mm/s) | Walls |
| 1 | 30 | 1 | 10 | 30 | 1 |
| 2 | 30 | 2 | 11 | 30 | 2 |
| 3 | 30 | 3 | 12 | 30 | 3 |
| 4 | 60 | 1 | 13 | 60 | 1 |
| 5 | 60 | 2 | 14 | 60 | 2 |
| 6 | 60 | 3 | 15 | 60 | 3 |
| 7 | 75 | 1 | 16 | 75 | 1 |
| 8 | 75 | 2 | 17 | 75 | 2 |
| 9 | 75 | 3 | 18 | 75 | 3 |
| Surface Quality Rating Index | Examples | |
|---|---|---|
| 5 | No imperfection and no visible positive or negative (dips, ripples, or bums) spacing and markings on part that are not intentional to parts design to touch surface will feel like a smooth finish. |  |
| 4 | Very little imperfection like small bumps. Very little visible positive or negative spacing (dips, ripple, or bumps) spacing or marks that are not intentional to parts design. Surface will feel very close to a smooth finish. |  |
| 3 | Small to moderate bumps. Slight markings that look off but don’t obscure the form of the overall structure greatly. Moderate visible positive or negative spacing (dips, ripples, or bumps). Surface will closely resemble intentional design but not perfectly. To touch surface may feel slight gritty but closely to smooth. |  |
| 2 | Slightly moderate bumps. Slight markings that look off and positive or negative spacing (dips, ripples, or bumps). Surface will have distorted slightly warped look. Surface may be slightly gritty like a finer sand paper. Visible markings that aren’t intentionally placed. |  |
| 1 | Very visible positive or negative spacing (dips, rippled, or bumps). Surface may feel warped not resembling intentional design. Larger marking that aren’t intentional. Surface may feel very gritty almost like rough sand paper. |  |
| Unsupported Printing Quality Rating Index | Examples | |
|---|---|---|
| 5 | No stringing visible around structure. |  |
| 4 | Light stringing covering structure. Small in places does not stretch far. Little build up. Up to 3 small string branches. |  |
| 3 | Medium stringing abundantly showing. Structure looks noticeably different from design. Stretches out. Some build up in certain spots. 4–7 small string branches. |  |
| 2 | Abundant stringing reaching across places like webbing. Build up warps structure shape. 7–12 long stretched out stringing branches. |  |
| 1 | Structure is covered mainly in web like stringing all over. Build up makes structure not look like intended design. 12+ long stringing branches. |  |
Publisher’s Note: MDPI stays neutral with regard to jurisdictional claims in published maps and institutional affiliations. |
© 2022 by the authors. Licensee MDPI, Basel, Switzerland. This article is an open access article distributed under the terms and conditions of the Creative Commons Attribution (CC BY) license (https://creativecommons.org/licenses/by/4.0/).
Share and Cite
Jackson, B.; Fouladi, K.; Eslami, B. Multi-Parameter Optimization of 3D Printing Condition for Enhanced Quality and Strength. Polymers 2022, 14, 1586. https://doi.org/10.3390/polym14081586
Jackson B, Fouladi K, Eslami B. Multi-Parameter Optimization of 3D Printing Condition for Enhanced Quality and Strength. Polymers. 2022; 14(8):1586. https://doi.org/10.3390/polym14081586
Chicago/Turabian StyleJackson, Brandon, Kamran Fouladi, and Babak Eslami. 2022. "Multi-Parameter Optimization of 3D Printing Condition for Enhanced Quality and Strength" Polymers 14, no. 8: 1586. https://doi.org/10.3390/polym14081586
APA StyleJackson, B., Fouladi, K., & Eslami, B. (2022). Multi-Parameter Optimization of 3D Printing Condition for Enhanced Quality and Strength. Polymers, 14(8), 1586. https://doi.org/10.3390/polym14081586