
Naproxen-Loaded Poly(2-hydroxyalkyl methacrylates): Preparation and Drug Release Dynamics


 ,
,  and
and
Abstract
1. Introduction
2. Materials and Methods
2.1. Chemicals
2.2. Naproxen Extraction
2.3. Preparation of NPX/pHEMA and NPX/pHPMA
2.4. Characterization
2.5. Cell Culture and Proliferation Assessment
2.6. Swelling Properties
2.7. Density Measurements
2.8. In Vitro Release Dynamic of NPX
3. Results and Discussions
3.1. Characterization
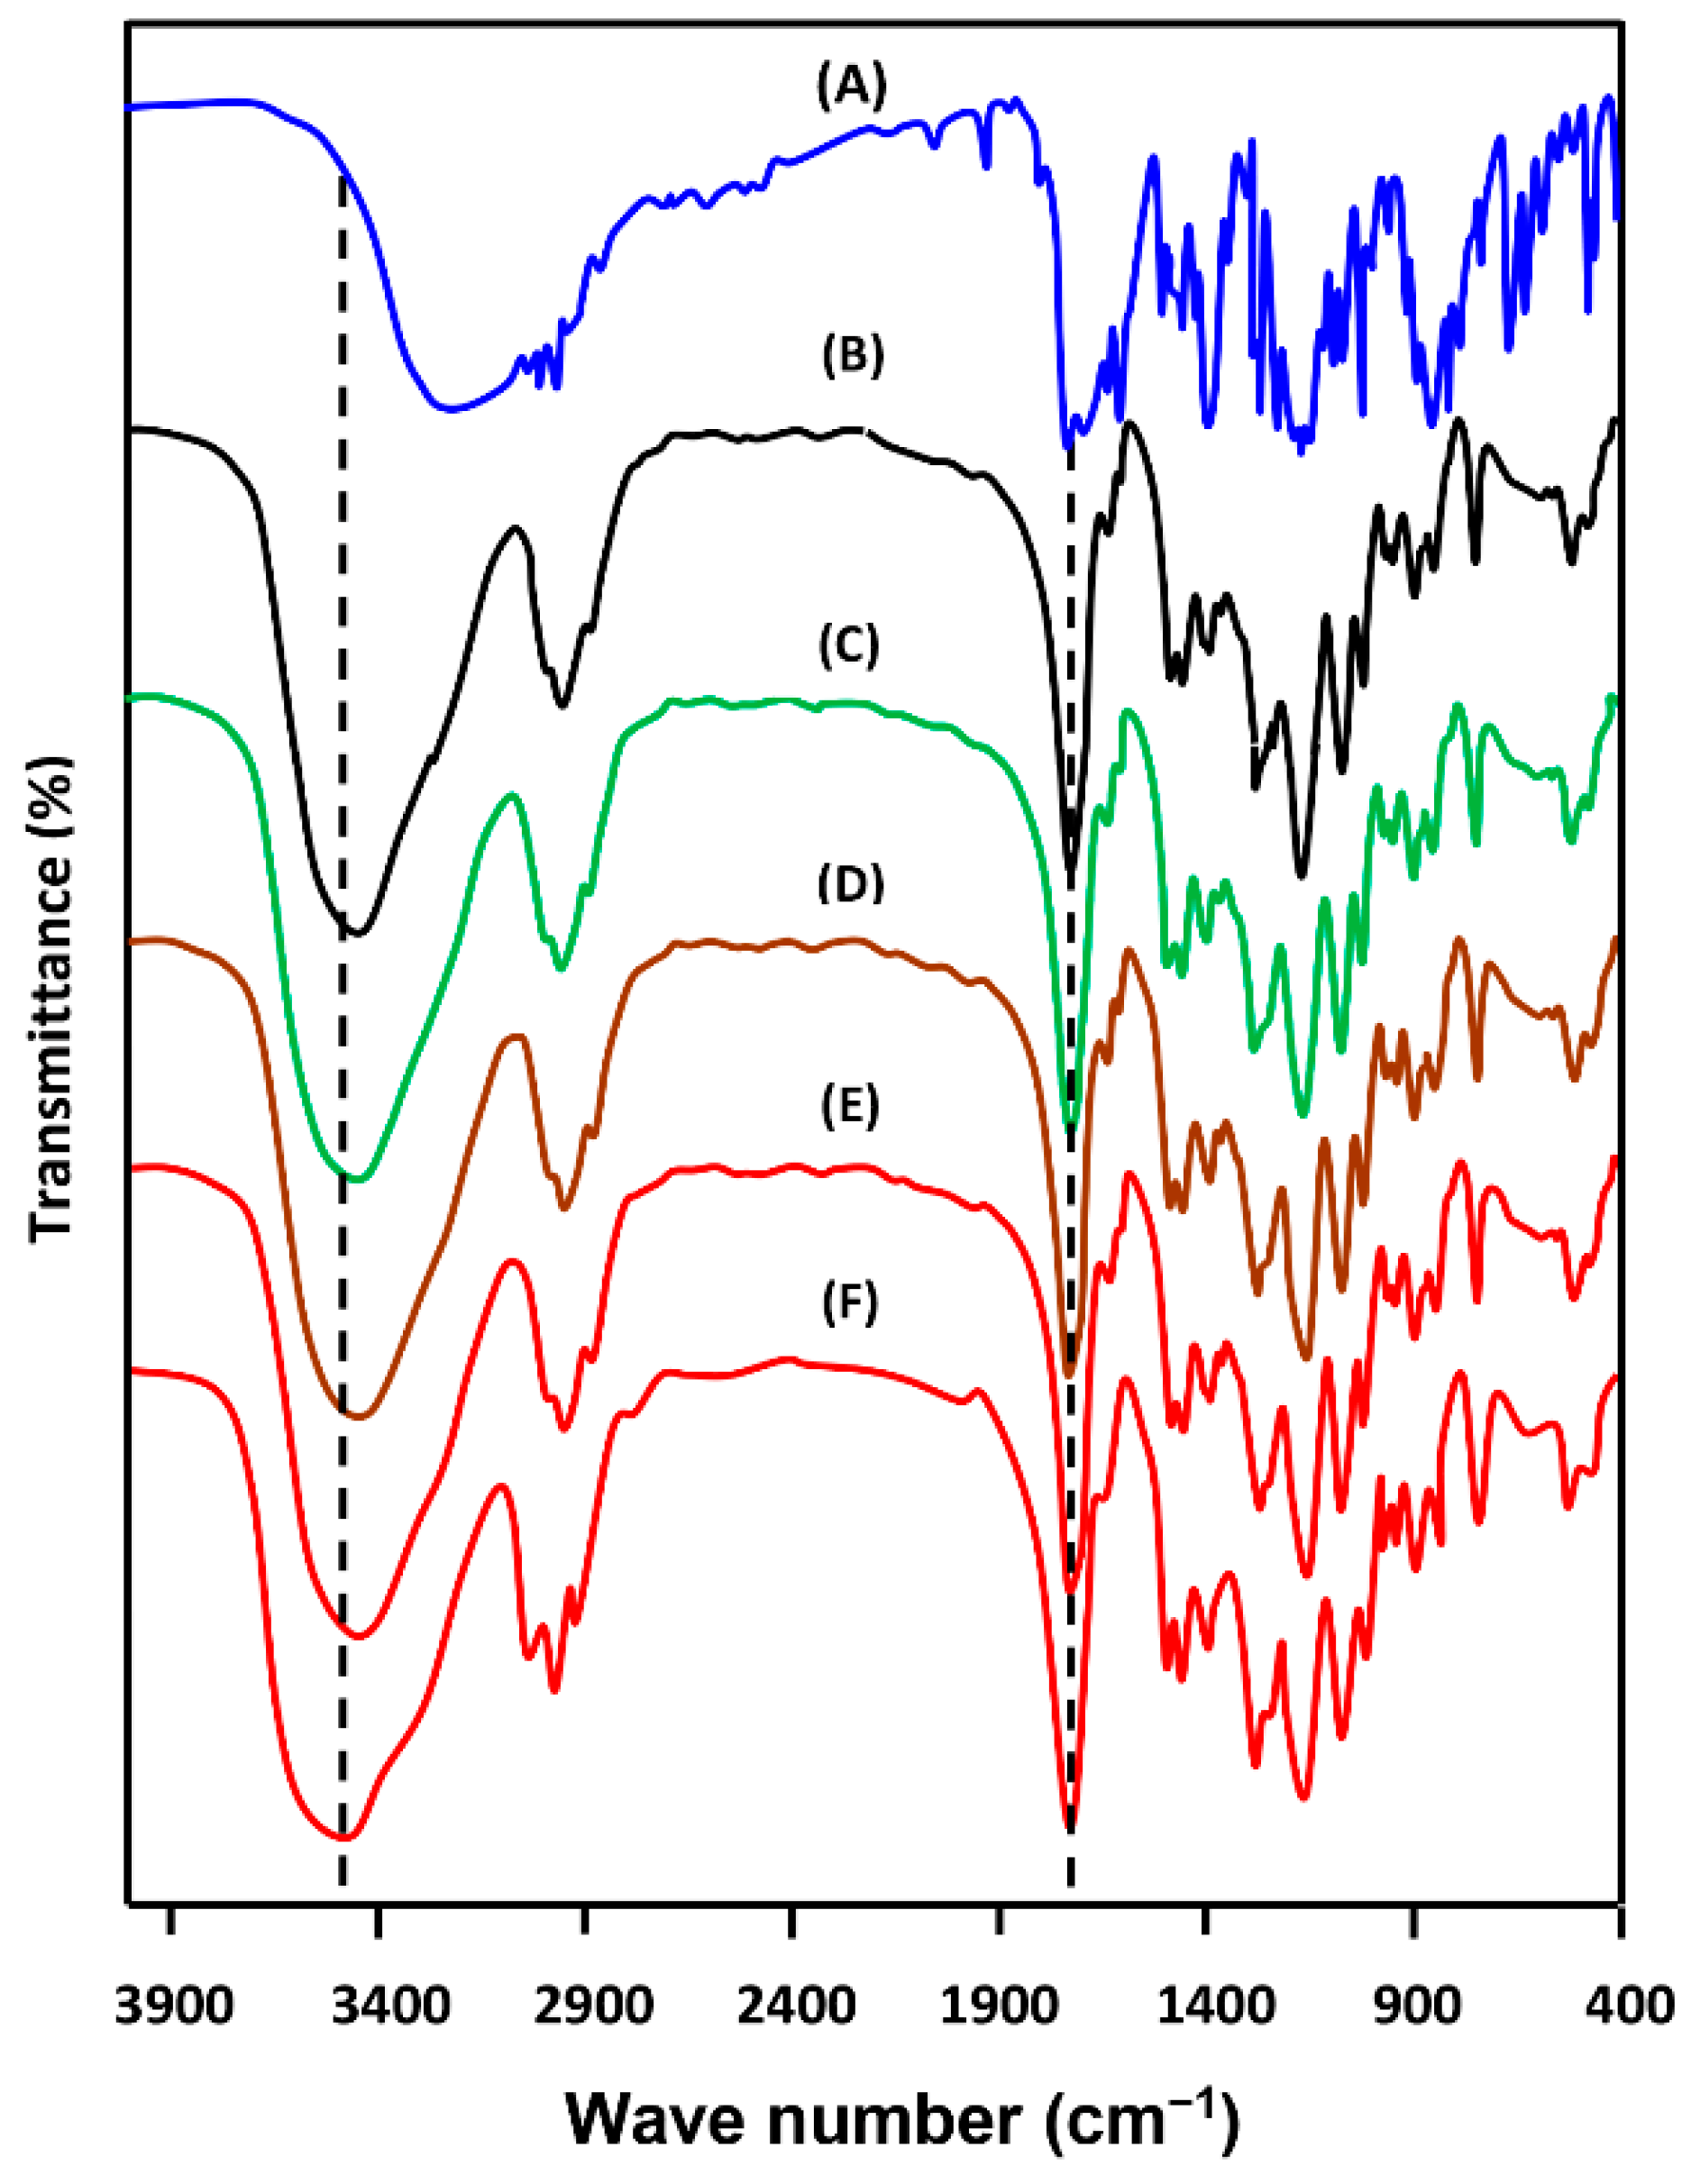
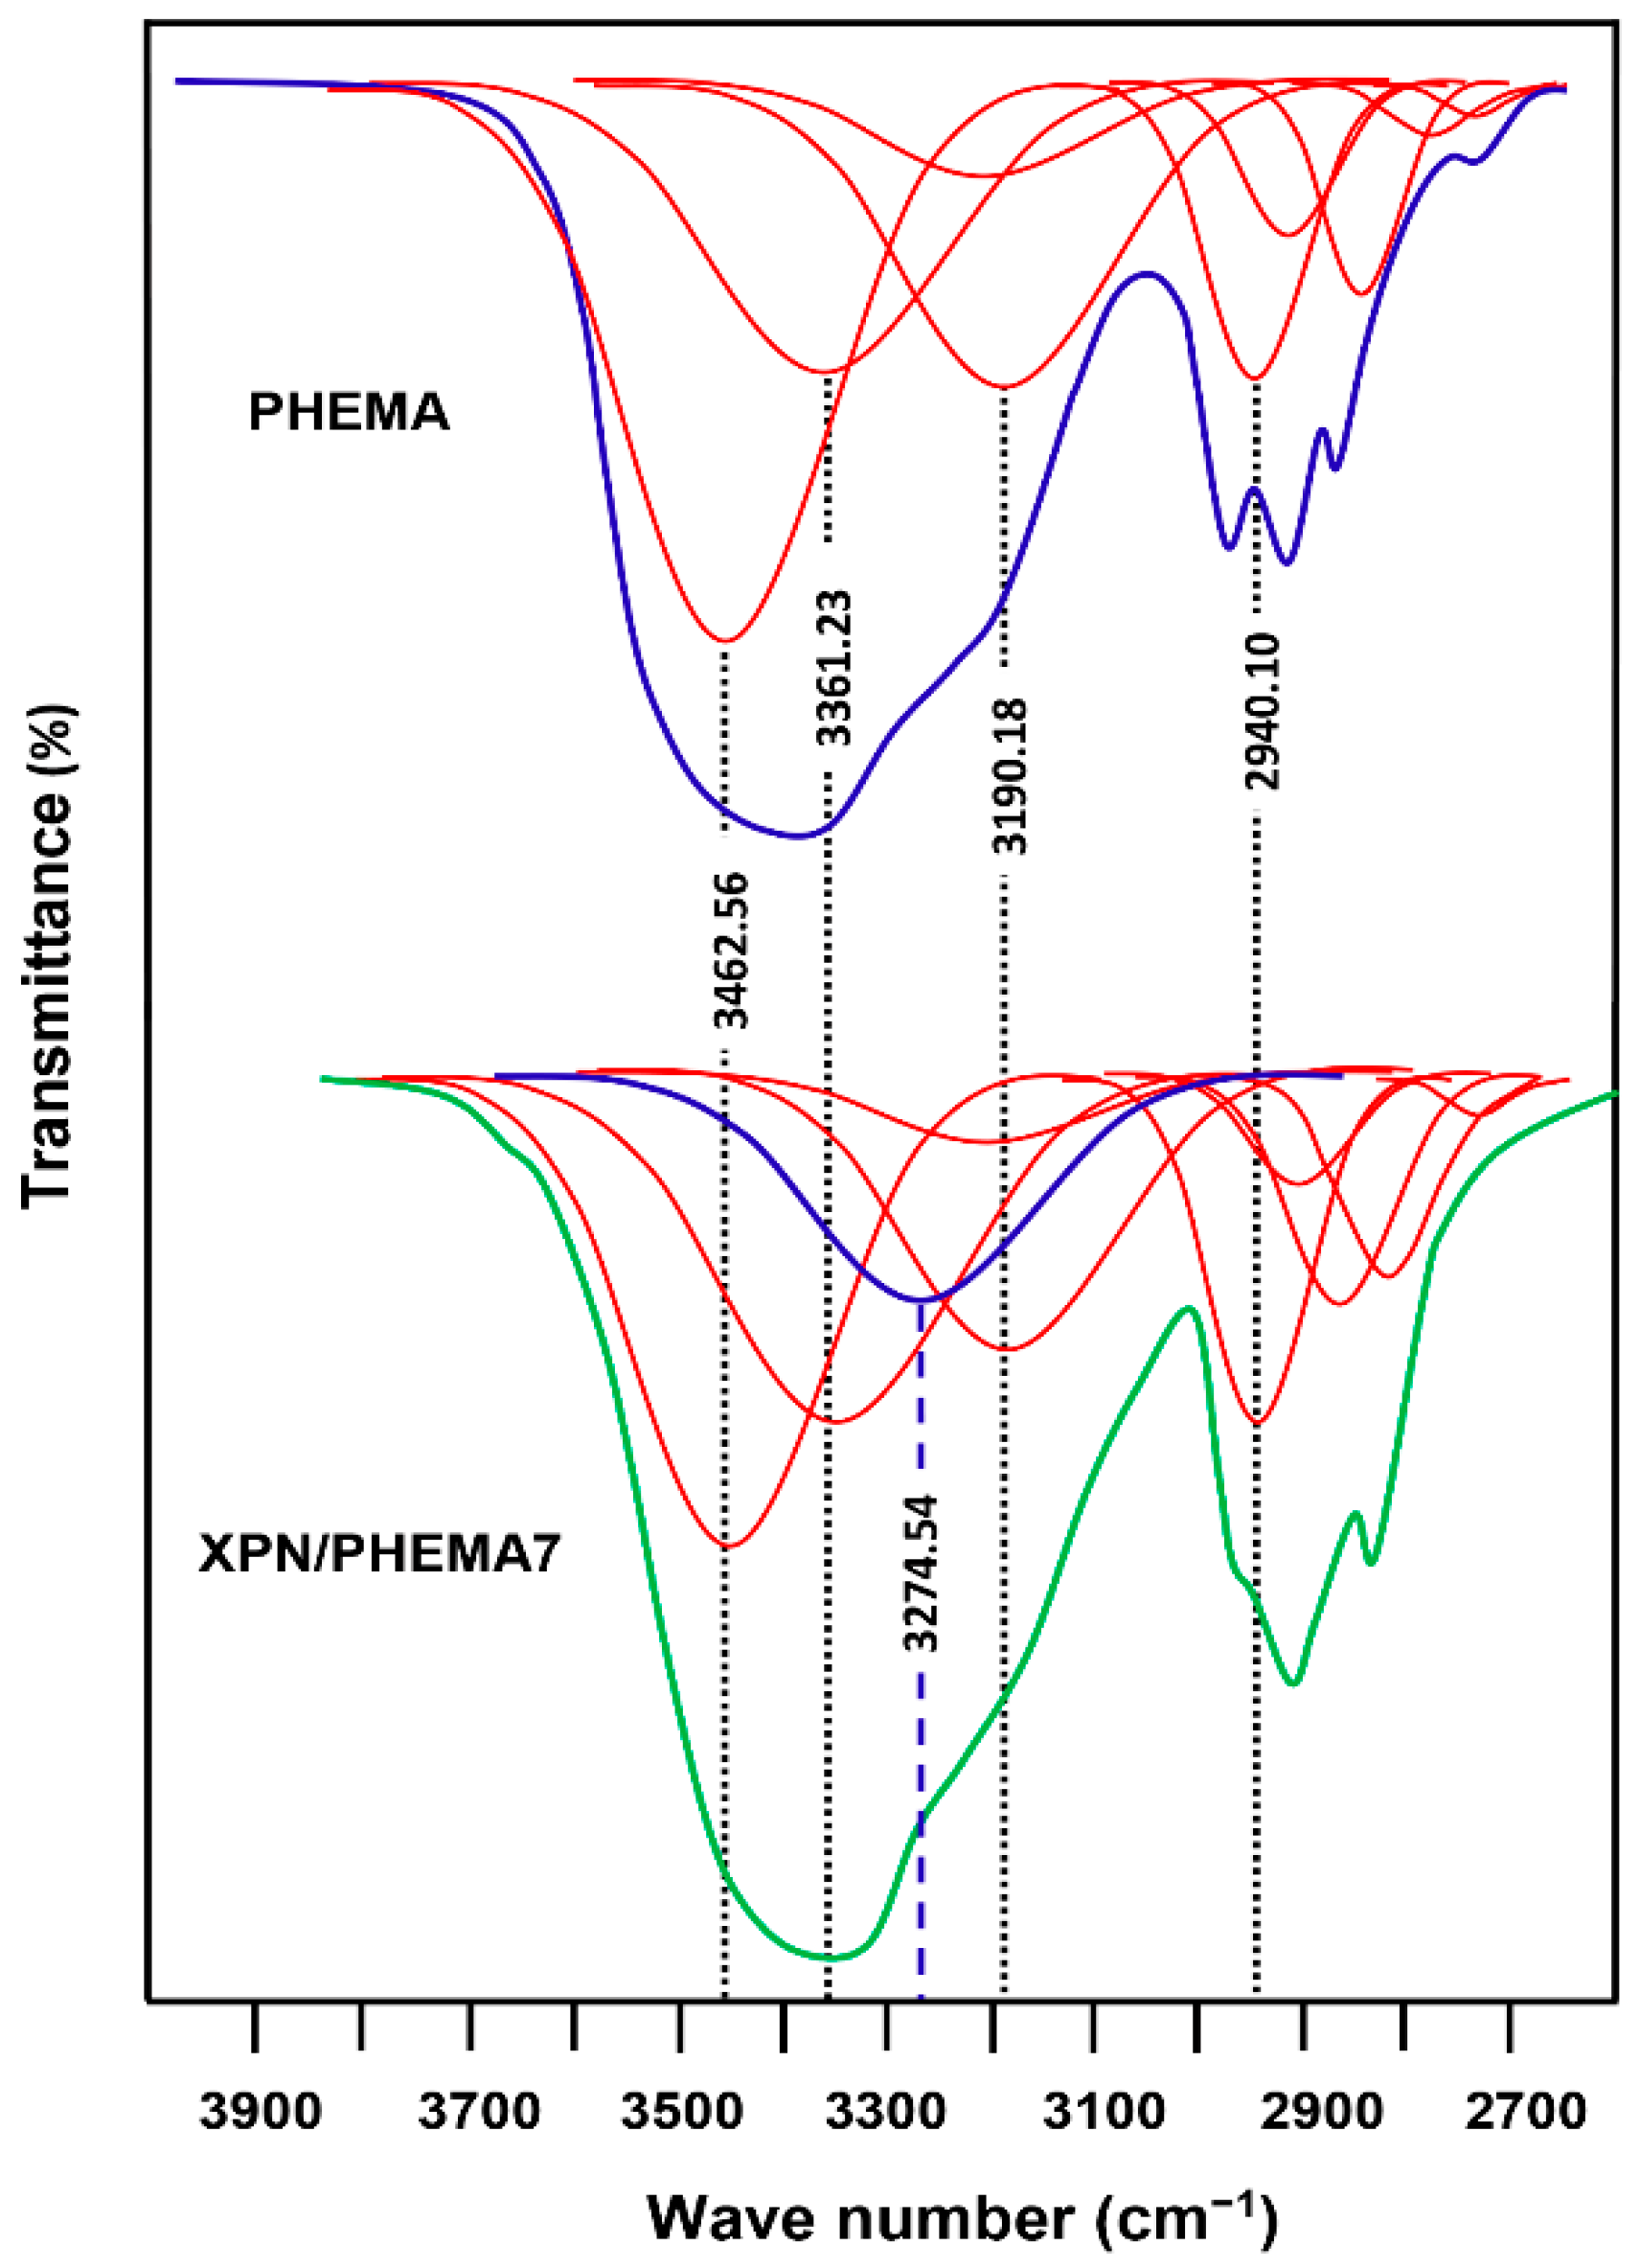
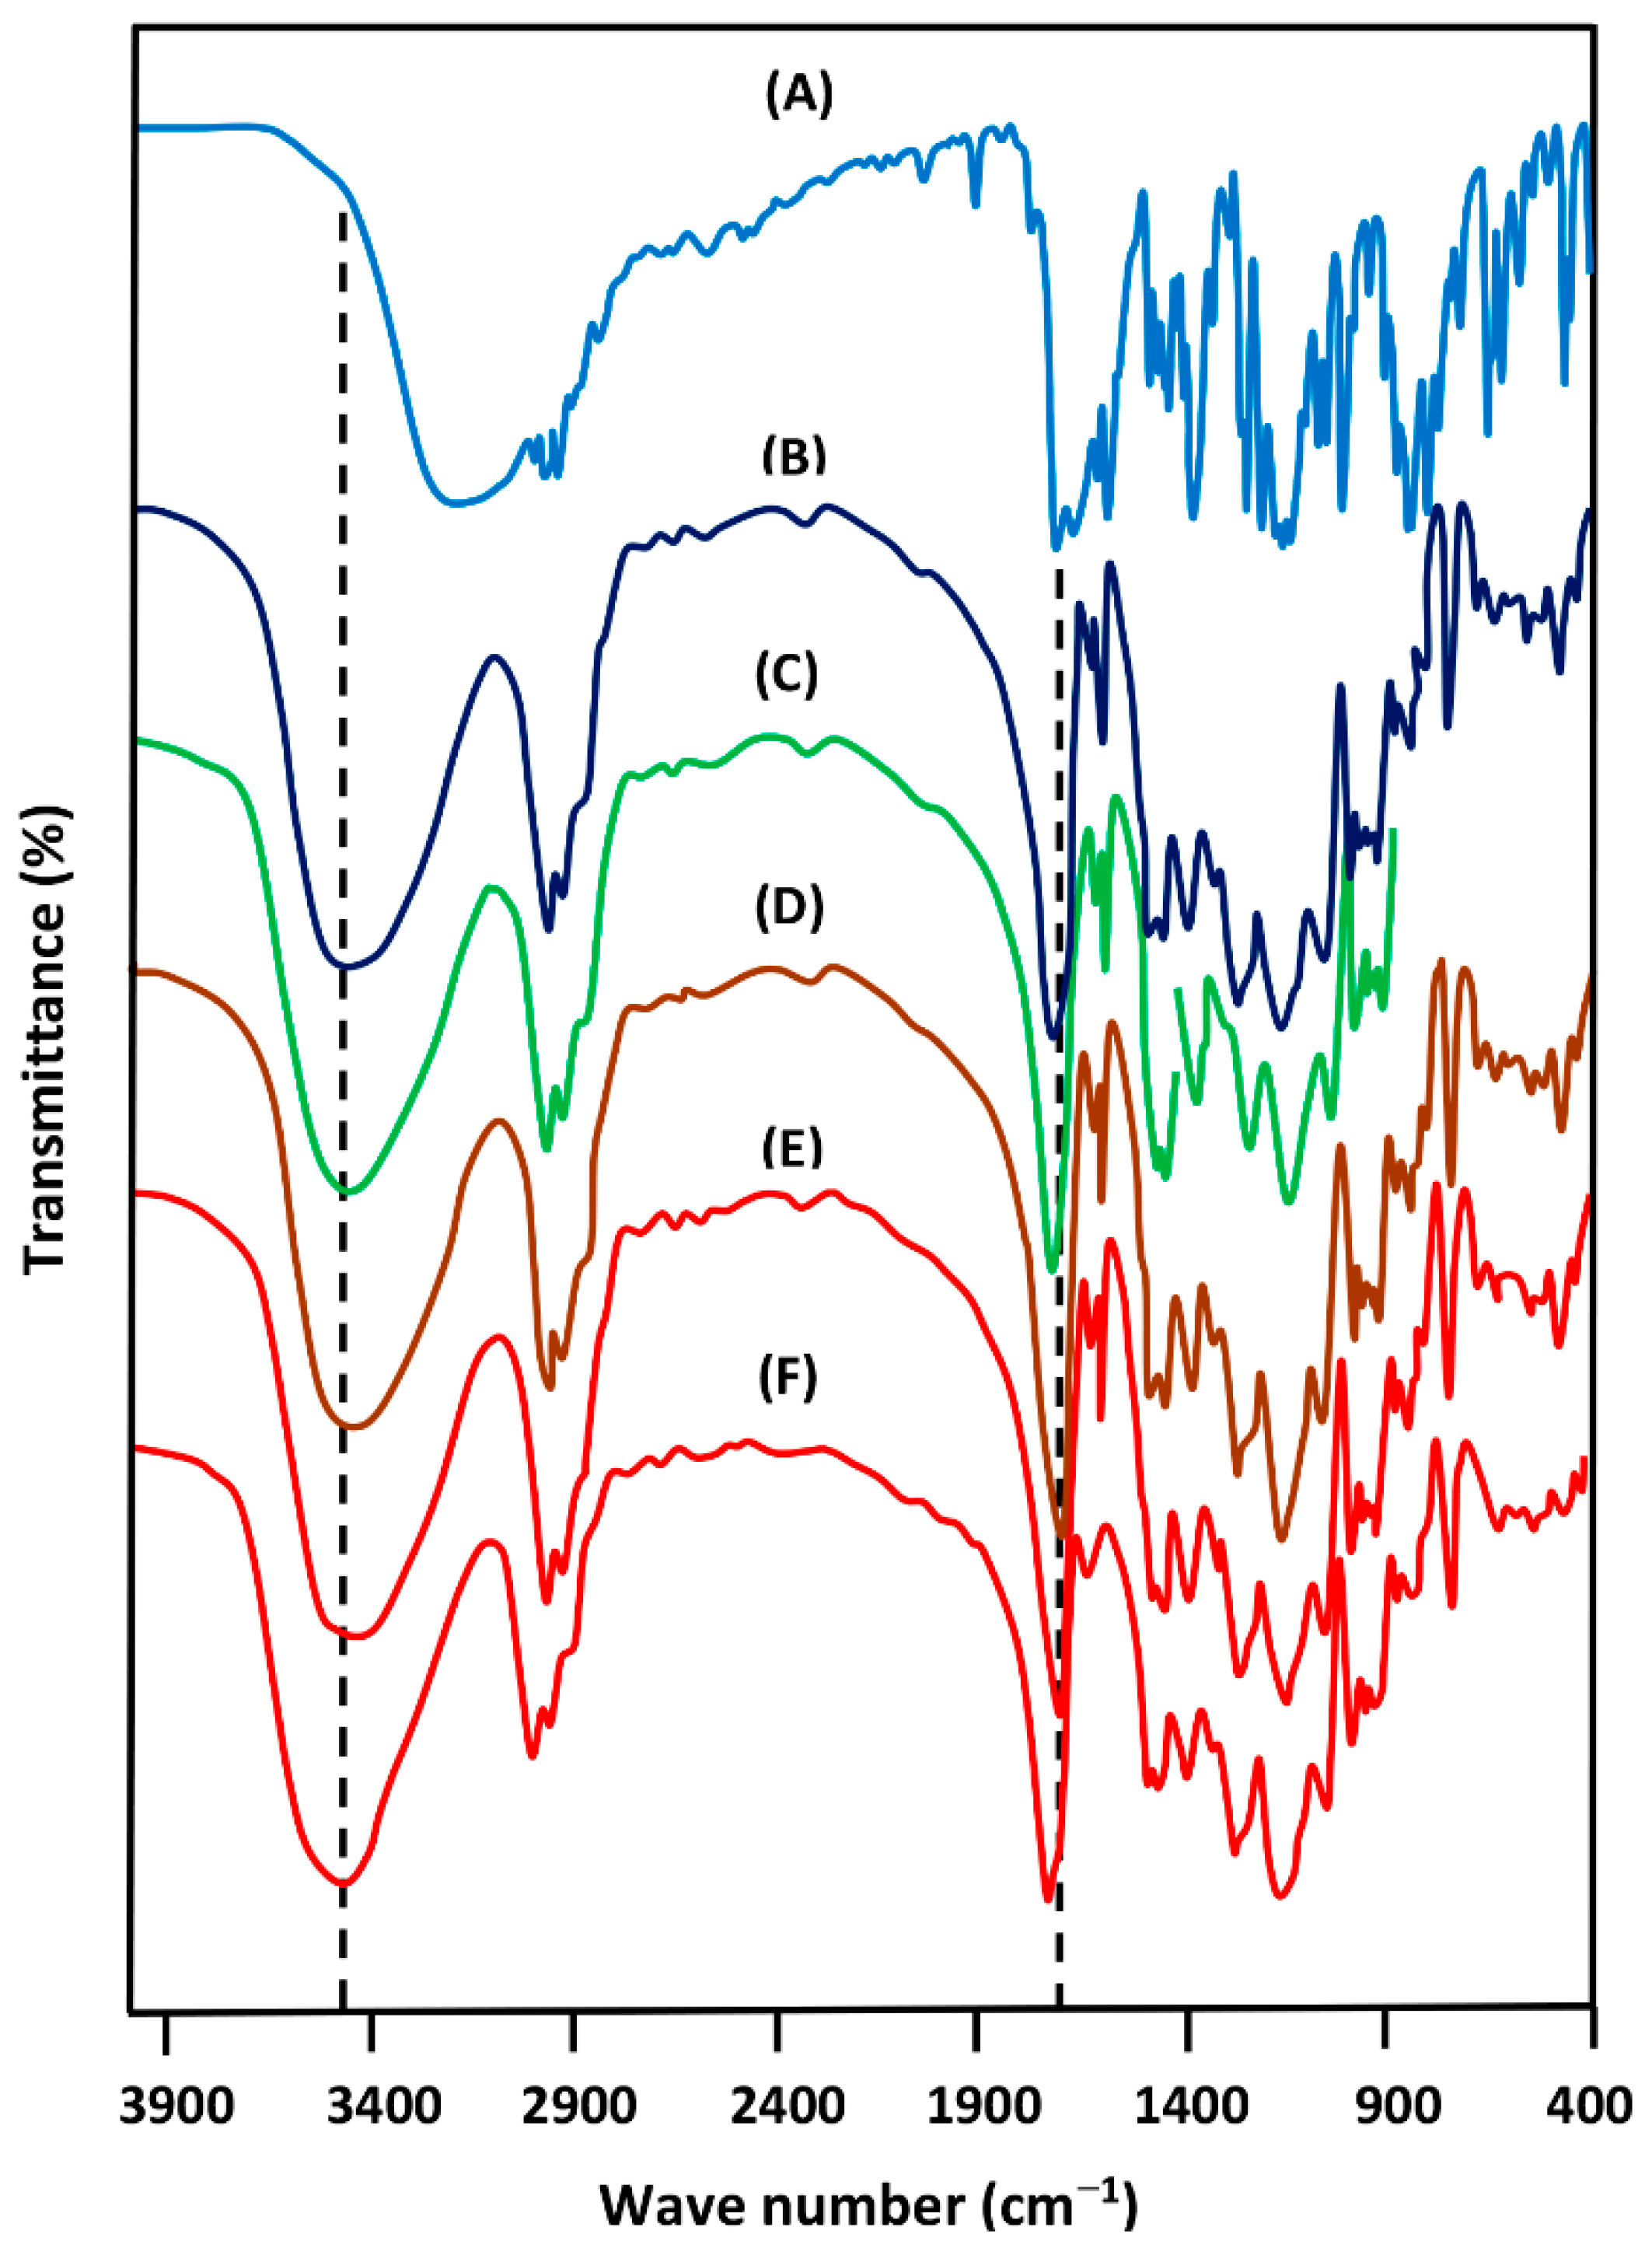
3.1.1. FTIR Analysis
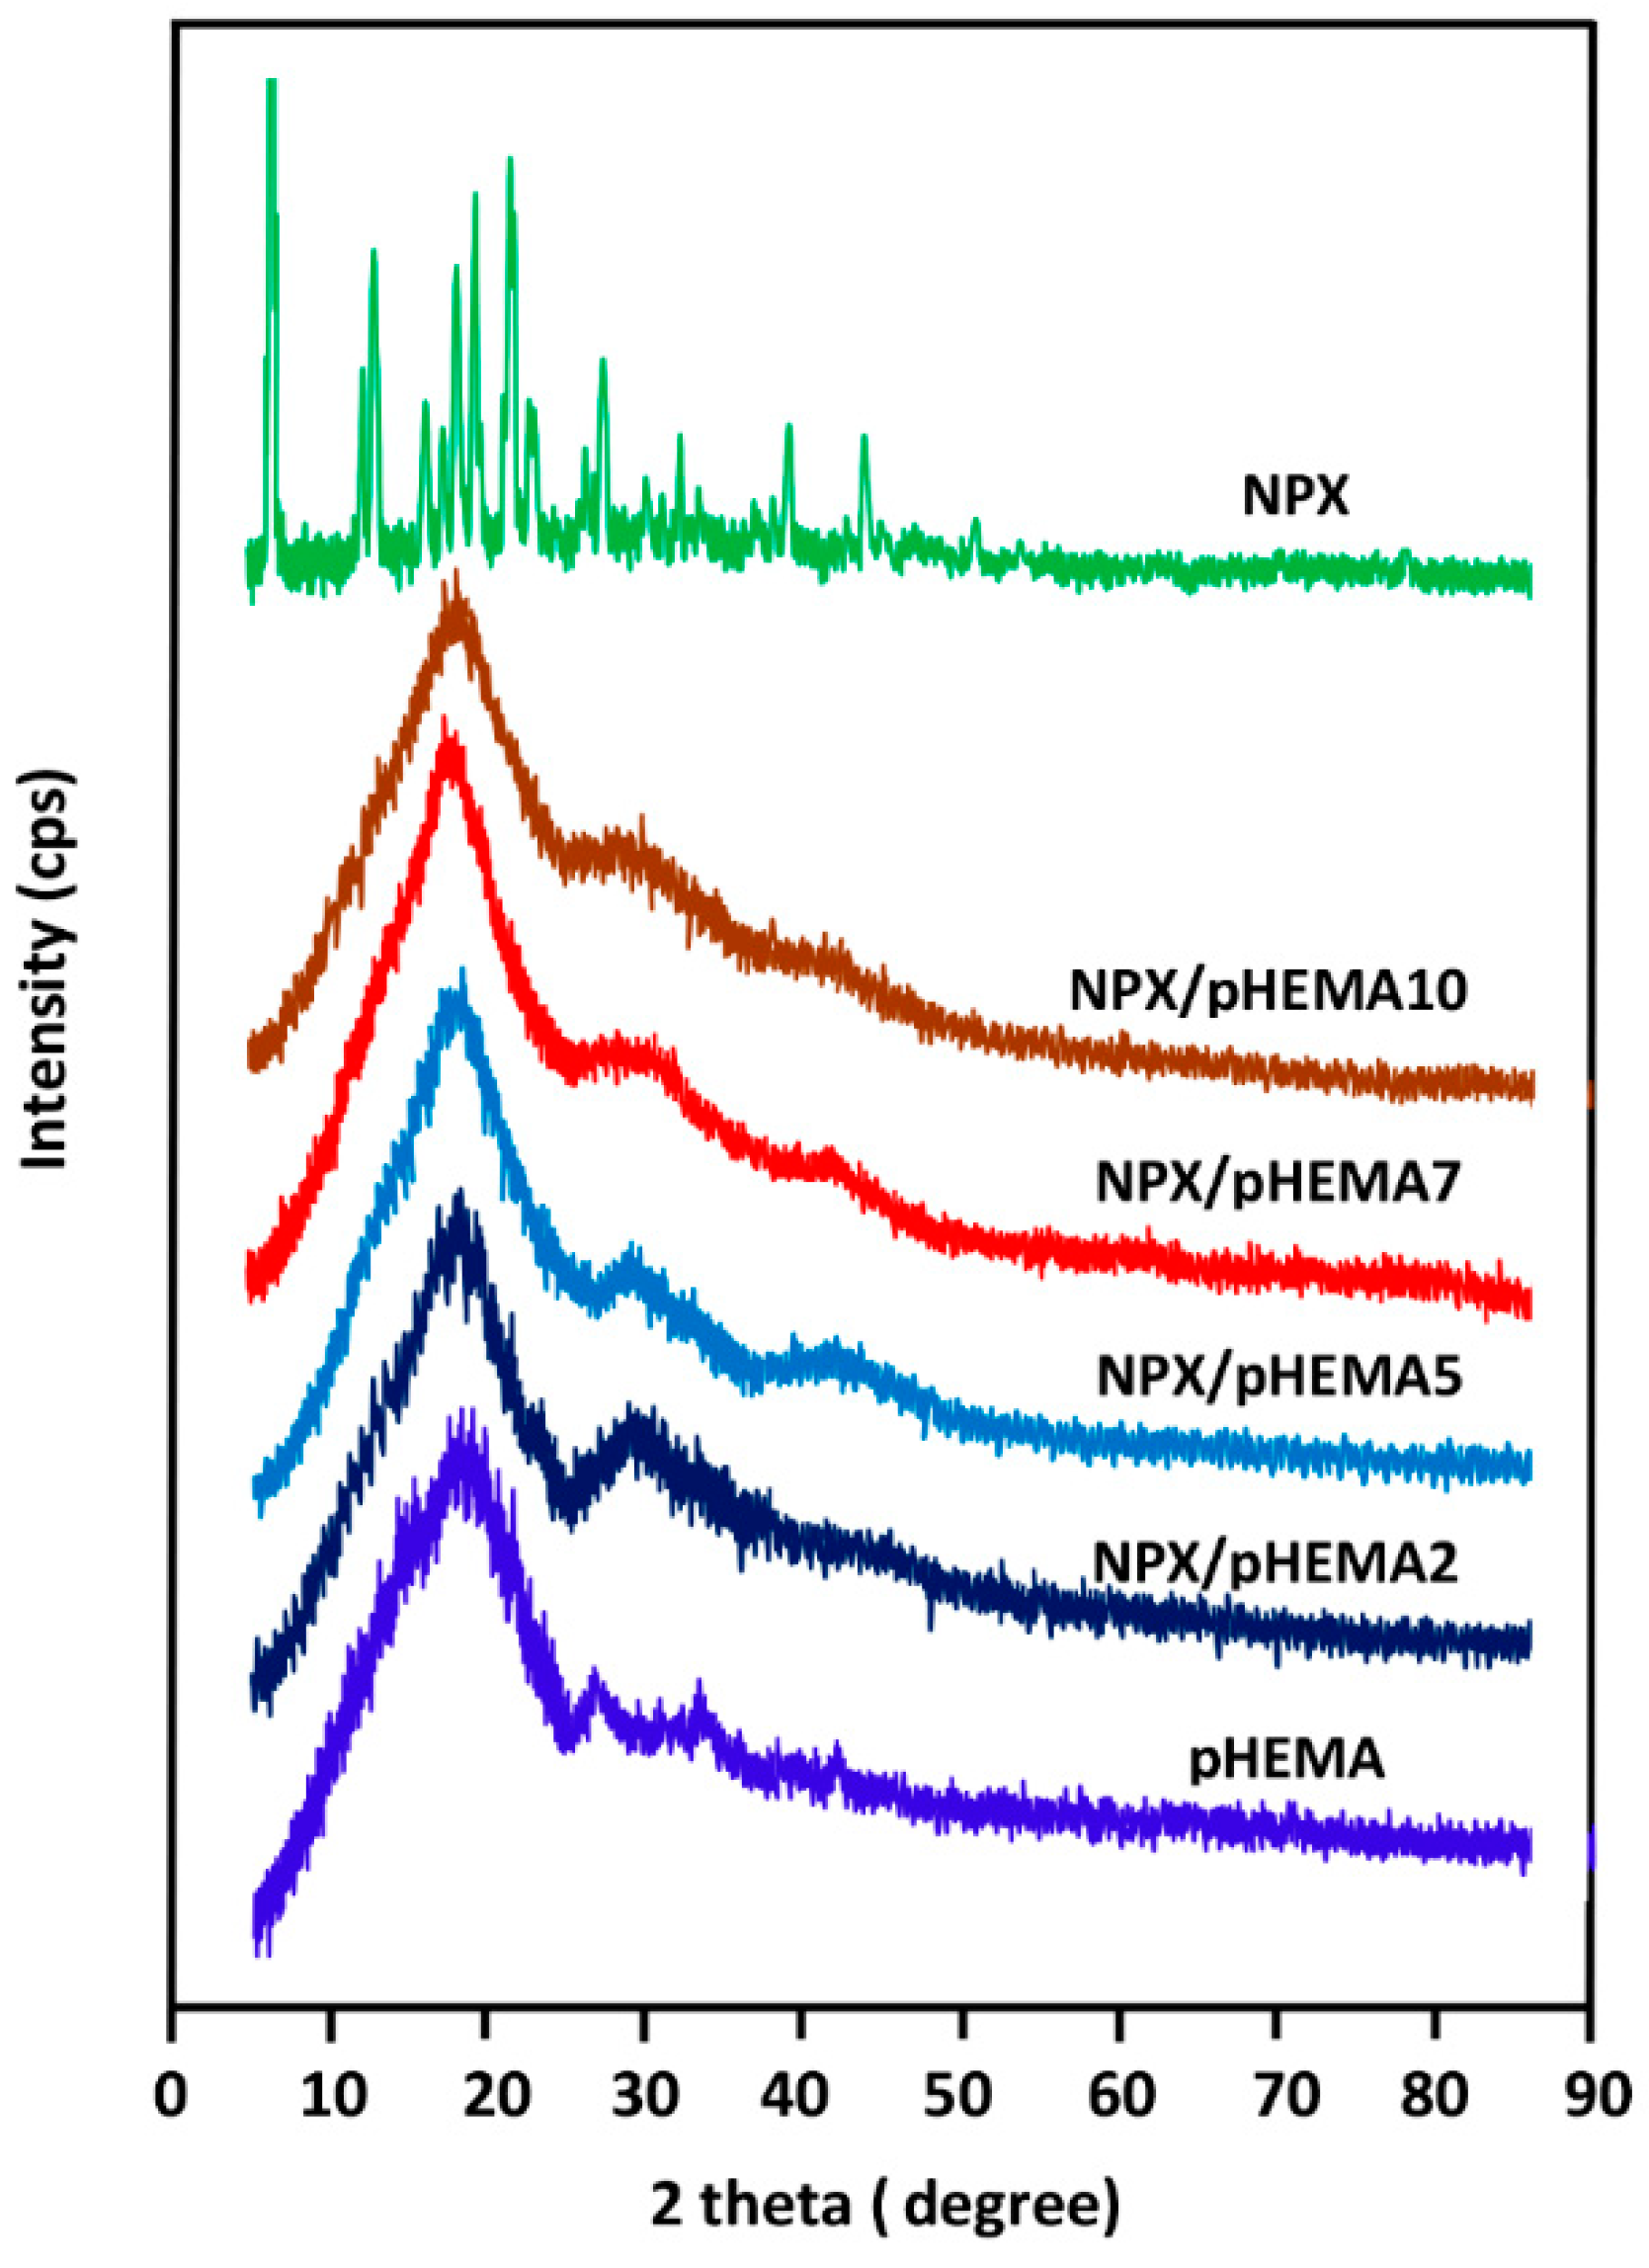
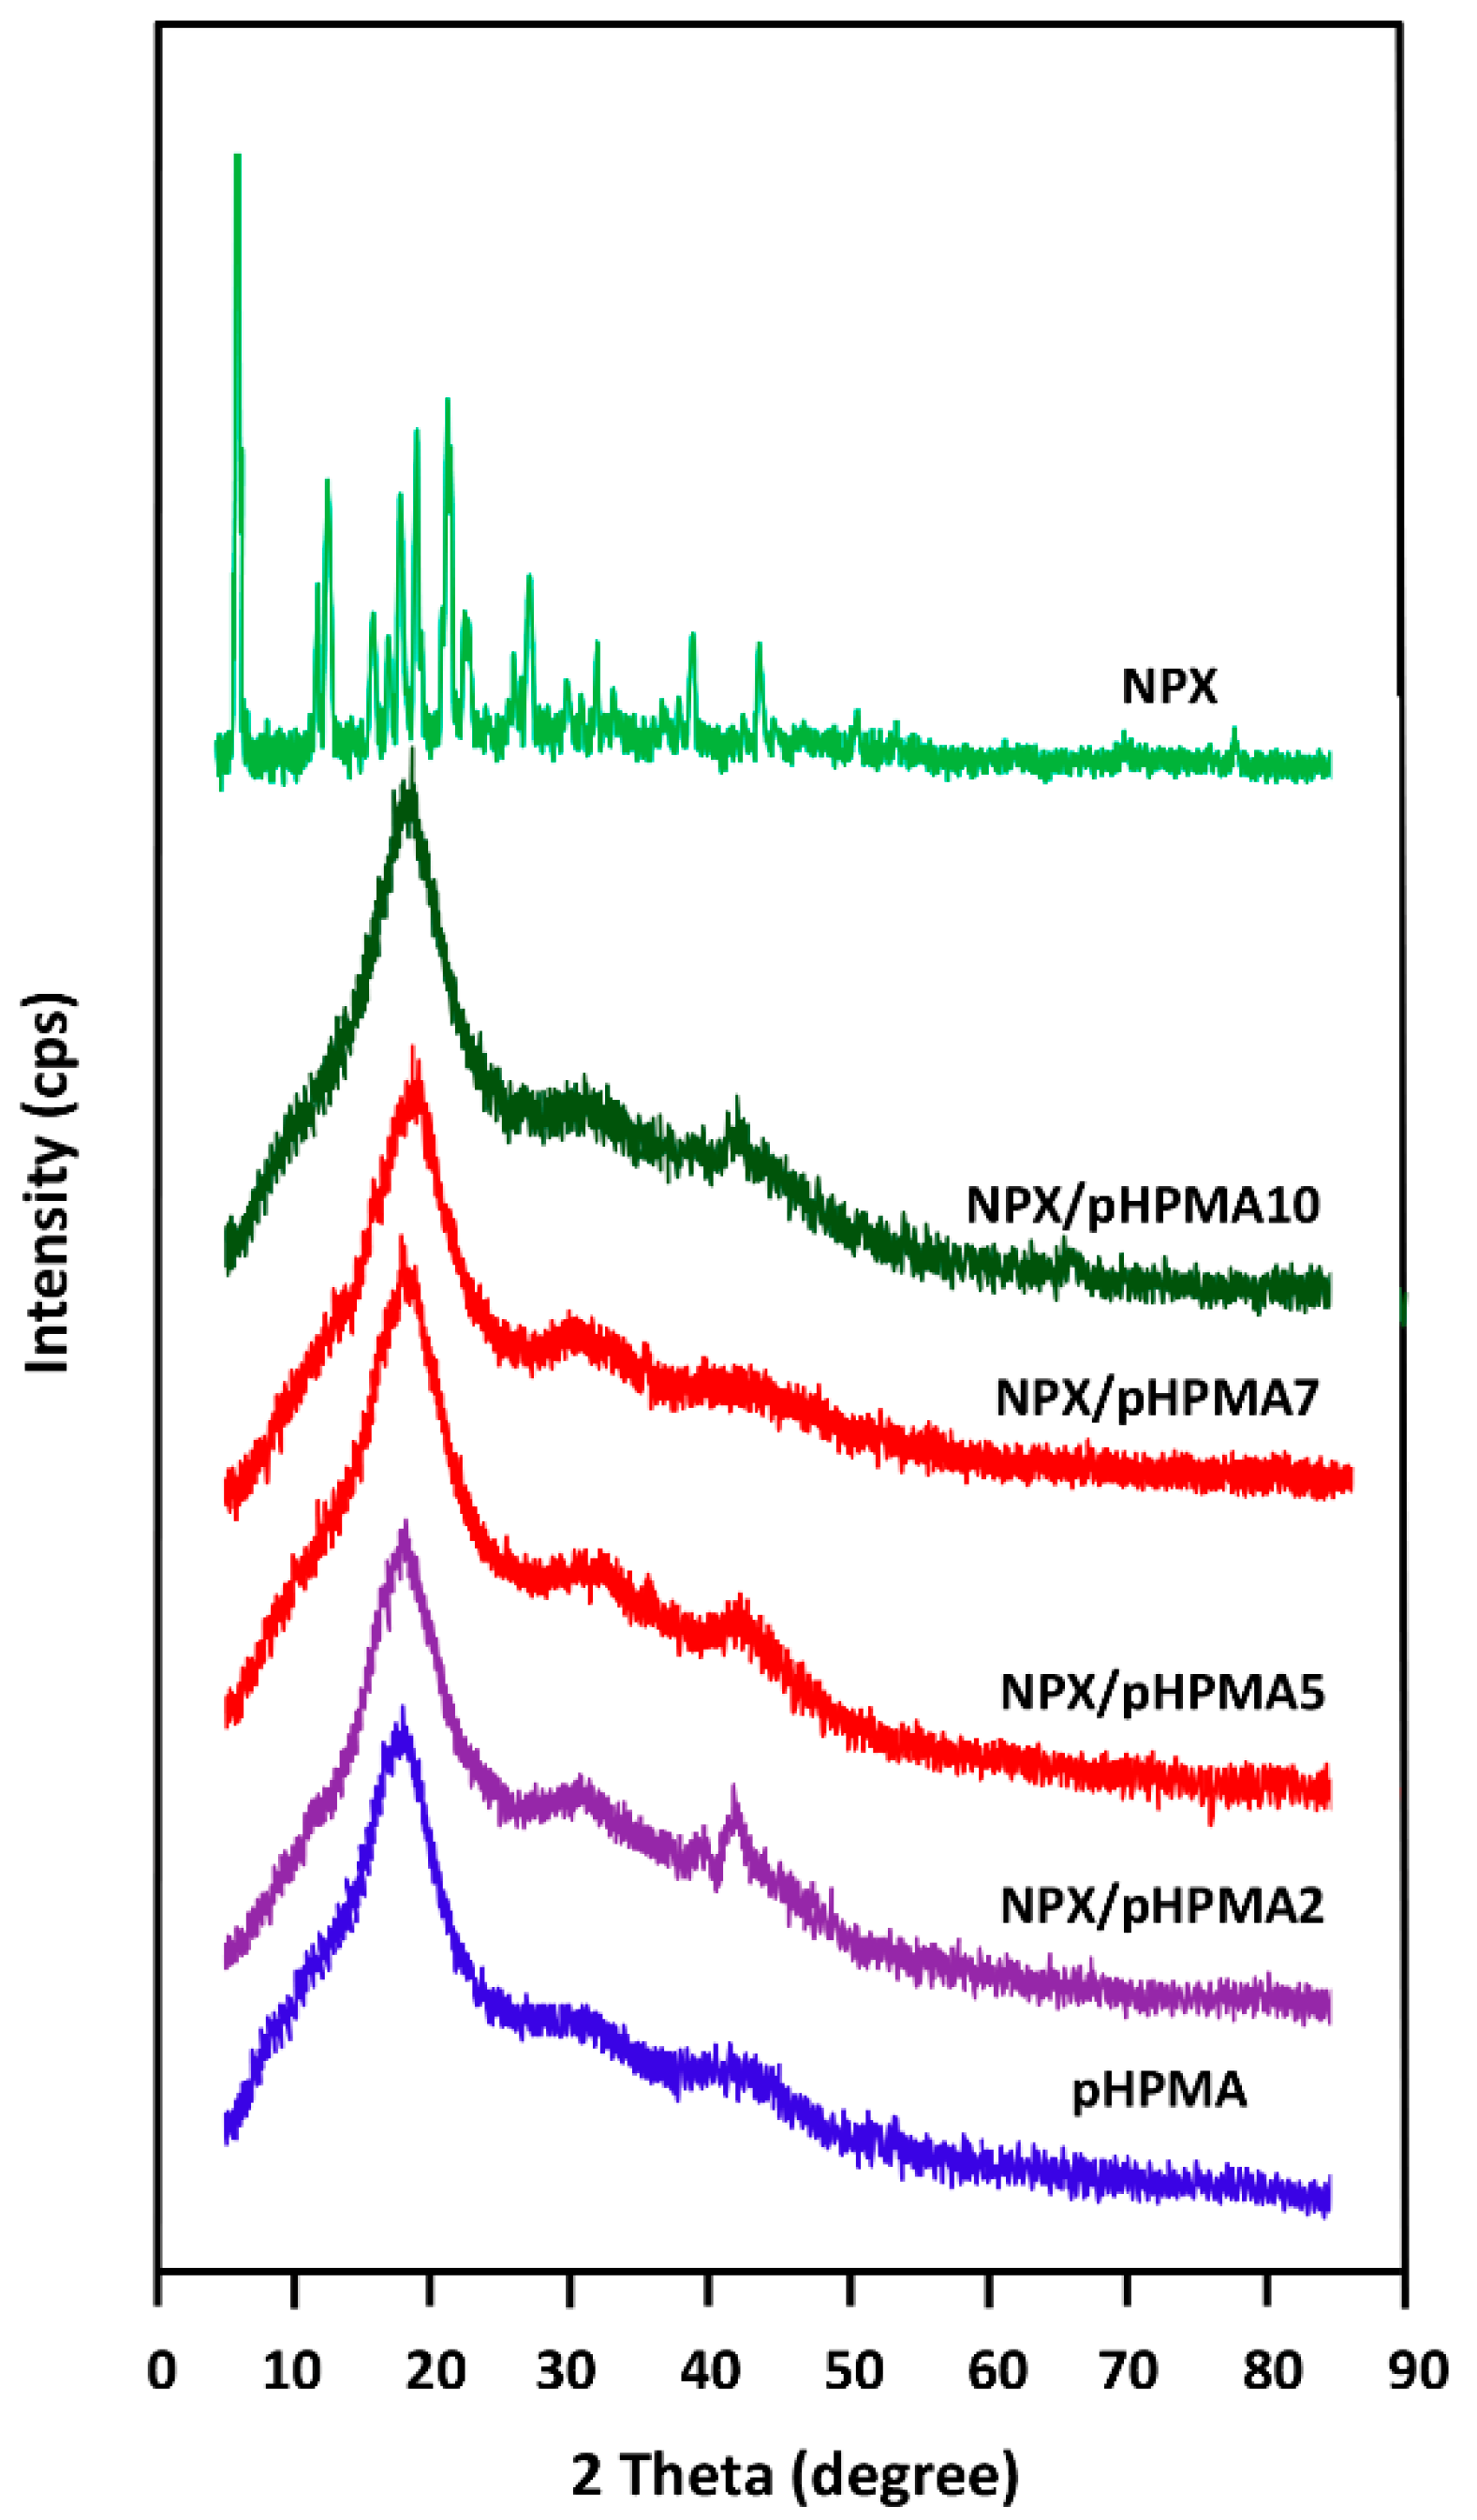
3.1.2. XRD Analysis
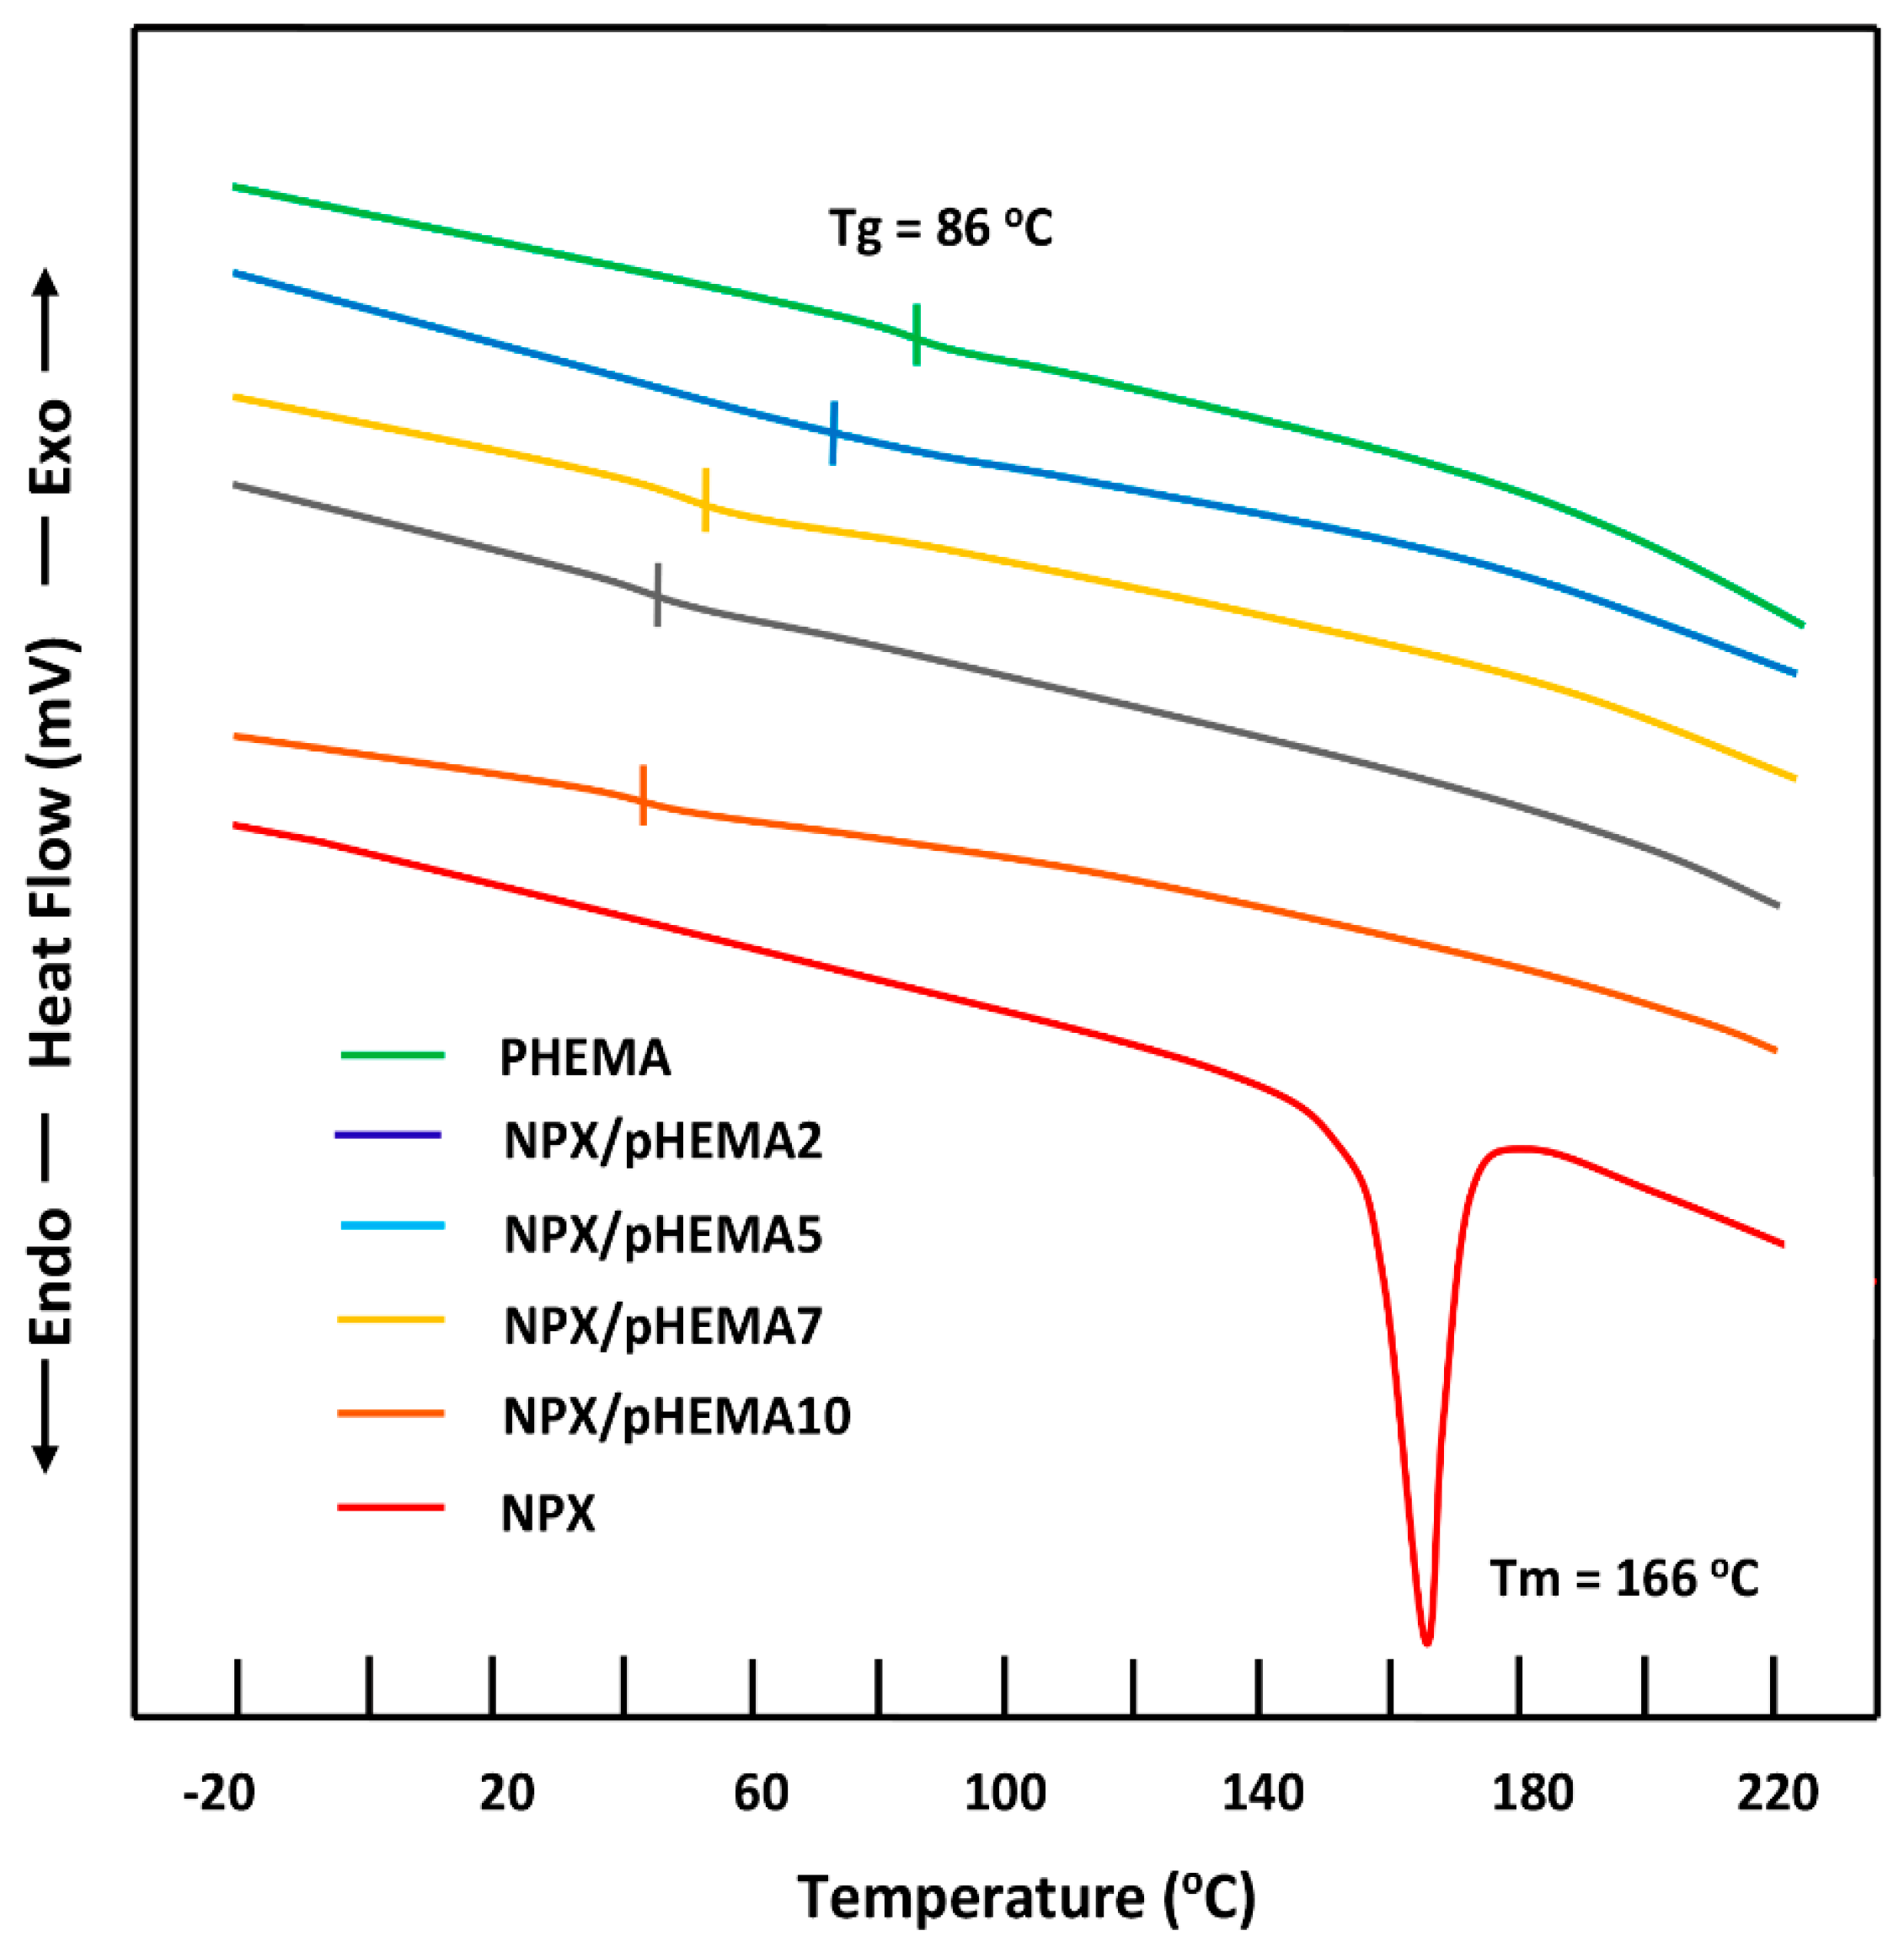
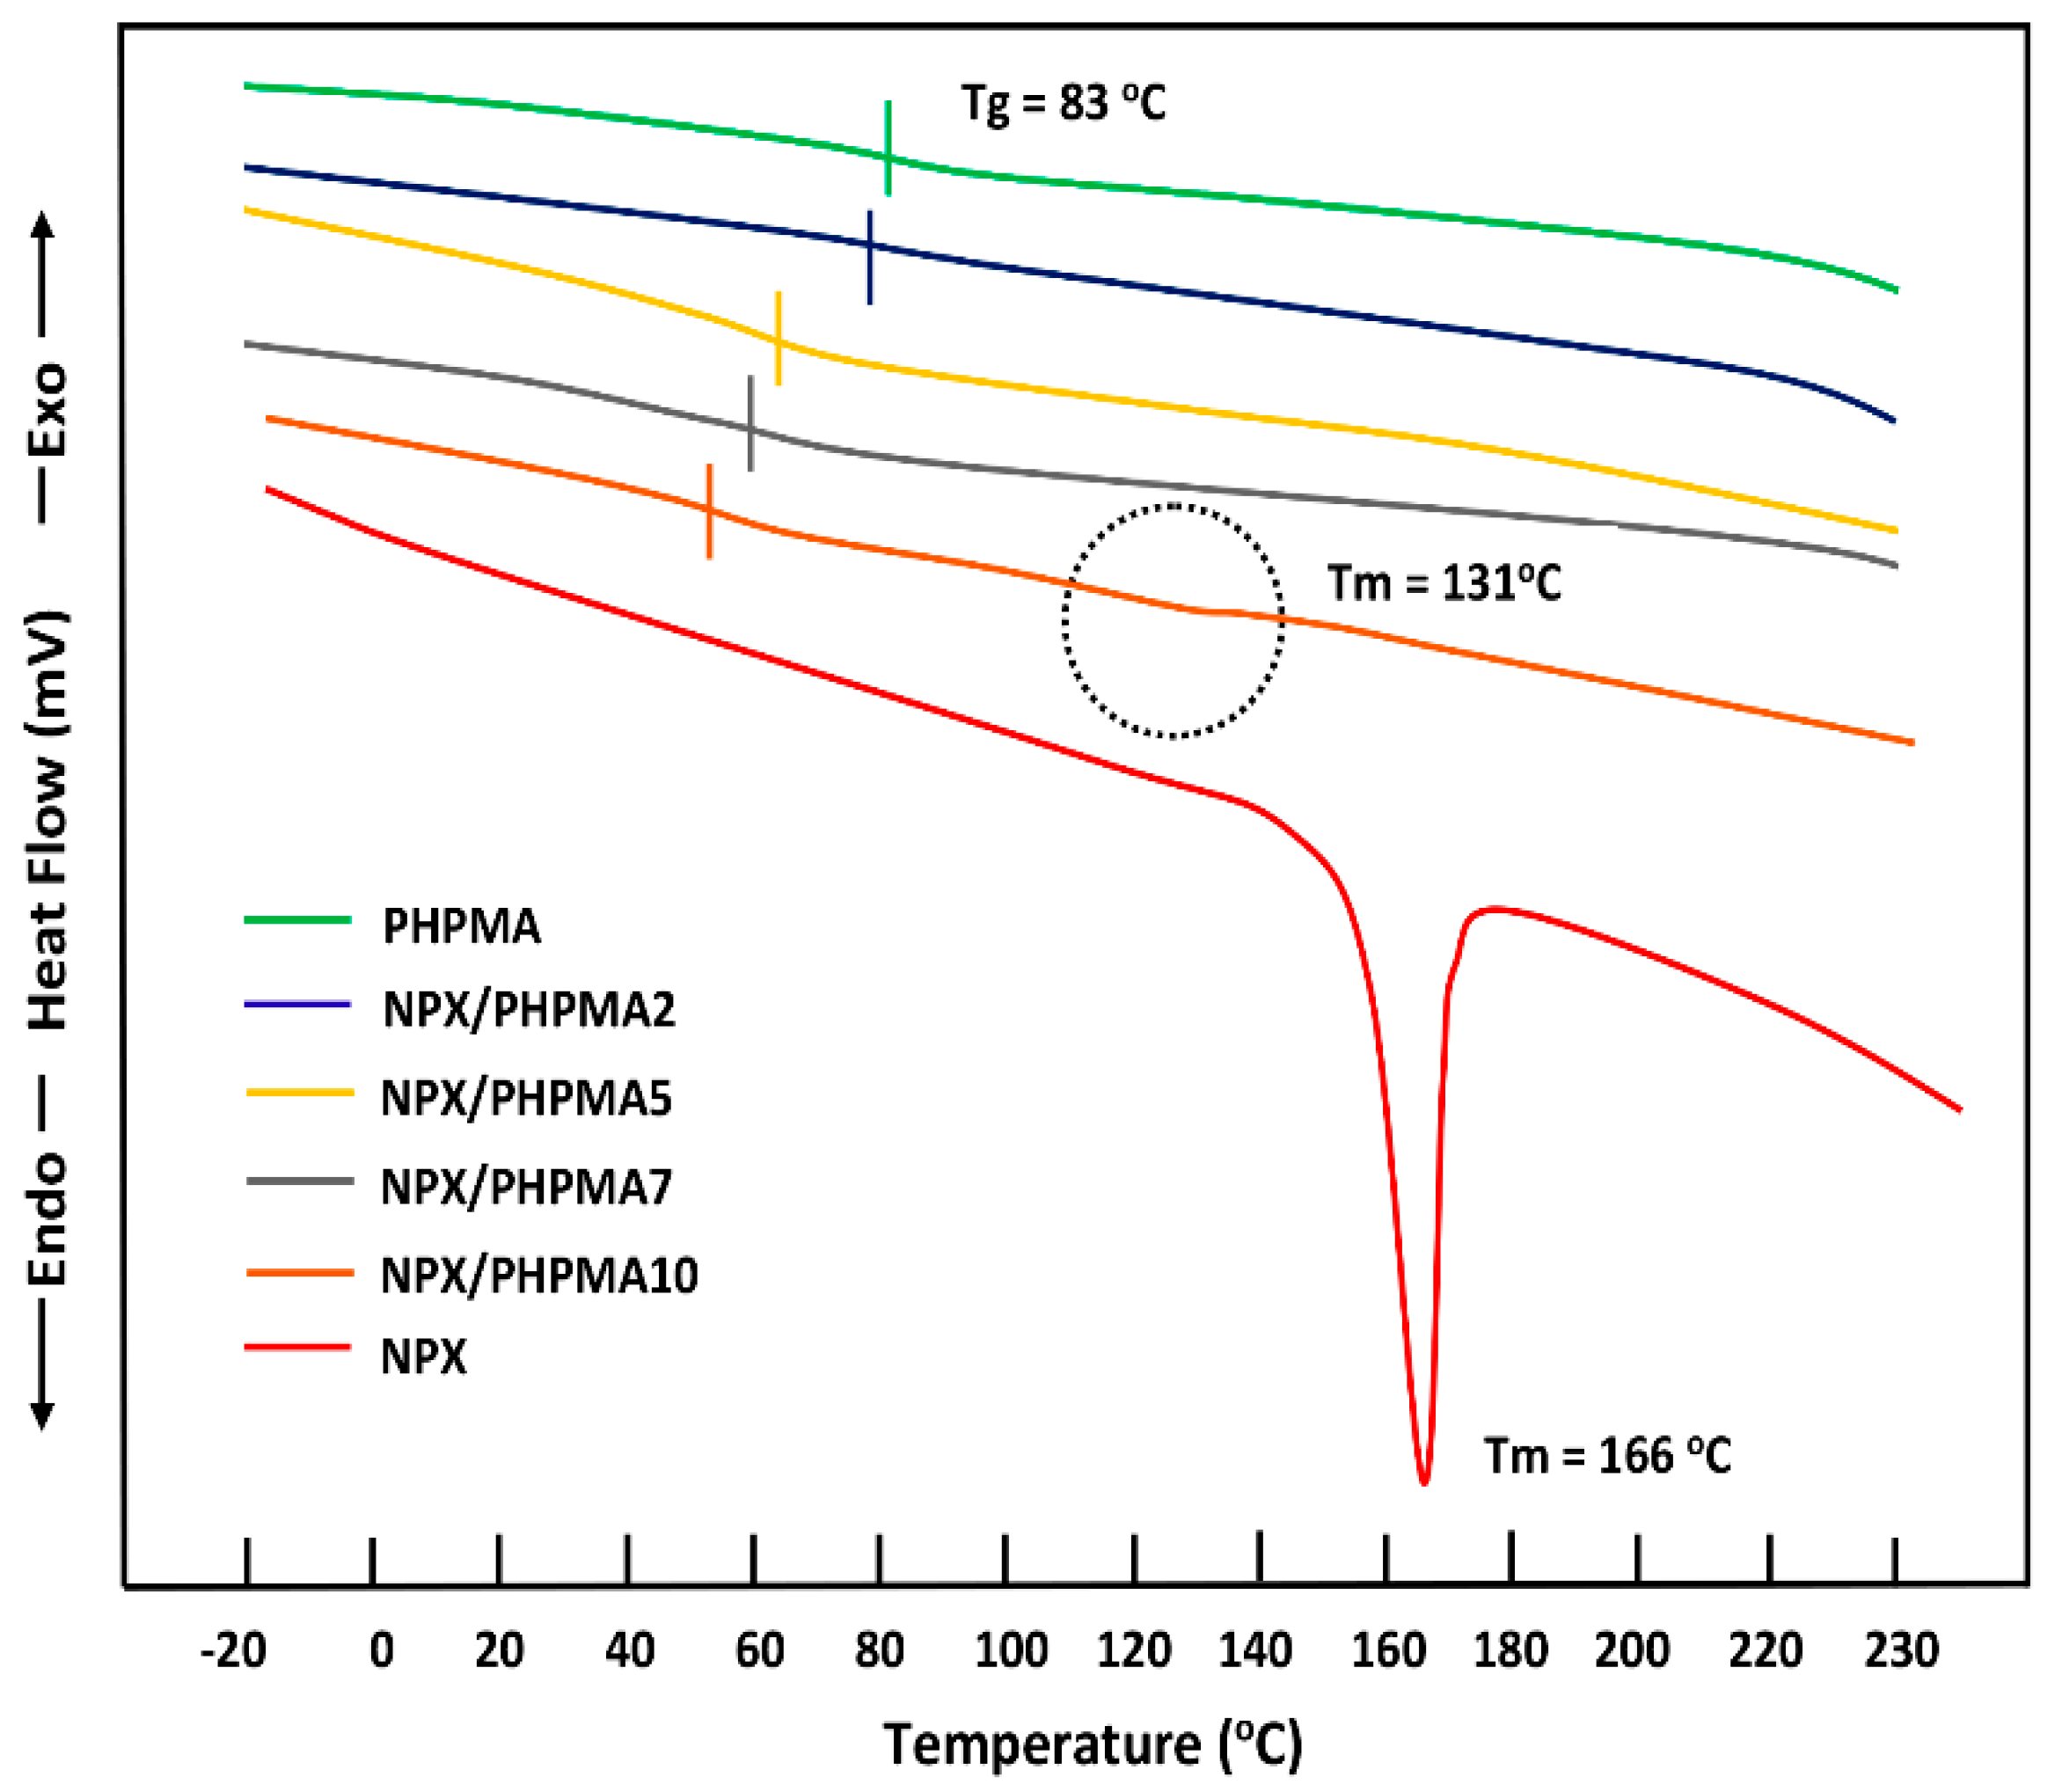
3.1.3. DSC Analysis
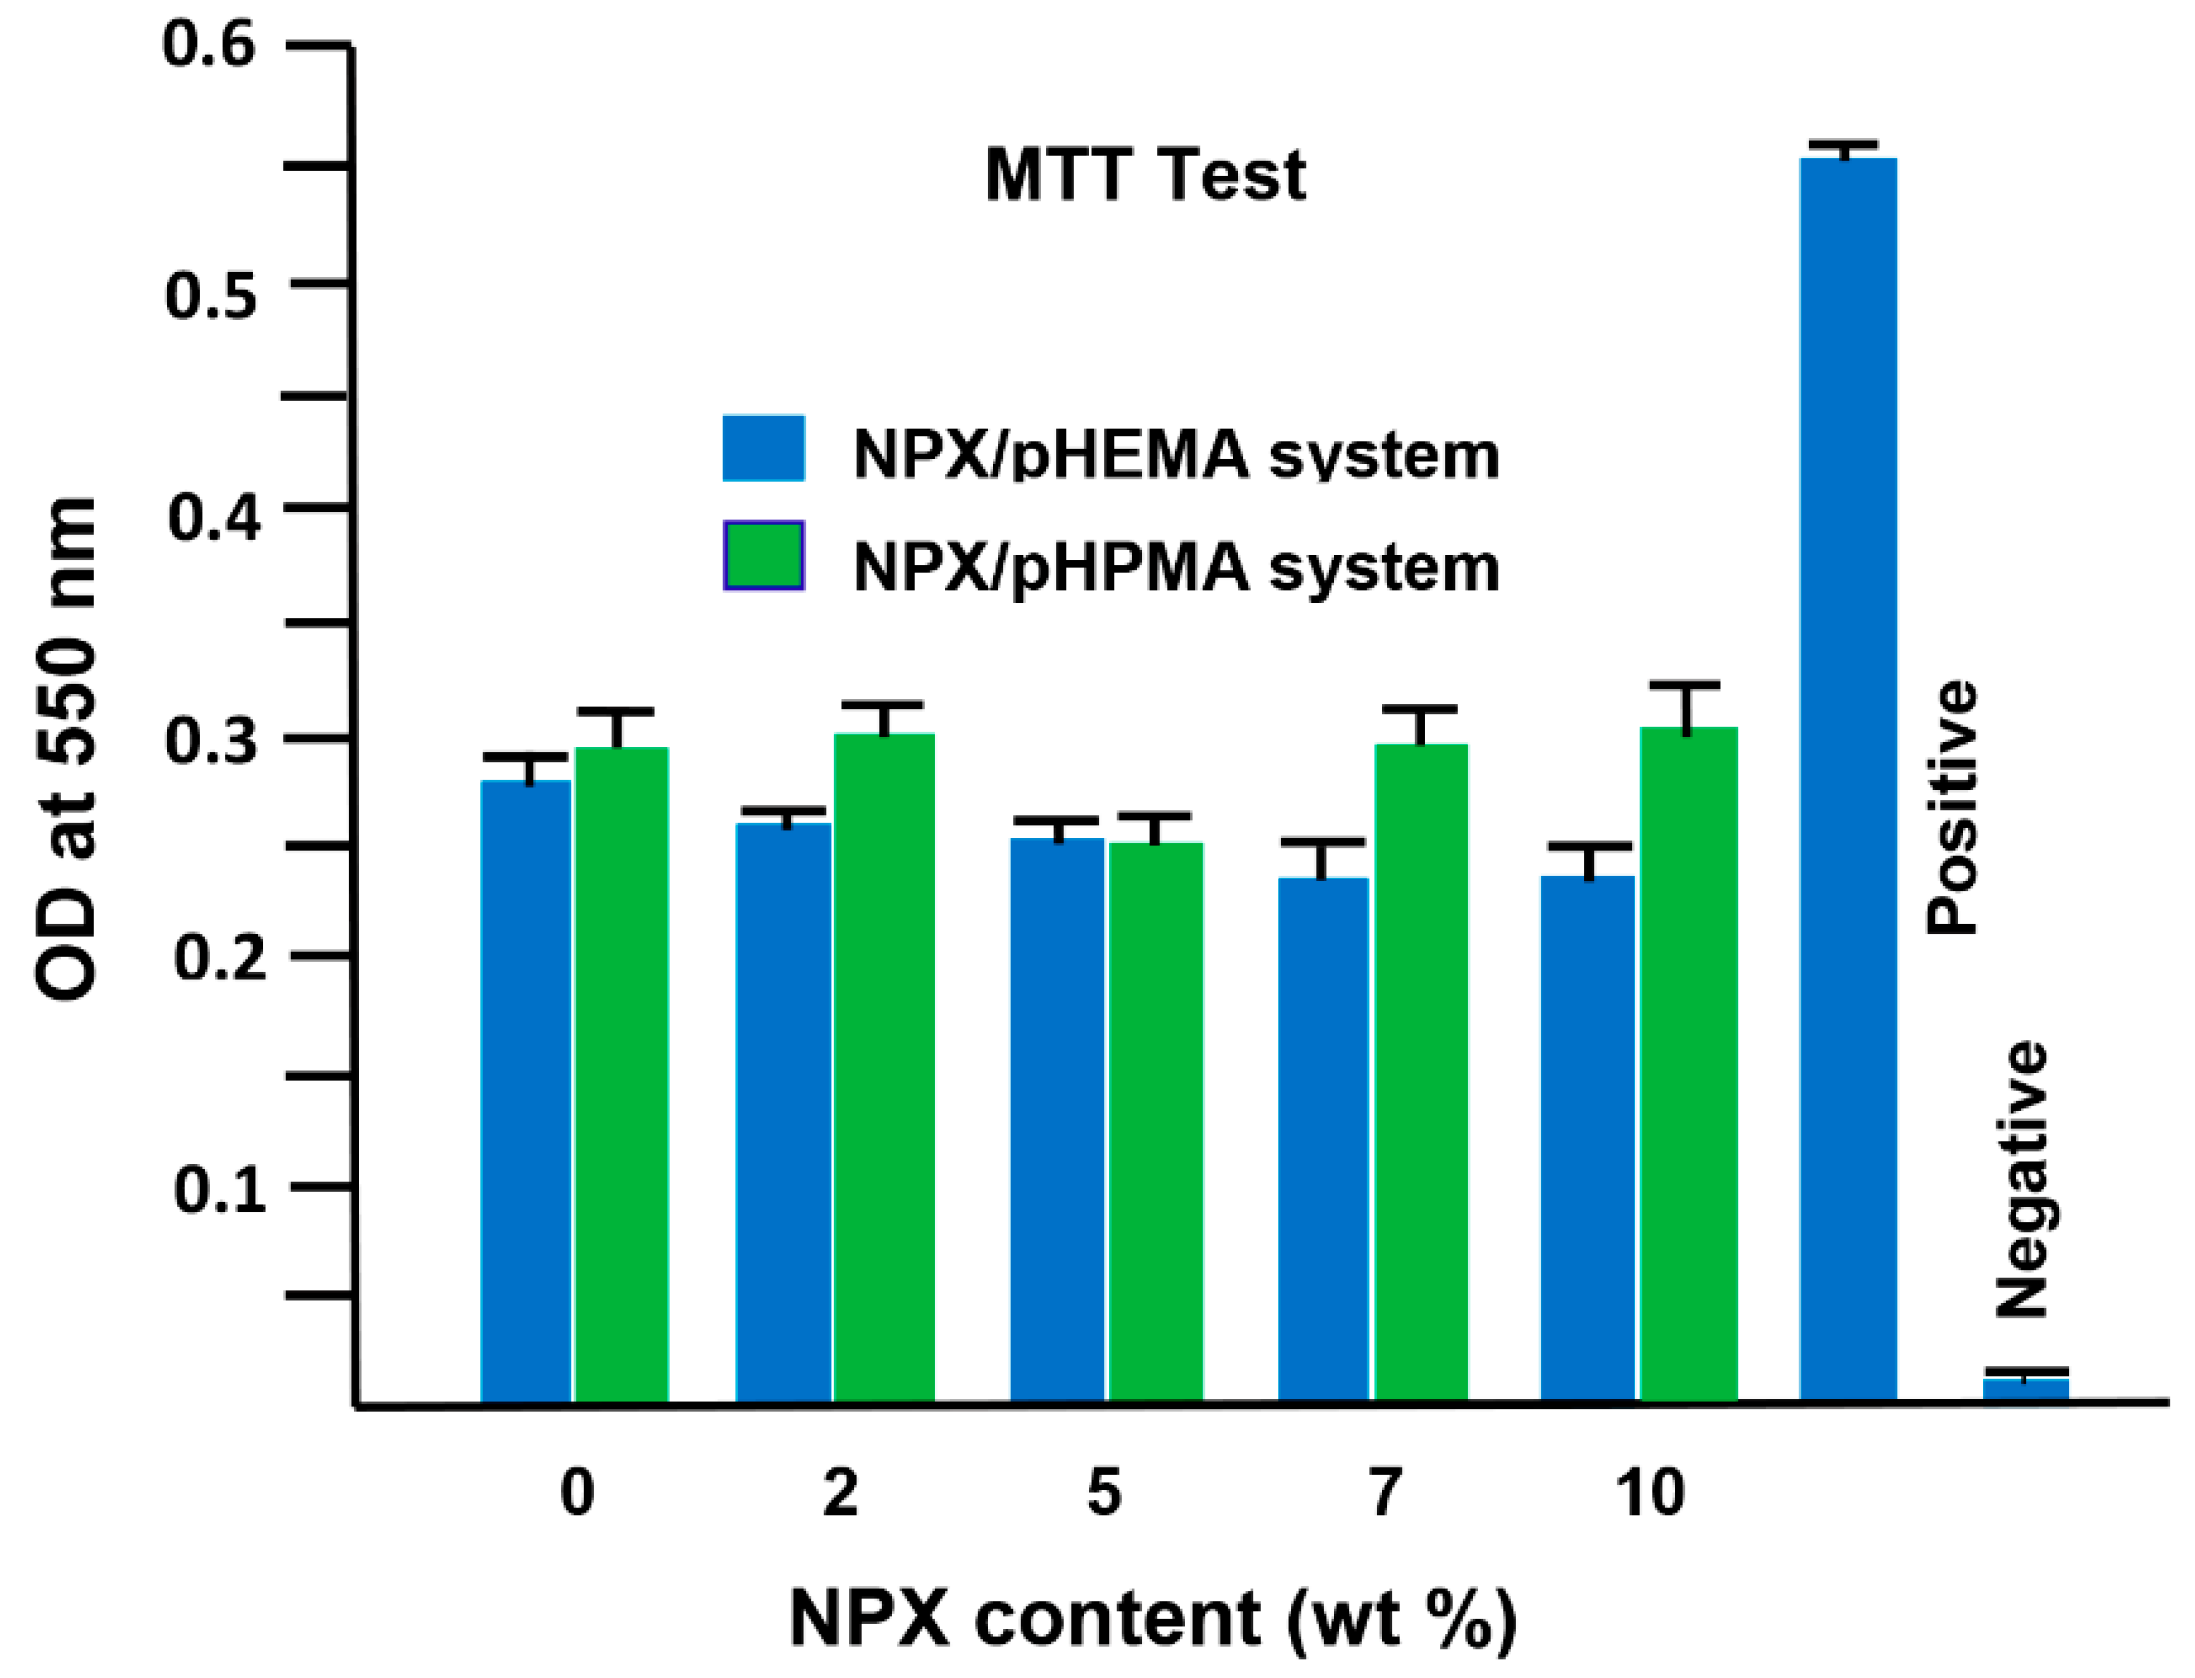
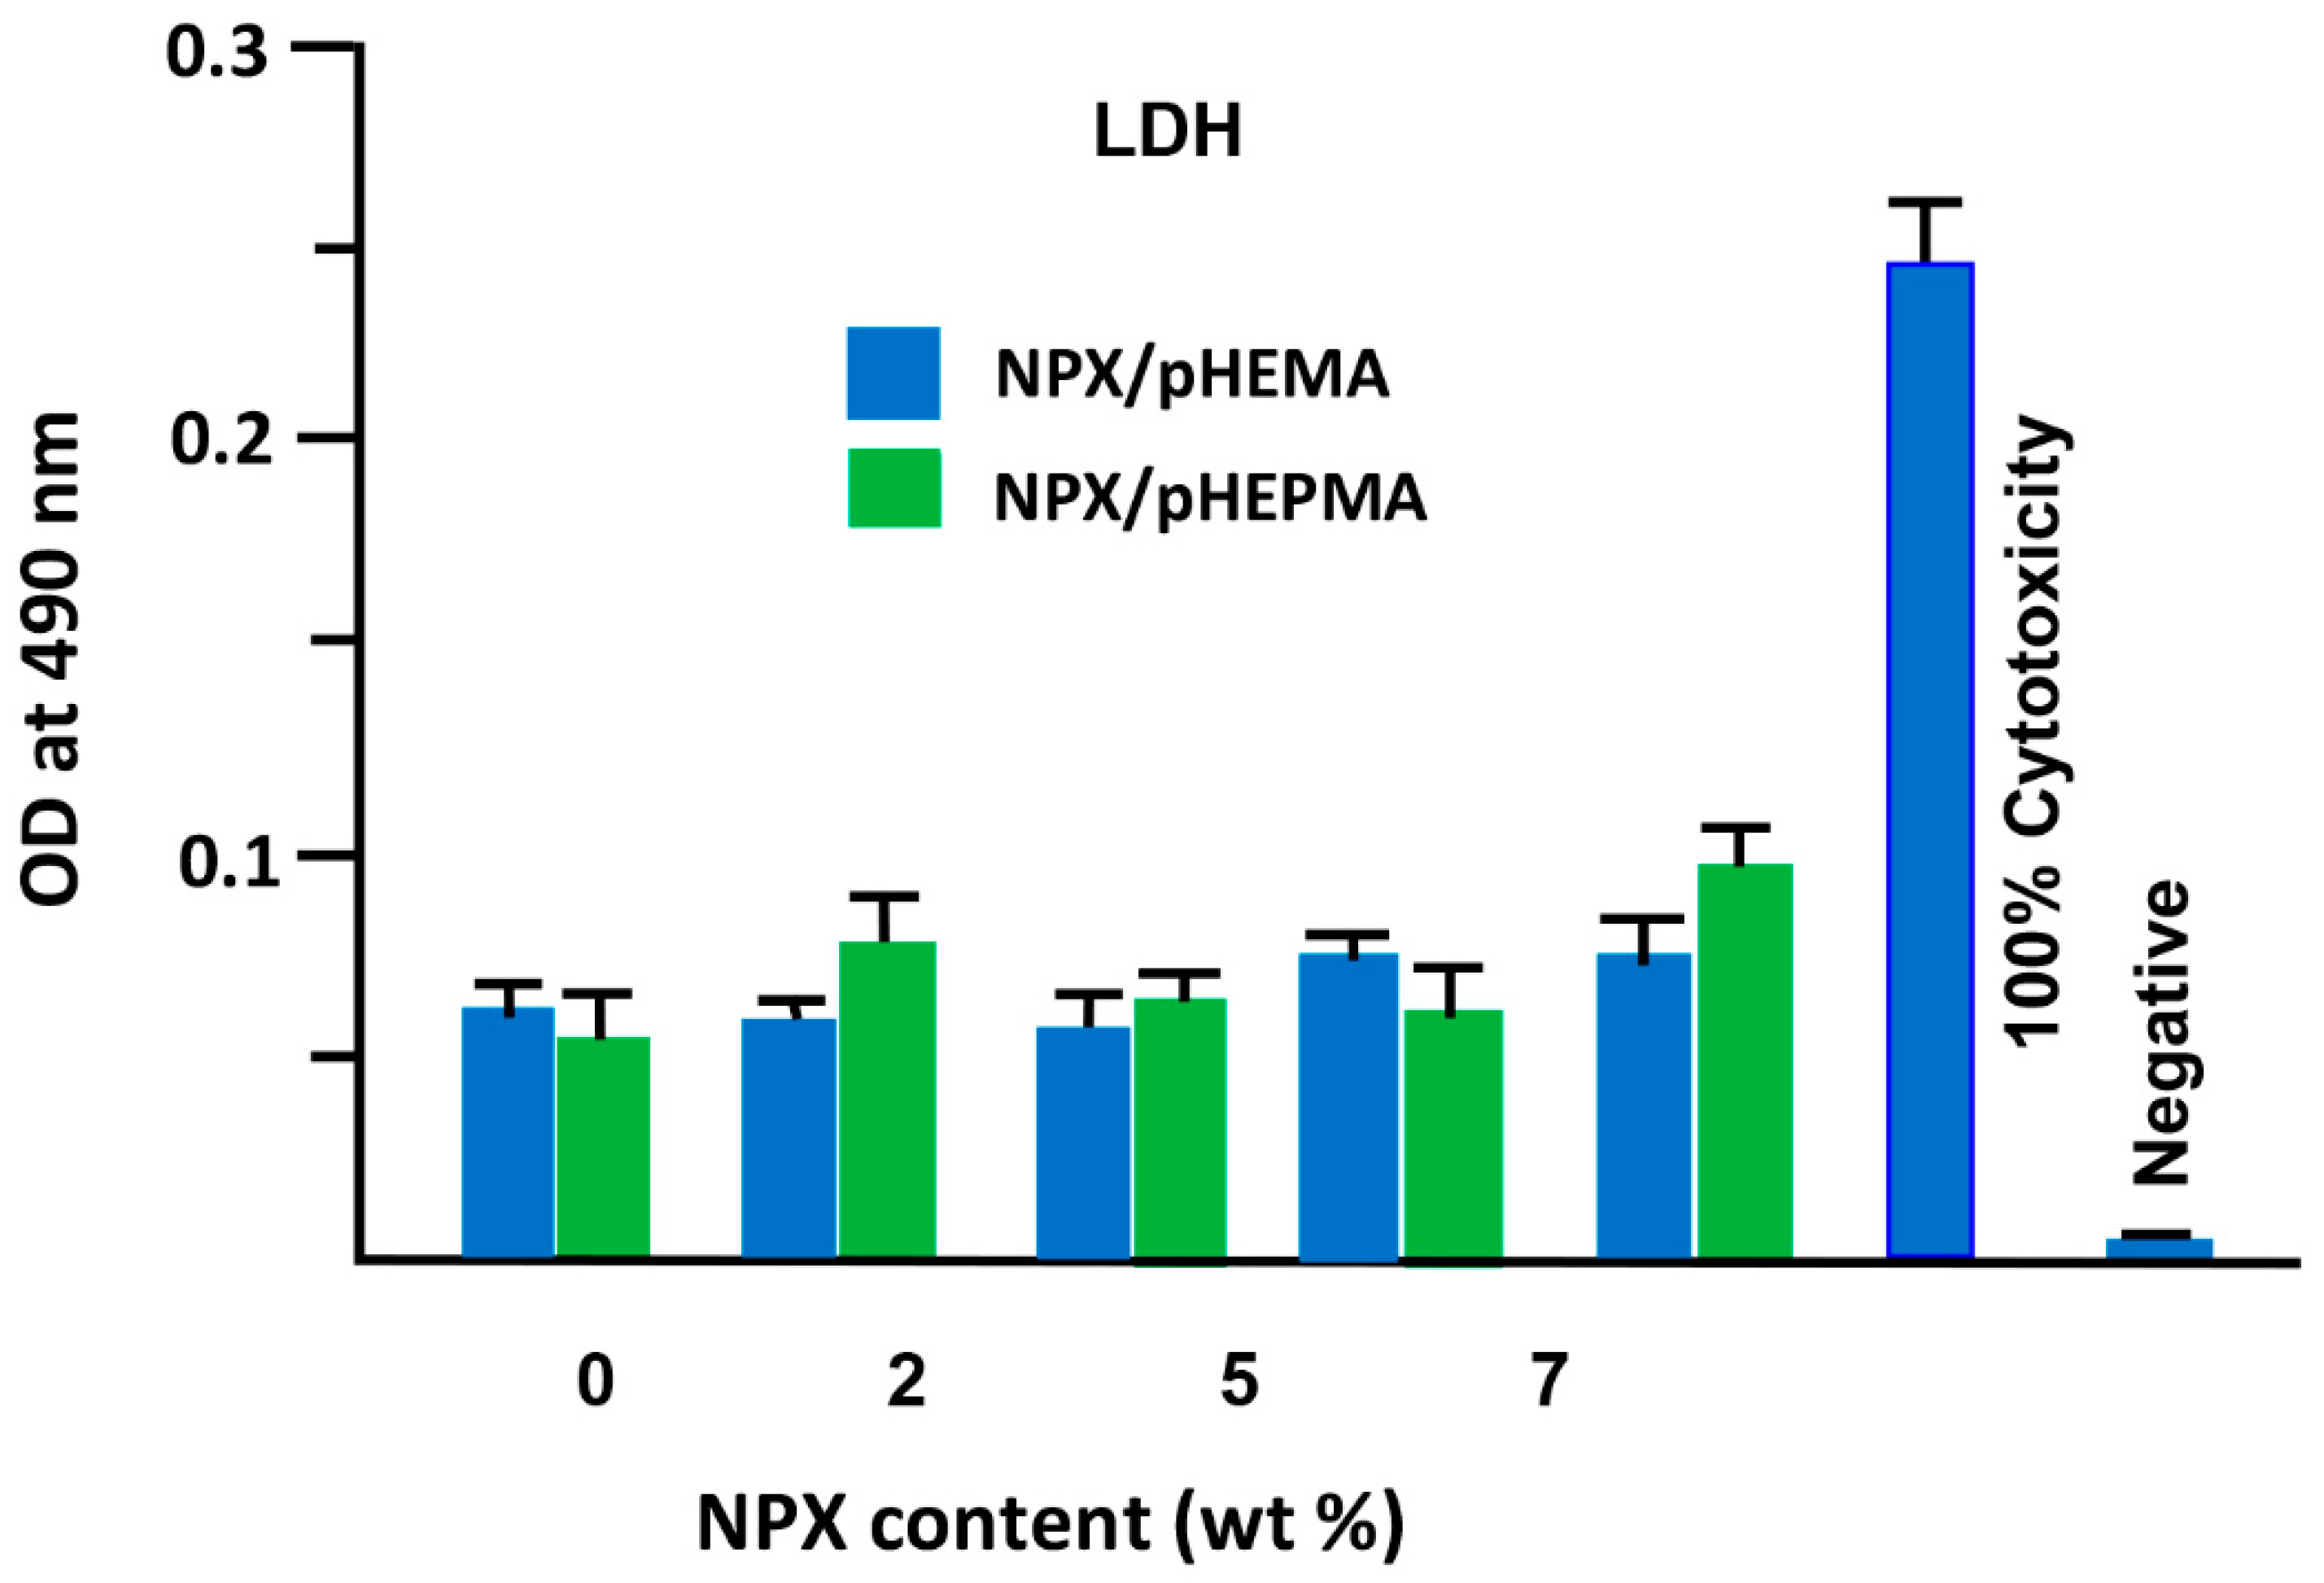
3.2. Cells Adhesion and Toxicity
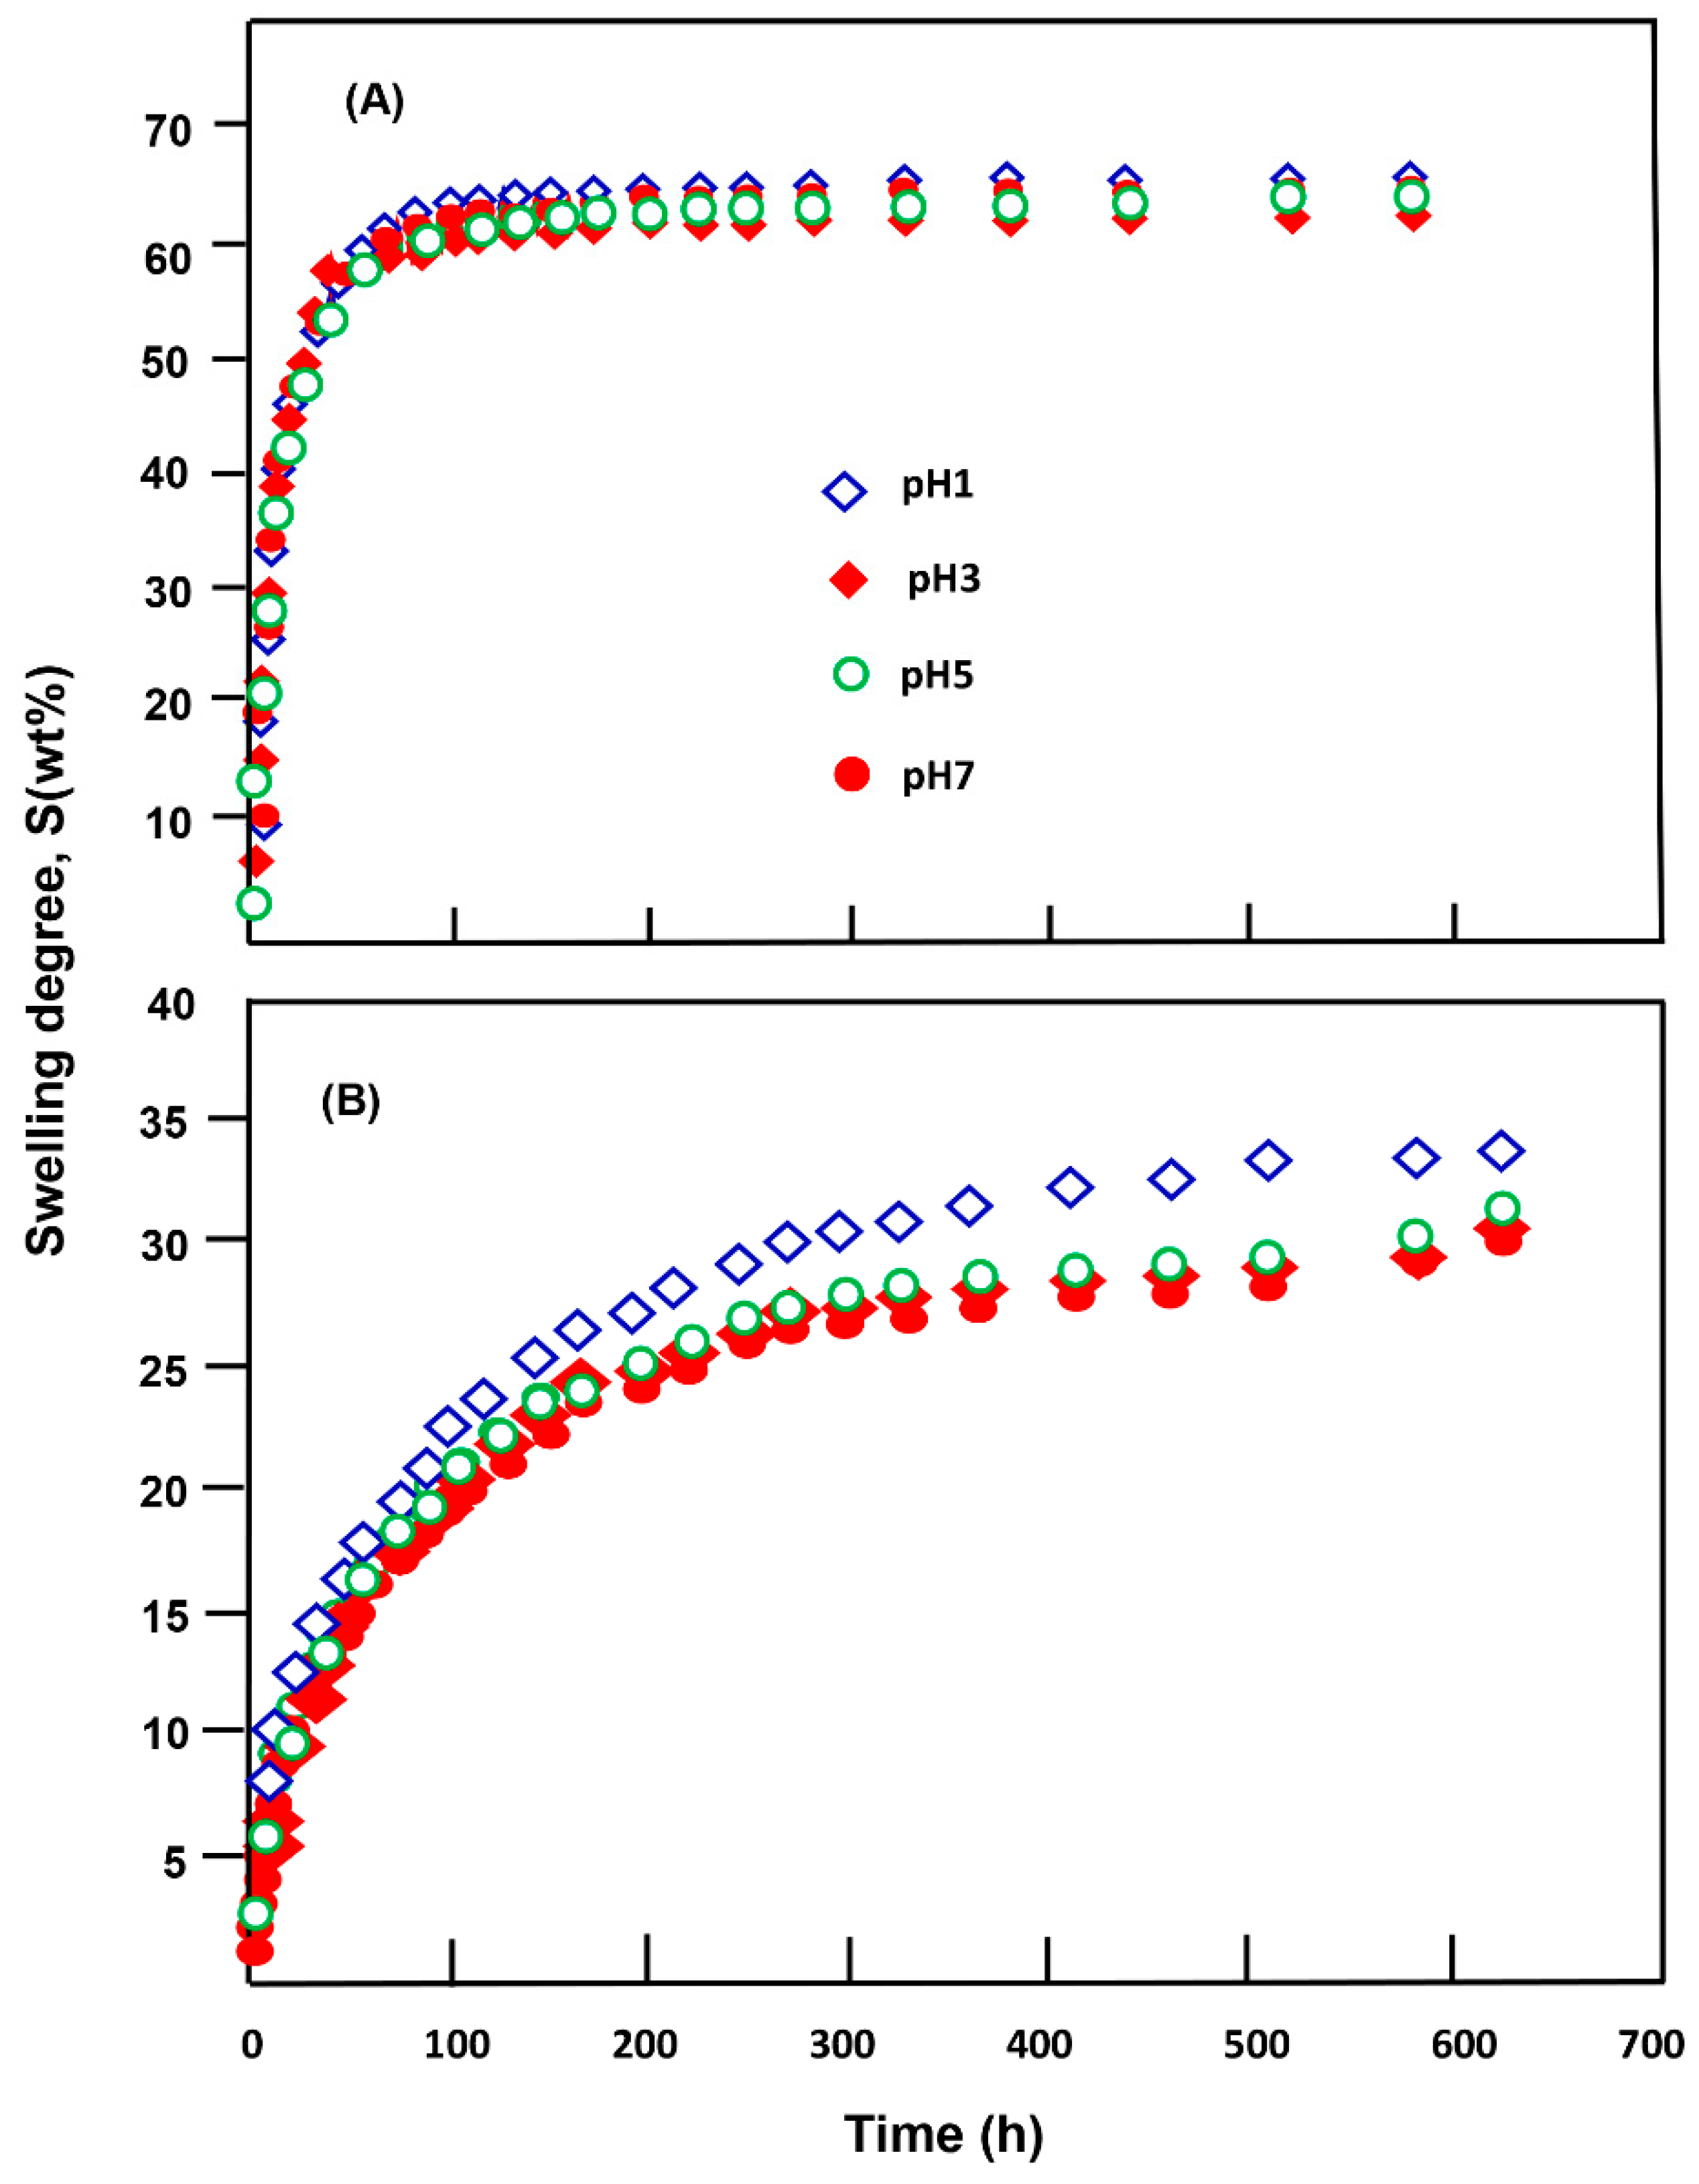
3.3. Swelling Behavior
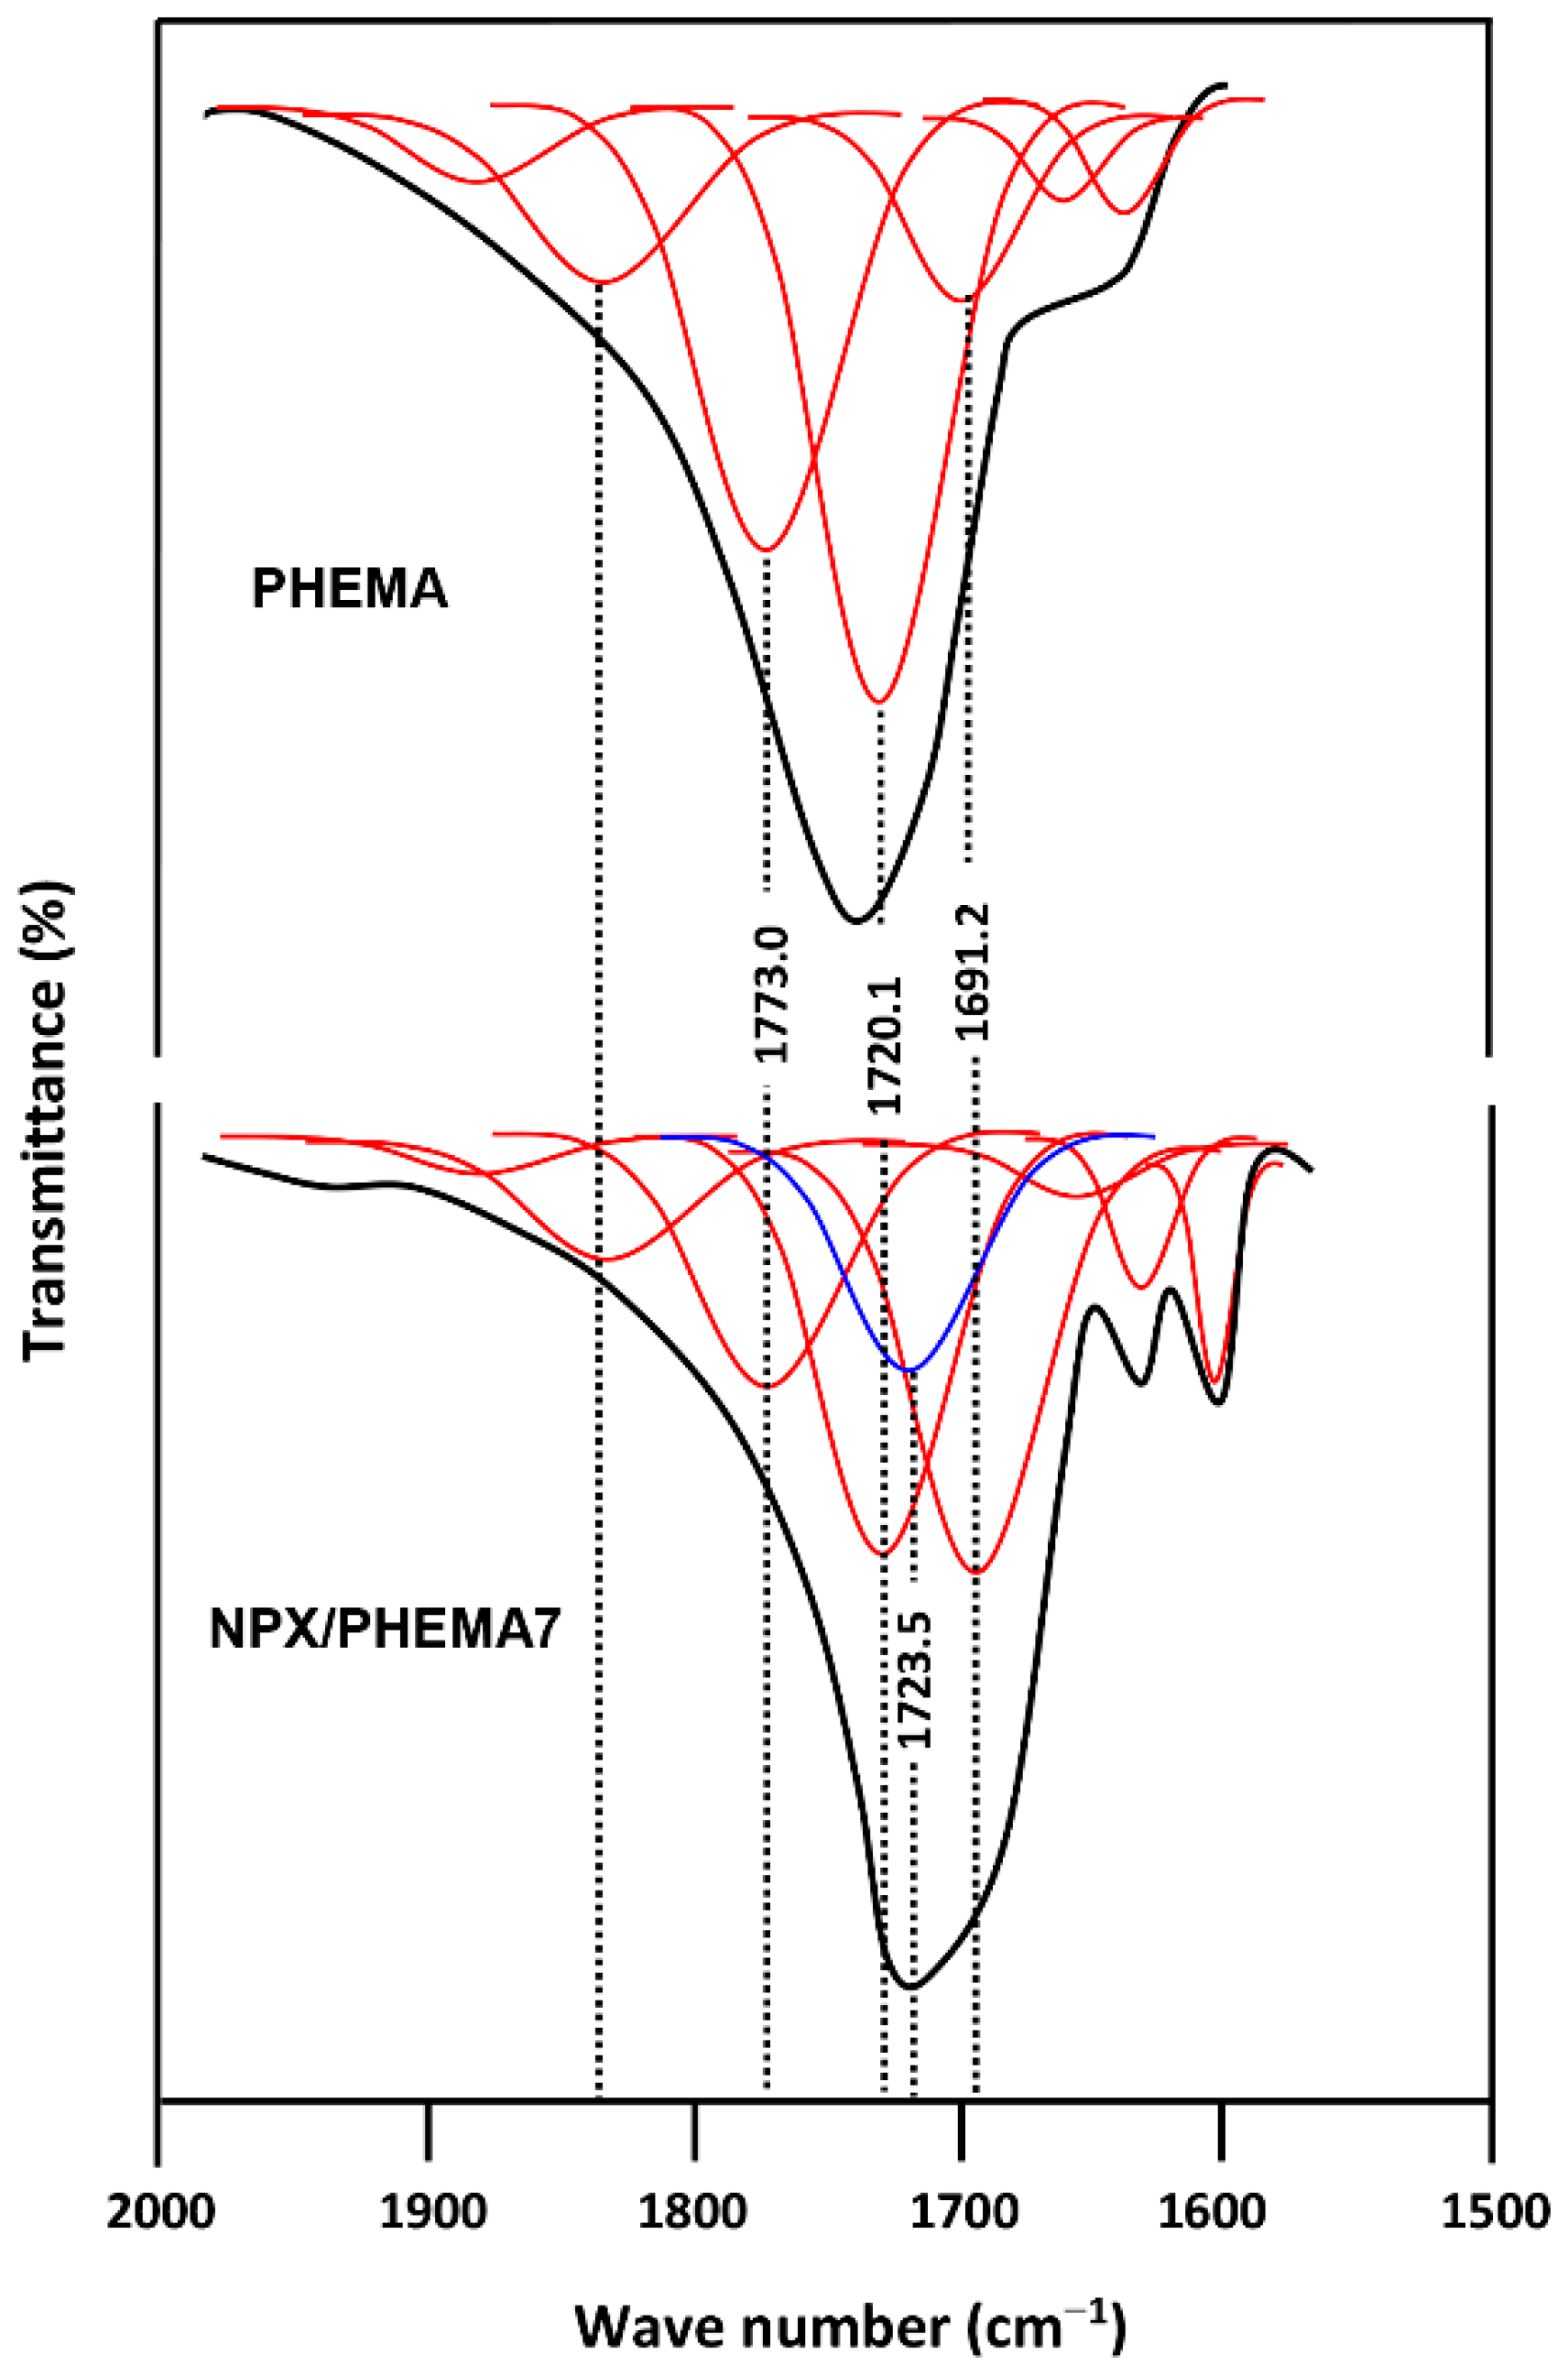
3.4. Drug–Polymer Interactions
3.5. In Vitro Release Dynamic of NPX
3.5.1. Release Kinetics of NPX
3.5.2. Enhancement of NPX Solubility
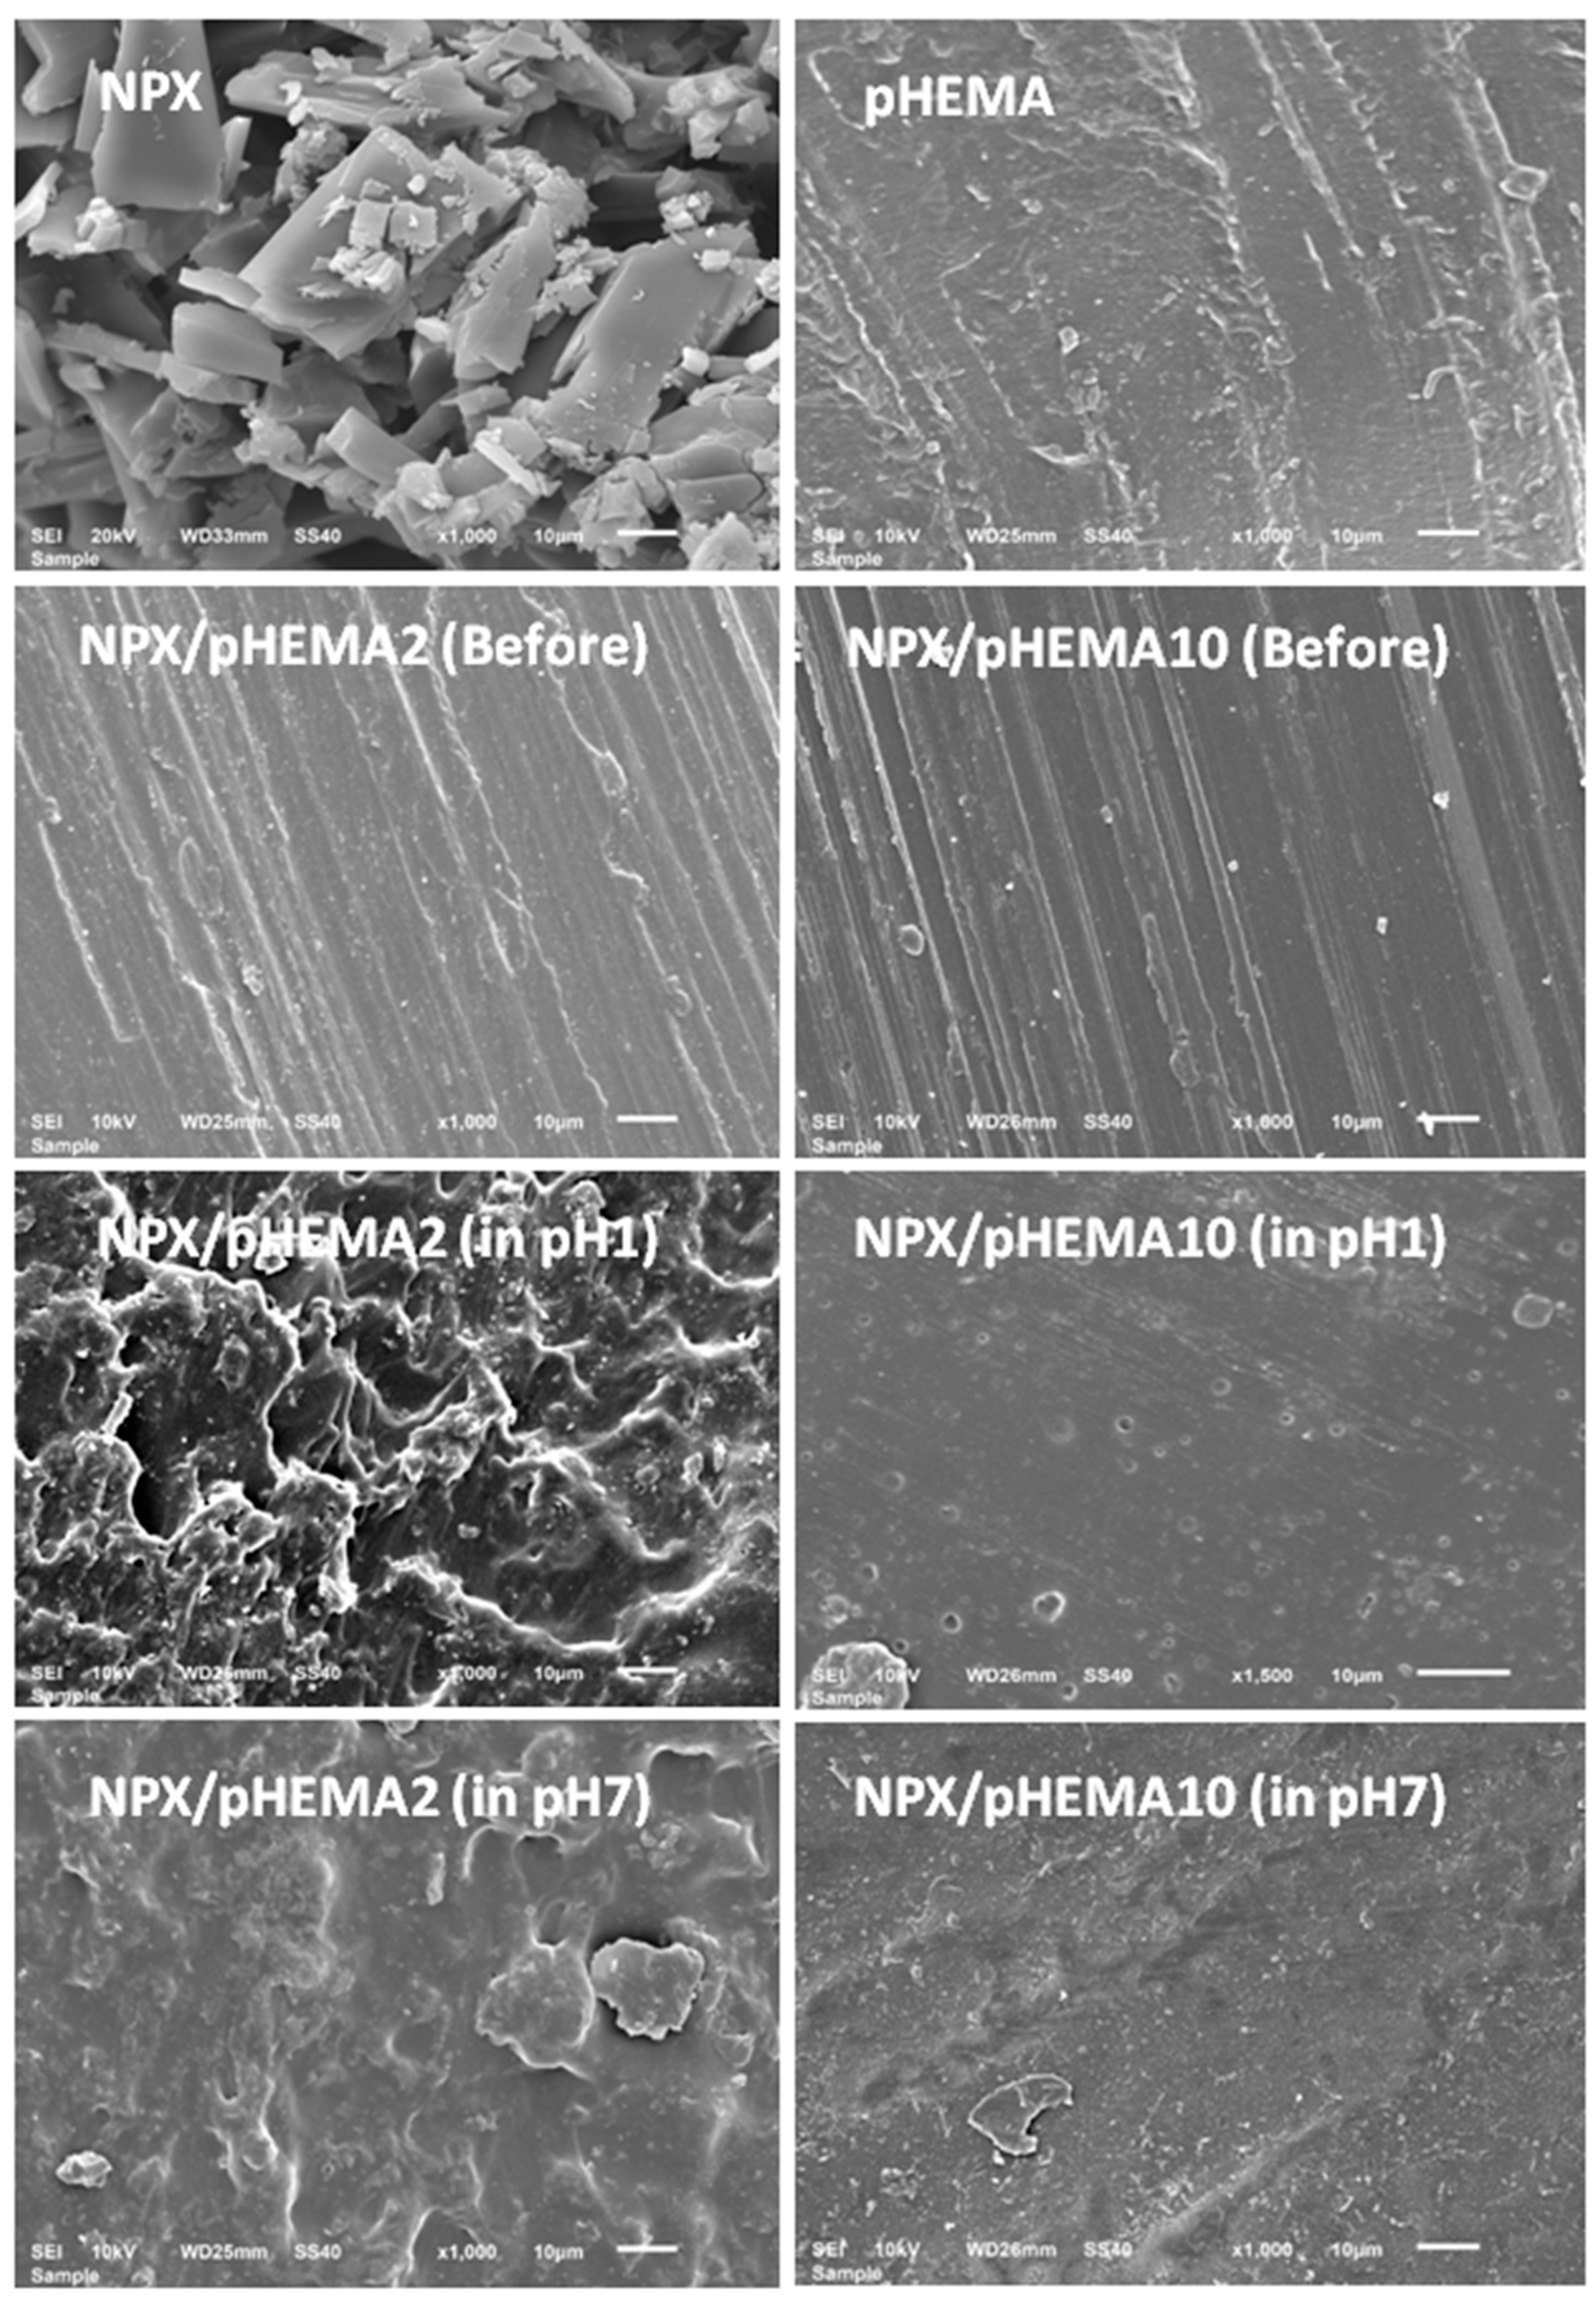
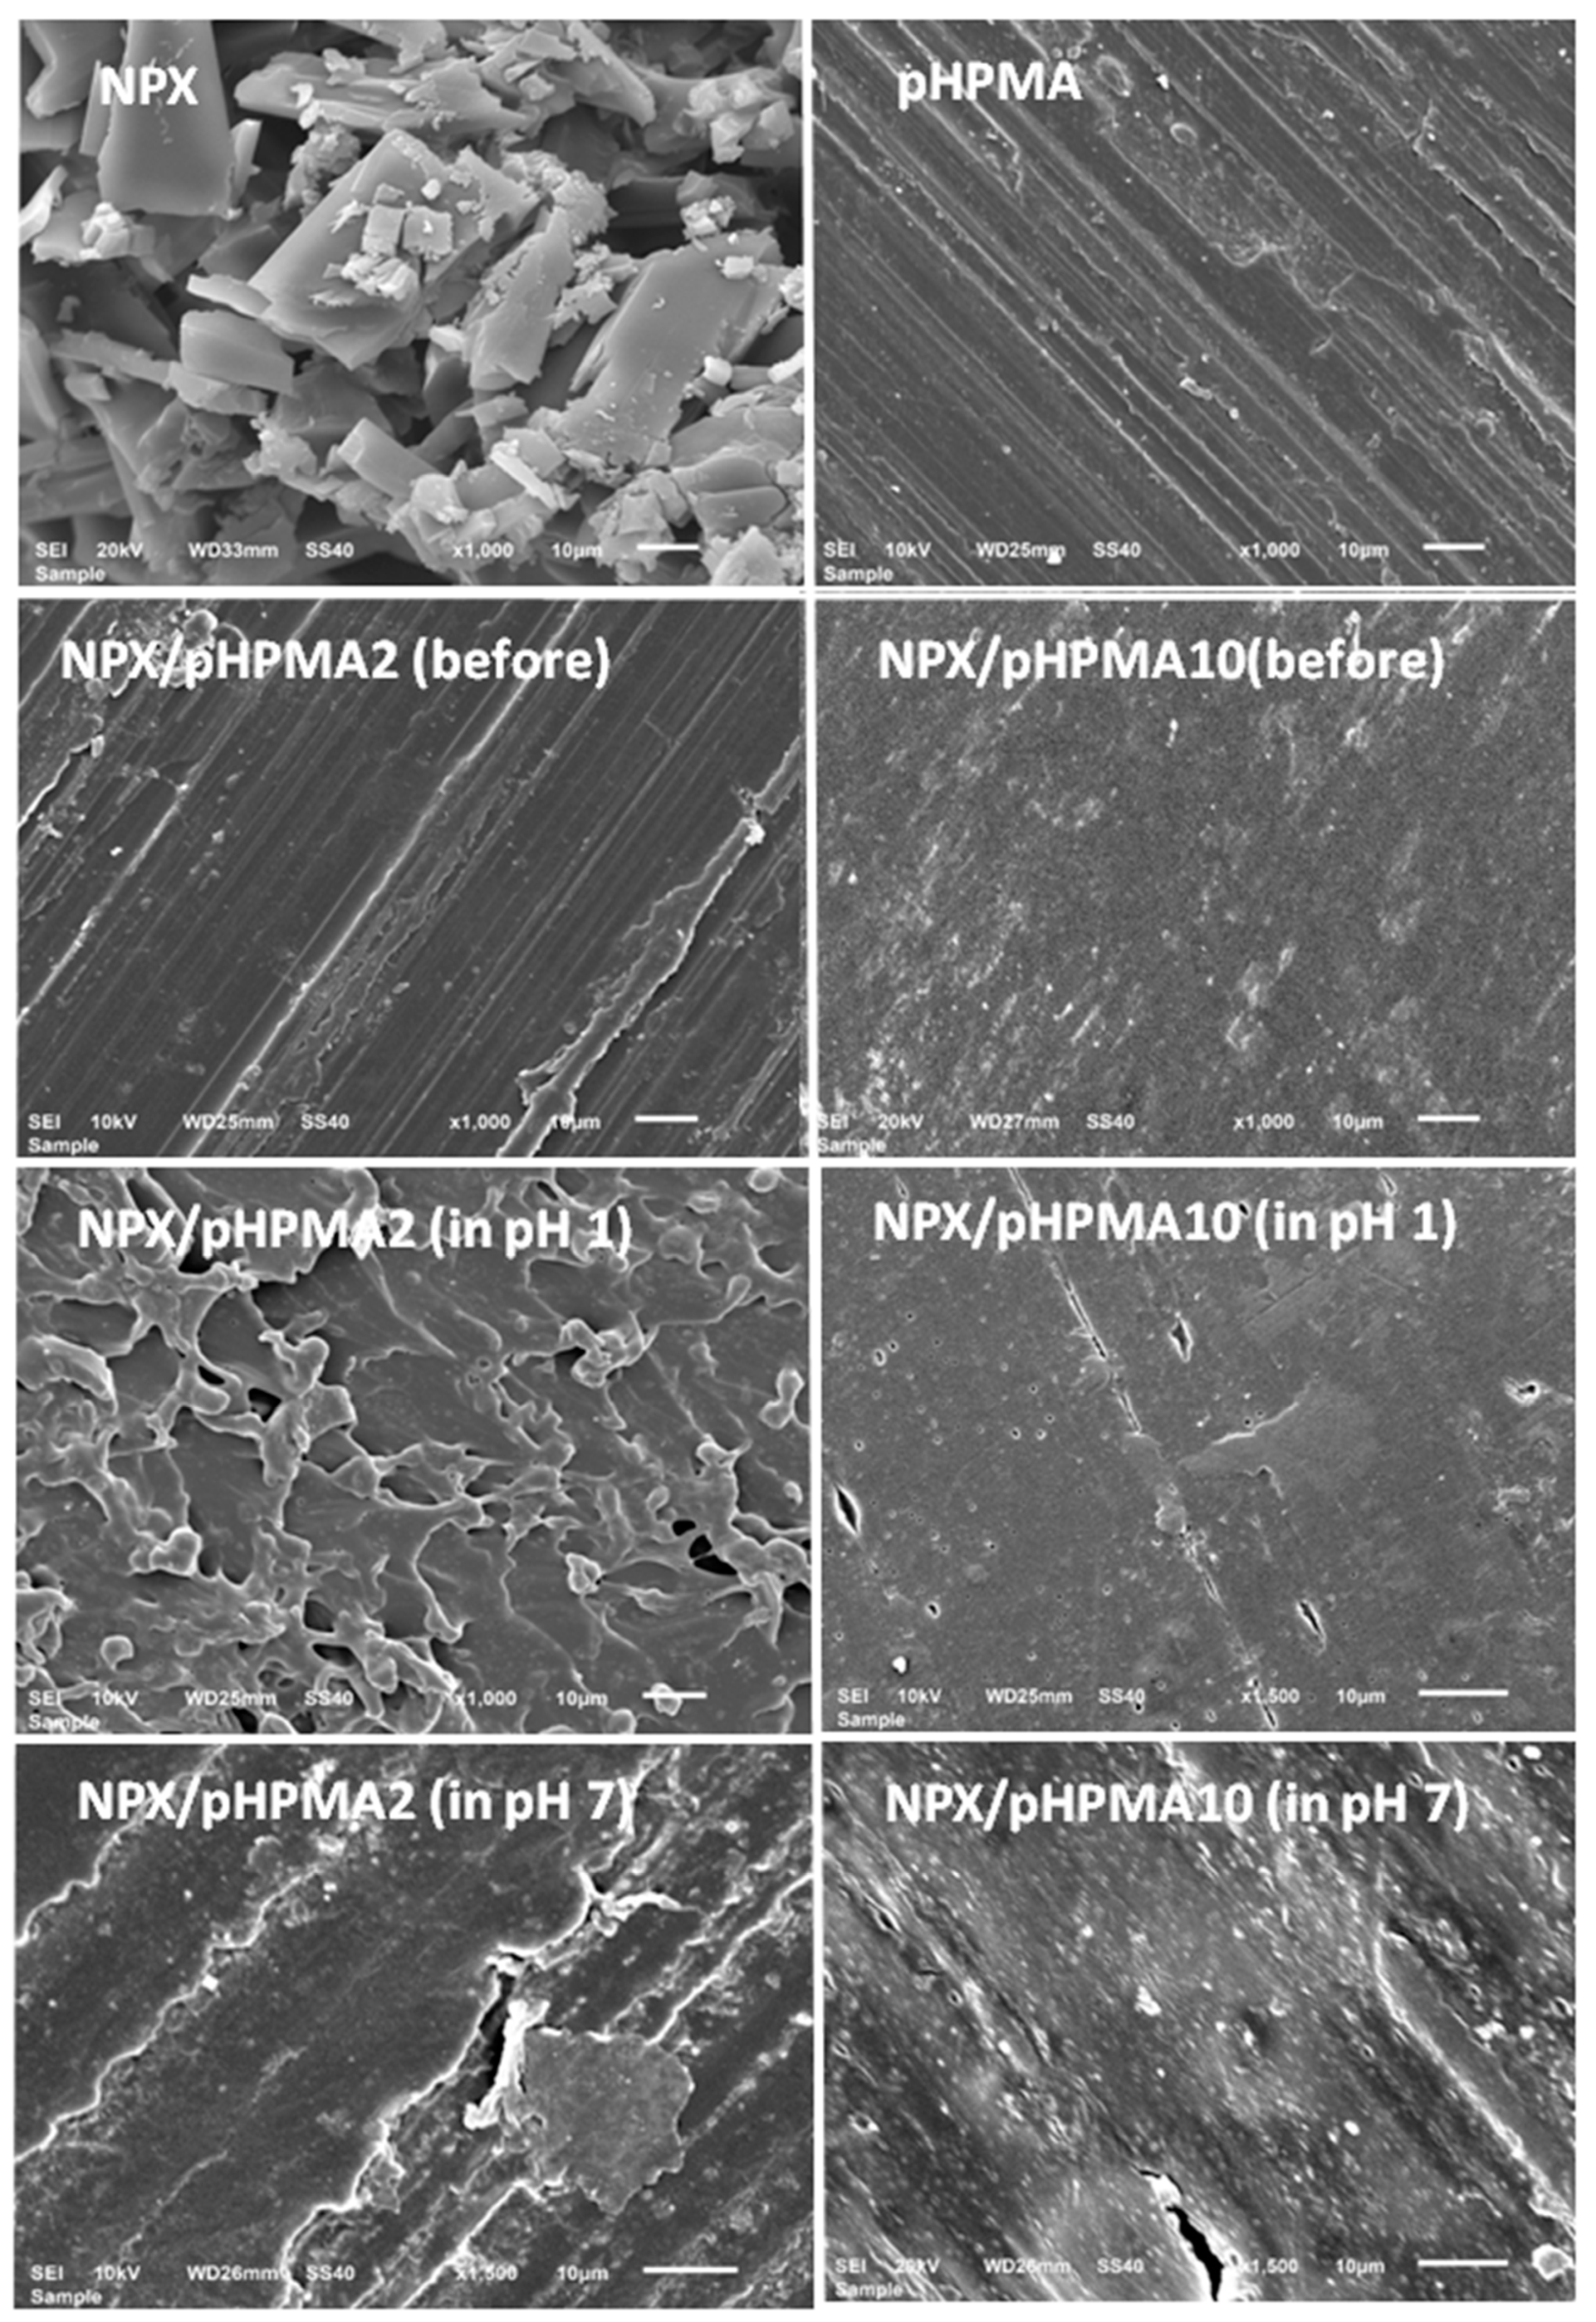
3.5.3. Surface Morphology
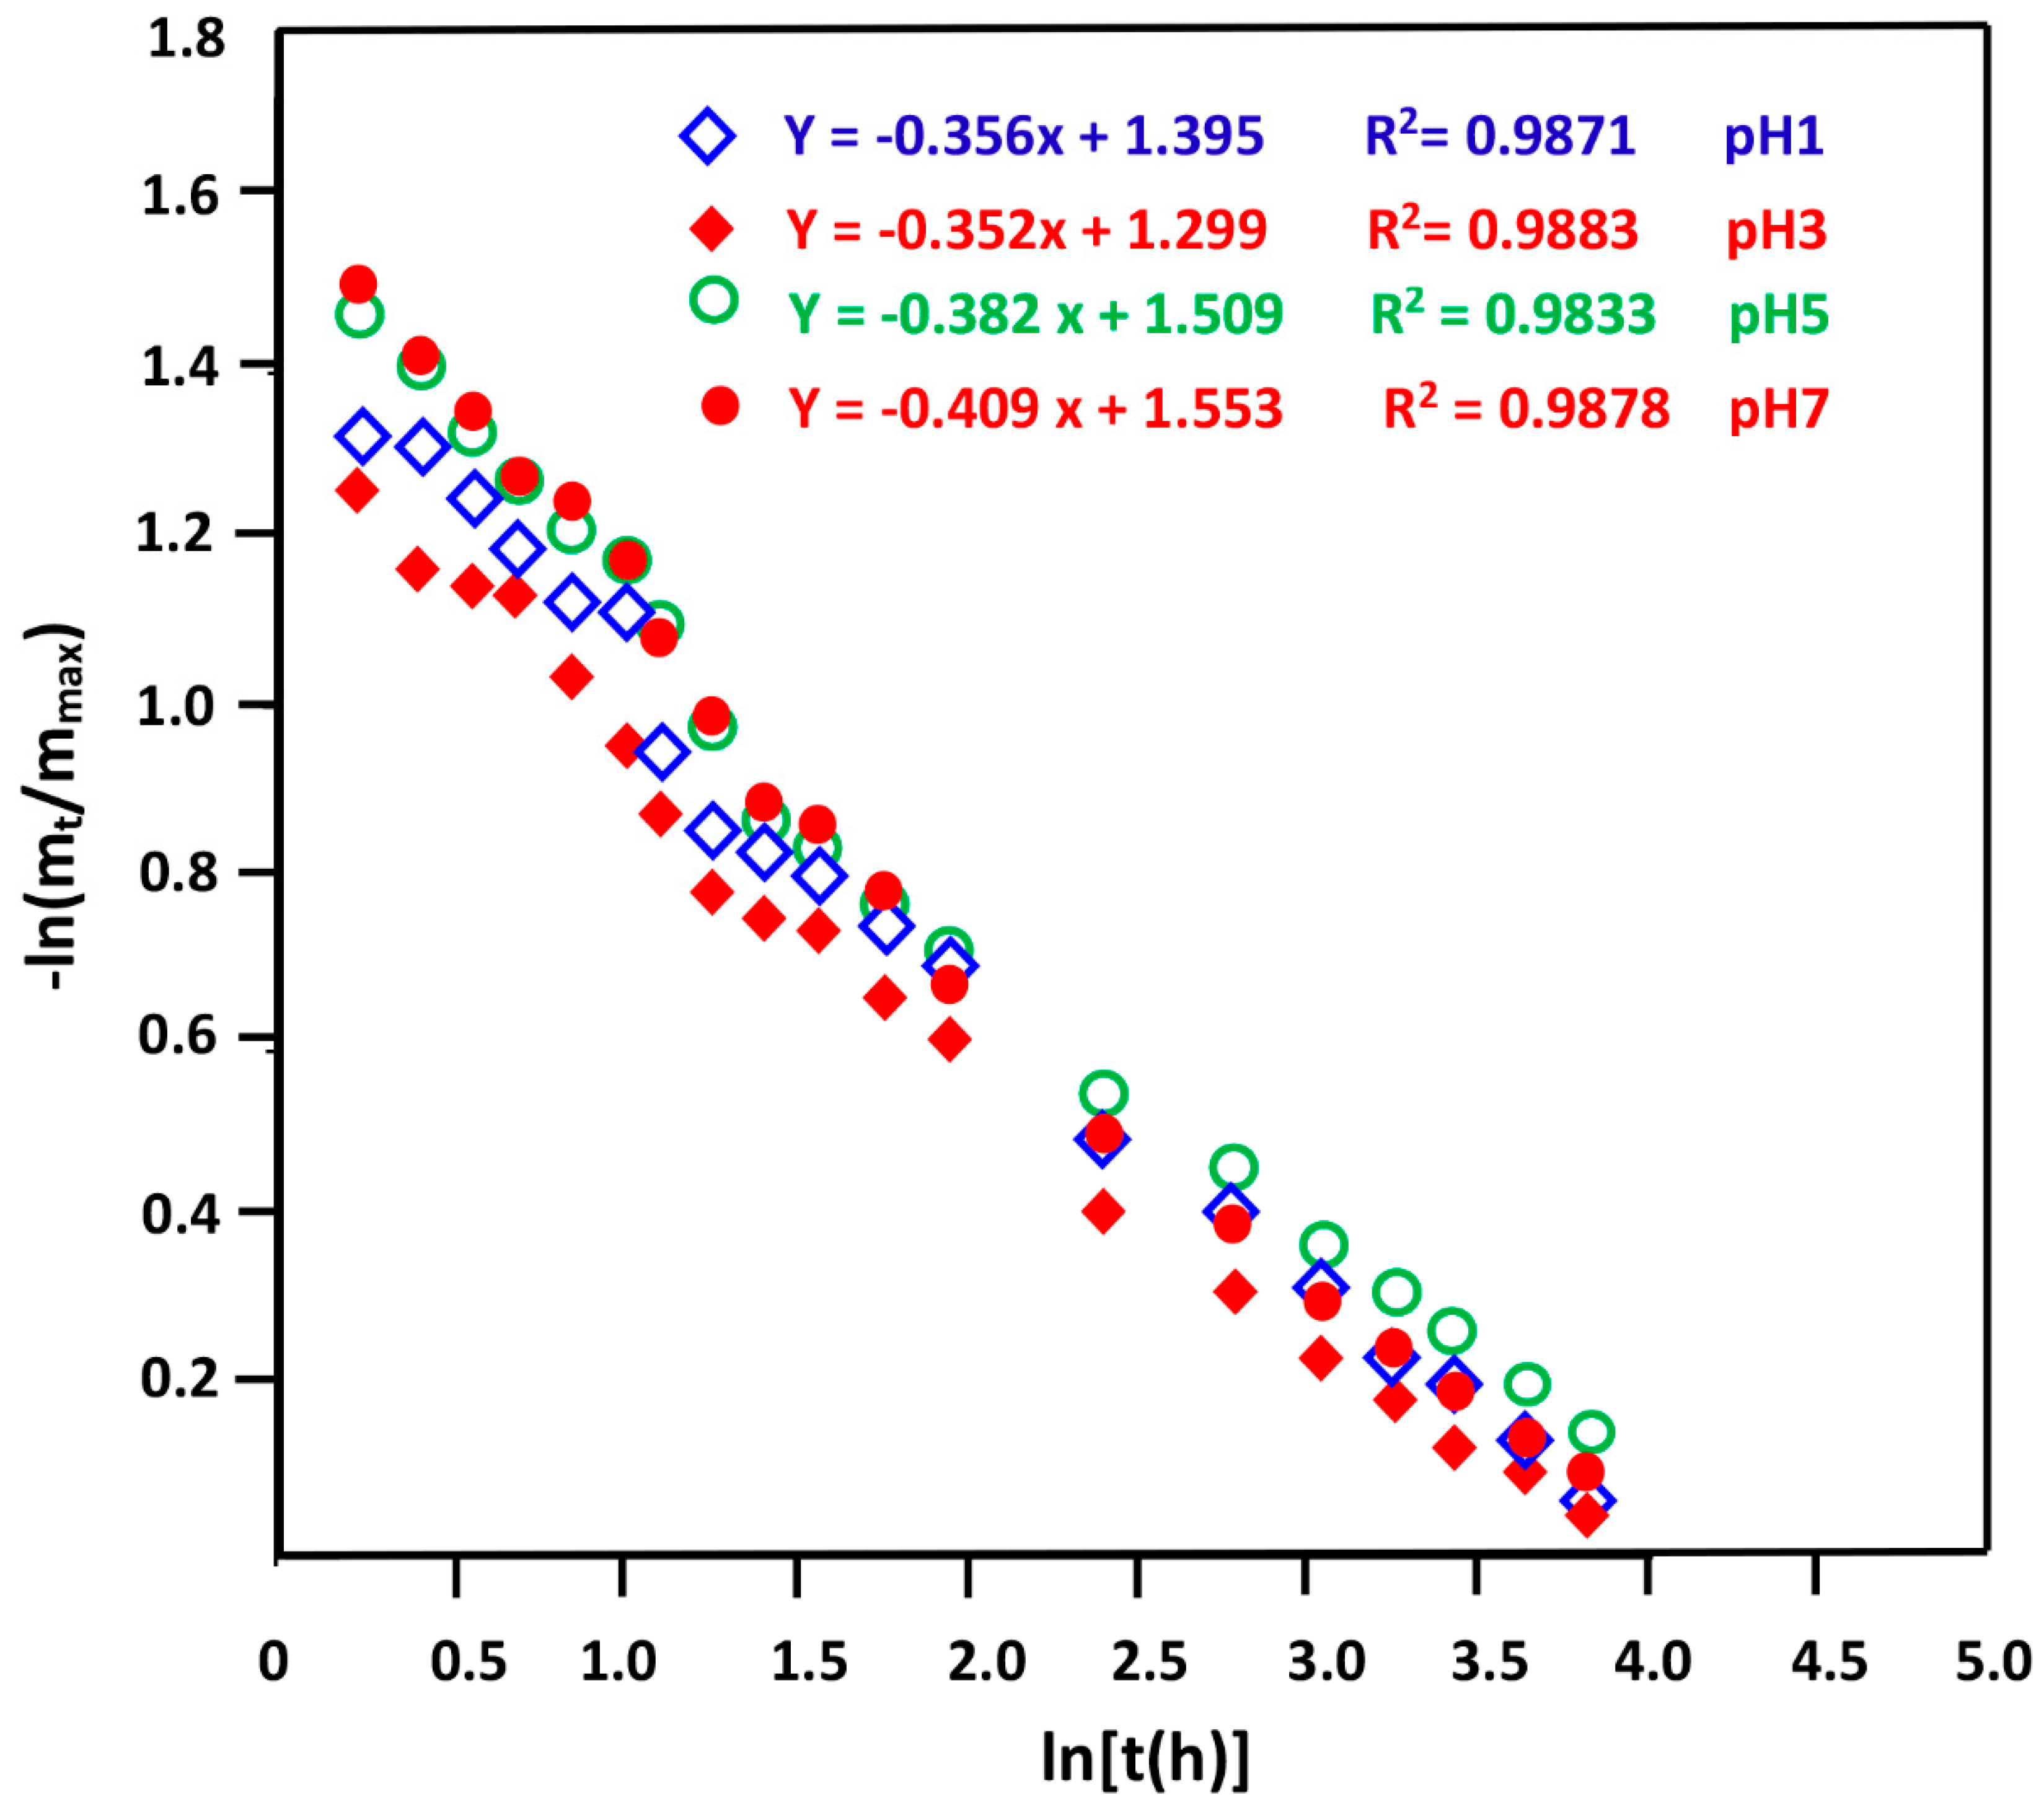
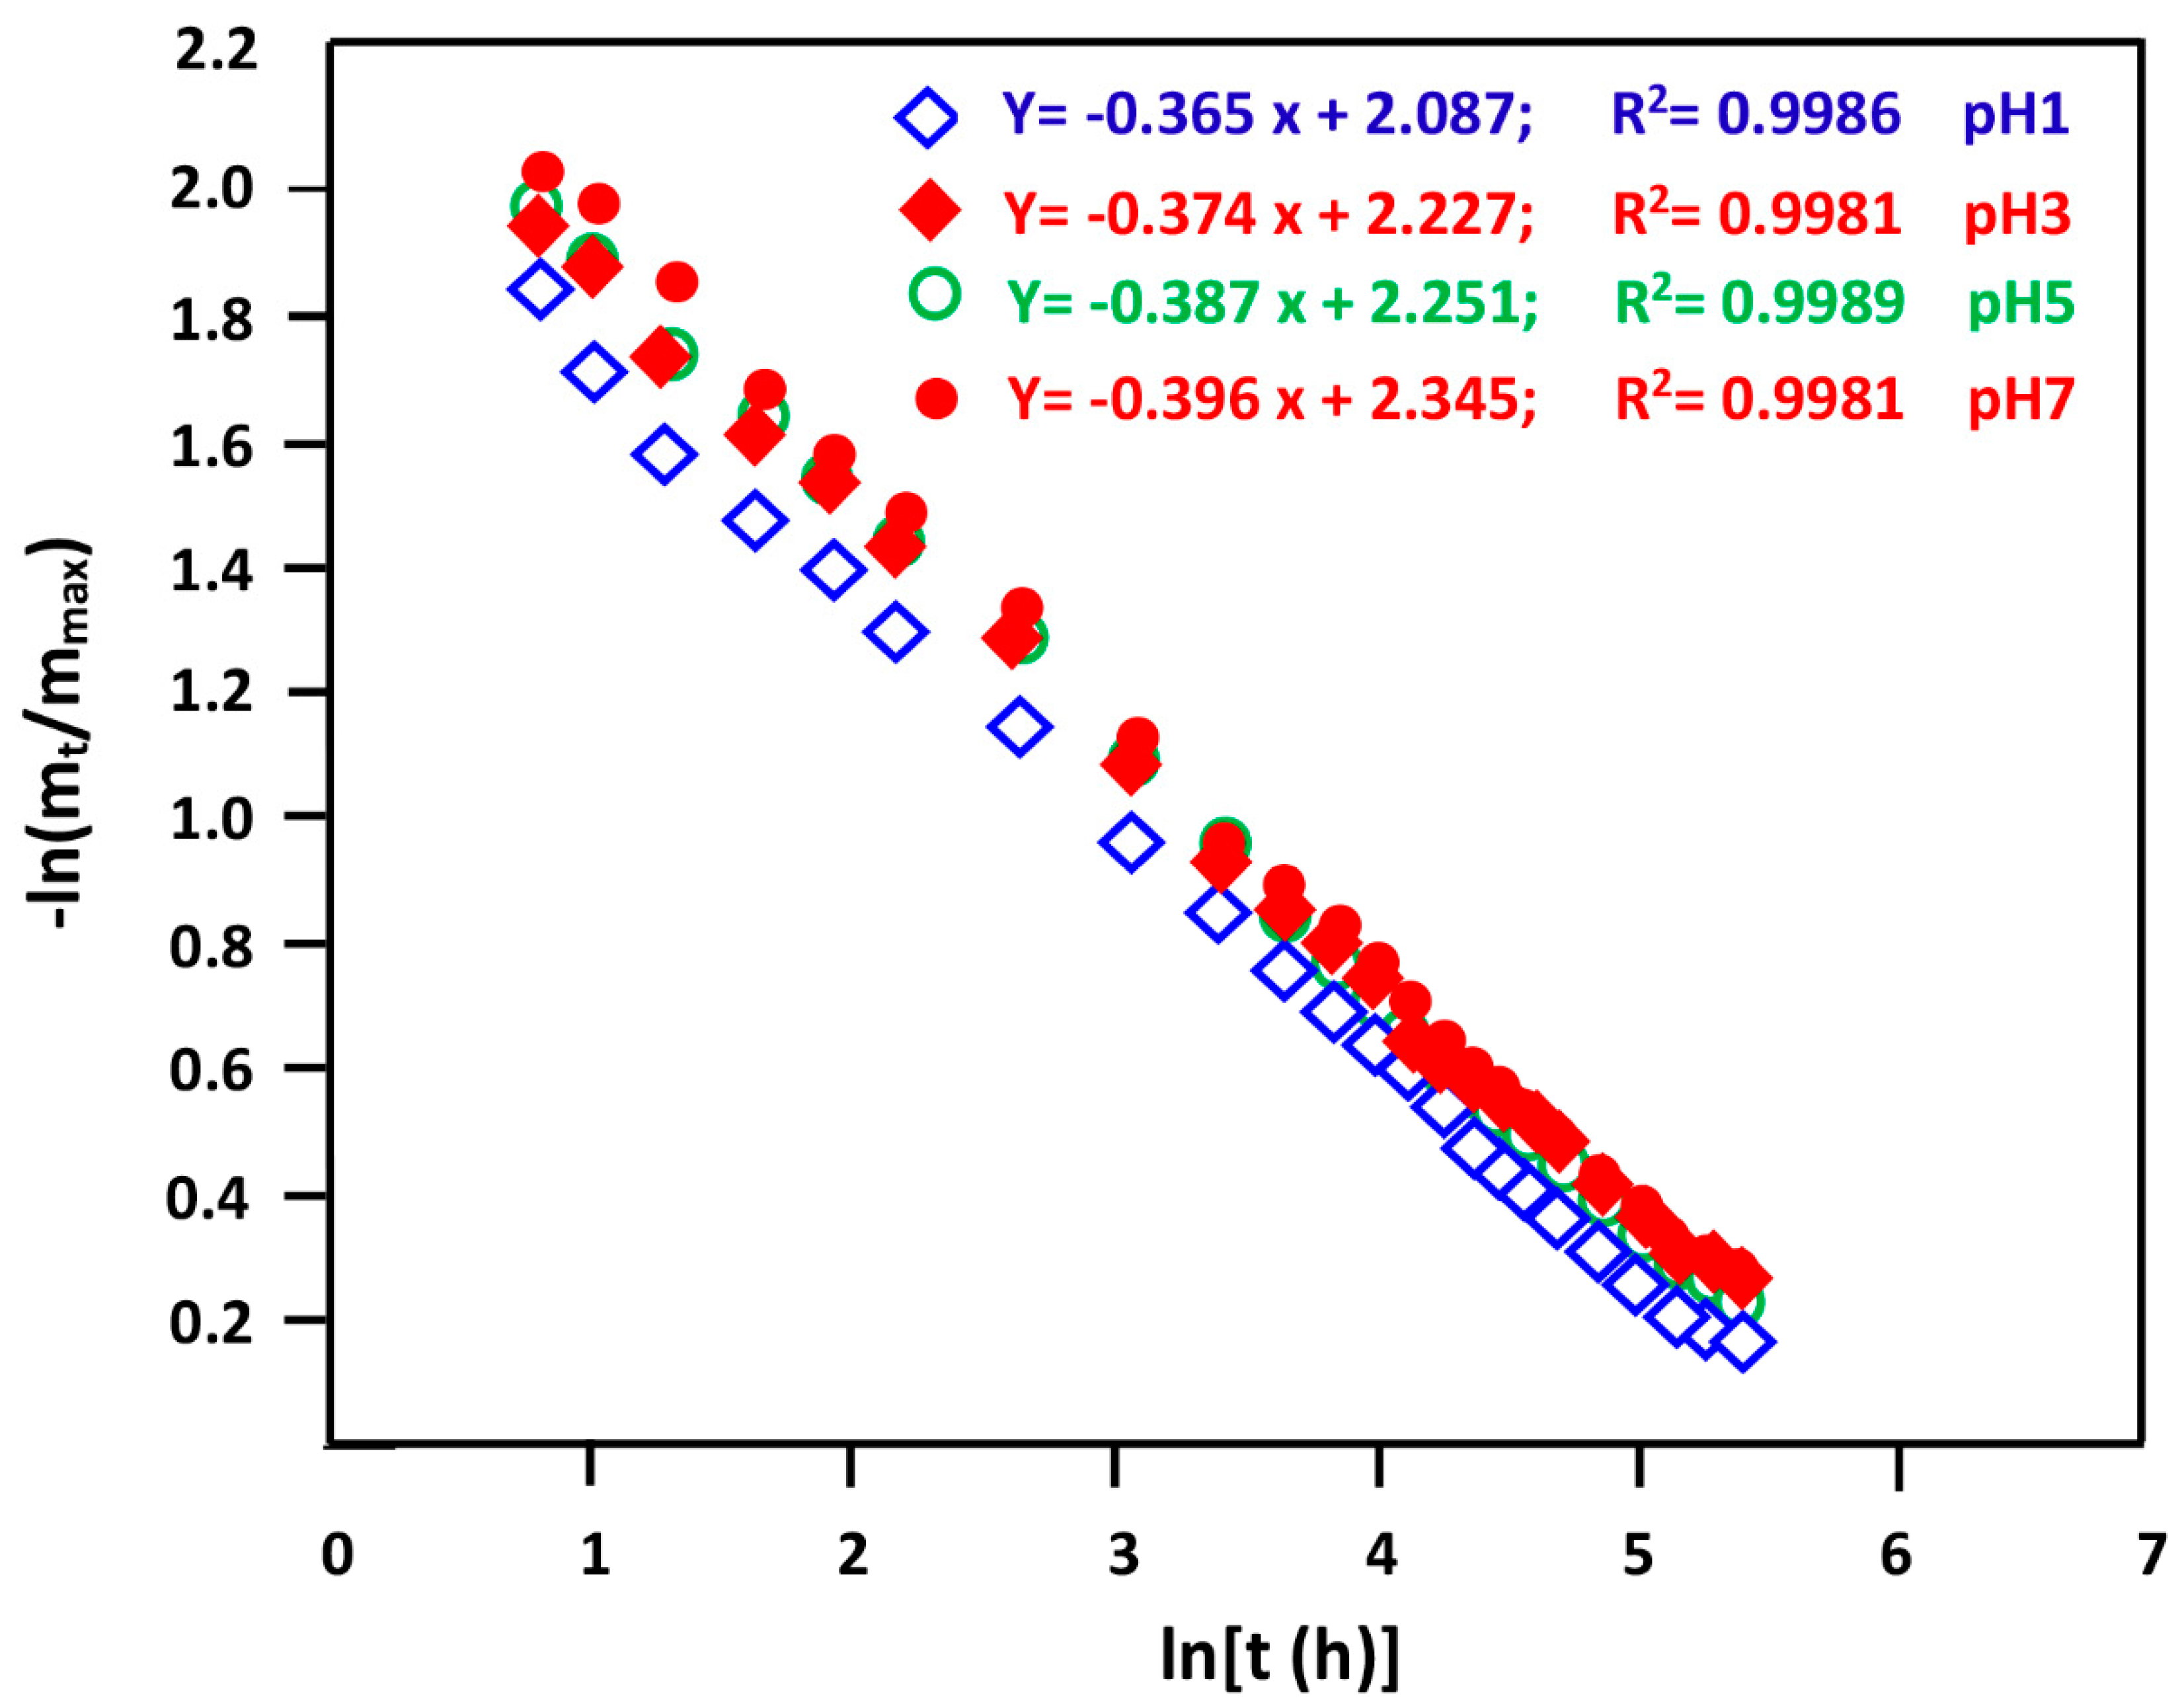
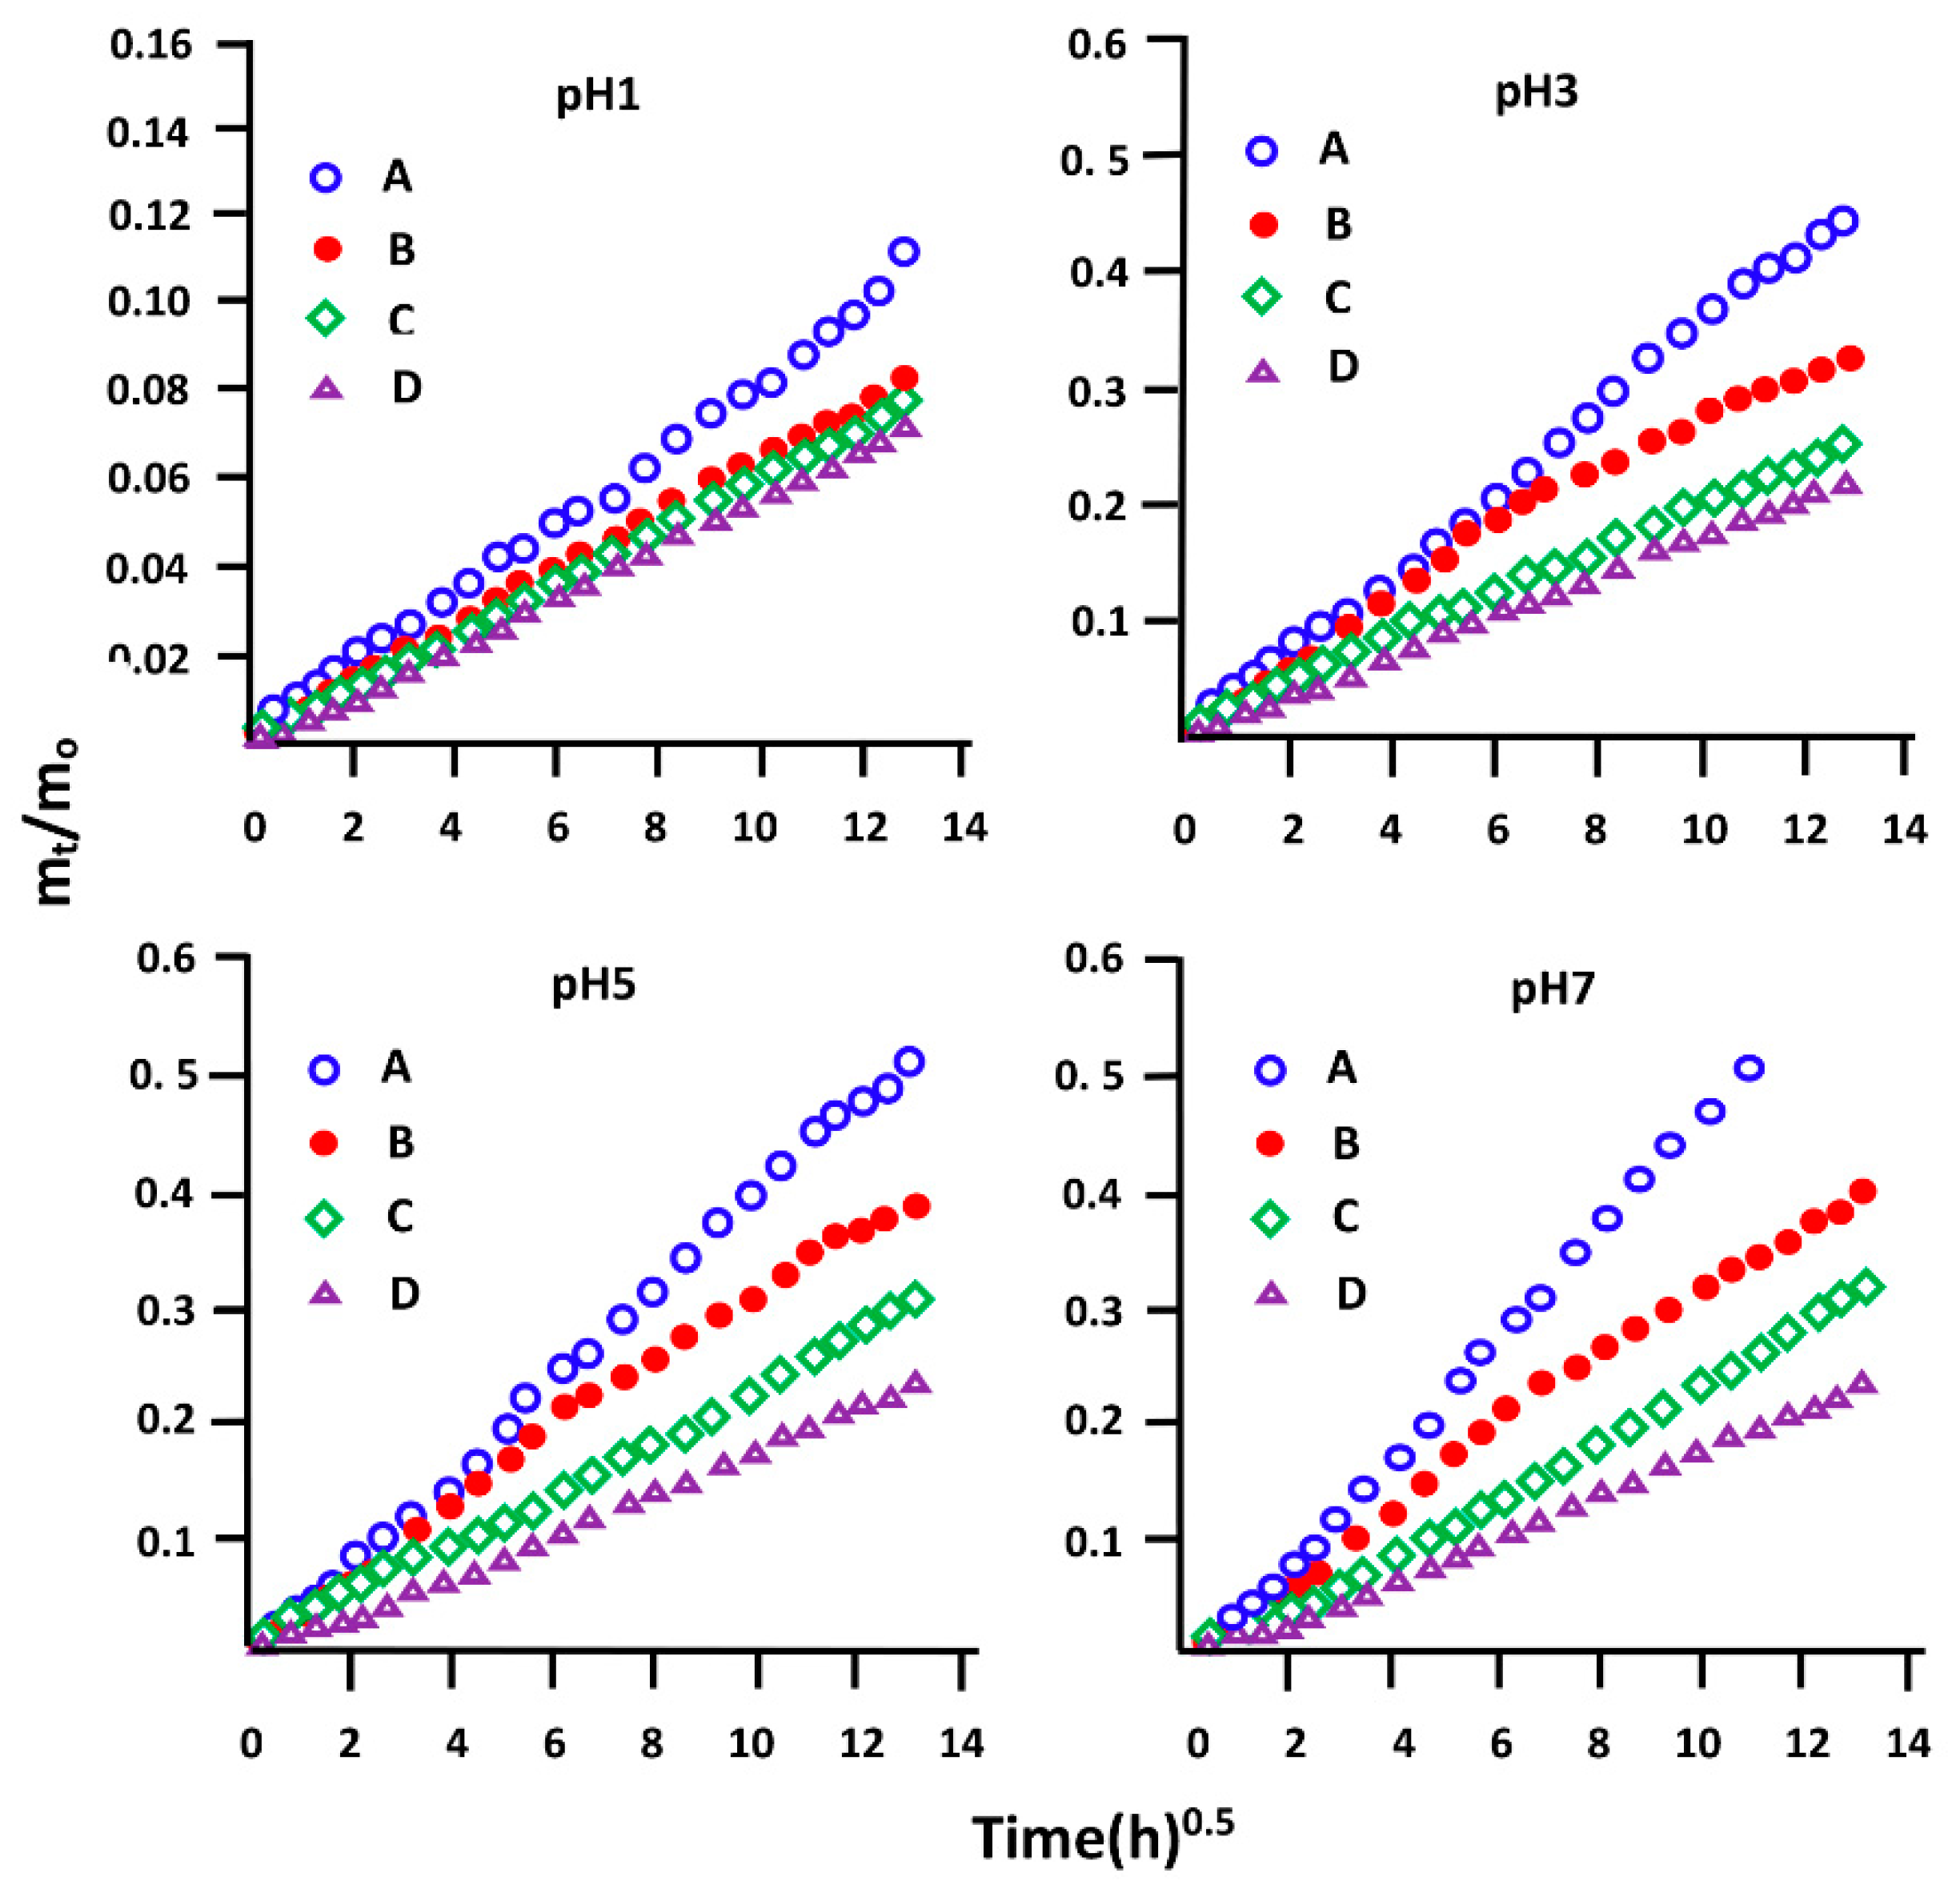
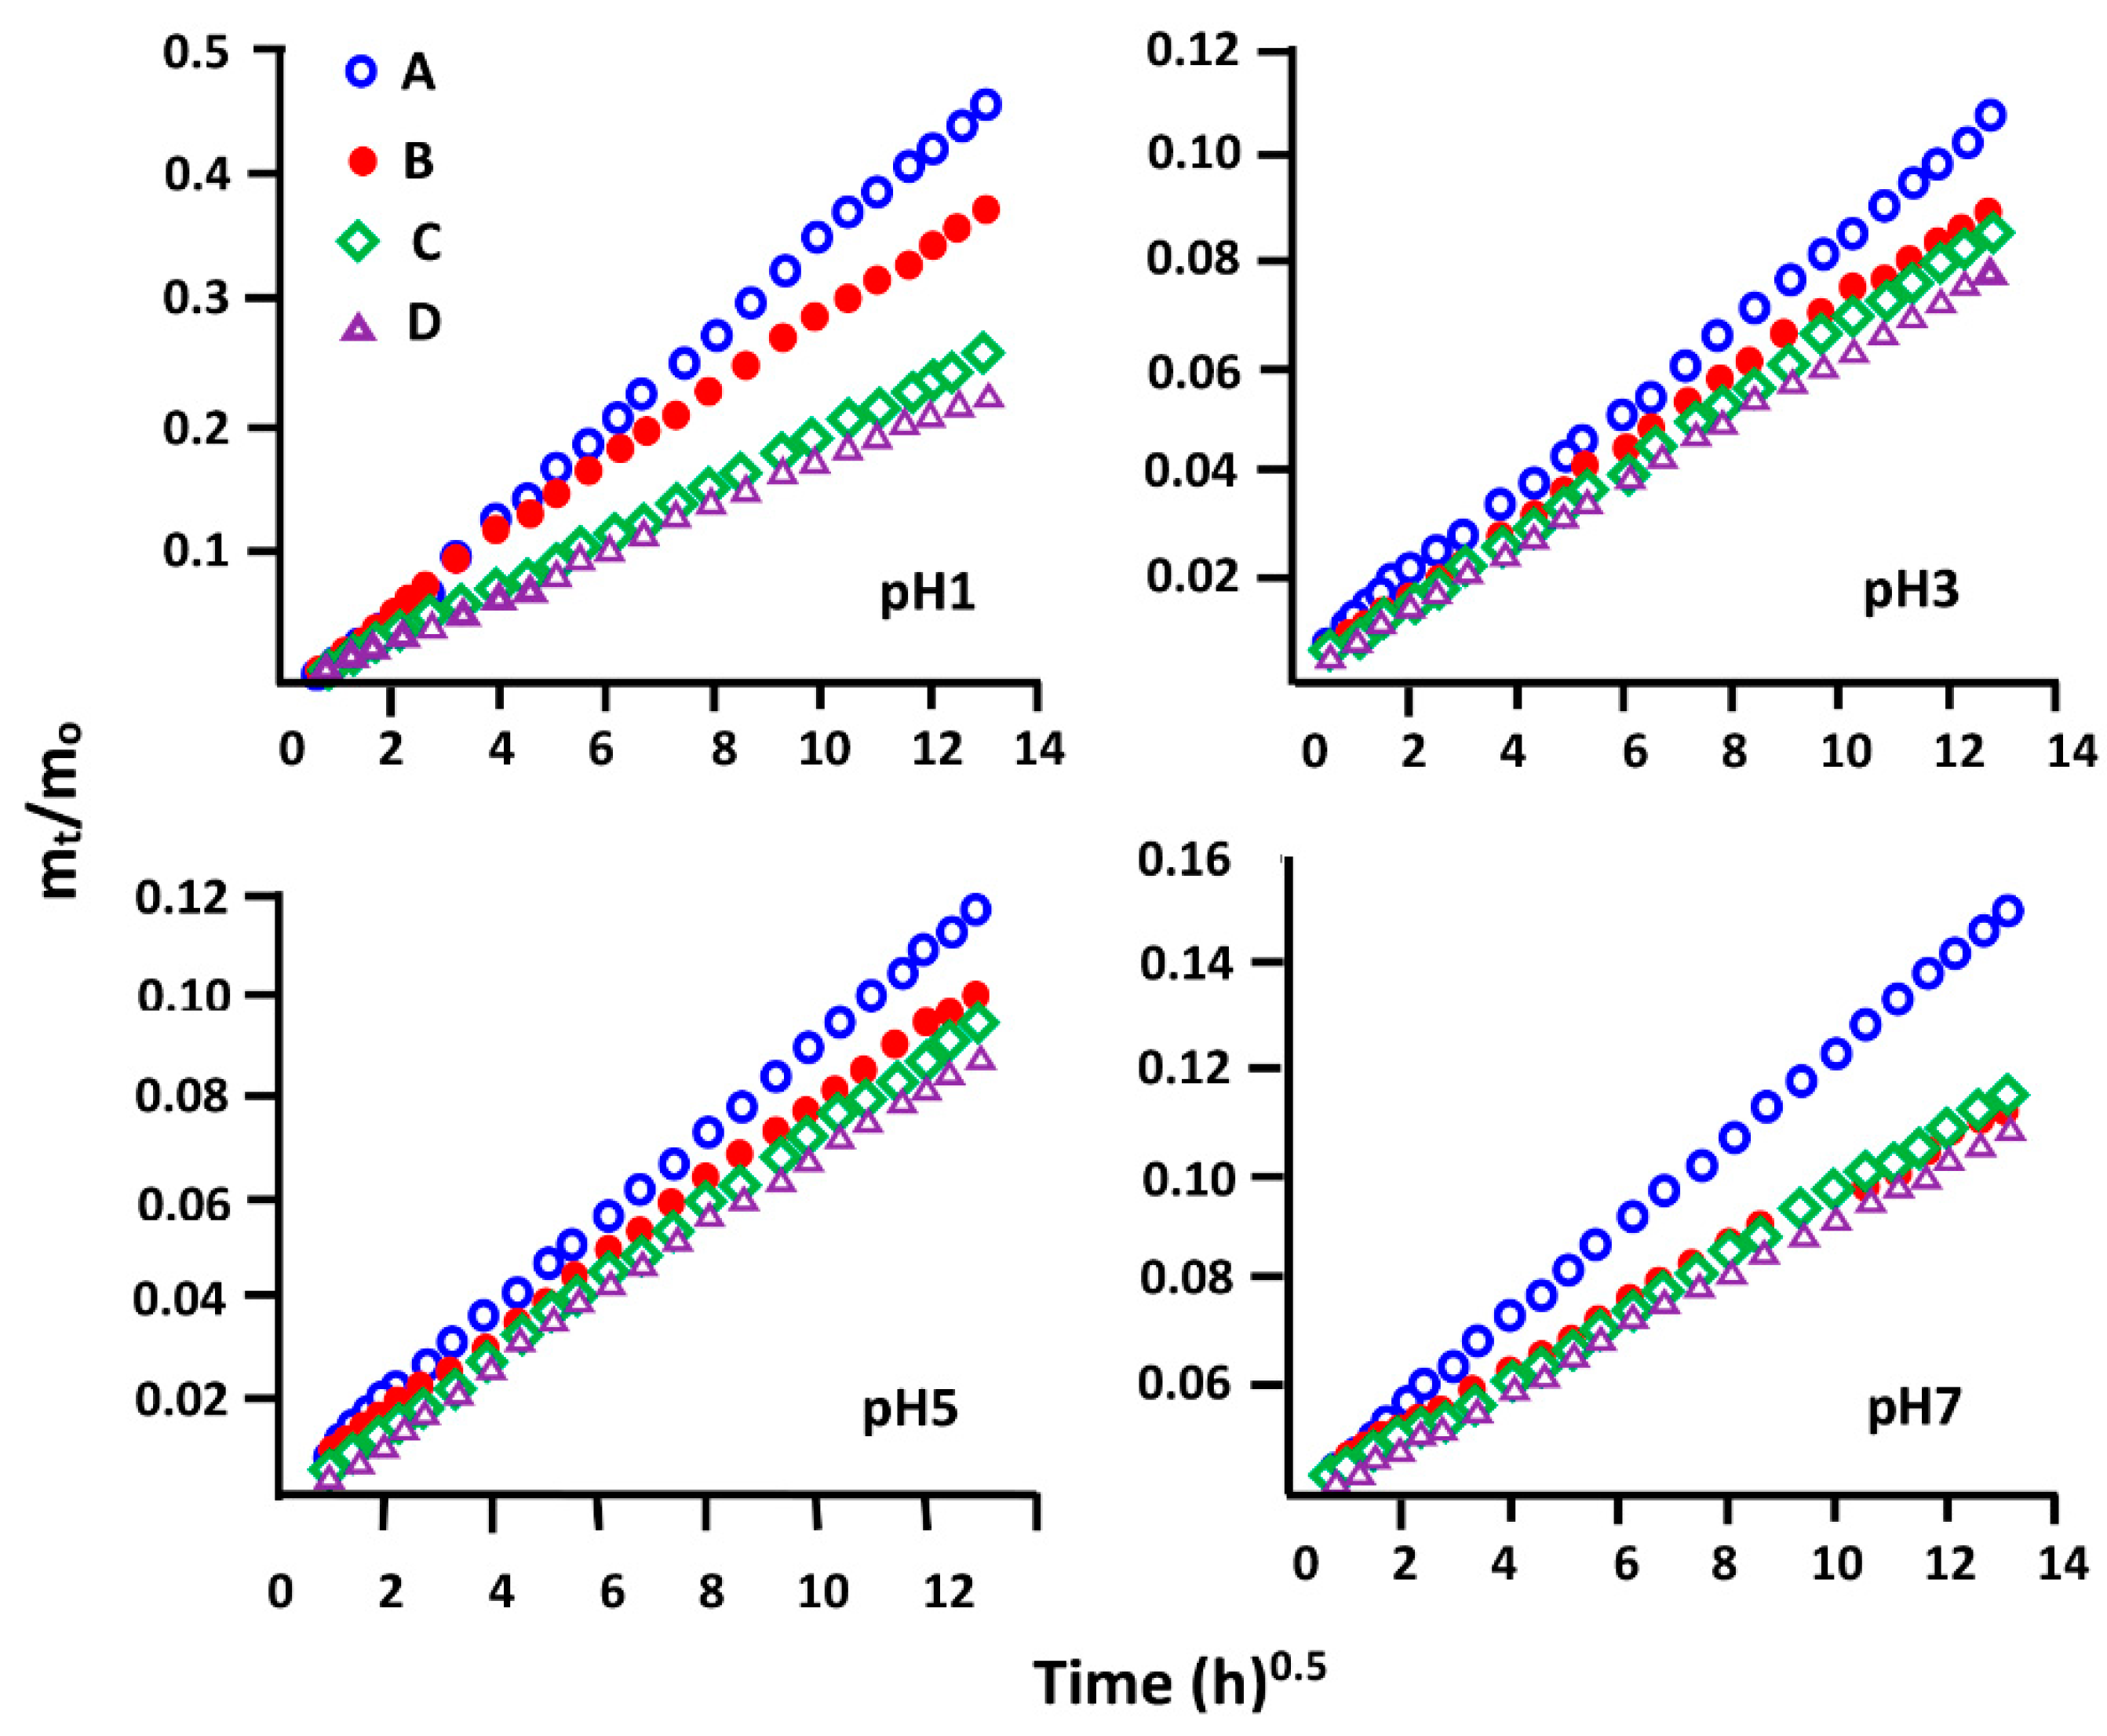
3.5.4. Diffusion Behavior of NPX
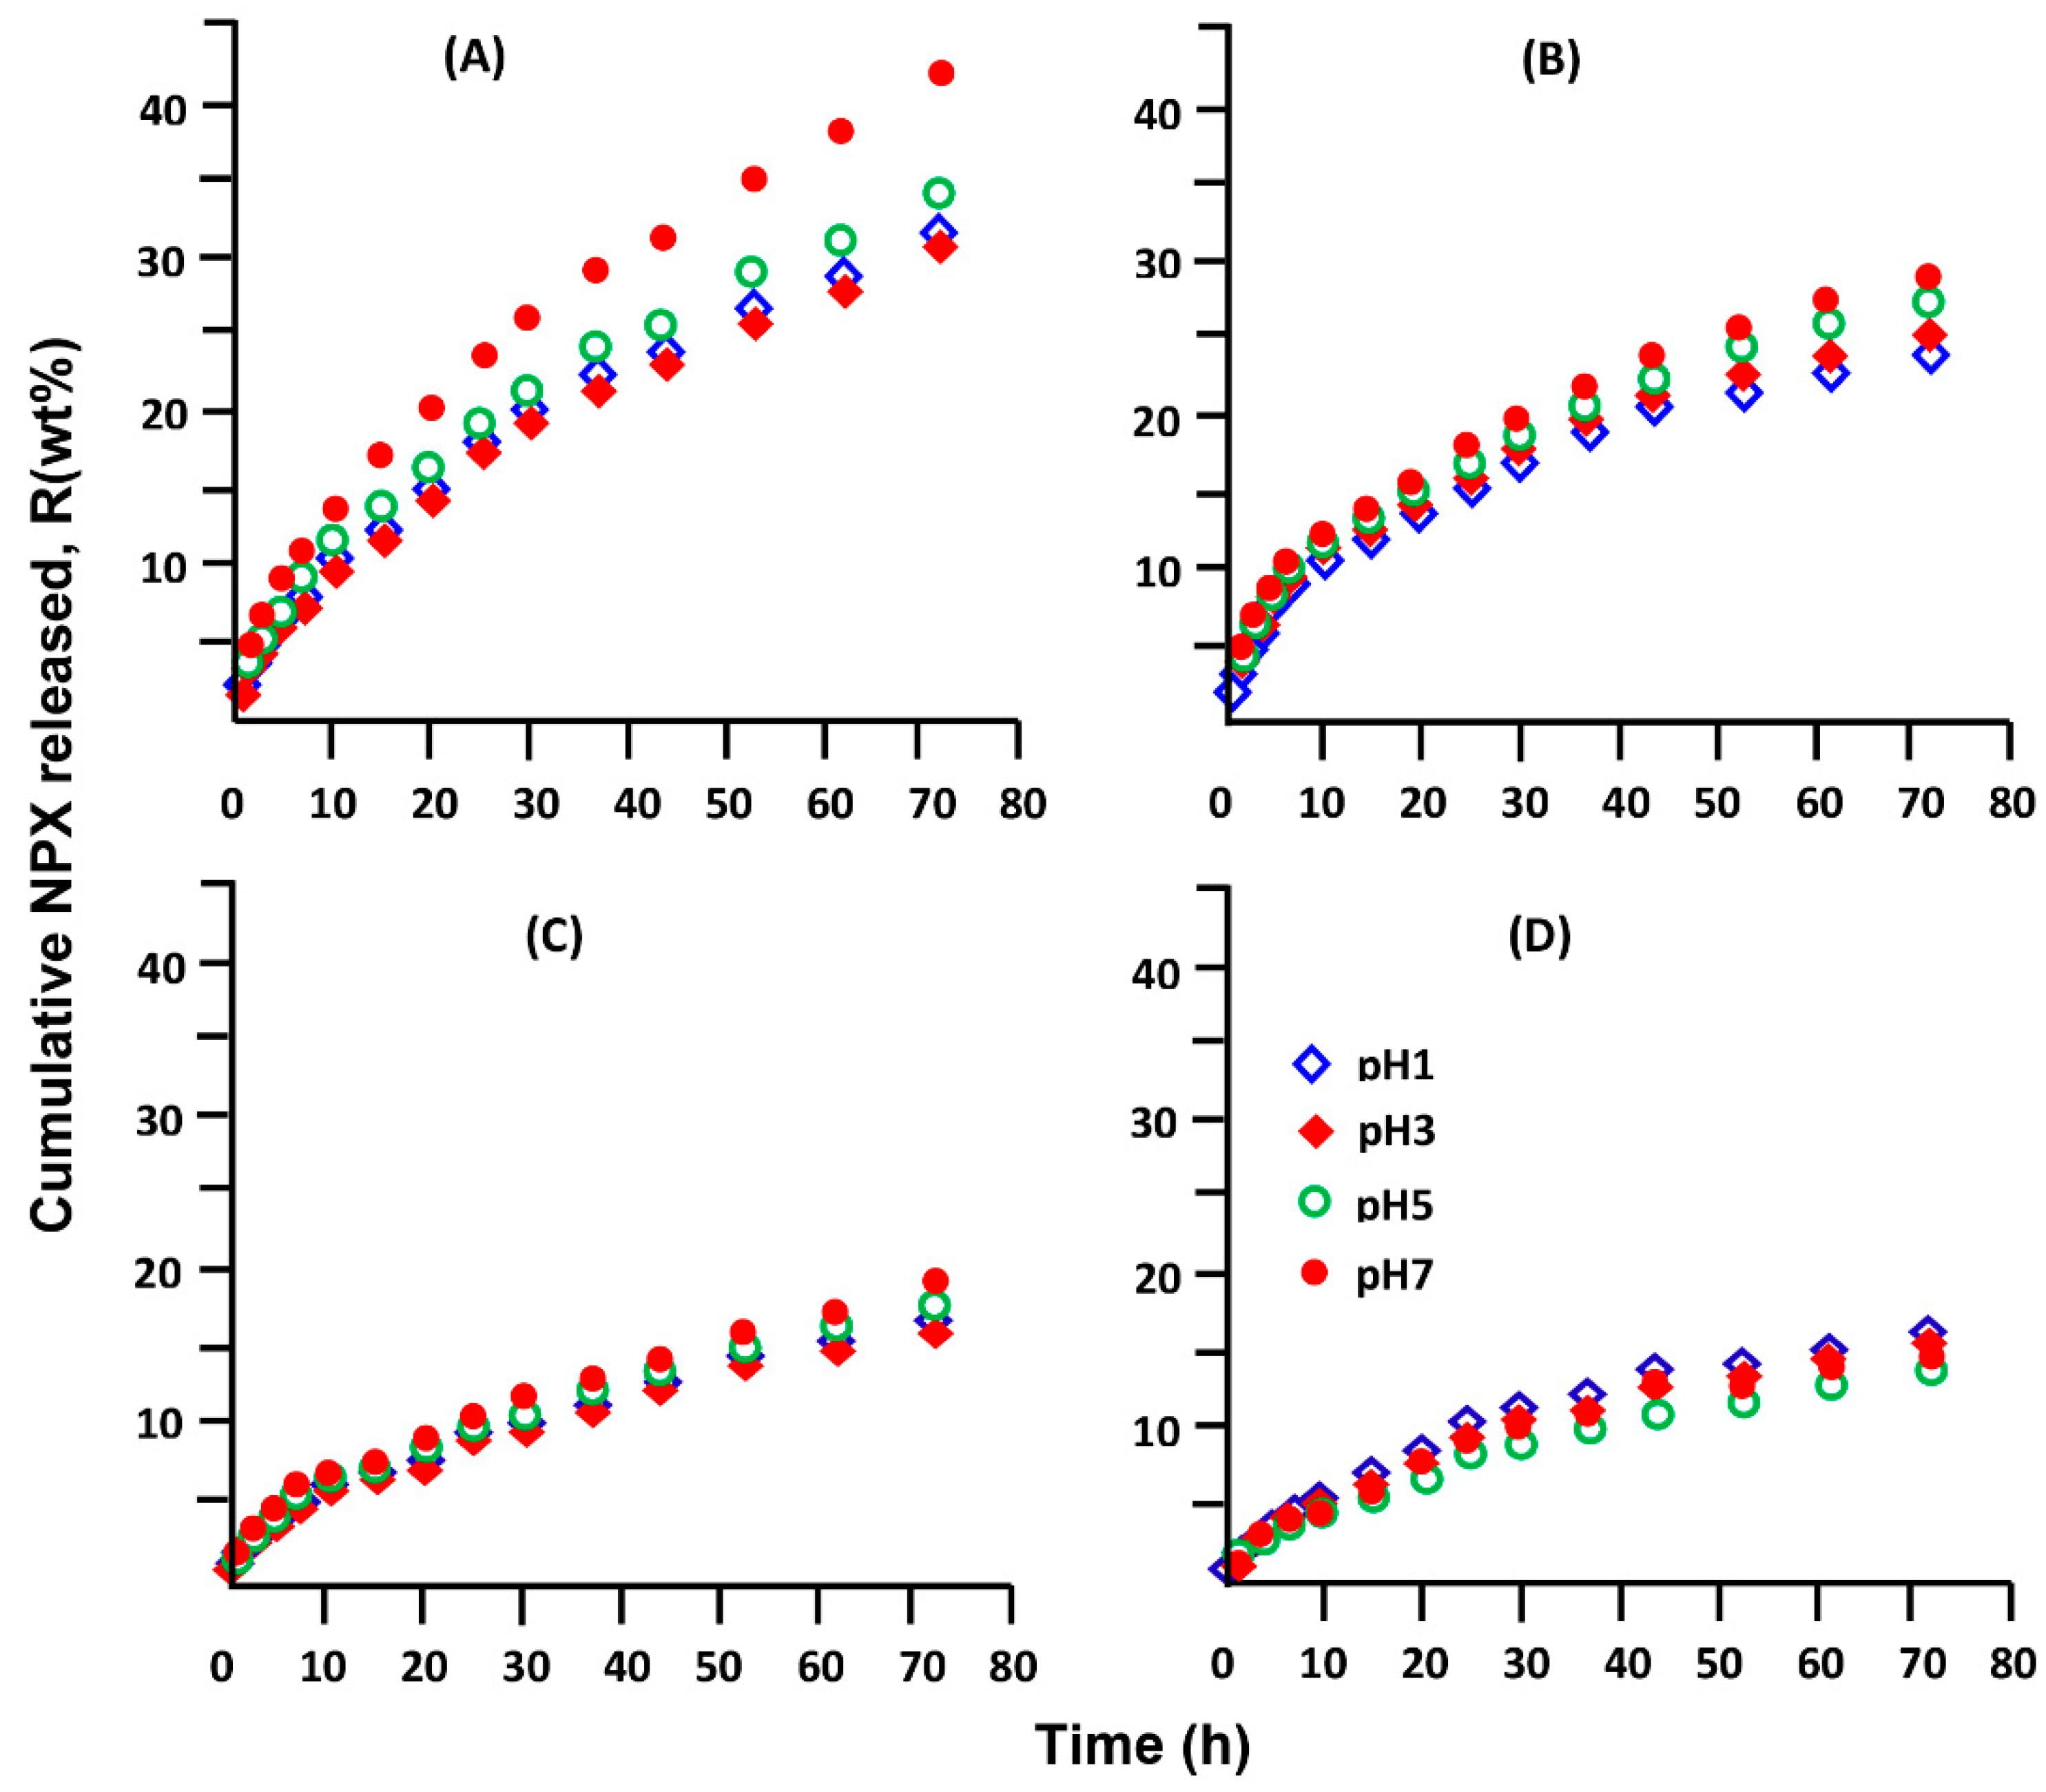
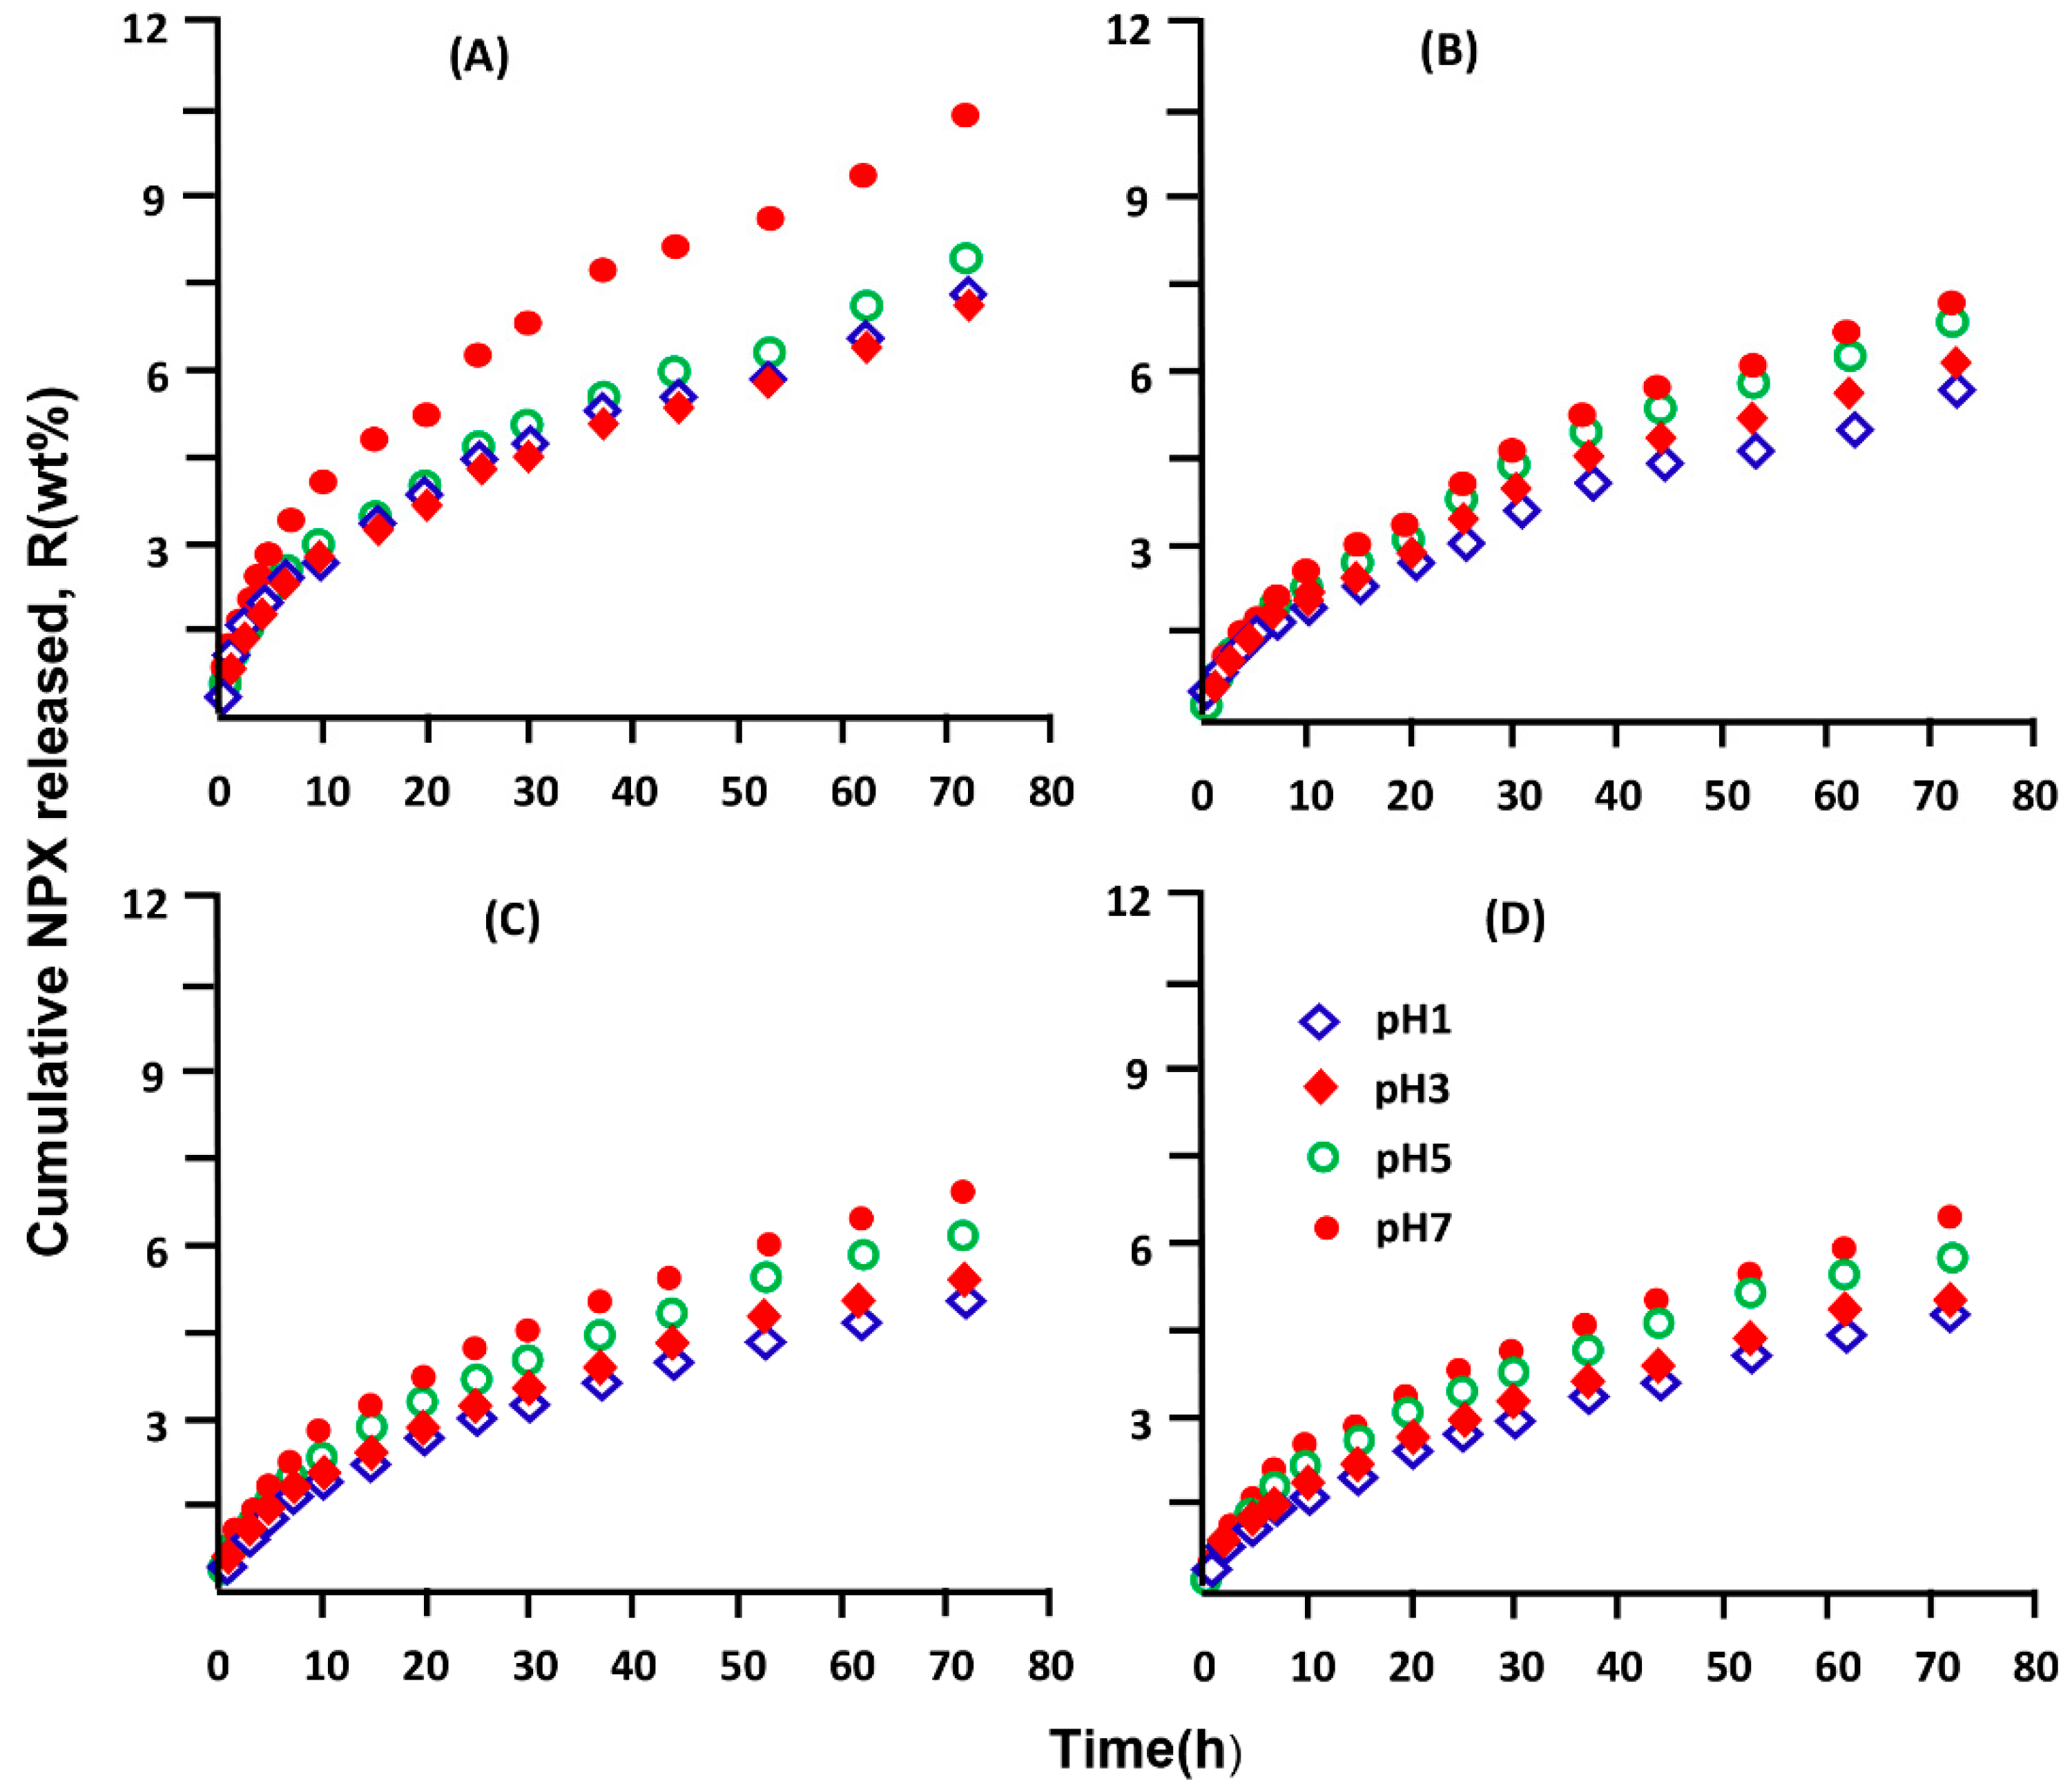
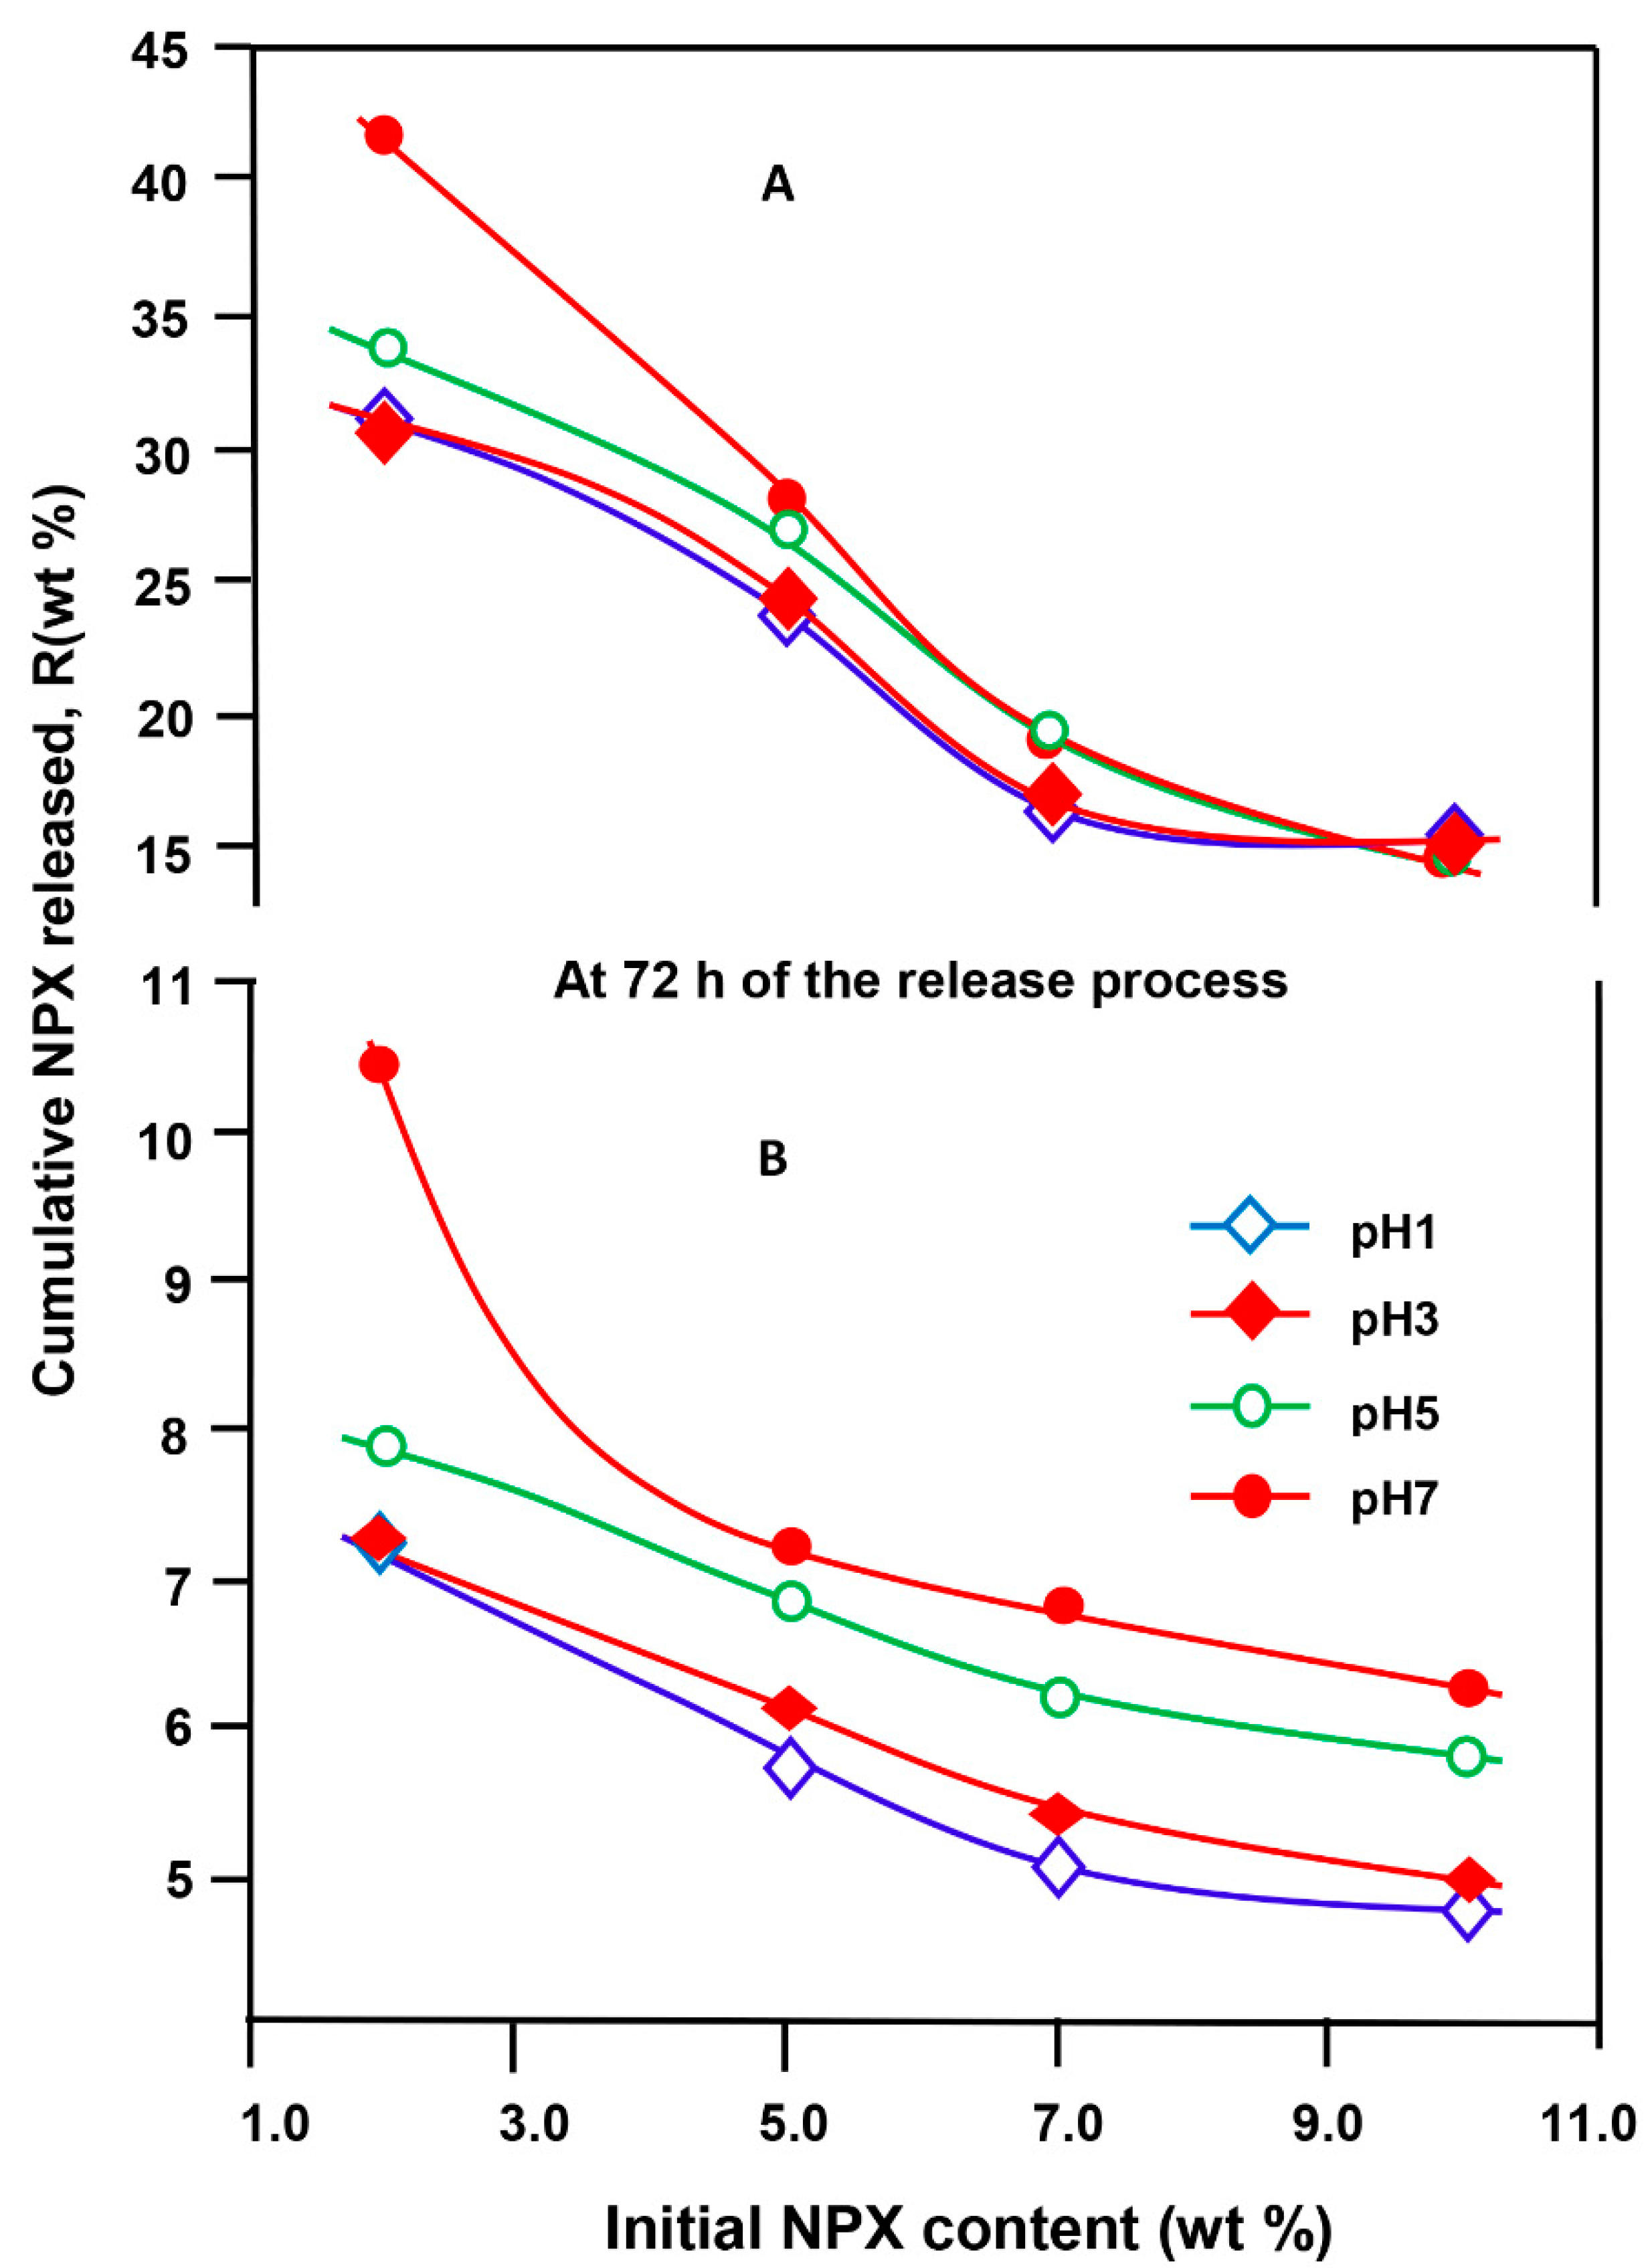
3.5.5. Effect of the Initial NPX Amount
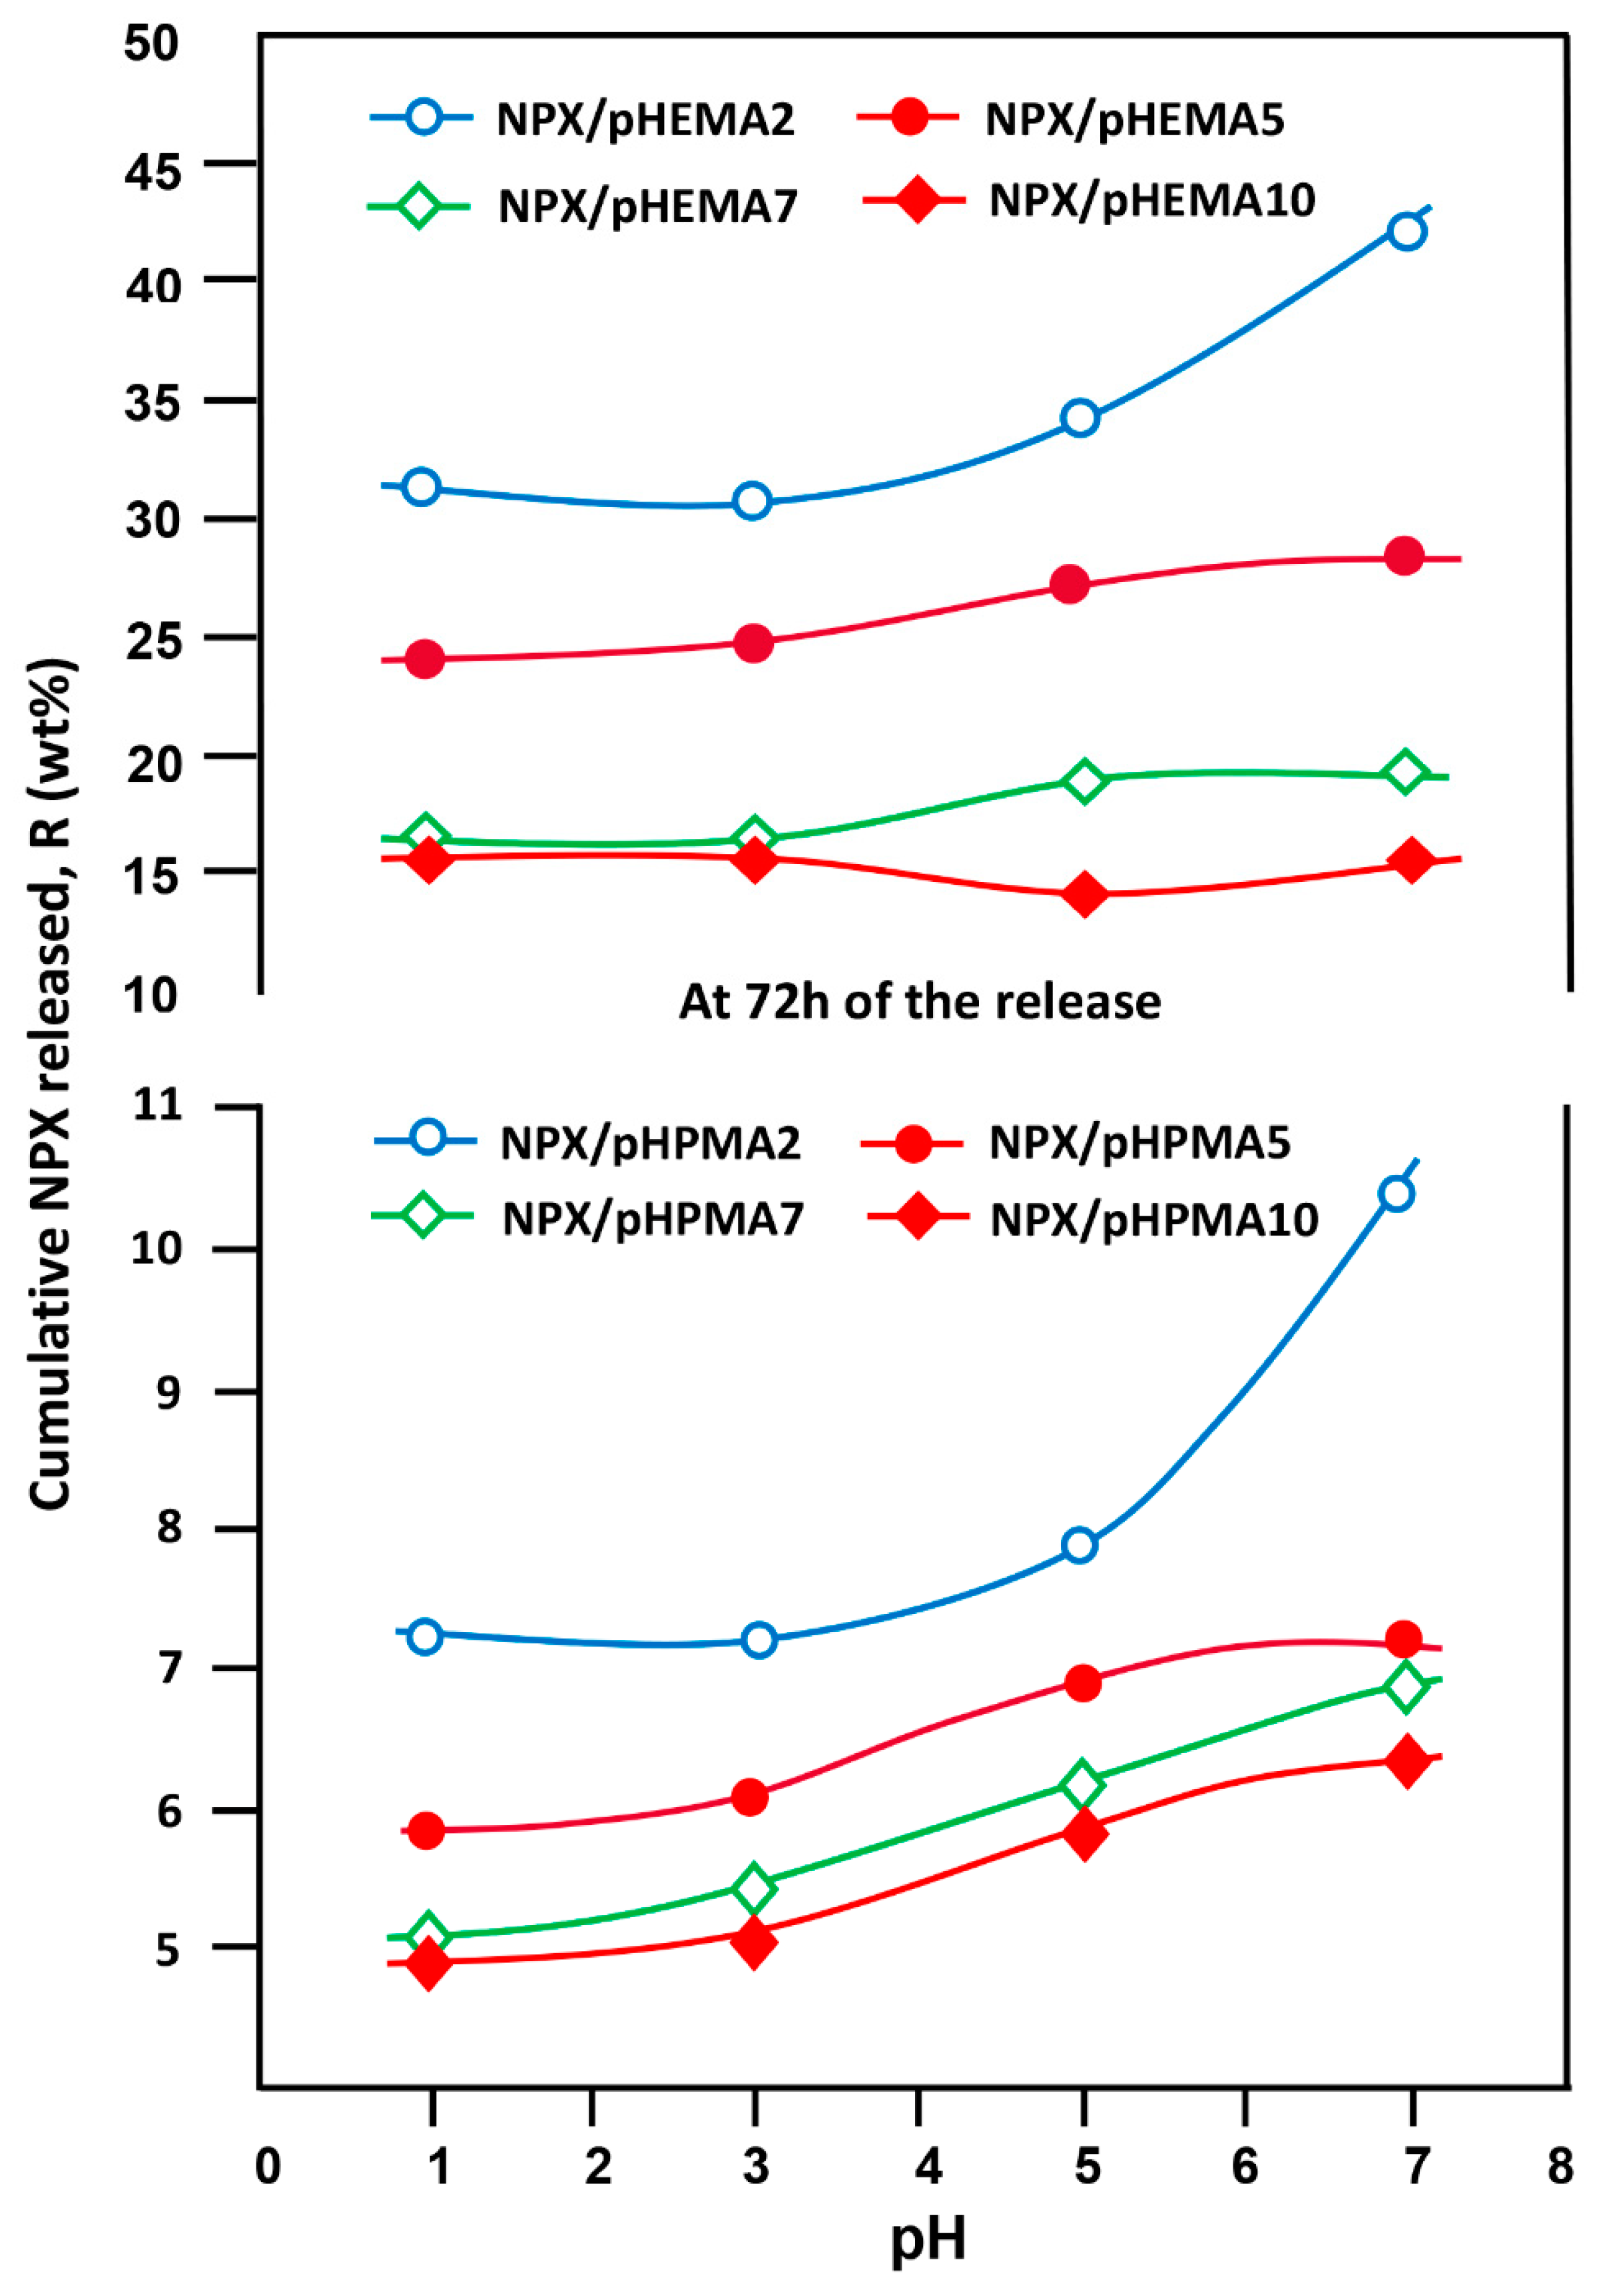
3.5.6. Effect of pH Medium
3.5.7. Performance of XPN/pHEMA and NPX/pHPMA Drug Carrier Systems
3.5.8. Distribution of NPX Released on Target Organs
4. Conclusions
Author Contributions
Funding
Institutional Review Board Statement
Informed Consent Statement
Data Availability Statement
Acknowledgments
Conflicts of Interest
References
- Peterson, B.; Weyers, M.; Steenekamp, J.H.; Steyn, J.D.; Gouws, C.; Hamman, J.H. Drug bioavailability enhancing agents of natural origin (bioenhancers) that modulate drug membrane permeation and pre-systemic metabolism. Pharmaceutics 2019, 11, 33. [Google Scholar] [CrossRef] [PubMed]
- Golan, D.E.; Armstrong, E.J.; Armstrong, A.W. Principles of Pharmacology: The Pathophysiologic Basis of Drug Therapy, 4th North American ed.; LWW: Philadelphia, PA, USA, 2016; p. 1024. [Google Scholar]
- Krishnaiah, Y. Pharmaceutical Technologies for Enhancing Oral Bioavailability of Poorly Soluble Drugs. J. Bioequivalence Bioavailab. 2010, 2, 28–36. [Google Scholar] [CrossRef]
- Brunton, L.L. Goodman and Gilman’s The Pharmacological Basis of Therapeutics, 13th ed.; Hilal-Dandan, R., Knollmann, B.C., Eds.; McGraw-Hill Education: New York, NY, USA, 2017; p. 1440. [Google Scholar]
- Kim, M.T.; Sedykh, A.; Chakravarti, S.K.; Saiakhov, R.D.; Zhu, H. Critical evaluation of human oral bioavailability for pharmaceutical drugs by using various cheminformatics approaches. Pharm. Res. 2014, 31, 1002–1014. [Google Scholar] [CrossRef] [PubMed]
- Chillistone, S.; Hardman, J.G. Factors affecting drug absorption and distribution. Anaesth. Intensive Care Med. 2017, 18, 335–339. [Google Scholar] [CrossRef]
- Savjani, K.T.; Gajjar, A.K.; Savjani, J.K. Drug solubility: Importance and enhancement techniques. Int. Sch. Res. Not. 2012, 2012, 195727. [Google Scholar] [CrossRef]
- Roderick, P.; Wilkes, H.; Meade, T. The gastrointestinal toxicity of aspirin: An overview of randomised controlled trials. Br. J. Clin. Pharmacol. 1993, 35, 219–226. [Google Scholar] [CrossRef]
- Holliday, W.M.; Berdick, M.; Bell, S.A.; Kiritsis, G.C. Sustained relief analgesic composition. U.S. Patent 3488418A, 6 January 1970. [Google Scholar]
- Zheng, J.; Luan, L.; Wang, H.; Xi, L.; Yao, K. Study on ibuprofen/montmorillonite intercalation composites as drug release system. Appl. Clay Sci. 2007, 36, 297–301. [Google Scholar] [CrossRef]
- Carreras, N.; Acuña, V.; Martí, M.; Lis, M. Drug release system of ibuprofen in PCL-microspheres. Colloid Polym. Sci. 2013, 291, 157–165. [Google Scholar] [CrossRef]
- Mangindaan, D.; Chen, C.-T.; Wang, M.-J. Integrating sol–gel with cold plasmas modified porous polycaprolactone membranes for the drug-release of silver-sulfadiazine and ketoprofen. Appl. Surf. Sci. 2012, 262, 114–119. [Google Scholar] [CrossRef]
- Saudi, S.; Bhattarai, S.R.; Adhikari, U.; Khanal, S.; Sankar, J.; Aravamudhan, S.; Bhattarai, N. Nanonet-nano fiber electrospun mesh of PCL–chitosan for controlled and extended release of diclofenac sodium. Nanoscale 2020, 12, 23556–23569. [Google Scholar] [CrossRef]
- Todd, P.A.; Clissold, S.P. Naproxen. Drugs 1990, 40, 91–137. [Google Scholar] [CrossRef] [PubMed]
- Drug Bank, R. DB14761. Available online: http://www.drugbank.ca/drugs. (accessed on 25 May 2020).
- Lee, B.-J.; Lee, J.-R. Enhancement of solubility and dissolution rate of poorly water-soluble naproxen by complexation with 2-hydroxypropyl-β-cyclodextrin. Arch. Pharmacal Res. 1995, 18, 22–26. [Google Scholar] [CrossRef]
- Branchu, S.; Rogueda, P.G.; Plumb, A.P.; Cook, W.G. A decision-support tool for the formulation of orally active, poorly soluble compounds. Eur. J. Pharm. Sci. 2007, 32, 128–139. [Google Scholar] [CrossRef] [PubMed]
- Netti, P.; Shelton, J.; Revell, P.; Pirie, G.; Smith, S.; Ambrosio, L.; Nicolais, L.; Bonfield, W. Hydrogels as an interface between bone and an implant. Biomaterials 1993, 14, 1098–1104. [Google Scholar] [CrossRef]
- IKADA, Y. Application of biomedical engineering to neurosurgery. Neurol. Med.-Chir. 1998, 38, 772–779. [Google Scholar] [CrossRef] [PubMed][Green Version]
- Hsiue, G.-H.; Guu, J.-A.; Cheng, C.-C. Poly(2-hydroxyethyl methacrylate) film as a drug delivery system for pilocarpine. Biomaterials 2001, 22, 1763–1769. [Google Scholar] [CrossRef]
- Senol, S.; Akyol, E. Synthesis and characterization of hydrogels based on poly(2-hydroxyethyl methacrylate) for drug delivery under UV irradiation. J. Mater. Sci. 2018, 53, 14953–14963. [Google Scholar] [CrossRef]
- Bettencourt, A.; Almeida, A.J. Poly(methyl methacrylate) particulate carriers in drug delivery. J. Microencapsul. 2012, 29, 353–367. [Google Scholar] [CrossRef]
- Shaked, E.; Shani, Y.; Zilberman, M.; Scheinowitz, M. Poly(methyl methacrylate) particles for local drug delivery using shock wave lithotripsy: I n vitro proof of concept experiment. J. Biomed. Mater. Res. B Appl. Biomater. 2015, 103, 1228–1237. [Google Scholar] [CrossRef]
- Clemons, T.D. Applications of Multifunctional Poly(glycidyl methacrylate)(PGMA) Nanoparticles in Enzyme Stabilization and Drug Delivery. Ph.D. Thesis, University of Western Australia, Crawley, Australia, 2013. [Google Scholar]
- Shohraty, F.; Moghadam, P.N.; Fareghi, A.R.; Movagharnezhad, N.; Khalafy, J. Synthesis and Characterization of New pH-Sensitive Hydrogels Based on Poly(glycidyl methacrylate-co-maleic anhydride). Adv. Polym. Technol. 2018, 37, 120–125. [Google Scholar] [CrossRef]
- Zare, M.; Bigham, A.; Zare, M.; Luo, H.; Rezvani Ghomi, E.; Ramakrishna, S. pHEMA: An Overview for Biomedical Applications. Int. J. Mol. Sci. 2021, 22, 6376. [Google Scholar] [CrossRef] [PubMed]
- Smetana, K., Jr.; Štol, M.; Korbelář, P.; Novak, M.; Adam, M. Implantation of p(HEMA)-collagen composite into bone. Biomaterials 1992, 13, 639–642. [Google Scholar] [CrossRef]
- Zavřel, V.; Štol, M. p(HEMA) composite as allografting material during therapy of periodontal disease: Three case reports. Biomaterials 1993, 14, 1109–1112. [Google Scholar] [CrossRef]
- Filmon, R.; Basle, M.; Barbier, A.; Chappard, D. Poly(2-hydroxy ethyl methacrylate)-alkaline phosphatase: A composite biomaterial allowing in vitro studies of bisphosphonates on the mineralization process. J. Biomater. Sci. Polym. Ed. 2000, 11, 849–868. [Google Scholar] [CrossRef] [PubMed]
- Filmon, R.; Baslé, M.; Atmani, H.; Chappard, D. Adherence of osteoblast-like cells on calcospherites developed on a biomaterial combining poly(2-hydroxyethyl) methacrylate and alkaline phosphatase. Bone 2002, 30, 152–158. [Google Scholar] [CrossRef]
- Orienti, I.; Bertasi, V.; Zecchi, V. Influence of physico-chemical parameters on the release kinetics of ketoprofen from Poly (HEMA) crosslinked microspheres. J. Pharm. Belg. 1992, 47, 309–315. [Google Scholar]
- Horák, D.; Červinka, M.; Půža, V. Hydrogels in endovascular embolization: VI. Toxicity tests of poly(2-hydroxyethyl methacrylate) particles on cell cultures. Biomaterials 1997, 18, 1355–1359. [Google Scholar] [CrossRef]
- Lesný, P.; De Croos, J.; Přádný, M.; Vacık, J.; Michalek, J.; Woerly, S.; Syková, E. Polymer hydrogels usable for nervous tissue repair. J. Chem. Neuroanat. 2002, 23, 243–247. [Google Scholar] [CrossRef]
- Perlovich, G.L.; Kurkov, S.V.; Kinchin, A.N.; Bauer-Brandl, A. Thermodynamics of solutions III: Comparison of the solvation of (+)-naproxen with other NSAIDs. Eur. J. Pharm. Biopharm. 2004, 57, 411–420. [Google Scholar] [CrossRef]
- Semlali, A.; Beji, S.; Ajala, I.; Rouabhia, M. Effects of tetrahydrocannabinols on human oral cancer cell proliferation, apoptosis, autophagy, oxidative stress, and DNA damage. Arch. Oral Biol. 2021, 129, 105200. [Google Scholar] [CrossRef]
- Semlali, A.; Contant, C.; Al-Otaibi, B.; Al-Jammaz, I.; Chandad, F. The curcumin analog (PAC) suppressed cell survival and induced apoptosis and autophagy in oral cancer cells. Sci. Rep. 2021, 11, 11701. [Google Scholar] [CrossRef] [PubMed]
- Contant, C.; Rouabhia, M.; Loubaki, L.; Chandad, F.; Semlali, A. Anethole induces anti-oral cancer activity by triggering apoptosis, autophagy and oxidative stress and by modulation of multiple signaling pathways. Sci. Rep. 2021, 11, 13087. [Google Scholar] [CrossRef] [PubMed]
- Iza, M.; Stoianovici, G.; Viora, L.; Grossiord, J.; Couarraze, G. Hydrogels of poly(ethylene glycol): Mechanical characterization and release of a model drug. J. Control. Release 1998, 52, 41–51. [Google Scholar] [CrossRef]
- Guan, Y.; Zhang, Y.; Zhou, T.; Zhou, S. Stability of hydrogen-bonded hydroxypropylcellulose/poly (acrylic acid) microcapsules in aqueous solutions. Soft Matter 2009, 5, 842–849. [Google Scholar] [CrossRef]
- Yang, S.; Zhang, Y.; Wang, L.; Hong, S.; Xu, J.; Chen, Y.; Li, C. Composite thin film by hydrogen-bonding assembly of polymer brush and poly(vinylpyrrolidone). Langmuir 2006, 22, 338–343. [Google Scholar] [CrossRef] [PubMed]
- Saritha, D.; Bose, P.S.C.; Reddy, P.S.; Madhuri, G.; Nagaraju, R. Improved dissolution and micromeritic properties of naproxen from spherical agglomerates: Preparation, in vitro and in vivo characterization. Braz. J. Pharm. Sci. 2012, 48, 683–690. [Google Scholar] [CrossRef]
- Akbari, J.; Saeedi, M.; Morteza-Semnani, K.; Rostamkalaei, S.S.; Asadi, M.; Asare-Addo, K.; Nokhodchi, A. The design of naproxen solid lipid nanoparticles to target skin layers. Colloids Surf. B Biointerfaces 2016, 145, 626–633. [Google Scholar] [CrossRef]
- Morita, S. Hydrogen-bonds structure in poly(2-hydroxyethyl methacrylate) studied by temperature-dependent infrared spectroscopy. Front. Chem. 2014, 2, 10. [Google Scholar] [CrossRef]
- Brogden, R.; Finder, R.; Sawyer, P.R.; Speight, T.; Avery, G. Naproxen: A review of its pharmacological properties and therapeutic efficacy and use. Drugs 1975, 9, 326–363. [Google Scholar] [CrossRef]
- Keshavarz, M.H.; Esmaeilpour, K.; Taghizadeh, H. A new approach for assessment of glass transition temperature of acrylic and methacrylic polymers from structure of their monomers without using any computer codes. J. Therm. Anal. Calorim. 2016, 126, 1787–1796. [Google Scholar] [CrossRef]
- Comyn, J. Introduction to Polymer Permeability and the Mathematics of Diffusion. In Polymer Permeability; Springer: Berlin/Heidelberg, Germany, 1985; pp. 1–10. [Google Scholar]
- Masaro, L.; Zhu, X. Physical models of diffusion for polymer solutions, gels and solids. Prog. Polym. Sci. 1999, 24, 731–775. [Google Scholar] [CrossRef]
- Burchard, W. Solution Thermodynamics of Non-Ionic Water-Soluble Polymers. In Chemistry and Technology of Water-Soluble Polymers; Finch, C.A., Ed.; Springer: Berlin/Heidelberg, Germany, 1983; pp. 125–142. [Google Scholar]
- Potter, C.B.; Davis, M.T.; Albadarin, A.B.; Walker, G.M. Investigation of the Dependence of the Flory–Huggins Interaction Parameter on Temperature and Composition in a Drug–Polymer System. Mol. Pharm. 2018, 15, 5327–5335. [Google Scholar] [CrossRef] [PubMed]
- Aragon, D.M.; Pacheco, D.P.; Ruidiaz, M.A.; Sosnik, A.D.; Martinez, F. Método extendido de Hildebrand en la predicción de la solubilidad de naproxeno en mezclas cosolventes etanol+ agua. Vitae 2008, 15, 113–122. [Google Scholar]
- Thakral, S.; Thakral, N.K. Prediction of drug–polymer miscibility through the use of solubility parameter based Flory–Huggins interaction parameter and the experimental validation: PEG as model polymer. J. Pharm. Sci. 2013, 102, 2254–2263. [Google Scholar] [CrossRef] [PubMed]
- Lin, M.; Wang, H.; Meng, S.; Zhong, W.; Li, Z.; Cai, R.; Chen, Z.; Zhou, X.; Du, Q. Structure and release behavior of PMMA/silica composite drug delivery system. J. Pharm. Sci. 2007, 96, 1518–1526. [Google Scholar] [CrossRef]
- Reinhard, C.S.; Radomsky, M.L.; Saltzman, W.M.; Hilton, J.; Brem, H. Polymeric controlled release of dexamethasone in normal rat brain. J. Control. Release 1991, 16, 331–339. [Google Scholar] [CrossRef]
- Cypes, S.H.; Saltzman, W.M.; Giannelis, E.P. Organosilicate-polymer drug delivery systems: Controlled release and enhanced mechanical properties. J. Control. Release 2003, 90, 163–169. [Google Scholar] [CrossRef]
- Frank, A.; Rath, S.K.; Venkatraman, S.S. Controlled release from bioerodible polymers: Effect of drug type and polymer composition. J. Control. Release 2005, 102, 333–344. [Google Scholar] [CrossRef]
- Dilmi, A.; Bartil, T.; Yahia, N.; Benneghmouche, Z. Hydrogels based on 2-hydroxyethylmethacrylate and chitosan: Preparation, swelling behavior, and drug delivery. Int. J. Polym. Mater. Polym. Biomater. 2014, 63, 502–509. [Google Scholar] [CrossRef]
- Peppas, N.A.; Narasimhan, B. Mathematical models in drug delivery: How modeling has shaped the way we design new drug delivery systems. J. Control. Release 2014, 190, 75–81. [Google Scholar] [CrossRef]
- Sevelius, H.; Runkel, R.; Segre, E.; Bloomfield, S. Bioavailability of naproxen sodium and its relationship to clinical analgesic effects. Br. J. Clin. Pharmacol. 1980, 10, 259–263. [Google Scholar] [CrossRef] [PubMed]
- Kumar, L.; Suhas, B.; Pai, G.; Verma, R. Determination of saturated solubility of naproxen using UV visible spectrophotometer. Res. J. Pharm. Technol. 2015, 8, 825–828. [Google Scholar] [CrossRef]
- Belzer, C.; De Vos, W.M. Microbes inside—from diversity to function: The case of Akkermansia. ISME J. 2012, 6, 1449–1458. [Google Scholar] [CrossRef] [PubMed]


| Drug-Carrier System | HEMA (g) | HPMA (g) | NPX (g) | NPX (wt%) | Camphorquinone (g) |
|---|---|---|---|---|---|
| NPX/pHEMA2 | 5.00 | - | 0.102 | 2.0 | 1.0 |
| NPX/pHEMA5 | 5.00 | - | 0.263 | 5.0 | 1.0 |
| NPX/pHEMA7 | 5.00 | - | 0.376 | 7.0 | 1.0 |
| NPX/pHEMA10 | 5.00 | - | 0.555 | 10.0 | 1.0 |
| NPX/pHPMA2 | - | 5.00 | 0.102 | 2.0 | 1.0 |
| NPX/pHPMA5 | - | 5.00 | 0.263 | 5.0 | 1.0 |
| NPX/pHPMA7 | - | 5.00 | 0.376 | 7.0 | 1.0 |
| NPX/pHPMA10 | - | 5.00 | 0.555 | 10.0 | 1.0 |
| Film Sample | Swelling Degree at Equilibrium | |||
|---|---|---|---|---|
| pH | ||||
| 1 | 3 | 5 | 7 | |
| pHEMA | 66.21 | 64.14 | 62.50 | 62.45 |
| pHPMA | 34.22 | 33.36 | 32.88 | 32.06 |
| Polymer Sample | n | k | D (mm2∙h−1) | |||||||||
|---|---|---|---|---|---|---|---|---|---|---|---|---|
| pH | 1 | 3 | 5 | 7 | 1 | 3 | 5 | 7 | 1 | 3 | 5 | 7 |
| pHEMA | 0.36 | 0.35 | 0.38 | 0.41 | 4.03 | 3.67 | 4.52 | 4.73 | 1.16 | 1.24 | 1.06 | 0.80 |
| pHPMA | 0.37 | 0.37 | 0.39 | 0.40 | 8.06 | 9.27 | 9.50 | 10.43 | 0.54 | 0.44 | 0.51 | 0.79 |
| Compound | Density (g∙mL−1) | Hansen Solubility Parameter (KPa1/2) | Molar Volume (mL∙mol−1) | ΔHf (kJ∙mol−1) | Tf (°C) |
|---|---|---|---|---|---|
| pHEMA | 1.25 | 103.8 | - | - | |
| pHPMA | 1.33 | 108.2 | - | - | |
| Naproxen | 1.27 c | 21.62 c | 157.3c | 31.50 a,b | 154.6 a,b |
| Drug-Carrier System | χd,p | Drug-Carrier System | χd,p | Δ(χd,p) |
|---|---|---|---|---|
| NPX/pHEMA2 | −0.27 | NPX/pHPMA2 | −0.30 | 0.03 |
| NPX/pHEMA5 | −1.28 | NPX/pHPMA5 | −1.33 | 0.05 |
| NPX/pHEMA7 | −1.72 | NPX/pHPMA7 | −1.77 | 0.05 |
| NPX/pHEMA10 | −2.26 | NPX/pHPMA10 | −2.32 | 0.06 |
| System | pH 1 | pH 7 |
|---|---|---|
| NPX powder | 29.51 | 61.68 |
| NPX/pHEMA10 | 68.84 | 205.04 |
| NPX/pHPMA10 | 51.28 | 78.77 |
| pH | System | k∙102 (h−1/2) | R2 | D∙103 (mm2·h−1) | System | k (h−1/2) | R2 | D 103 (mm2·h−1) |
|---|---|---|---|---|---|---|---|---|
| 1 | NPX/pHEMA2 | 3.56 | 0.9988 | 6.161 | NPX/pHPMA2 | 0.85 | 0.9991 | 0.386 |
| 3 | NPX/pHEMA2 | 3.54 | 0.9976 | 6.642 | NPX/pHPMA2 | 0.82 | 0.9994 | 0.359 |
| 5 | NPX/pHEMA2 | 3.96 | 0.9983 | 8.830 | NPX/pHPMA2 | 0.91 | 0.9996 | 0.401 |
| 7 | NPX/pHEMA2 | 4.76 | 0.9990 | 13.239 | NPX/pHPMA2 | 1.22 | 0.9995 | 0.636 |
| 1 | NPX/pHEMA5 | 2.71 | 0.9950 | 3.628 | NPX/pHPMA5 | 00.66 | 0.9996 | 0.270 |
| 3 | NPX/pHEMA5 | 2.79 | 0.9950 | 3.678 | NPX/pHPMA5 | 0.70 | 0.9994 | 0.262 |
| 5 | NPX/pHEMA5 | 3.09 | 0.9977 | 4.240 | NPX/pHPMA5 | 0.79 | 0.9997 | 0.278 |
| 7 | NPX/pHEMA5 | 3.25 | 0.9978 | 5.343 | NPX/pHPMA5 | 0.81 | 0.9994 | 0.396 |
| 1 | NPX/pHEMA7 | 1.93 | 0.9998 | 1.724 | NPX/pHPMA7 | 0.61 | 0.9997 | 0.172 |
| 3 | NPX/pHEMA7 | 1.96 | 0.9994 | 2.446 | NPX/pHPMA7 | 0.65 | 0.9994 | 0.198 |
| 5 | NPX/pHEMA7 | 2.26 | 0.9985 | 3.017 | NPX/pHPMA7 | 0.73 | 0.9998 | 0.262 |
| 7 | NPX/pHEMA7 | 2.36 | 0.9941 | 3.597 | NPX/pHPMA7 | 0.81 | 0.9999 | 0.348 |
| 1 | NPX/pHEMA10 | 1.80 | 0.9980 | 1.338 | NPX/pHPMA10 | 0.0032 | 0.9996 | 0.147 |
| 3 | NPX/pHEMA10 | 1.81 | 0.9987 | 1.455 | NPX/pHPMA10 | 0.0032 | 0.9996 | 0.147 |
| 5 | NPX/pHEMA10 | 1.75 | 0.9976 | 1.254 | NPX/pHPMA10 | 0.0036 | 0.9996 | 0.167 |
| 7 | NPX/pHEMA10 | 1.80 | 0.9977 | 1.6778 | NPX/pHPMA10 | 0.0046 | 0.9997 | 0.205 |
| System | pH | SZ (h) | RNR (wt%∙h−1) | CNR (wt%) | LR (R2) | System | SZ (h) | RNR (wt%∙h−1) | CNR (wt%) | LR (R2) |
|---|---|---|---|---|---|---|---|---|---|---|
| NPX/pHEMA2 | 1 | 0–7 | 1.001 | 07.01 | 0.978 | NPX/pHEMA7 | 0–4 | 0.776 | 3.104 | 0.985 |
| 7–72 | 0.328 | 21.32 | 0.976 | 4–72 | 0.171 | 11.29 | 0.979 | |||
| 3 | 0–7 | 0.964 | 0.138 | 0.972 | 0–4 | 0.803 | 3.21 | 0.982 | ||
| 7–72 | 0.336 | 21.84 | 0.975 | 4–72 | 0.172 | 11.35 | 0.973 | |||
| 5 | 0–7 | 1.124 | 7.87 | 0.967 | 0–4 | 0.783 | 3.13 | 0.985 | ||
| 7–72 | 0.366 | 23.79 | 0.977 | 4–72 | 0.209 | 13.79 | 0.981 | |||
| 7 | 0–7 | 1.290 | 9.03 | 0.980 | 0–4 | 0.636 | 2.54 | 0.988 | ||
| 7–72 | 0.441 | 28.67 | 0.982 | 4–72 | 0.223 | 14.72 | 0.987 | |||
| NPX/pHEMA5 | 1 | 0–7 | 0.969 | 6.783 | 0.977 | NPX/pHEMA10 | 0–4 | 0.687 | 2.75 | 0.951 |
| 7–72 | 0.229 | 14.89 | 0.938 | 4–72 | 0.185 | 12.58 | 0.921 | |||
| 3 | 0–7 | 0.993 | 6.95 | 0.986 | 0–4 | 0.668 | 2.67 | 0.973 | ||
| 7–72 | 0.233 | 15.15 | 0.943 | 4–72 | 0.180 | 6.80 | 0.933 | |||
| 5 | 0–7 | 1.081 | 7.57 | 0.975 | 0–4 | 0.718 | 2.87 | 0.977 | ||
| 7–72 | 0.275 | 17.88 | 0.950 | 4–72 | 0.161 | 10.95 | 0.967 | |||
| 7 | 0–7 | 1.013 | 7.09 | 0.971 | 0–4 | 0.605 | 2.42 | 0.990 | ||
| 7–72 | 0.300 | 19.50 | 0.939 | 4–72 | 0.174 | 11.83 | 0.961 |
| System | pH | SZ (h) | RNR (wt%∙h−1) | CNR (wt%) | LR (R2) | System | SZ (h) | RDR (wt%∙h−1) | CNR (wt%) | LR (R2) |
|---|---|---|---|---|---|---|---|---|---|---|
| NPX/pHPMA2 | 1 | 0–5 | 0.330 | 1.65 | 0.966 | NPX/pHPMA7 | 0–5 | 0.285 | 1.43 | 0.955 |
| 5–72 | 0.069 | 4.62 | 0.977 | 5–72 | 0.076 | 5.09 | 0.975 | |||
| 3 | 0–5 | 0.311 | 1.56 | 0.971 | 0–5 | 0.193 | 0.97 | 0.953 | ||
| 5–72 | 0.069 | 4.62 | 0.980 | 5–72 | 0.052 | 3.48 | 0.973 | |||
| 5 | 0–5 | 0.330 | 1.65 | 0.985 | 0–5 | 0.209 | 1.05 | 0.963 | ||
| 5–72 | 0.077 | 5.162 | 0.982 | 5–72 | 0.057 | 3.82 | 0.976 | |||
| 7 | 0–5 | 0.511 | 2.56 | 0.990 | 0–5 | 0.244 | 1.22 | 0.981 | ||
| 5–72 | 0.102 | 6.83 | 0.972 | 5–72 | 0.064 | 4.29 | 0.977 | |||
| NPX/pHPMA5 | 1 | 0–5 | 0.244 | 1.22 | 0.968 | NPX/pHPMA10 | 0–5 | 0.184 | 0.92 | 0.929 |
| 5–72 | 0.061 | 4.09 | 0.977 | 5–72 | 0.050 | 3.35 | 0.974 | |||
| 3 | 0–5 | 0.250 | 1.25 | 0.960 | 0–5 | 0.193 | 0.97 | 0.952 | ||
| 5–72 | 0.066 | 4.42 | 0.973 | 5–72 | 0.052 | 3.48 | 0.977 | |||
| 5 | 0–5 | 0.279 | 1.40 | 0.963 | 0–5 | 0.224 | 1.12 | 0.944 | ||
| 5–72 | 0.072 | 4.82 | 0.971 | 5–72 | 0.060 | 4.02 | 0.977 | |||
| 7 | 0–5 | 0.285 | 1.43 | 0.955 | 0–5 | 0.240 | 1.20 | 0.954 | ||
| 5–72 | 0.076 | 5.09 | 0.975 | 5–72 | 0.066 | 4.42 | 0.978 |
| Drug Carrier | Stomach | Small Intestine | Colon | SDOR | ||||
|---|---|---|---|---|---|---|---|---|
| System | Transit (wt%) | Transit (wt%) | Transit (wt%) | (wt %) | ||||
| Transit Time | Min | Max | Min | Max | Min | Max | Min (48) | Max (72) |
| (1 h) | (4 h) | (4 h) | (12 h) | (48 h) | (72 h) | |||
| NPX/pHEMA2 | 0.98 | 3.93 | 5.16 | 7.94 | 24.7 | 17.2 | 3.18 | 14.85 |
| NPX/pHEMA5 | 0.98 | 3.92 | 4.05 | 5.44 | 14.4 | 17.1 | 5.04 | 14.46 |
| NPX/pHEMA7 | 0.79 | 3.16 | 2.54 | 2.68 | 10.7 | 12.04 | 5.63 | 17.67 |
| NPX/pHEMA10 | 0.68 | 5.42 | 2.42 | 2.09 | 8.35 | 11.83 | 5.94 | 28.02 |
| NPX/pHPMA2 | 0.32 | 1.28 | 2.04 | 1.64 | 4.9 | 5.71 | 4.41 | 14.83 |
| NPX/pHPMA5 | 0.25 | 0.99 | 1.14 | 1.13 | 3.65 | 5.09 | 4.96 | 13.73 |
| NPX/pHPMA7 | 0.24 | 0.96 | 0.96 | 0.96 | 3.07 | 4.29 | 5.62 | 15.46 |
| NPX/pHPMA10 | 0.22 | 0.87 | 0.96 | 0.97 | 3.17 | 4.42 | 5.06 | 13.9 |
Publisher’s Note: MDPI stays neutral with regard to jurisdictional claims in published maps and institutional affiliations. |
© 2022 by the authors. Licensee MDPI, Basel, Switzerland. This article is an open access article distributed under the terms and conditions of the Creative Commons Attribution (CC BY) license (https://creativecommons.org/licenses/by/4.0/).
Share and Cite
Aljubailah, A.; Alqahtani, S.M.S.; Al-Garni, T.S.; Saeed, W.S.; Semlali, A.; Aouak, T. Naproxen-Loaded Poly(2-hydroxyalkyl methacrylates): Preparation and Drug Release Dynamics. Polymers 2022, 14, 450. https://doi.org/10.3390/polym14030450
Aljubailah A, Alqahtani SMS, Al-Garni TS, Saeed WS, Semlali A, Aouak T. Naproxen-Loaded Poly(2-hydroxyalkyl methacrylates): Preparation and Drug Release Dynamics. Polymers. 2022; 14(3):450. https://doi.org/10.3390/polym14030450
Chicago/Turabian StyleAljubailah, Abeer, Saad M. S. Alqahtani, Tahani Saad Al-Garni, Waseem Sharaf Saeed, Abdelhabib Semlali, and Taieb Aouak. 2022. "Naproxen-Loaded Poly(2-hydroxyalkyl methacrylates): Preparation and Drug Release Dynamics" Polymers 14, no. 3: 450. https://doi.org/10.3390/polym14030450
APA StyleAljubailah, A., Alqahtani, S. M. S., Al-Garni, T. S., Saeed, W. S., Semlali, A., & Aouak, T. (2022). Naproxen-Loaded Poly(2-hydroxyalkyl methacrylates): Preparation and Drug Release Dynamics. Polymers, 14(3), 450. https://doi.org/10.3390/polym14030450