

Effect of Water-Induced and Physical Aging on Mechanical Properties of 3D Printed Elastomeric Polyurethane


Abstract
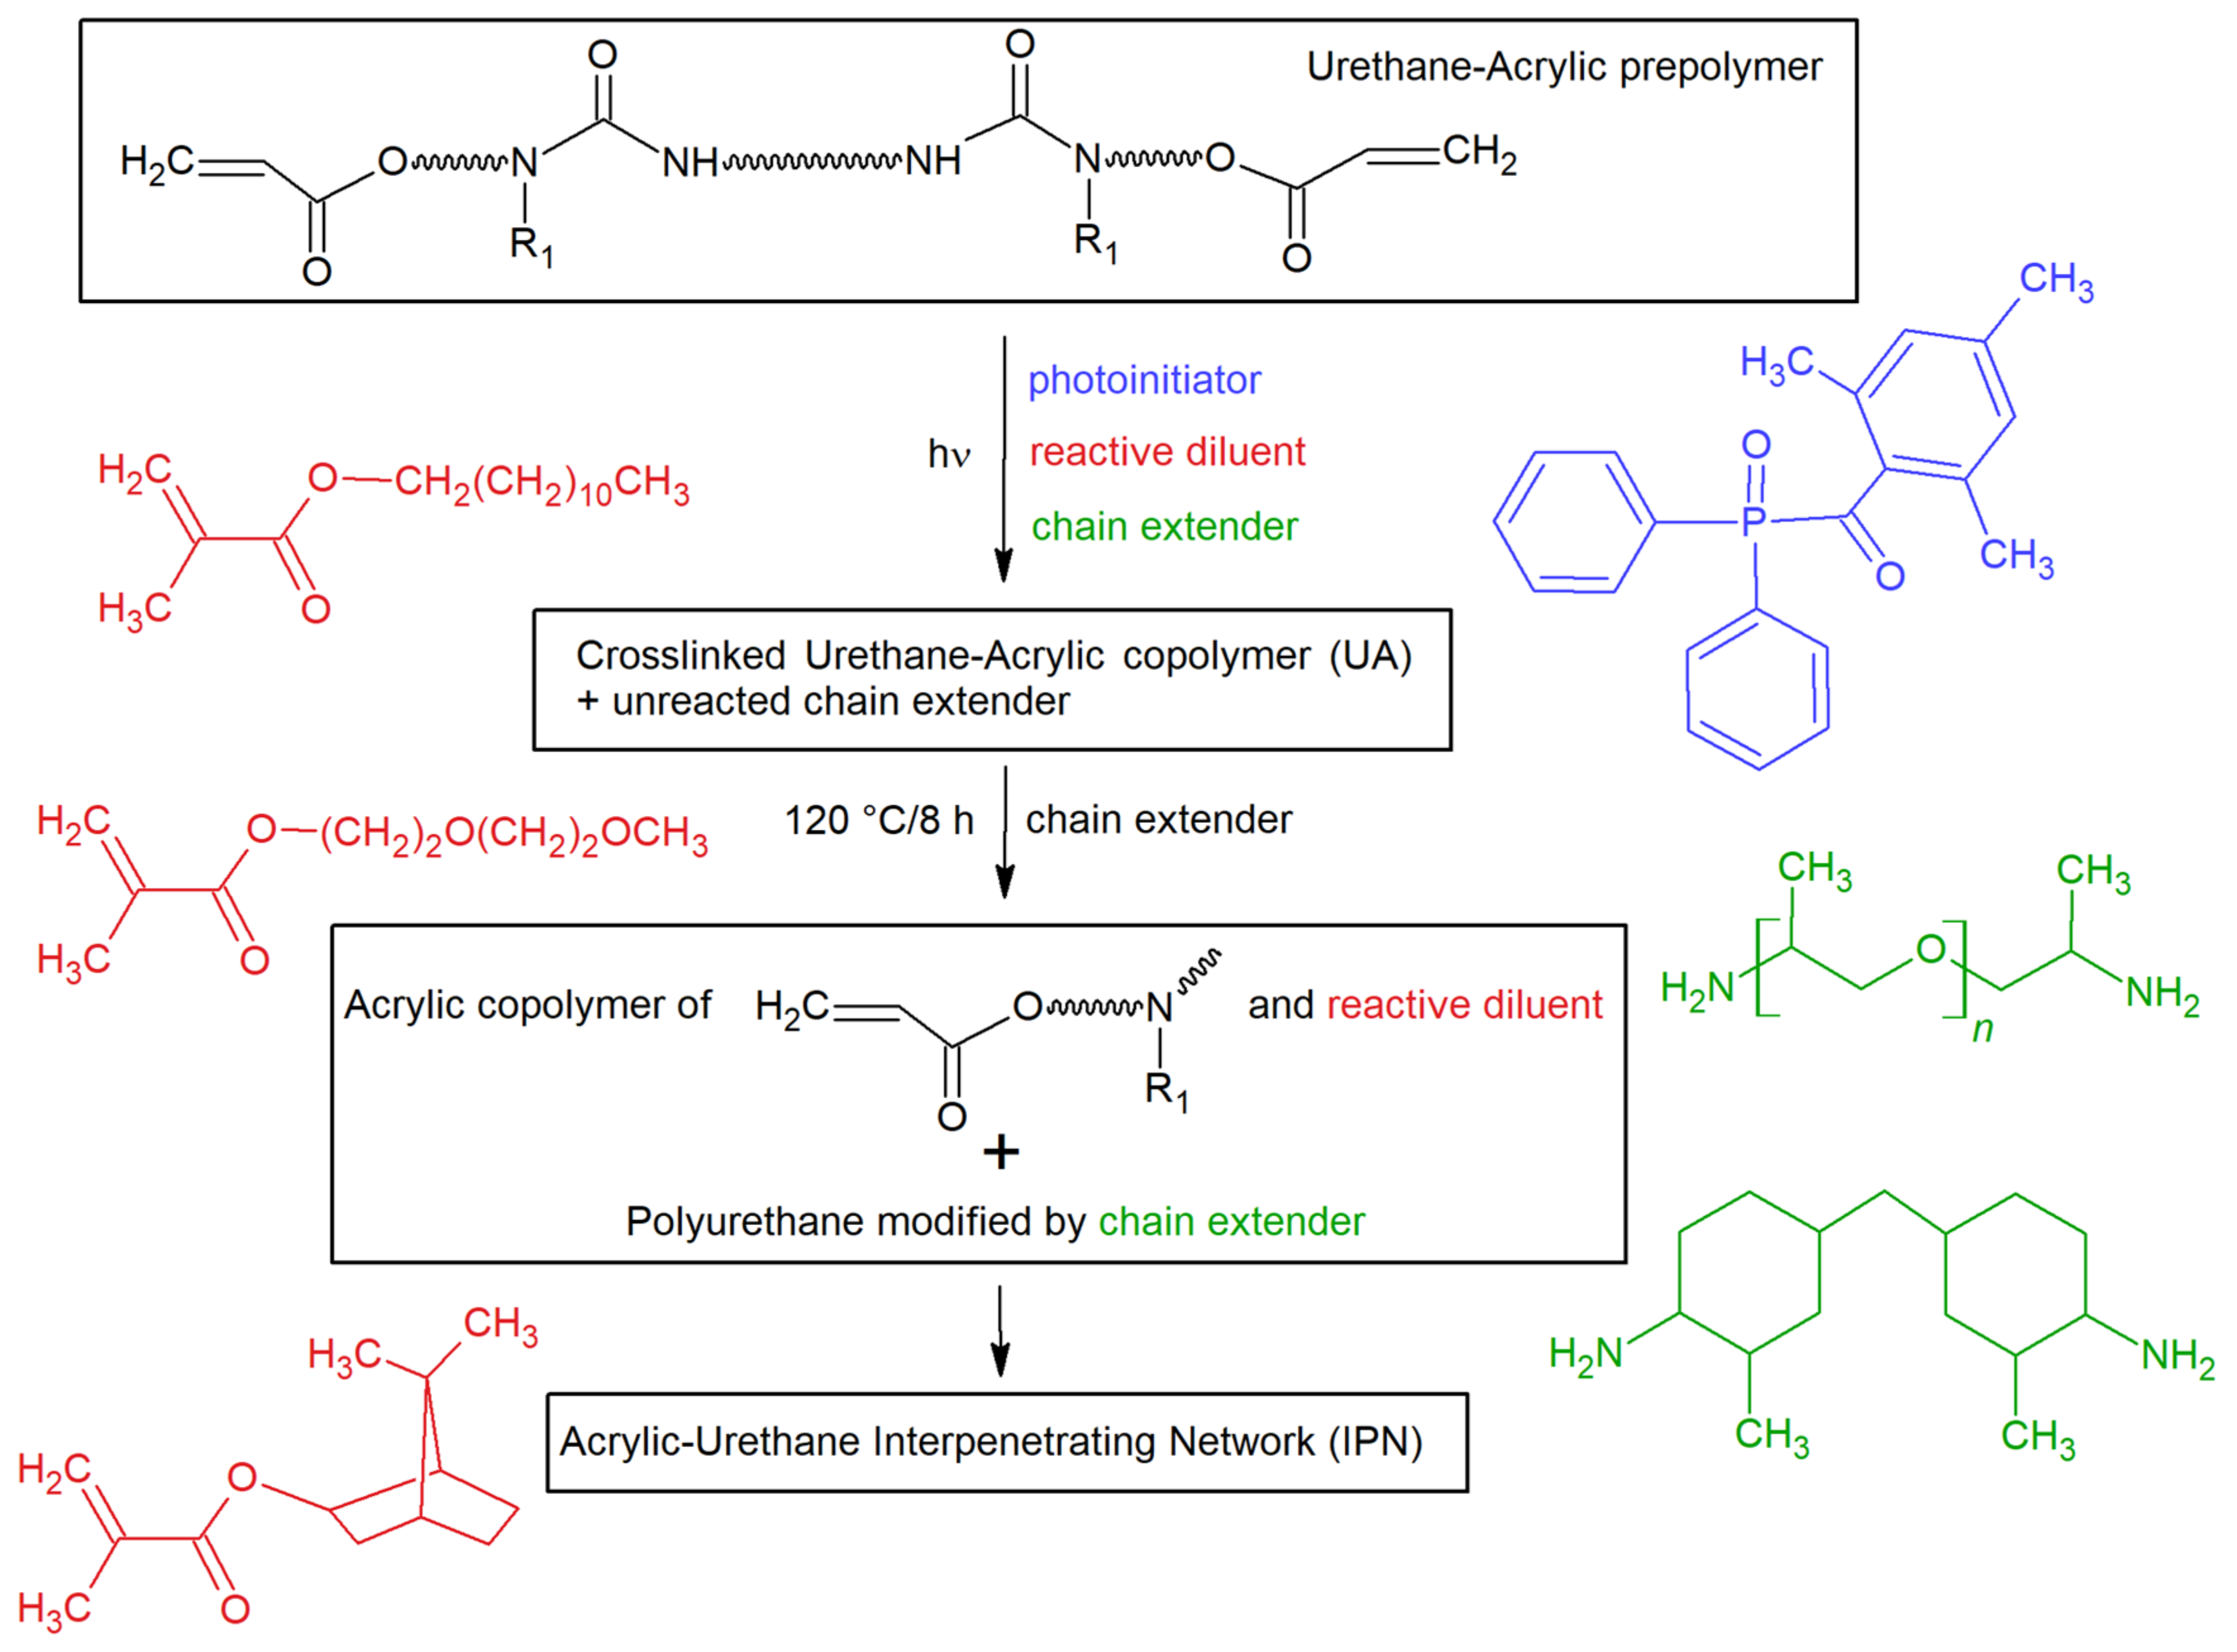
1. Introduction
2. Materials and Methods
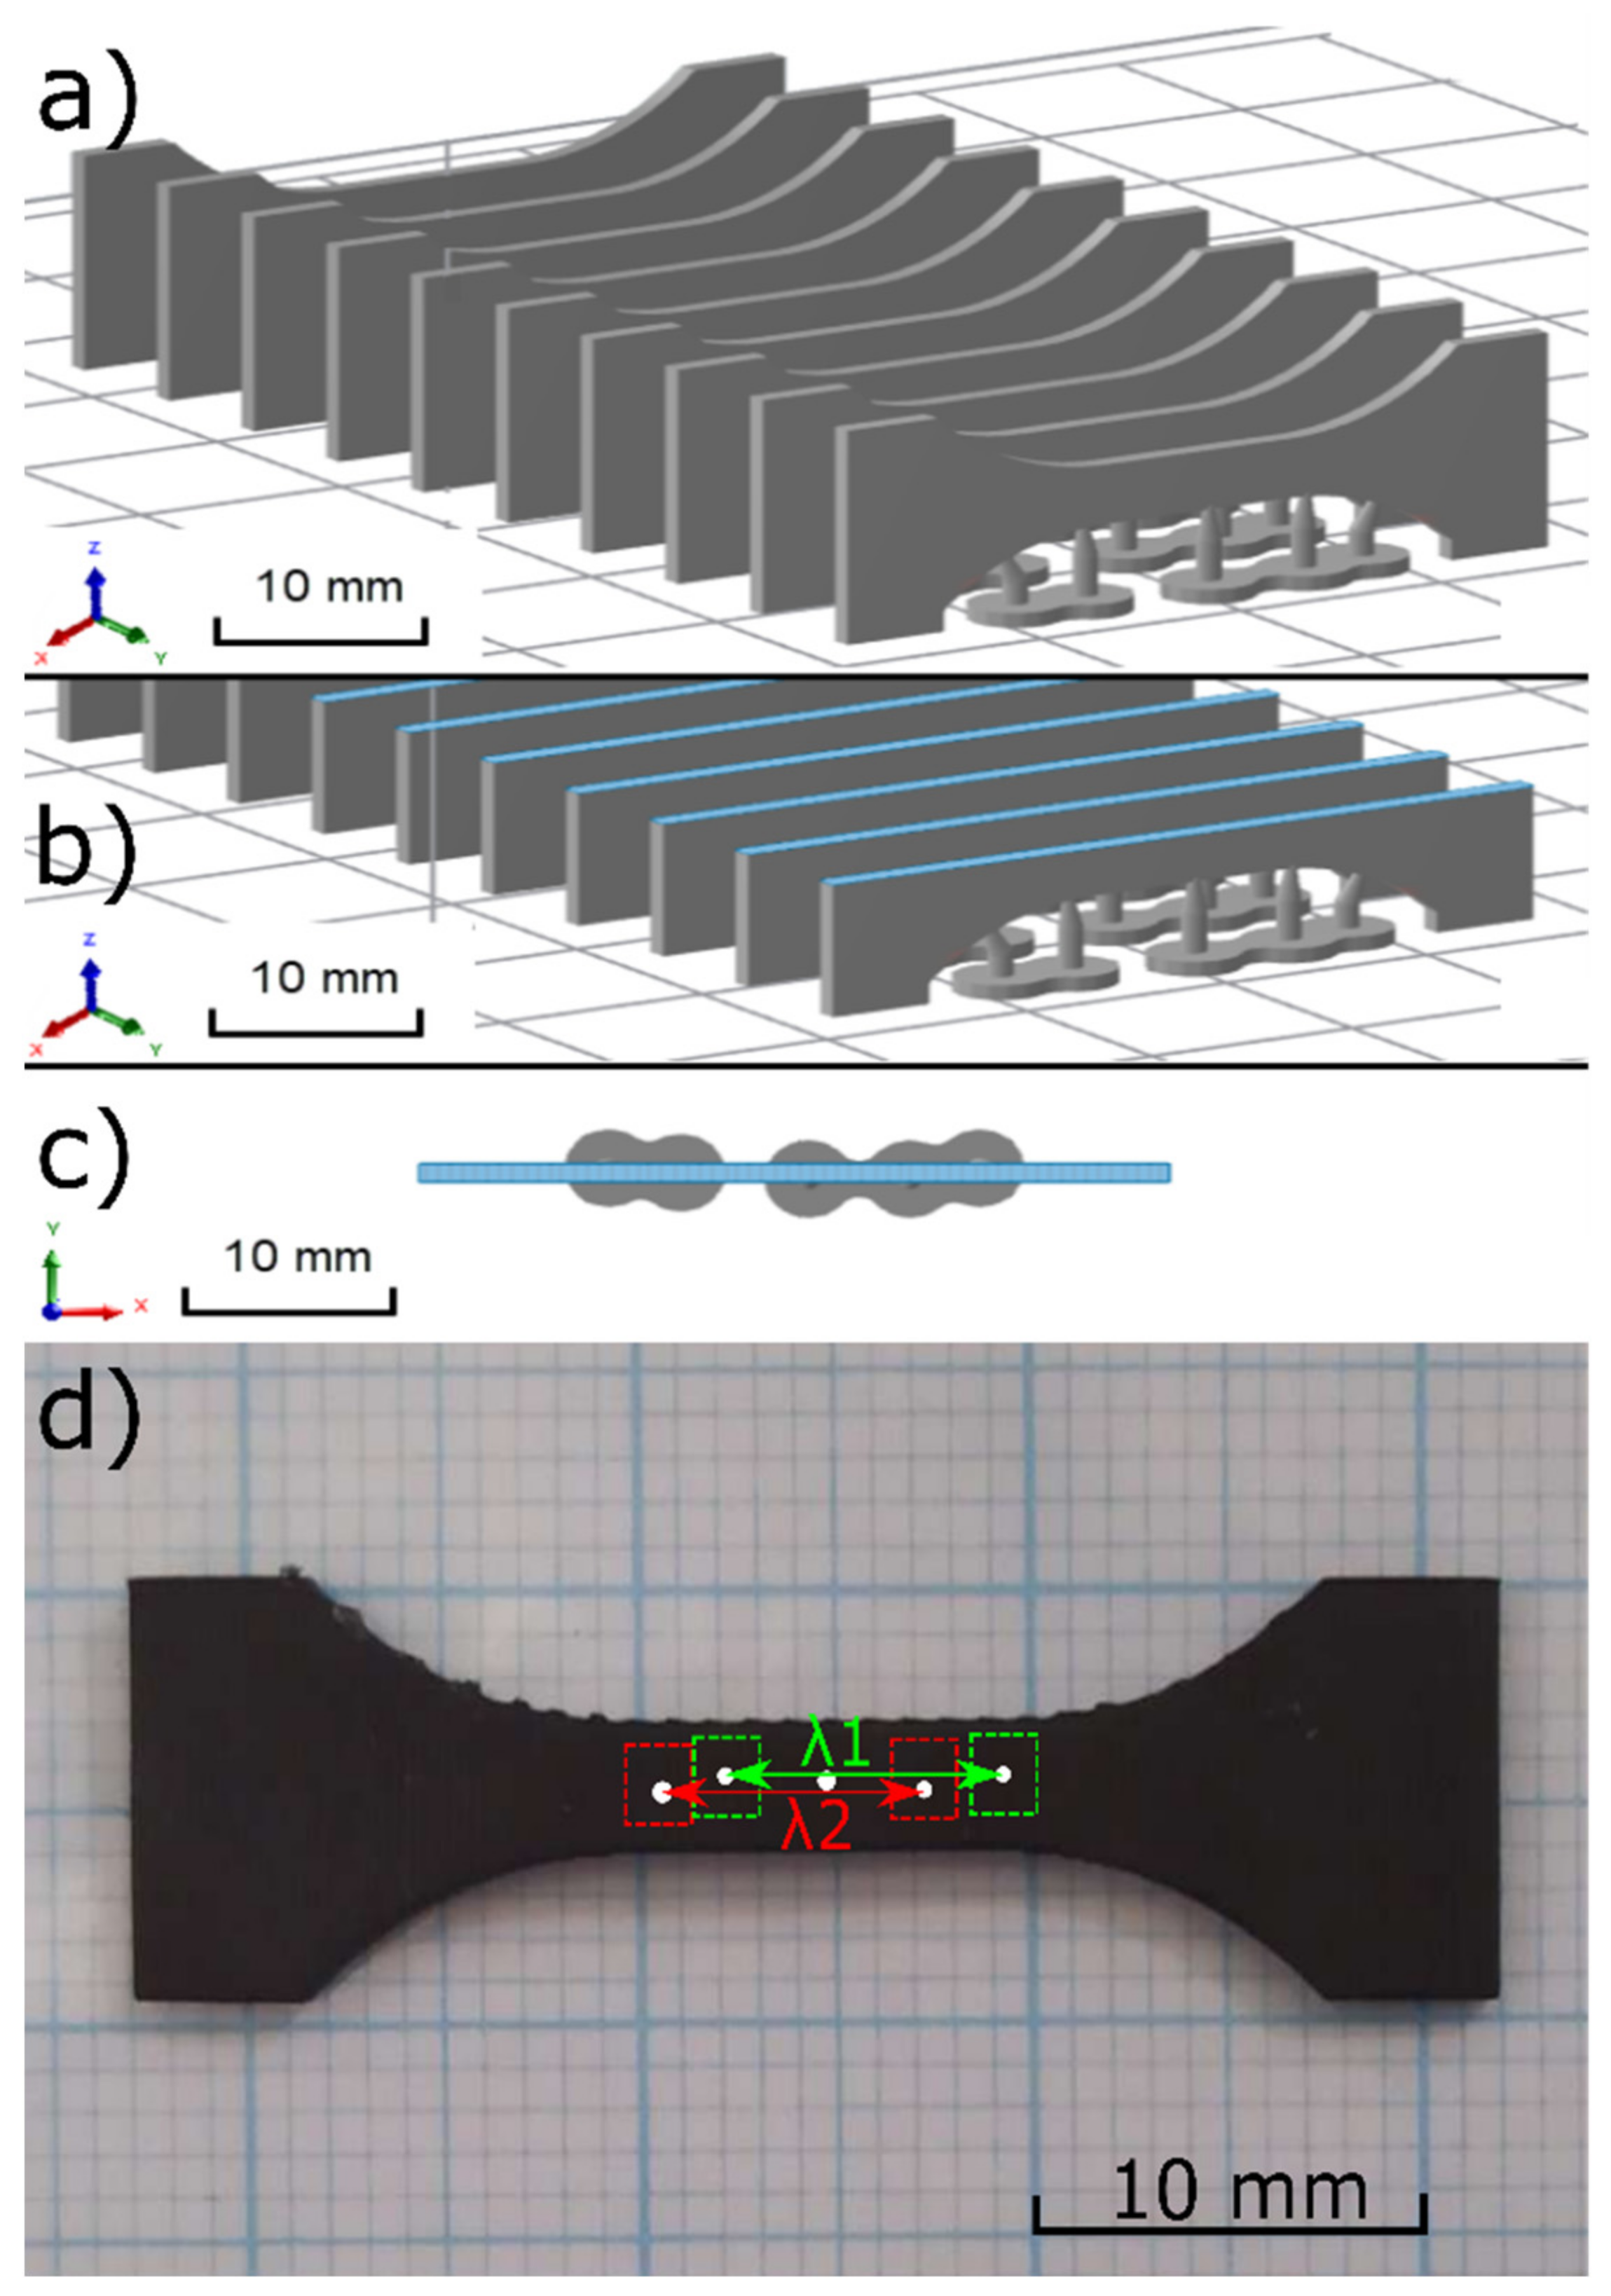
2.1. Sample 3D Printing
2.2. Mechanical Testing
2.3. Water Uptake Measurement
2.4. Chemical Structure Characterisation
3. Results
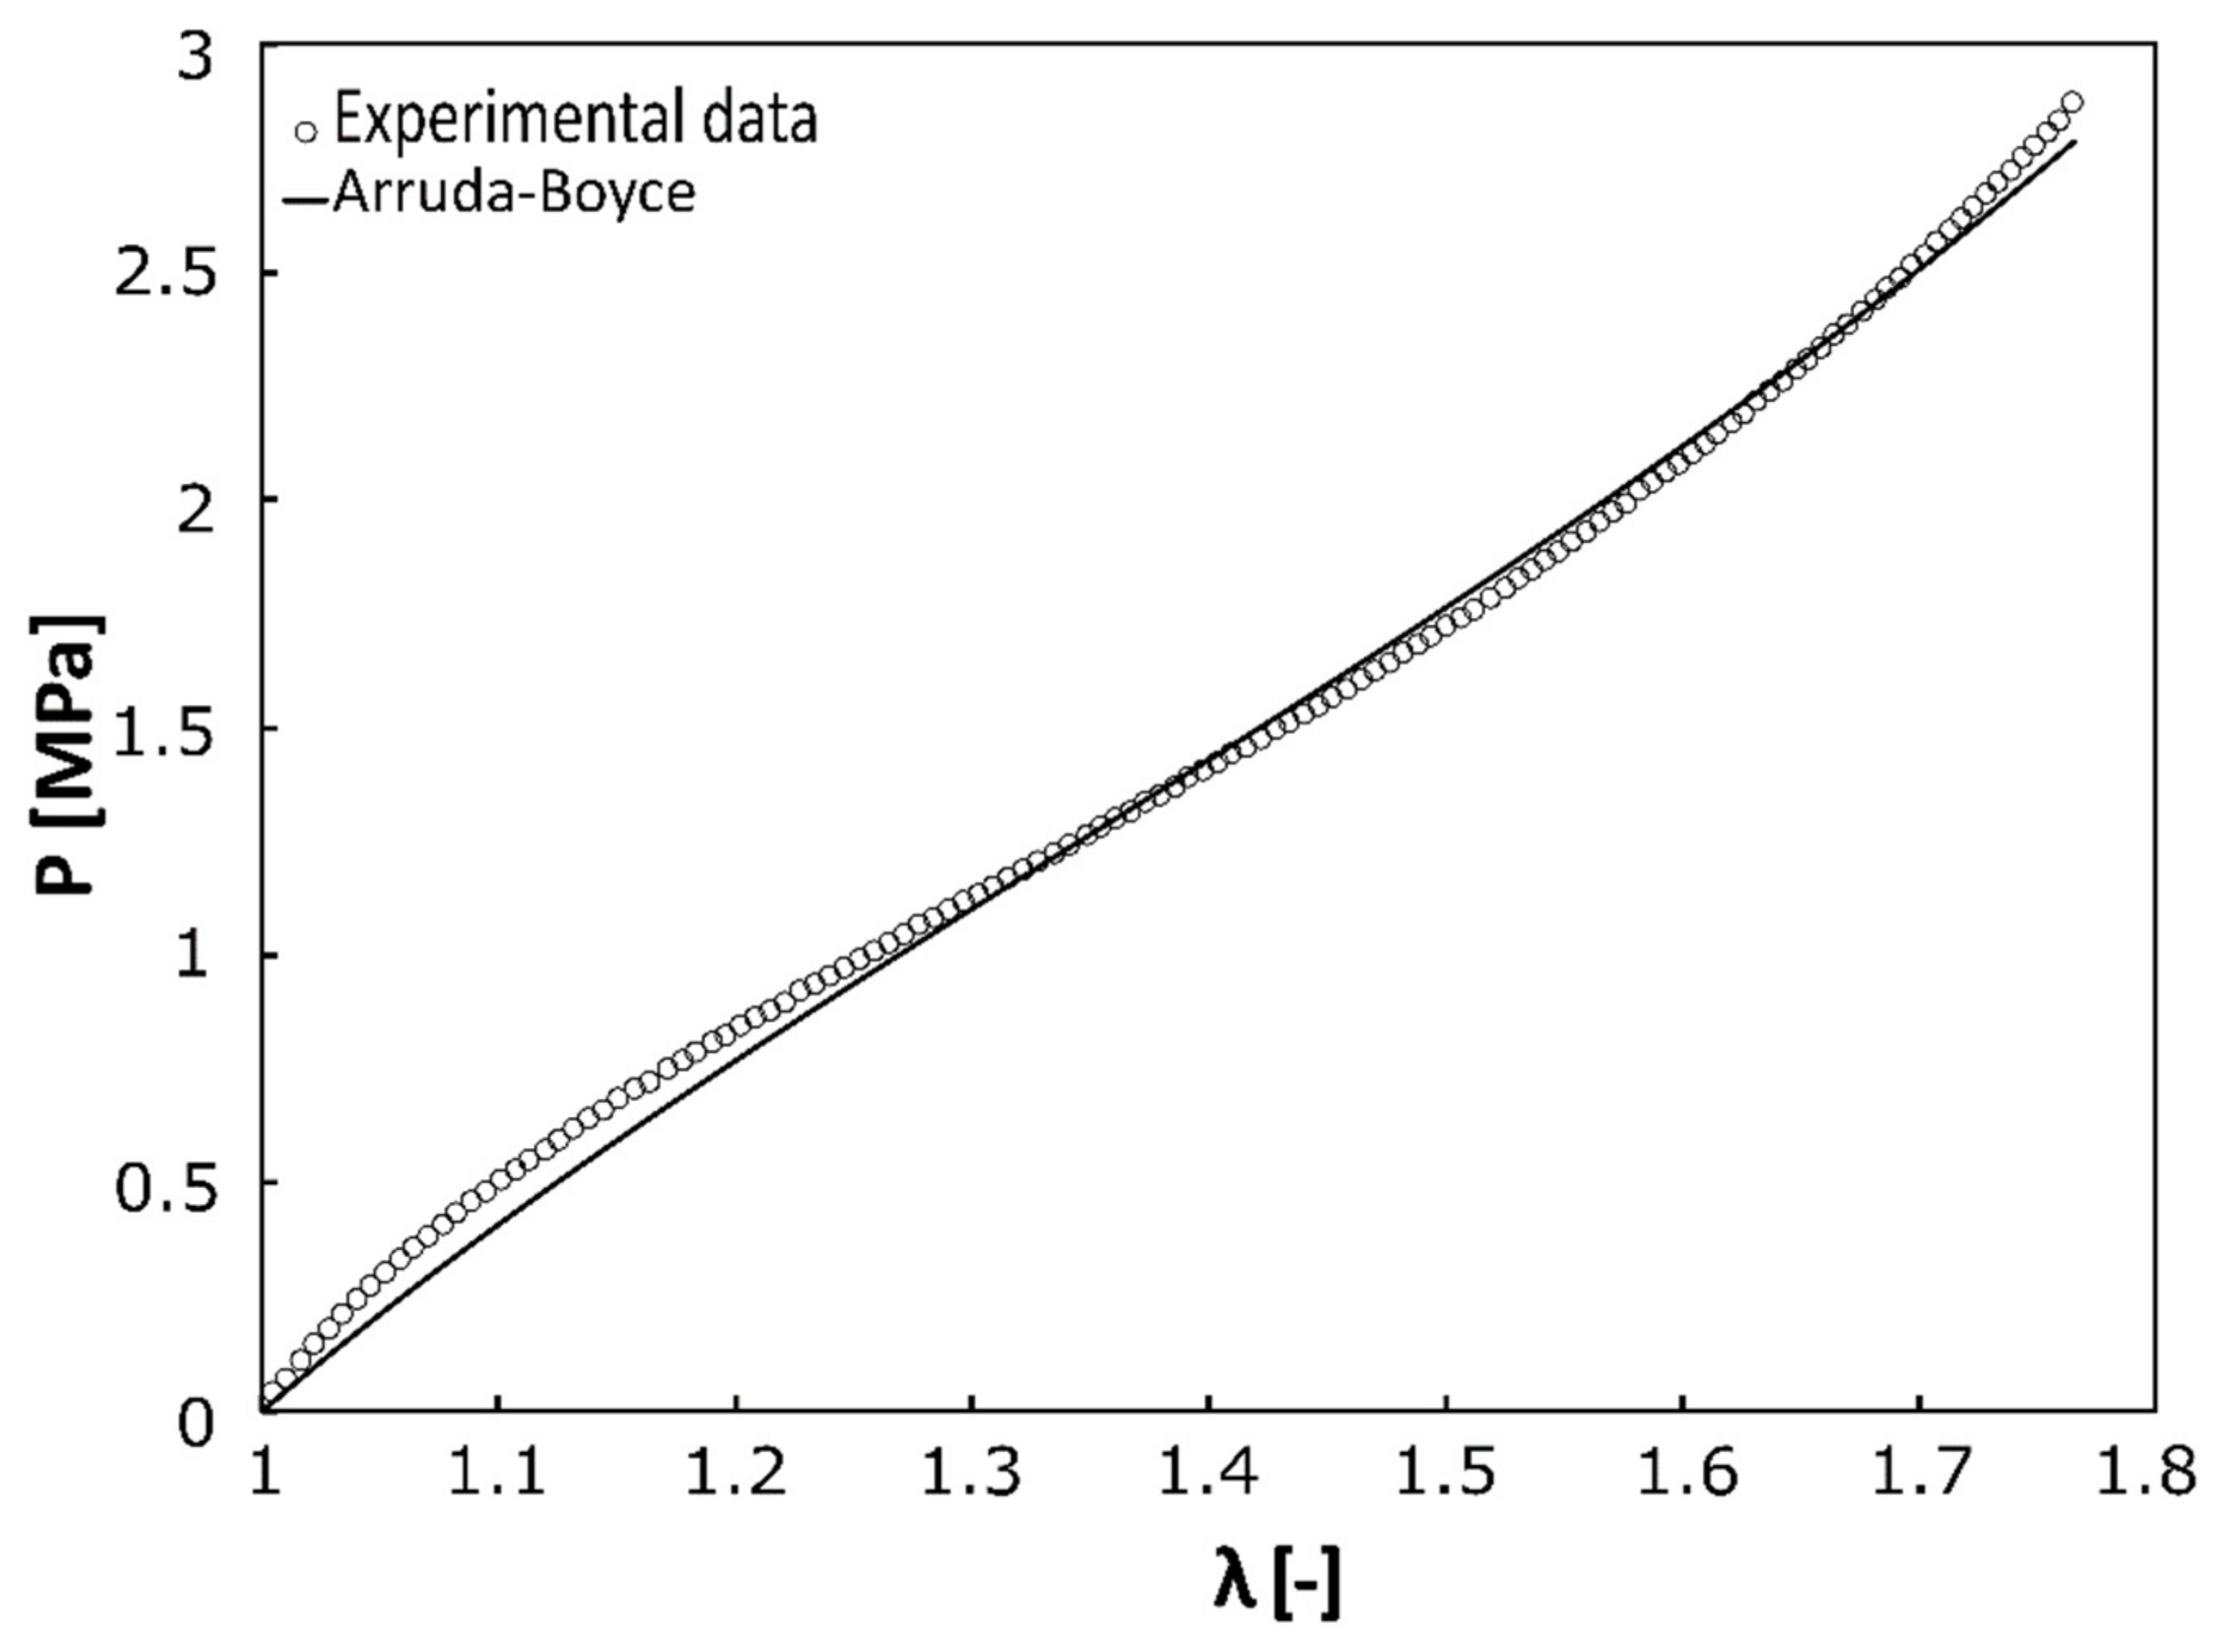
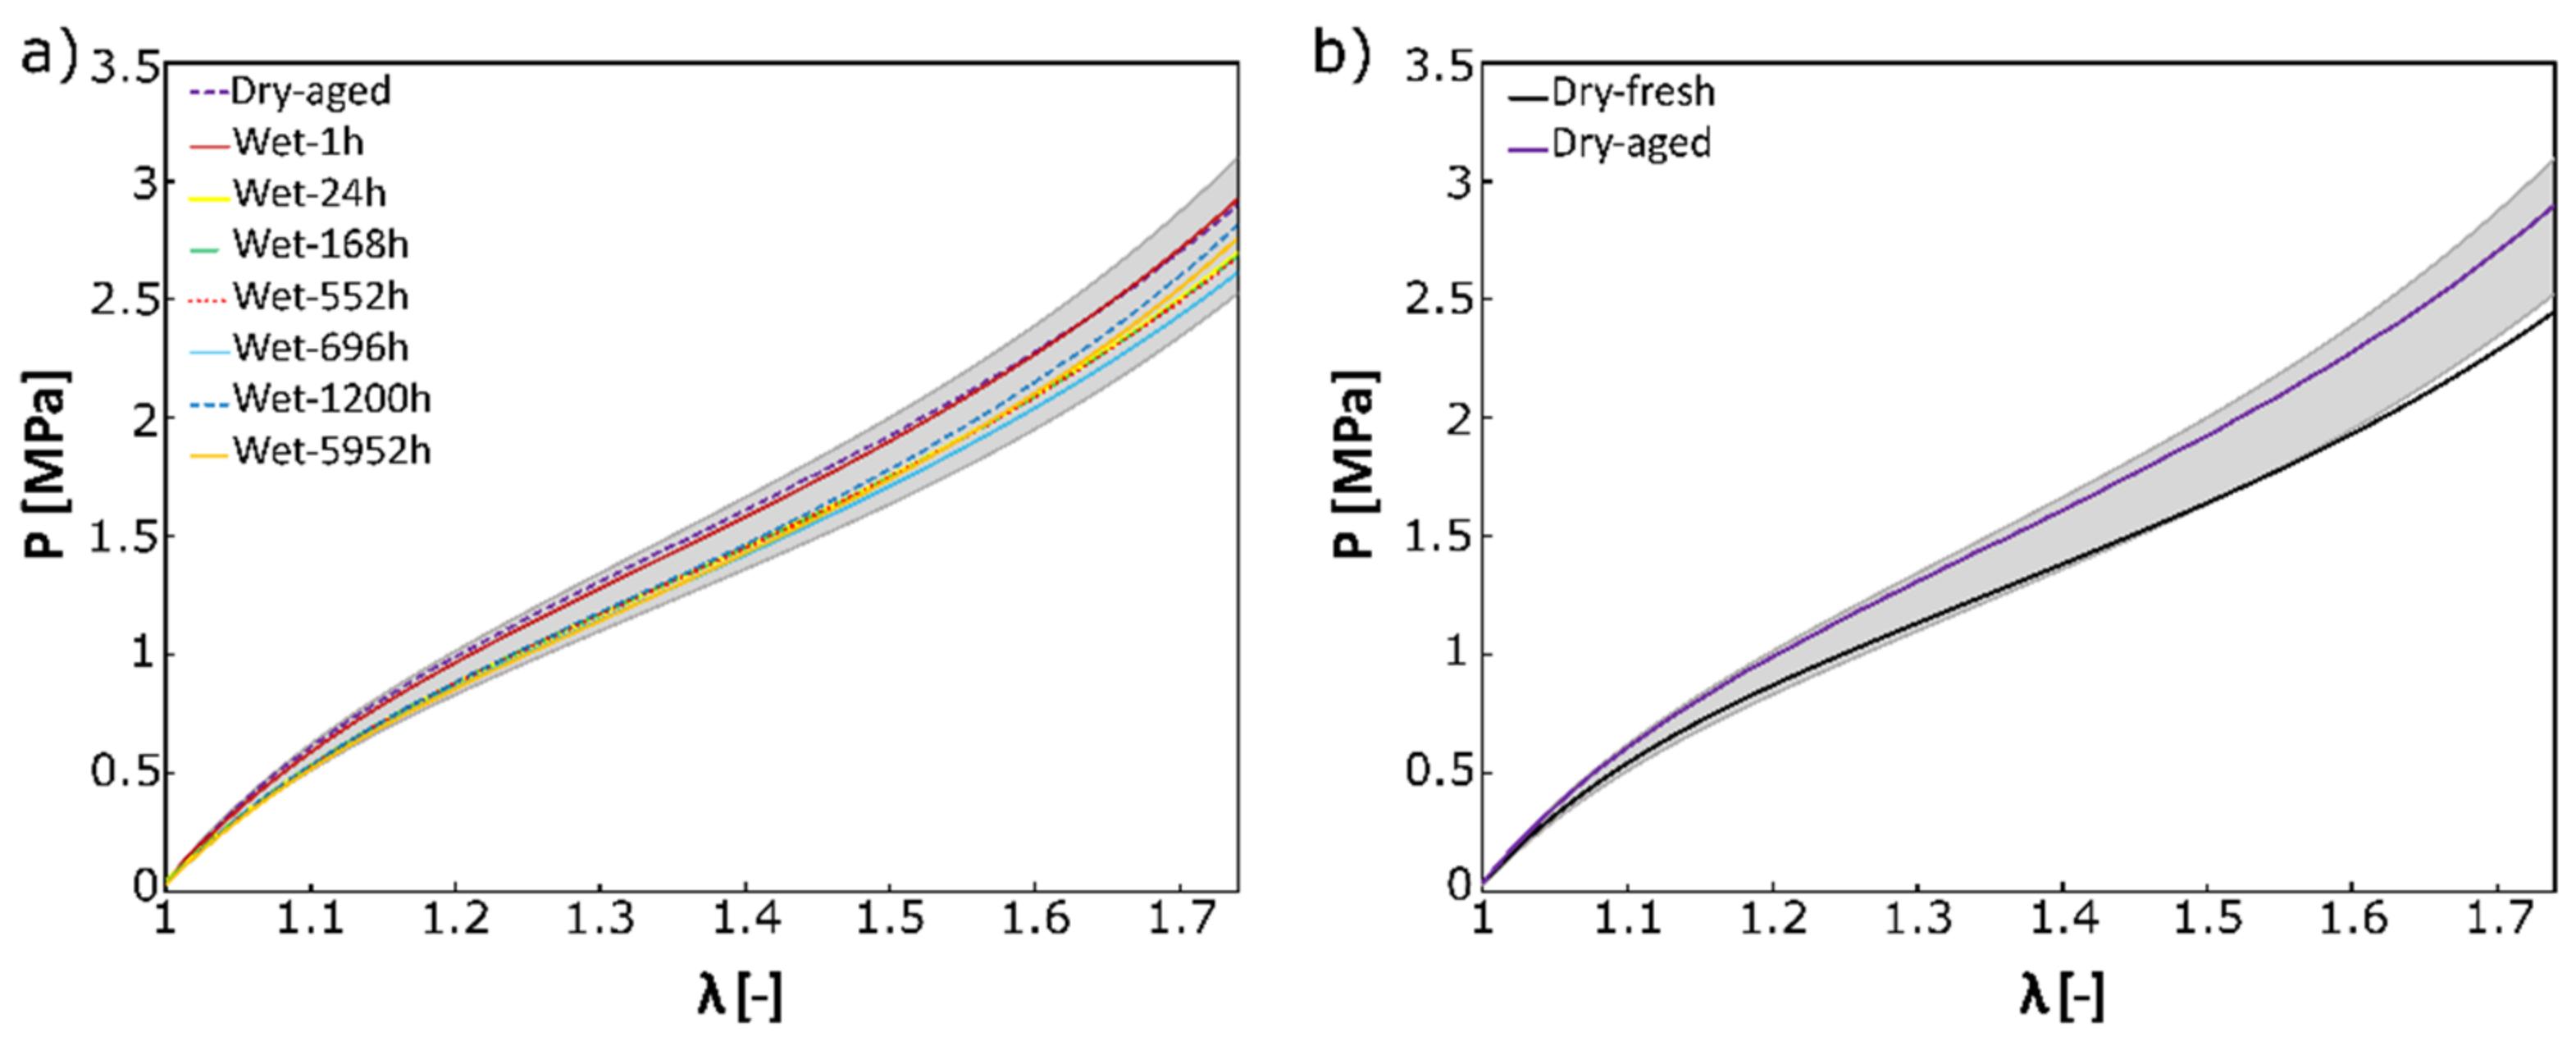
3.1. Effect of Aging on Mechanical Response
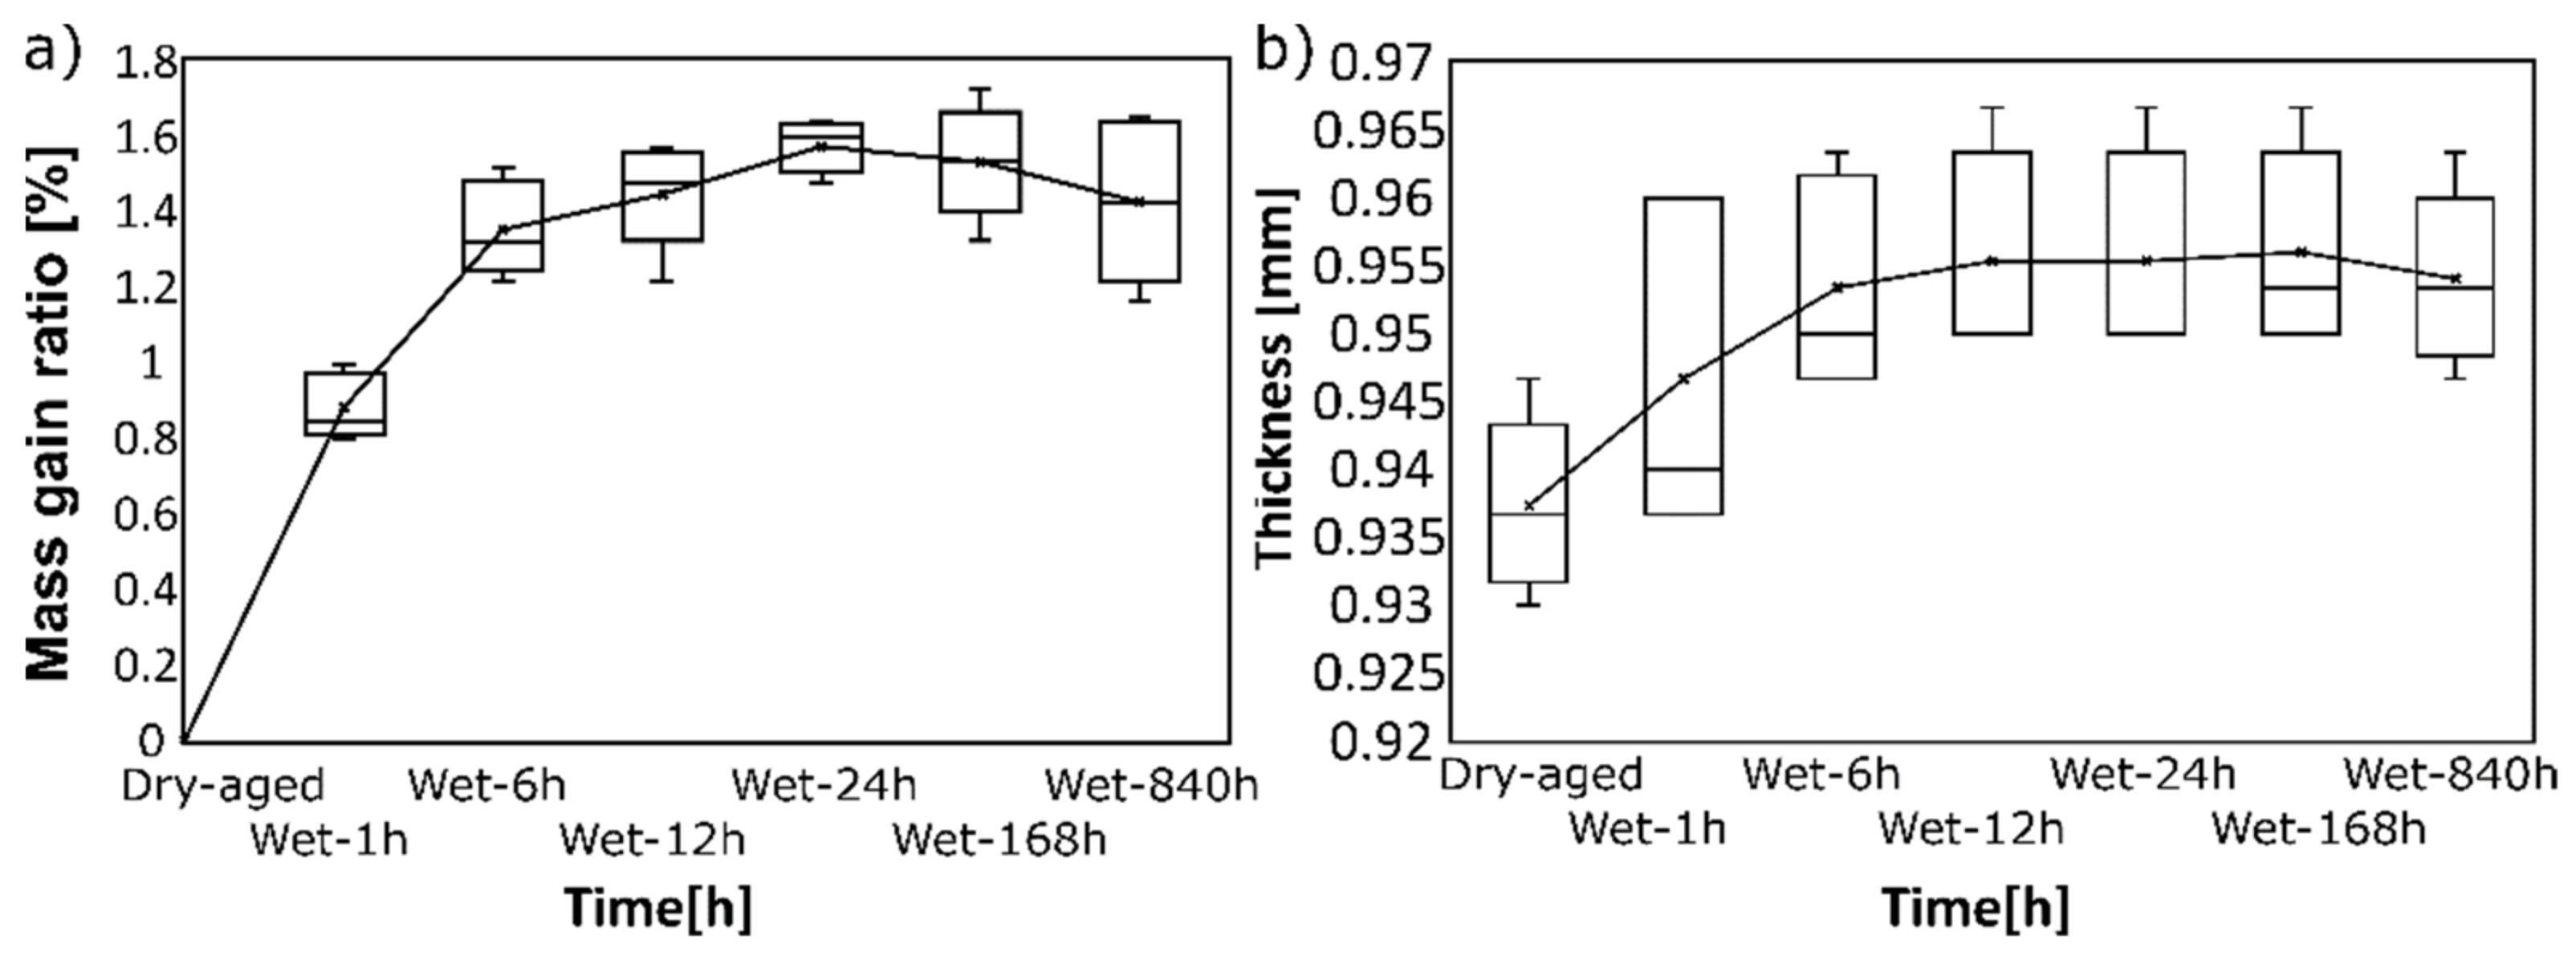
3.2. Water Uptake Measurement
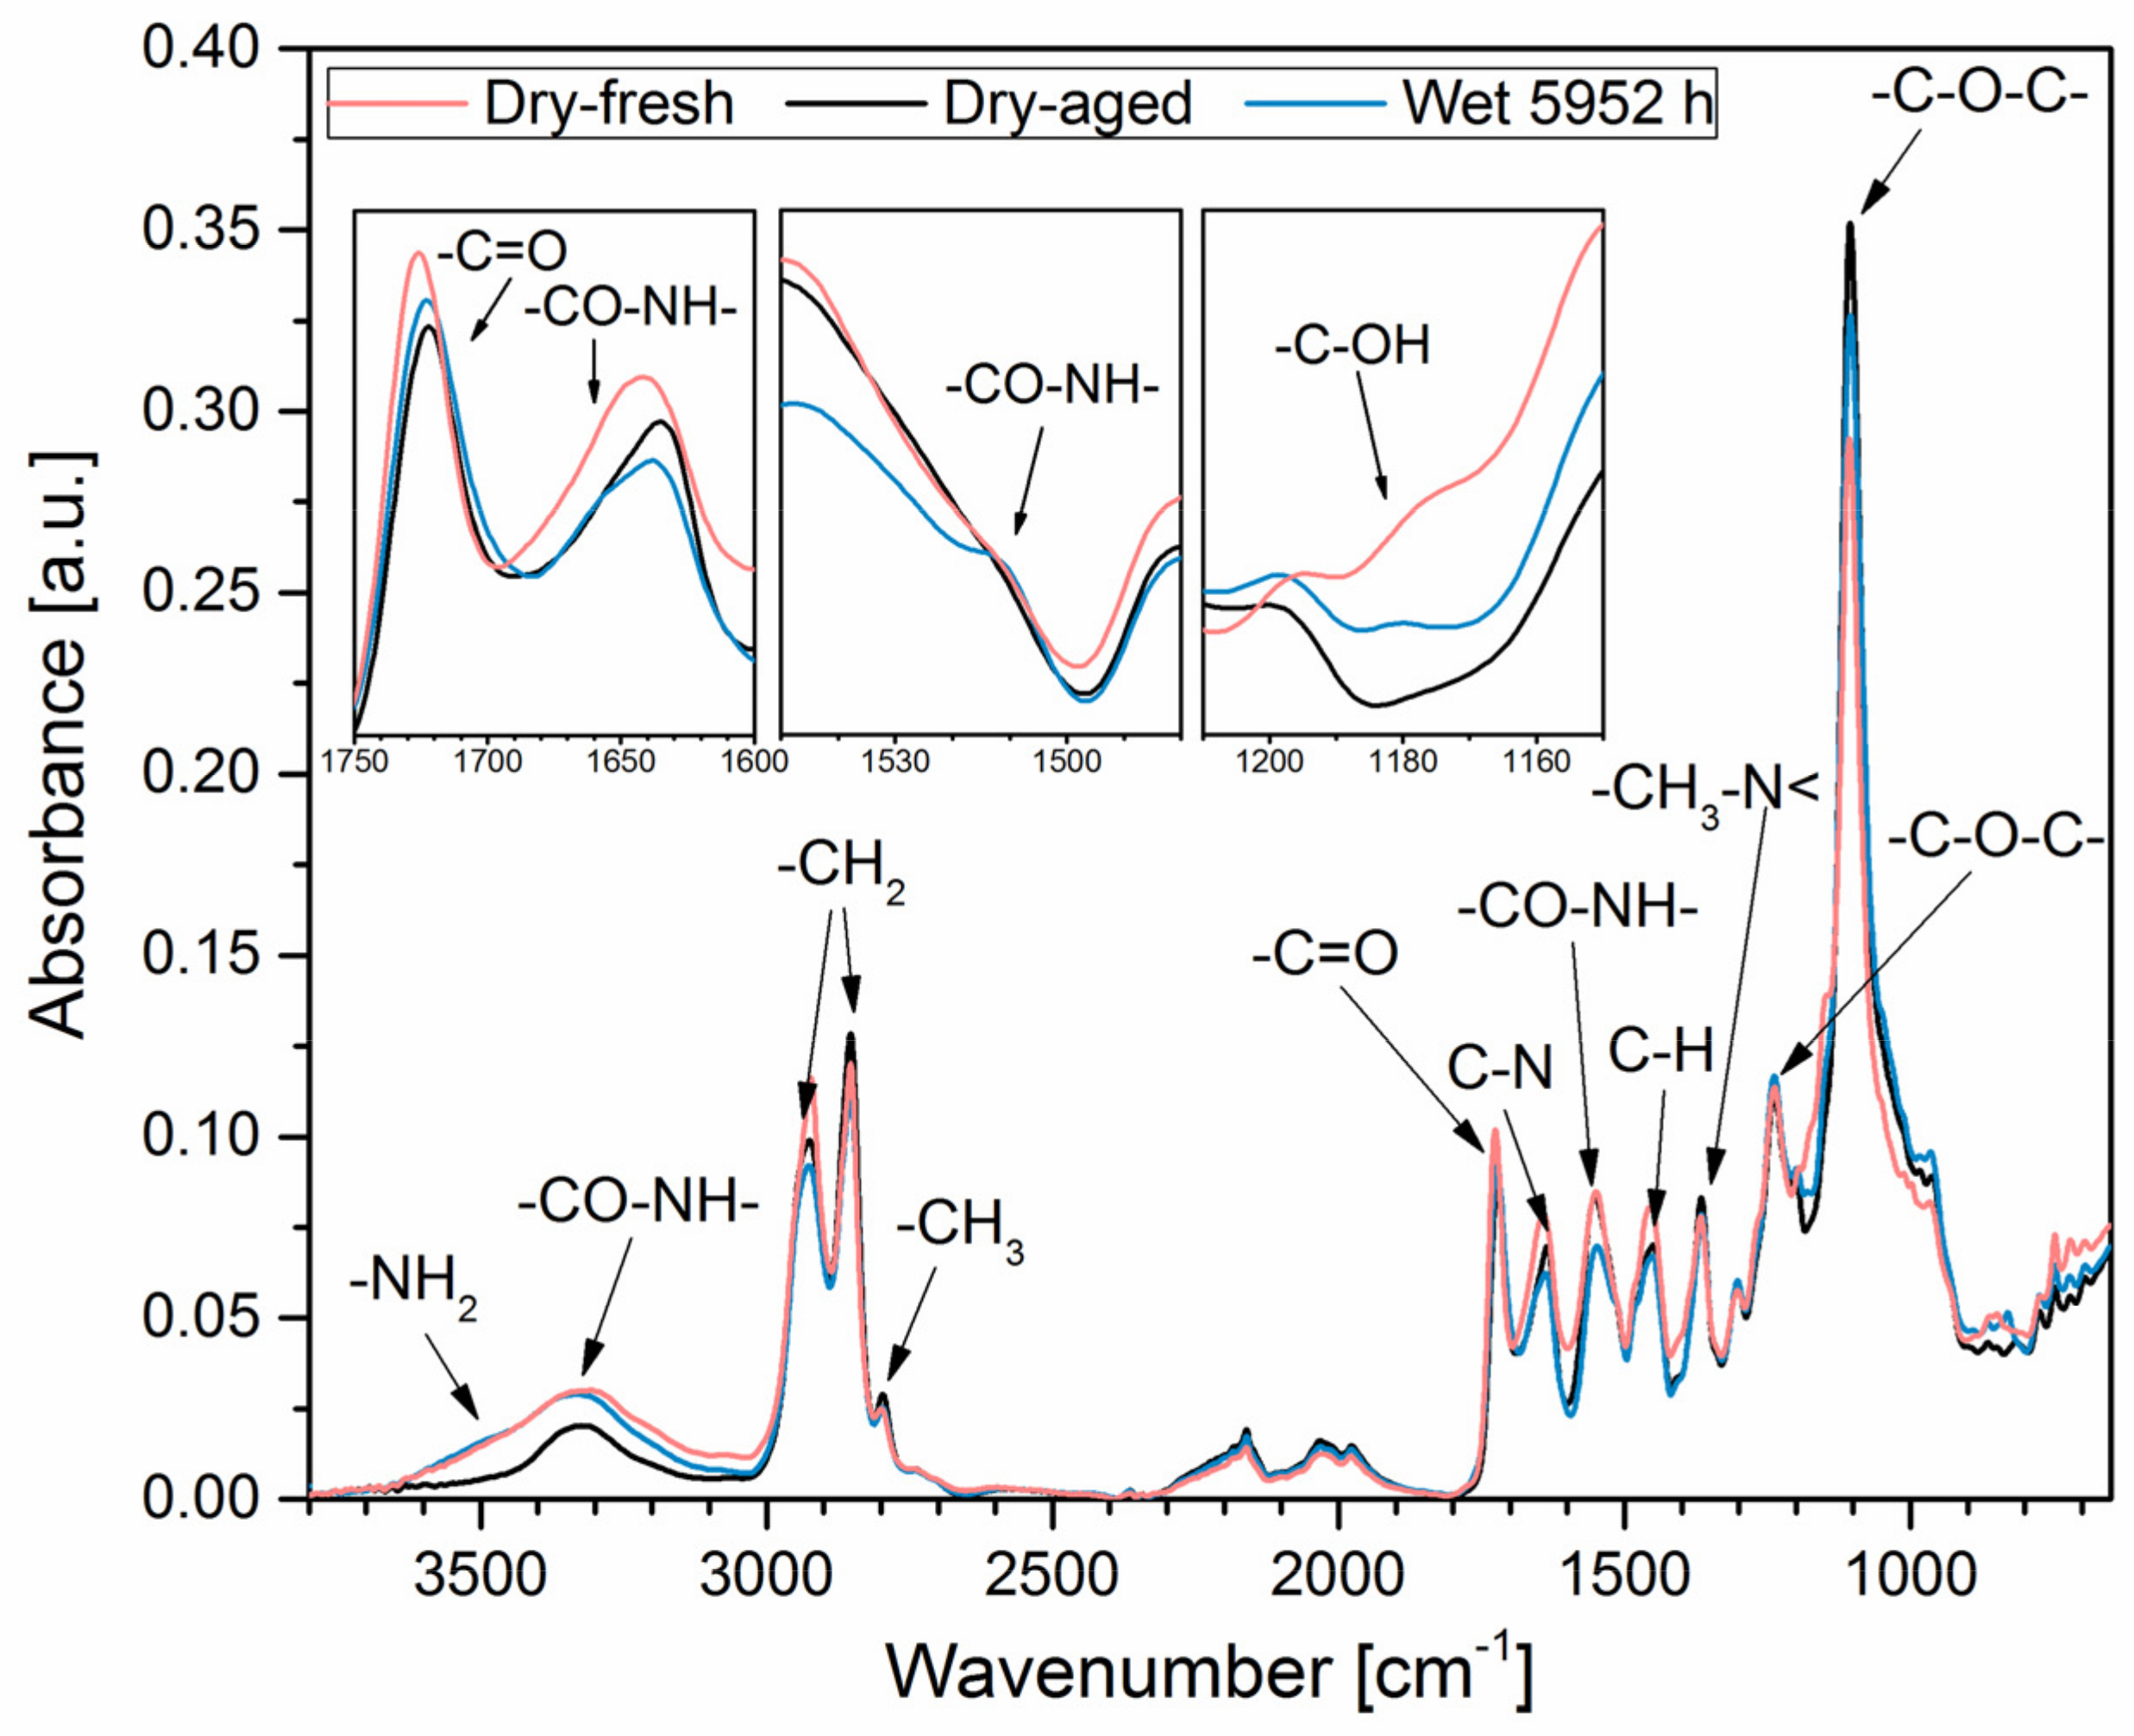
3.3. Structure Characterisation
4. Discussion
4.1. Structure Changes Due to Water Aging
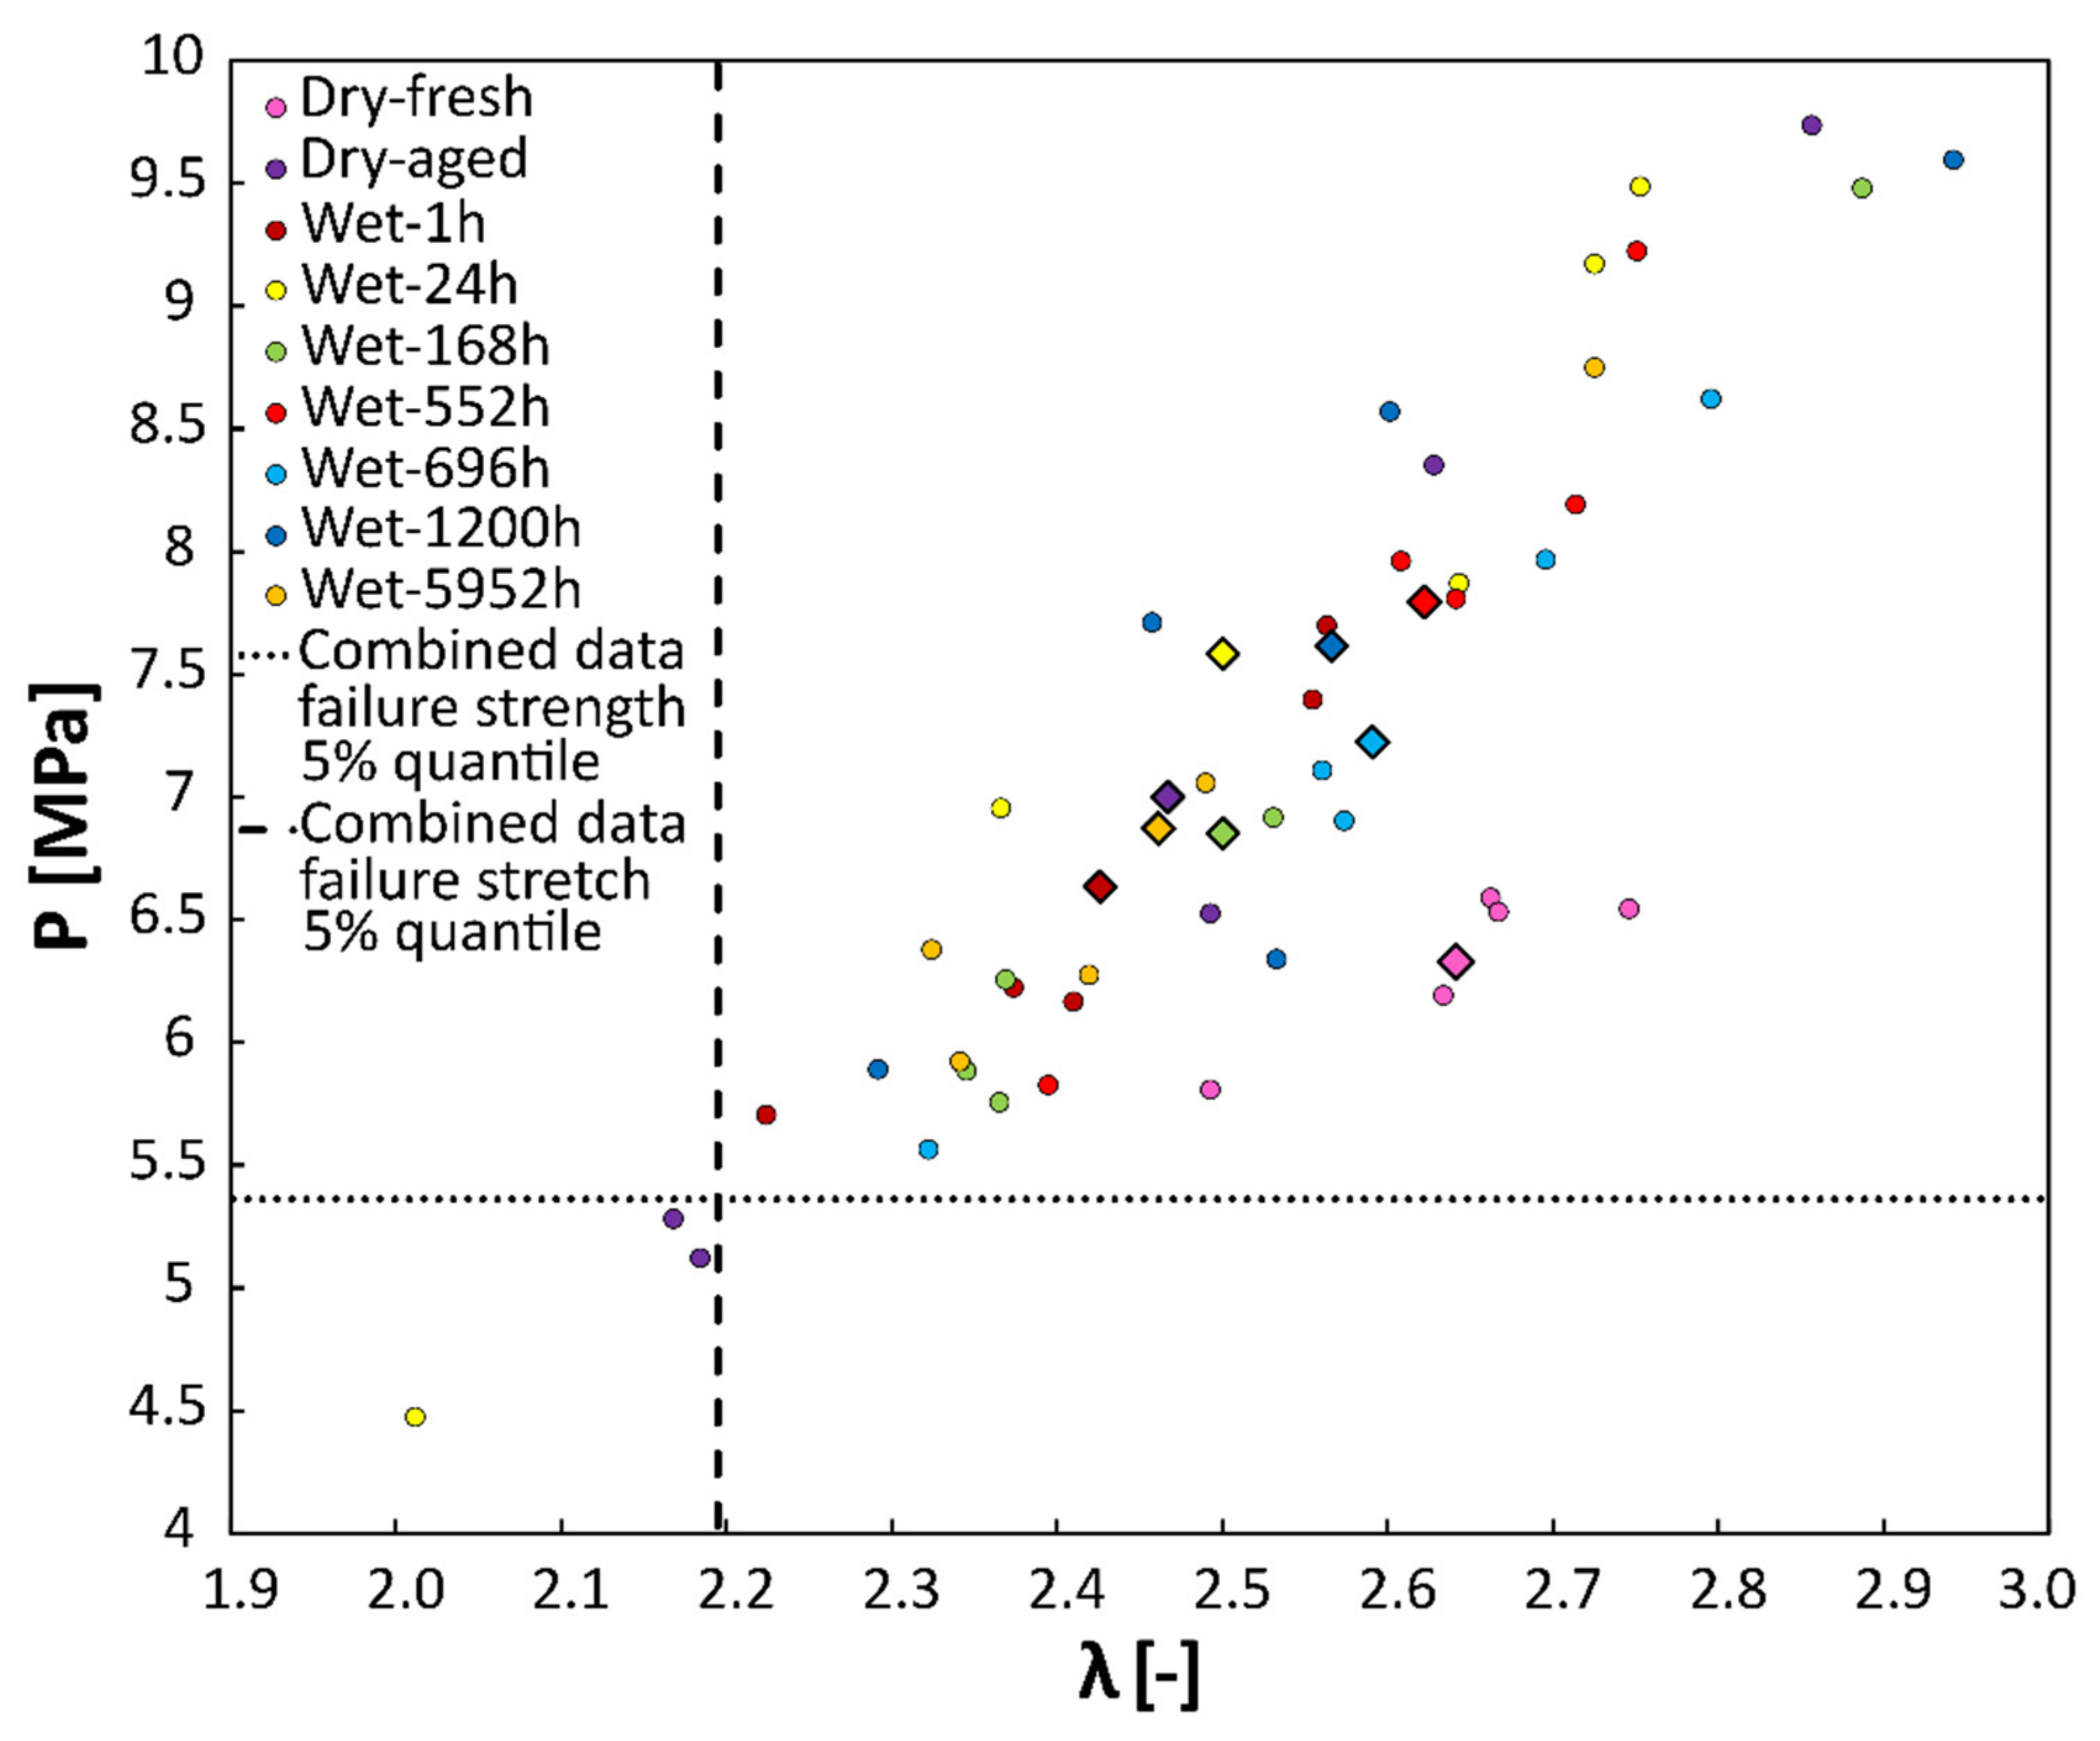
4.2. Failure Properties Are Not Affected Neither by Physical nor by Water-Induced Aging
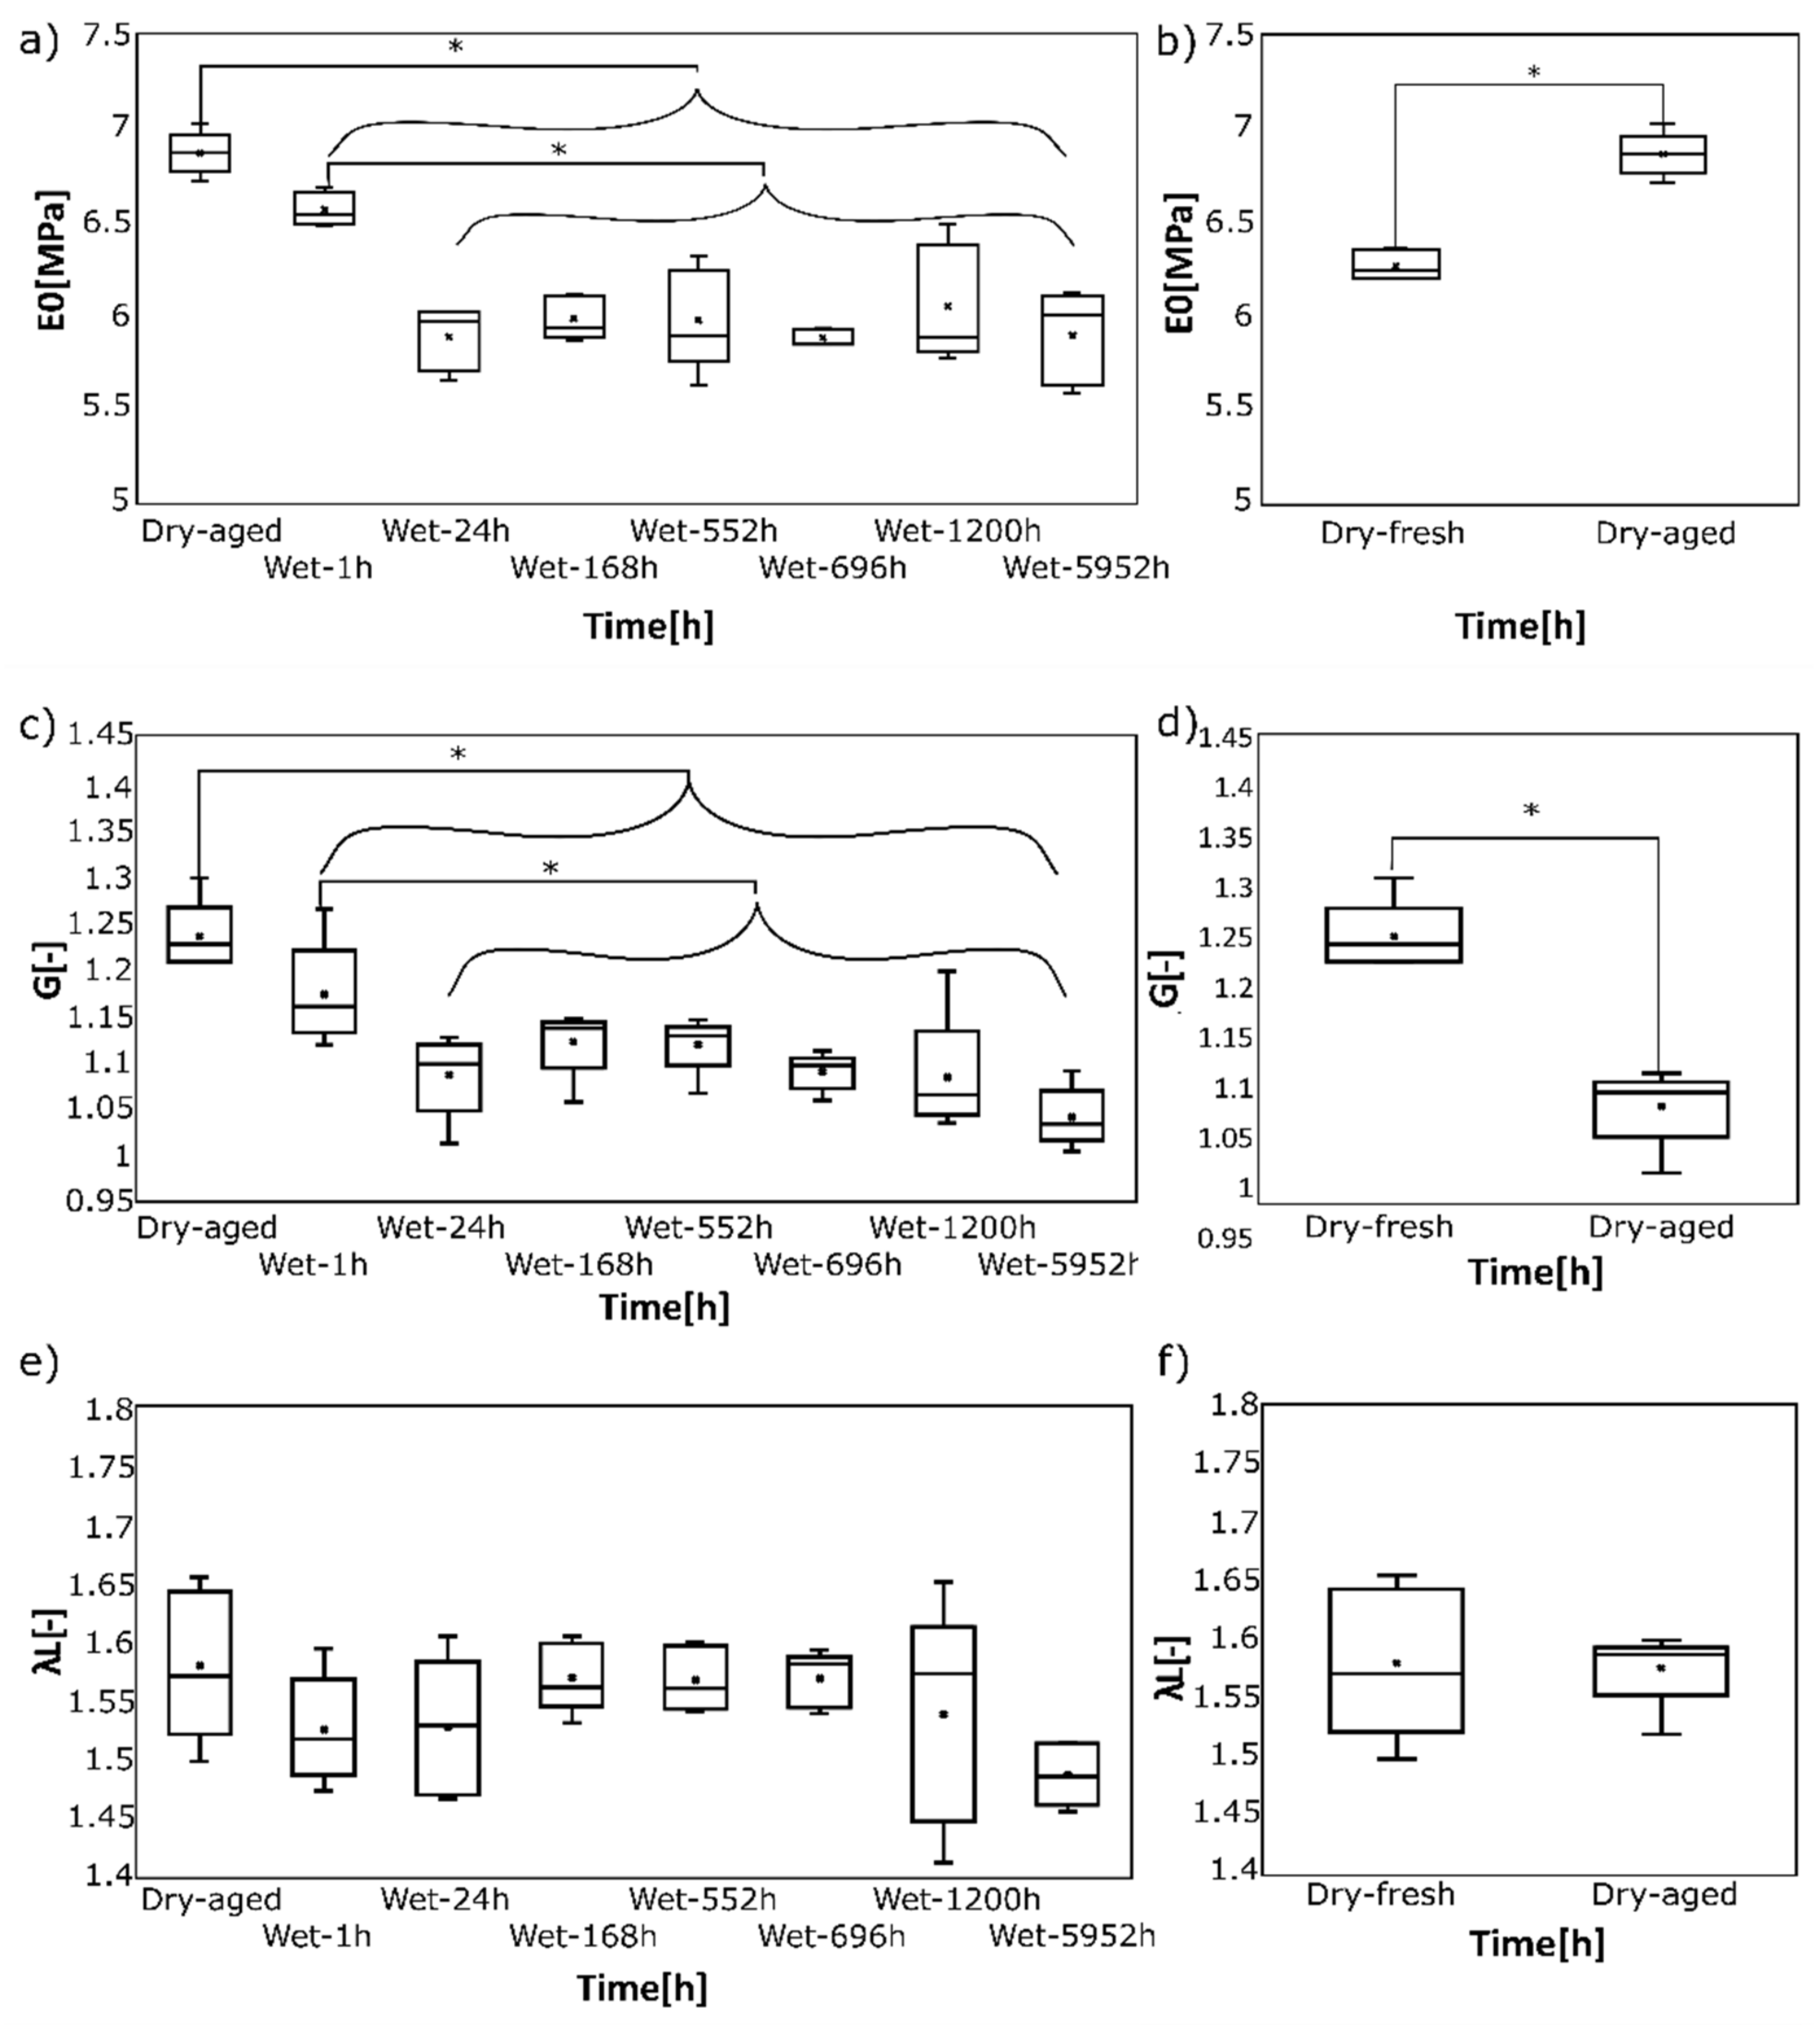
4.3. Hyperelastic Properties Are More Affected by Physical Than Water-Induced Aging
4.4. Limitations
5. Conclusions
Supplementary Materials
Author Contributions
Funding
Institutional Review Board Statement
Informed Consent Statement
Data Availability Statement
Conflicts of Interest
References
- DeSimone, J.; Ermoshkin, A.; Ermoshkin, N.; Samulski, E. Continous Liquid Interphase Printing. U.S. Patent PCT/US2014/015506, 21 August 2014. [Google Scholar]
- Hossain, M.; Liao, Z. An additively manufactured silicone polymer: Thermo-viscoelastic experimental study and computational modelling. Addit. Manuf. 2020, 35, 101395. [Google Scholar] [CrossRef]
- Hossain, M.; Navaratne, R.; Perić, D. 3D printed elastomeric polyurethane: Viscoelastic experimental characterizations and constitutive modelling with nonlinear viscosity functions. Int. J. Non-Linear Mech. 2020, 126, 103546. [Google Scholar] [CrossRef]
- Christ, J.F.; Aliheidari, N.; Ameli, A.; Pötschke, P. 3D printed highly elastic strain sensors of multiwalled carbon nanotube/thermoplastic polyurethane nanocomposites. Mater. Des. 2017, 131, 394–401. [Google Scholar] [CrossRef]
- Tan, C.; Dong, Z.; Li, Y.; Zhao, H.; Huang, X.; Zhou, Z.; Jiang, J.W.; Long, Y.Z.; Jiang, P.; Zhang, T.Y.; et al. A high performance wearable strain sensor with advanced thermal management for motion monitoring. Nat. Commun. 2020, 11, 3530. [Google Scholar] [CrossRef] [PubMed]
- Kang, Y.K.; Park, C.H.; Chang, H.; Minn, K.; Park, C.Y. Development of thermoplastic polyurethane vascular prostheses. J. Appl. Polym. Sci. 2008, 110, 3267–3274. [Google Scholar] [CrossRef]
- Jung, S.Y.; Lee, S.J.; Kim, H.Y.; Park, H.S.; Wang, Z.; Kim, H.J.; Yoo, J.J.; Chung, S.M.; Kim, H.S. 3D printed polyurethane prosthesis for partial tracheal reconstruction: A pilot animal study. Biofabrication 2016, 8, 045015. [Google Scholar] [CrossRef]
- Huang, J.J.; Ren, J.A.; Wang, G.F.; Li, Z.A.; Wu, X.W.; Ren, H.J.; Liu, S. 3D-printed “fistula stent” designed for management of enterocutaneous fistula: An advanced strategy. World J. Gastroenterol. 2017, 23, 7489–7494. [Google Scholar] [CrossRef]
- Bates, S.R.G.; Farrow, I.R.; Trask, R.S. Compressive behaviour of 3D printed thermoplastic polyurethane honeycombs with graded densities. Mater. Des. 2019, 162, 130–142. [Google Scholar] [CrossRef]
- Muflikhun, M.A.; Sentanu, D.A. Characteristics and performance of carabiner remodeling using 3D printing with graded filler and different orientation methods. Eng. Fail. Anal. 2021, 130, 105795. [Google Scholar] [CrossRef]
- Vermette, P.; Griesser, H.J.; Laroche, G.; Guidoin, R. Biomedical Applications of Polyurethanes, n.d.; Routledge: New York, NY, USA, 2021. [Google Scholar]
- Garces, I.T.; Aslanzadeh, S.; Boluk, Y.; Ayranci, C. Effect of Moisture on Shape Memory Polyurethane Polymers for Extrusion-Based Additive Manufacturing. Materials 2019, 12, 244. [Google Scholar] [CrossRef]
- Yu, K.; Ritchie, A.; Mao, Y.; Dunn, M.L.; Qi, H.J. Controlled Sequential Shape Changing Components by 3D Printing of Shape Memory Polymer Multimaterials. Procedia IUTAM 2015, 12, 193–203. [Google Scholar] [CrossRef]
- Mao, Y.; Yu, K.; Isakov, M.S.; Wu, J.; Dunn, M.L.; Qi, H.J. Sequential Self-Folding Structures by 3D Printed Digital Shape Memory Polymers. Sci. Rep. 2015, 5, 13616. [Google Scholar] [CrossRef]
- Banjo, A.D.; Agrawal, V.; Auad, M.L.; Celestine, A.-D.N. Moisture-induced changes in the mechanical behavior of 3D printed polymers. Compos. Part C Open Access 2022, 7, 100243. [Google Scholar] [CrossRef]
- Aglan, H.; Calhoun, M.; Allie, L. Effect of UV and hygrothermal aging on the mechanical performance of polyurethane elastomers. J. Appl. Polym. Sci. 2008, 108, 558–564. [Google Scholar] [CrossRef]
- Xie, F.; Zhang, T.; Bryant, P.; Kurusingal, V.; Colwell, J.M.; Laycock, B. Degradation and stabilization of polyurethane elastomers. Prog. Polym. Sci. 2019, 90, 211–268. [Google Scholar] [CrossRef]
- Stevenson, J.S.; Kusy, R.P. Structural degradation of polyurethane-based elastomeric modules. J. Mater. Sci. Mater. Electron. 1995, 6, 377–384. [Google Scholar] [CrossRef]
- Boubakri, A.; Haddar, N.; Elleuch, K.; Bienvenu, Y. Impact of aging conditions on mechanical properties of thermoplastic polyurethane. Mater. Des. 2010, 31, 4194–4201. [Google Scholar] [CrossRef]
- Boubakri, A.; Elleuch, K.; Guermazi, N.; Ayedi, H.F. Investigations on hygrothermal aging of thermoplastic polyurethane material. Mater. Des. 2009, 30, 3958–3965. [Google Scholar] [CrossRef]
- Pretsch, T.; Jakob, I.; Müller, W. Hydrolytic degradation and functional stability of a segmented shape memory poly(ester urethane). Polym. Degrad. Stab. 2009, 94, 61–73. [Google Scholar] [CrossRef]
- Celina, M.C. Review of polymer oxidation and its relationship with materials performance and lifetime prediction. Polym. Degrad. Stab. 2013, 98, 2419–2429. [Google Scholar] [CrossRef]
- Qi, H.J.; Boyce, M.C. Stress-strain behavior of thermoplastic polyurethanes. Mech. Mater. 2005, 37, 817–839. [Google Scholar] [CrossRef]
- DLS 3D Printing Technology|Carbon, (n.d.). Available online: https://www.carbon3d.com/carbon-dls-technology/ (accessed on 13 January 2022).
- Pagac, M.; Hajnys, J.; Ma, Q.-P.; Jancar, L.; Jansa, J.; Stefek, P.; Mesicek, J. A Review of Vat Photopolymerization Technology: Materials, Applications, Challenges, and Future Trends of 3D Printing. Polymers 2021, 13, 598. [Google Scholar] [CrossRef] [PubMed]
- Velankar, S.; Pazos, J.; Cooper, S.L. High-performance UV-curable urethane acrylates via deblocking chemistry. J. Appl. Polym. Sci. 1996, 62, 1361–1376. [Google Scholar] [CrossRef]
- EPU 40—Elastomeric Polyurethane Resin for Carbon 3D Printers, (n.d.). Available online: https://www.carbon3d.com/materials/epu-40/ (accessed on 13 January 2022).
- Herzberger, J.; Sirrine, J.M.; Williams, C.B.; Long, T.E. Polymer Design for 3D Printing Elastomers: Recent Advances in Structure, Properties, and Printing. Prog. Polym. Sci. 2019, 97, 101144. [Google Scholar] [CrossRef]
- Rolland, J.; Chen, K.; Poelma, J.; Goodrich, J.; Pinschmidt, R.; DeSimone, J.; Robeson, L. US9453142B2—Polyurethane Resins Having Multiple Mechanisms of Hardening for Use in Producing Three-Dimensional Objects. 2016. Available online: https://patents.google.com/patent/US9453142B2/en (accessed on 4 July 2022).
- Lee, J.Y.; An, J.; Chua, C.K. Fundamentals and applications of 3D printing for novel materials. Appl. Mater. Today. 2017, 7, 120–133. [Google Scholar] [CrossRef]
- Pagac, M.; Schwarz, D.; Petru, J.; Polzer, S. 3D printed polyurethane exhibits isotropic elastic behavior despite its anisotropic surface. Rapid Prototyp. J. 2020, 26, 1371–1378. [Google Scholar] [CrossRef]
- Arruda, E.M.; Boyce, M.C. A three-dimensional constitutive model for large stretch behavior of rubber elastic materials. J. Mech. Phys. Solids 1993, 41, 389–412. [Google Scholar] [CrossRef]
- Steinmann, P.; Hossain, M.; Possart, G. Hyperelastic models for rubber-like materials: Consistent tangent operators and suitability for Treloar’s data. Arch. Appl. Mech. 2012, 82, 1183–1217. [Google Scholar] [CrossRef]
- Hackett, R.M. Hyperelasticity Primer, 2nd ed.; Springer International Publishing: Berlin/Heidelberg, Germany, 2018; pp. 1–186. [Google Scholar]
- Wan, Y.Z.; Wang, Y.L.; Huang, Y.; He, B.M.; Han, K.Y. Hygrothermal aging behaviour of VARTMed three-dimensional braided carbon-epoxy composites under external stresses. Compos. Part A Appl. Sci. Manuf. 2005, 36, 1102–1109. [Google Scholar] [CrossRef]
- Kanyanta, V.; Ivankovic, A. Mechanical characterisation of polyurethane elastomer for biomedical applications. J. Mech. Behav. Biomed. Mater. 2010, 3, 51–62. [Google Scholar] [CrossRef]
- Bhargava, S.; Kubota, M.; Lewis, R.D.; Advani, S.G.; Prasad, A.K.; Deitzel, J.M. Ultraviolet, water, and thermal aging studies of a waterborne polyurethane elastomer-based high reflectivity coating. Prog. Org. Coat. 2015, 79, 75–82. [Google Scholar] [CrossRef]
- Slater, C.; Davis, C.; Strangwood, M. Compression set of thermoplastic polyurethane under different thermal-mechanical-moisture conditions. Polym. Degrad. Stab. 2011, 96, 2139–2144. [Google Scholar] [CrossRef]


| Submerged Time [h] | Dry-Fresh | Dry-Aged | 1 | 24 | 168 | 552 | 696 | 1200 | 5952 |
|---|---|---|---|---|---|---|---|---|---|
| Sample No | Strength [MPa] | ||||||||
| 1 | 6.59 | 5.11 | 7.69 | 6.95 | 5.75 | 8.19 | 5.56 | 7.70 | 7.05 |
| 2 | 6.54 | 6.52 | 6.16 | 7.86 | 6.91 | 7.80 | 6.90 | 5.88 | 5.92 |
| 3 | 6.19 | 5.28 | 5.70 | 9.48 | 9.47 | 7.95 | 7.10 | 6.33 | 6.27 |
| 4 | 6.53 | 9.73 | 6.22 | 4.47 | 5.88 | 9.22 | 7.96 | 9.59 | 6.37 |
| 5 | 5.80 | 8.35 | 7.39 | 9.17 | 6.25 | 5.82 | 8.62 | 8.56 | 8.75 |
| Mean | 6.33 | 7.00 | 6.63 | 7.59 | 6.85 | 7.80 | 7.23 | 7.61 | 6.87 |
| SD | 0.3 | 1.79 | 0.77 | 1.8 | 1.37 | 1.1 | 1.04 | 1.38 | 1.01 |
| Submerged Time [h] | Dry-Fresh | Dry-Aged | 1 | 24 | 168 | 552 | 696 | 1200 | 5952 |
|---|---|---|---|---|---|---|---|---|---|
| Sample No | Failure Stretch [-] | ||||||||
| 1 | 2.66 | 2.19 | 2.56 | 2.37 | 2.37 | 2.71 | 2.32 | 2.46 | 2.49 |
| 2 | 2.75 | 2.49 | 2.41 | 2.64 | 2.53 | 2.64 | 2.57 | 2.29 | 2.34 |
| 3 | 2.63 | 2.17 | 2.22 | 2.75 | 2.89 | 2.61 | 2.56 | 2.53 | 2.42 |
| 4 | 2.67 | 2.86 | 2.37 | 2.01 | 2.35 | 2.75 | 2.70 | 2.94 | 2.33 |
| 5 | 2.49 | 2.63 | 2.56 | 2.73 | 2.37 | 2.40 | 2.80 | 2.60 | 2.73 |
| Mean | 2.64 | 2.47 | 2.43 | 2.50 | 2.50 | 2.62 | 2.59 | 2.57 | 2.46 |
| SD | 0.08 | 0.26 | 0.13 | 0.28 | 0.21 | 0.12 | 0.16 | 0.22 | 0.15 |
| I1640/I2925 | I1640/I2855 | I1550/I2925 | I1550/I2855 | |
|---|---|---|---|---|
| EPU 40 Dry-fresh | 0.664 ± 0.060 | 0.576 ± 0.019 | 0.758 ± 0.018 | 0.622 ± 0.051 |
| EPU 40 Dry-aged | 0.670 ± 0.060 | 0.522 ± 0.039 | 0.773 ± 0.080 | 0.613 ± 0.055 |
| EPU 40 Wet 5952 | 0.647 ± 0.027 | 0.520 ± 0.028 | 0.737 ± 0.035 | 0.607 ± 0.025 |
| Δ (I1640/I2925) (%) | Δ (I1640/I2925) (%) | Δ I1640/I2925 (%) | Δ I1550/I2855 (%) | |
| After Dry aging | +0.9 | −9.4 | +2.0 | −1.4 |
| After water exposure | −2.6 | −9.7 | −2.8 | −2.4 |
Publisher’s Note: MDPI stays neutral with regard to jurisdictional claims in published maps and institutional affiliations. |
© 2022 by the authors. Licensee MDPI, Basel, Switzerland. This article is an open access article distributed under the terms and conditions of the Creative Commons Attribution (CC BY) license (https://creativecommons.org/licenses/by/4.0/).
Share and Cite
Schwarz, D.; Pagáč, M.; Petruš, J.; Polzer, S. Effect of Water-Induced and Physical Aging on Mechanical Properties of 3D Printed Elastomeric Polyurethane. Polymers 2022, 14, 5496. https://doi.org/10.3390/polym14245496
Schwarz D, Pagáč M, Petruš J, Polzer S. Effect of Water-Induced and Physical Aging on Mechanical Properties of 3D Printed Elastomeric Polyurethane. Polymers. 2022; 14(24):5496. https://doi.org/10.3390/polym14245496
Chicago/Turabian StyleSchwarz, David, Marek Pagáč, Josef Petruš, and Stanislav Polzer. 2022. "Effect of Water-Induced and Physical Aging on Mechanical Properties of 3D Printed Elastomeric Polyurethane" Polymers 14, no. 24: 5496. https://doi.org/10.3390/polym14245496
APA StyleSchwarz, D., Pagáč, M., Petruš, J., & Polzer, S. (2022). Effect of Water-Induced and Physical Aging on Mechanical Properties of 3D Printed Elastomeric Polyurethane. Polymers, 14(24), 5496. https://doi.org/10.3390/polym14245496