
Comparative Study on Blast Damage Features of Reinforced Concrete Slabs with Polyurethane Sacrificial Cladding Based on Different Numerical Simulation Methods


Abstract
:1. Introduction
2. Description of The Coupling Method
2.1. CEL Method
2.2. ALE Coupling Method
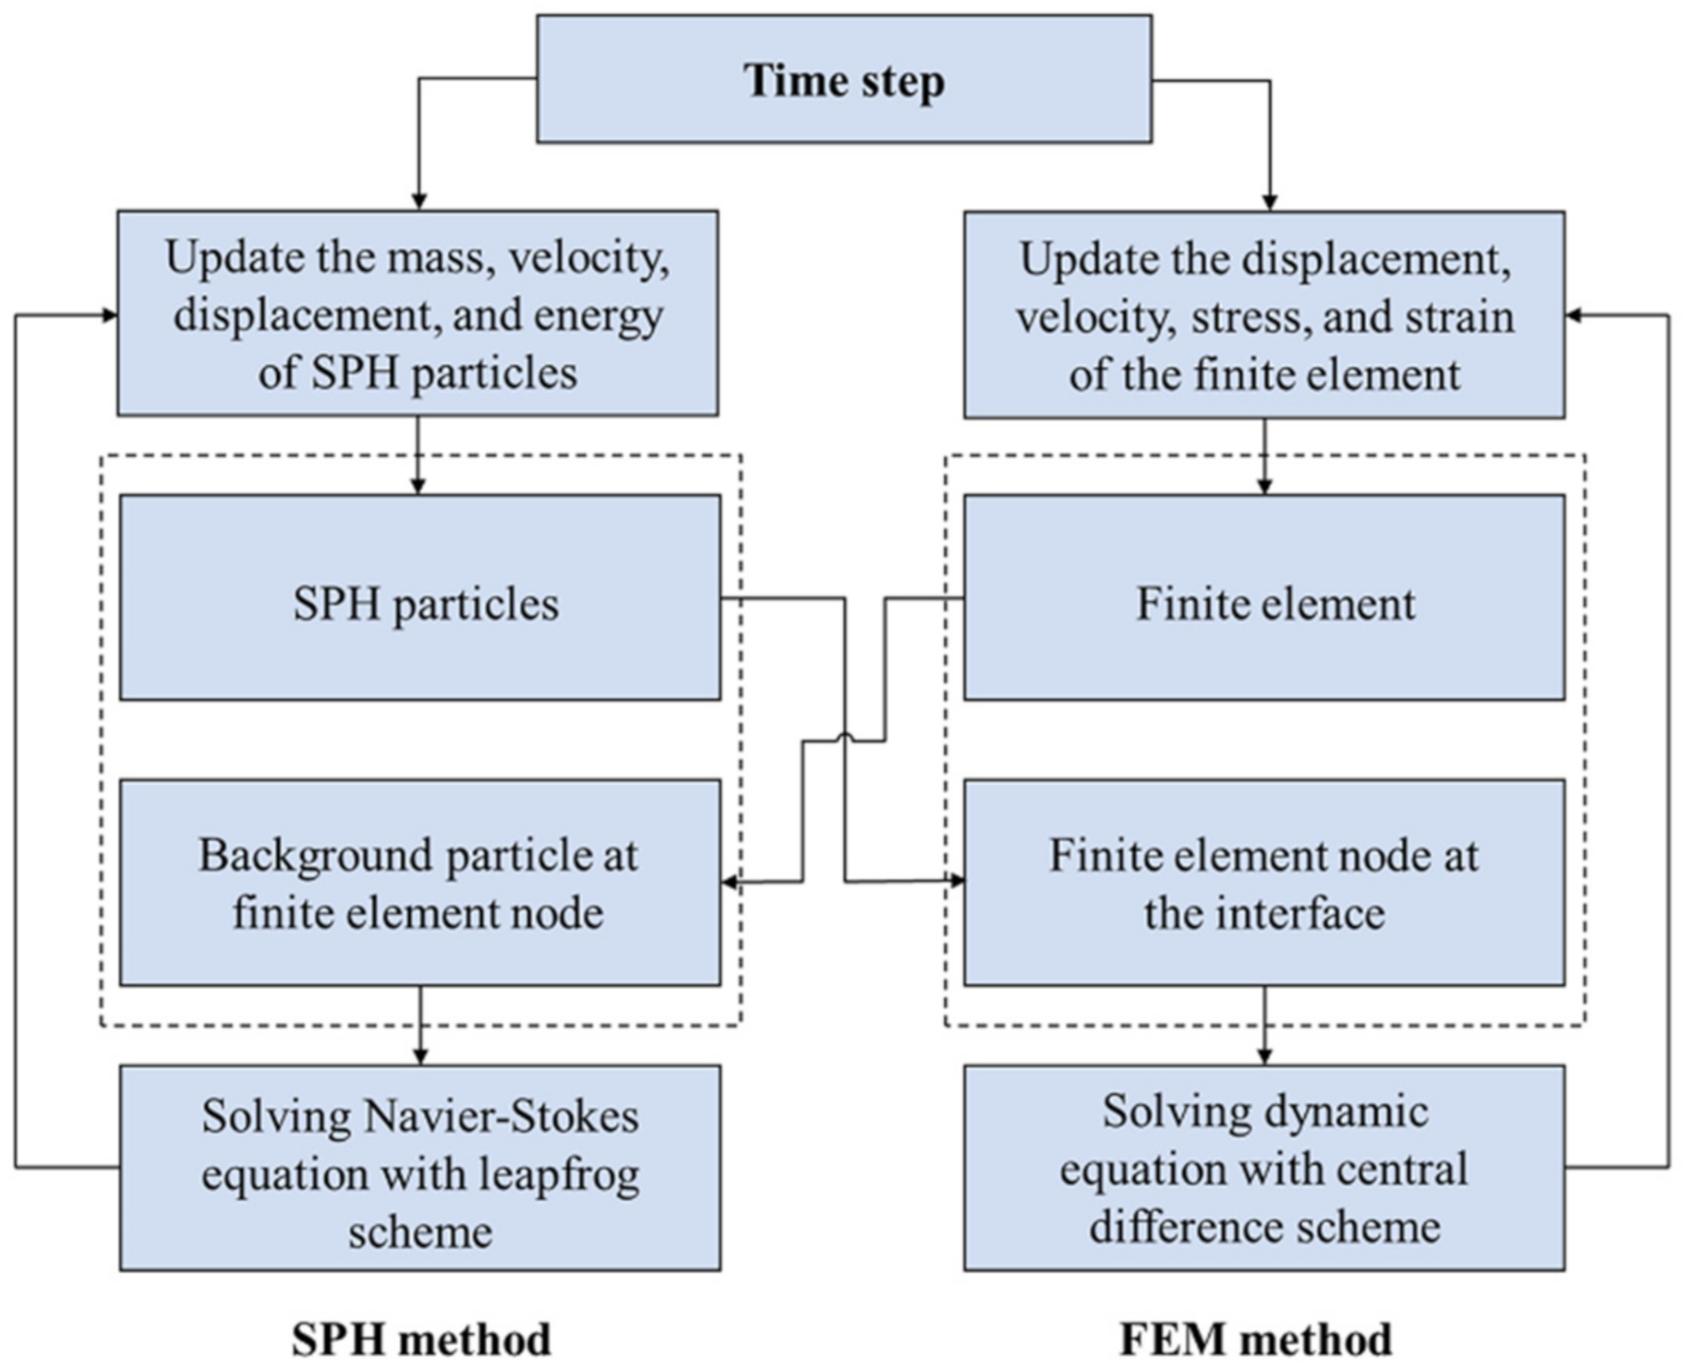
2.3. SPH–FEM Coupling Method
3. Field Test and Numerical Models
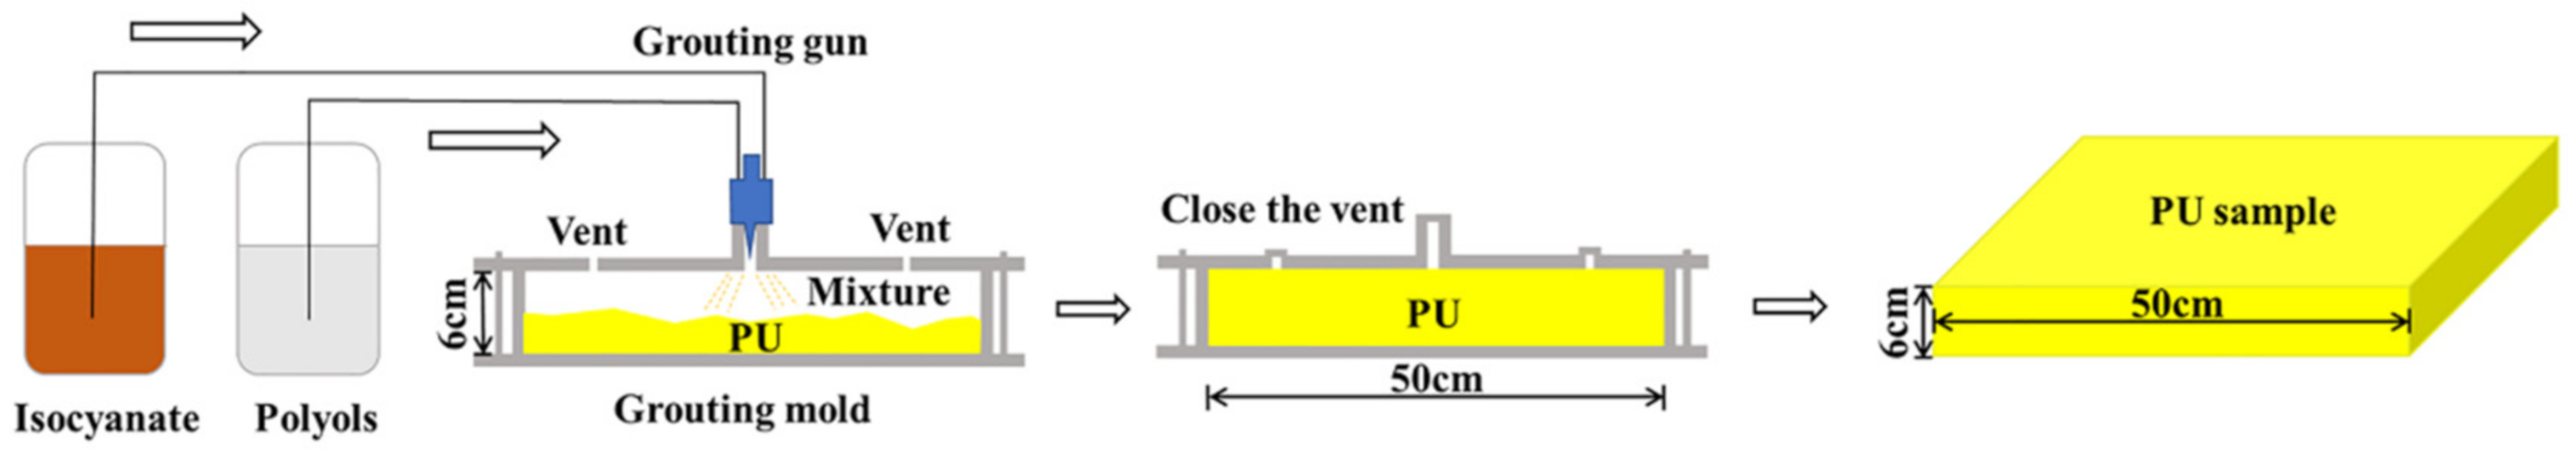
3.1. Field Test
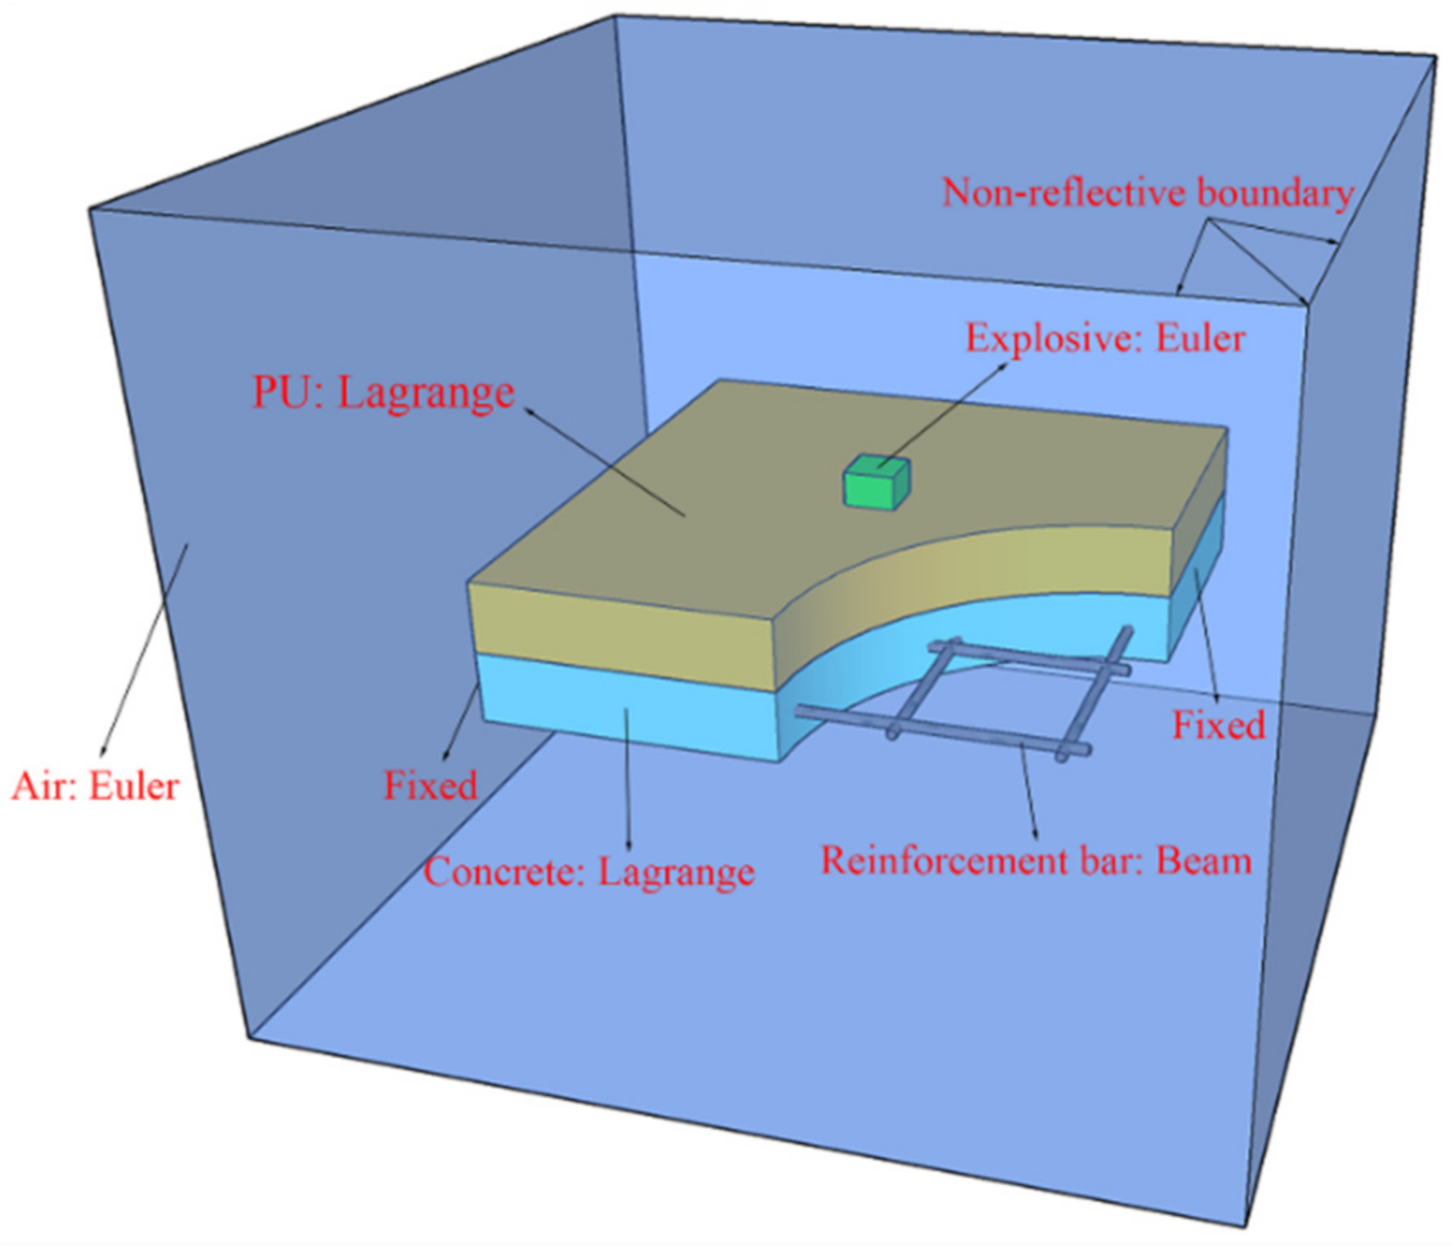
3.2. CEL Model
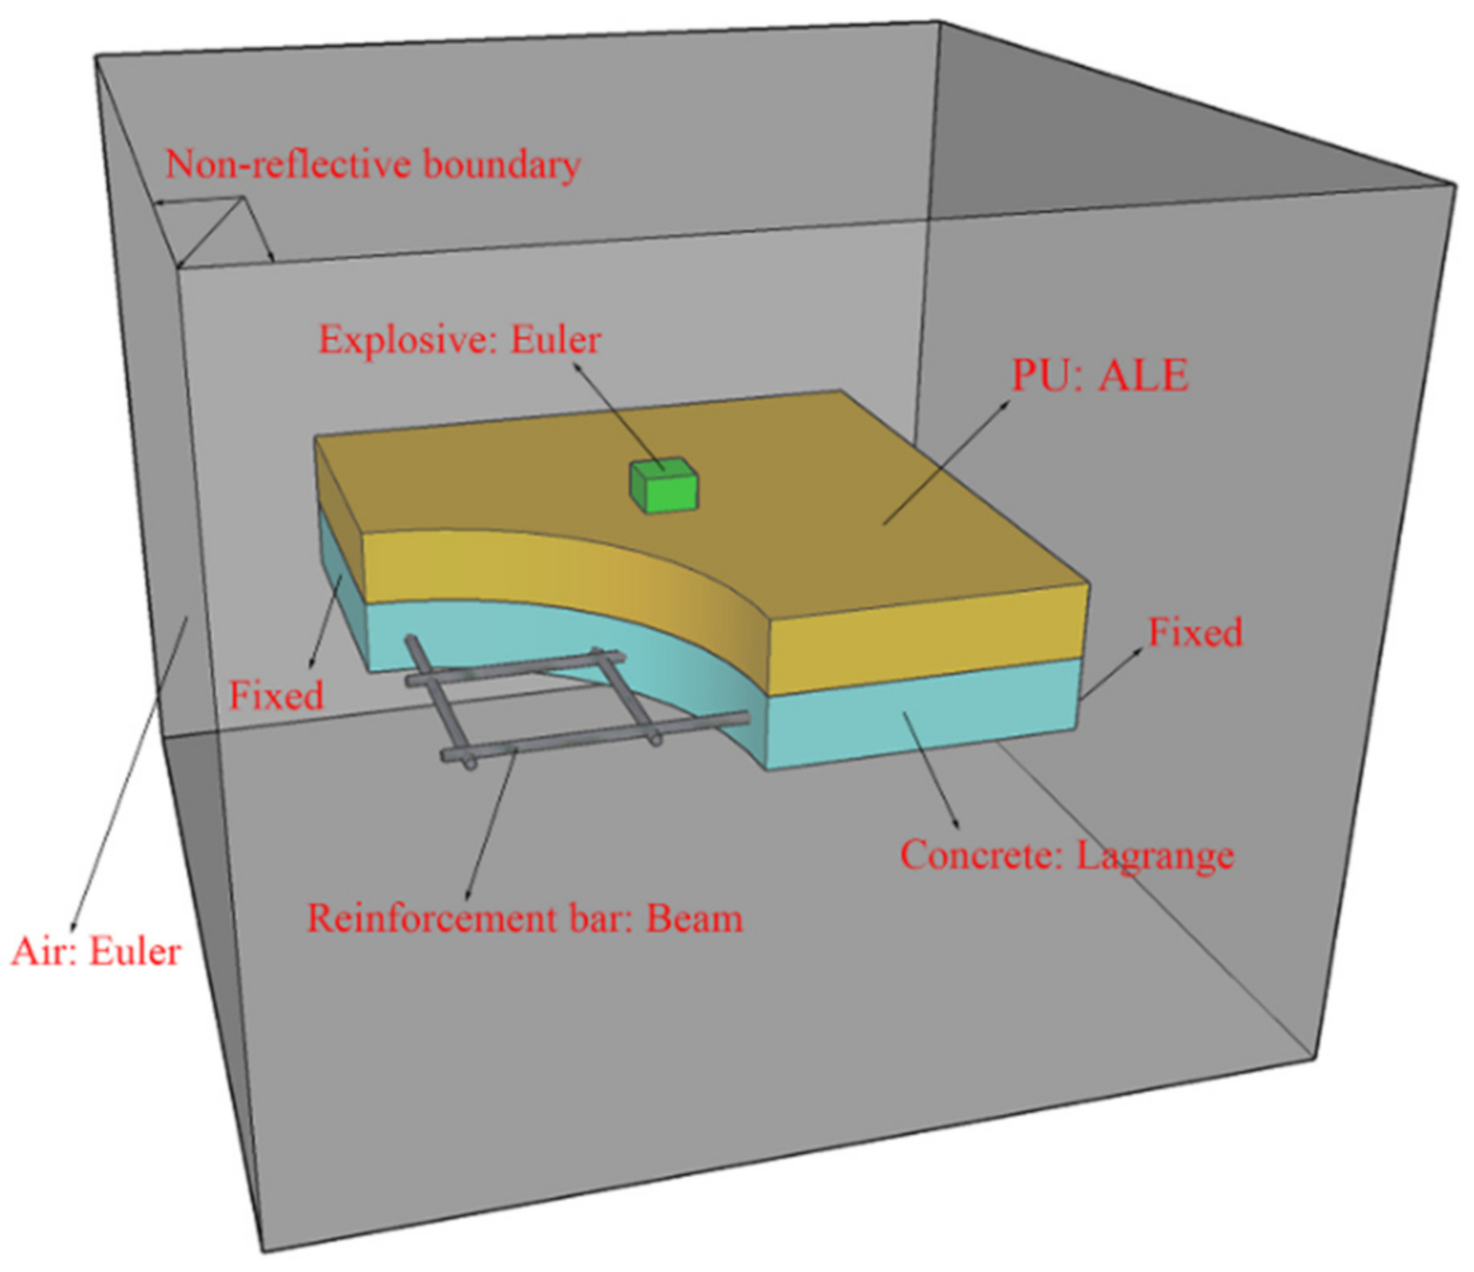
3.3. ALE Coupling Model
3.4. SPH–FEM Coupling Model
3.5. Material Model
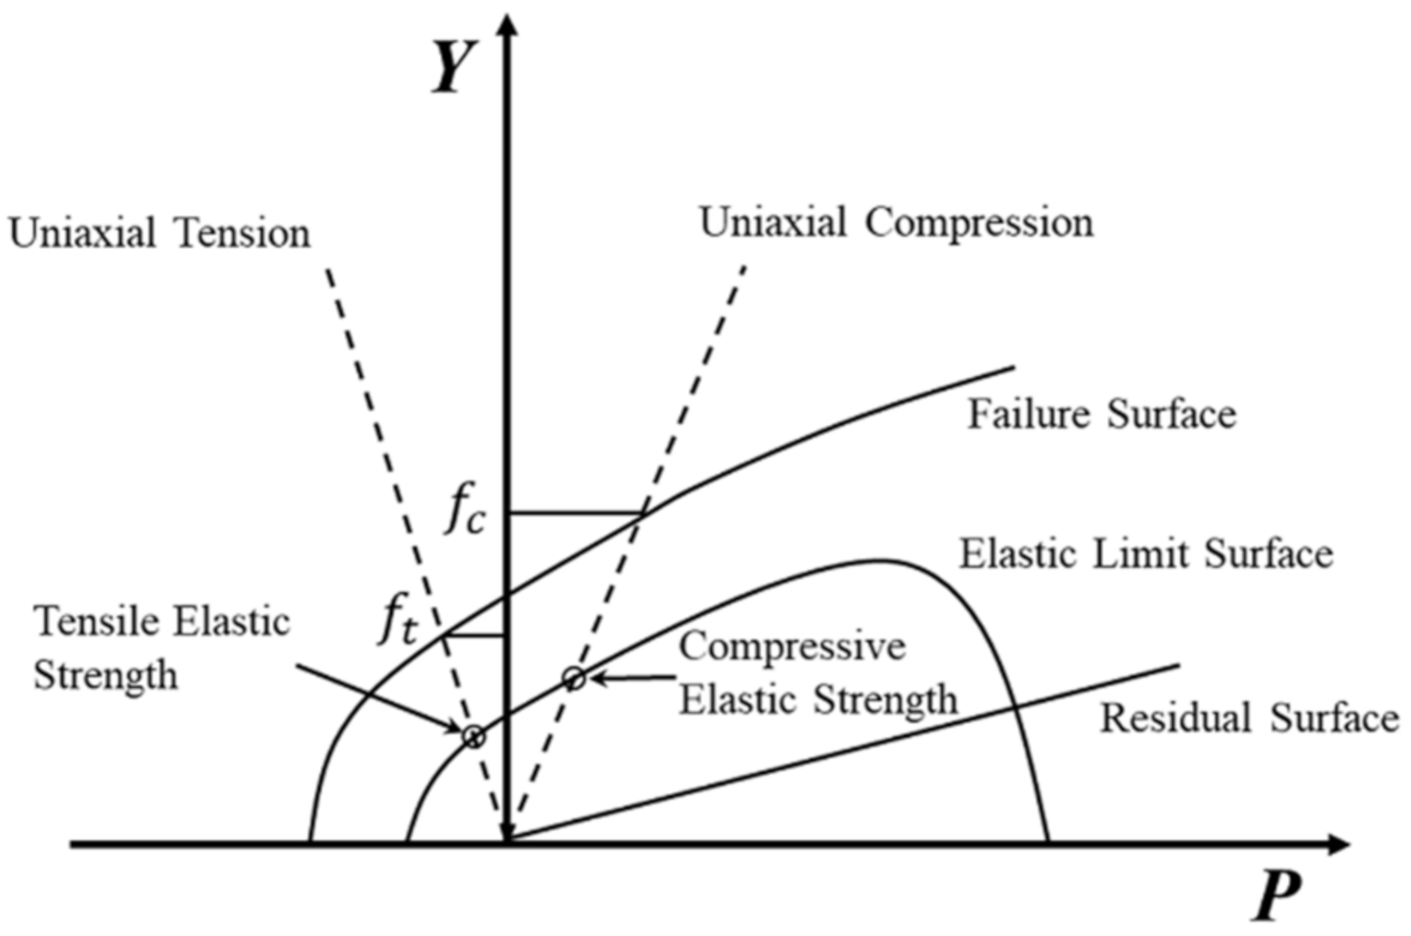
3.5.1. Concrete
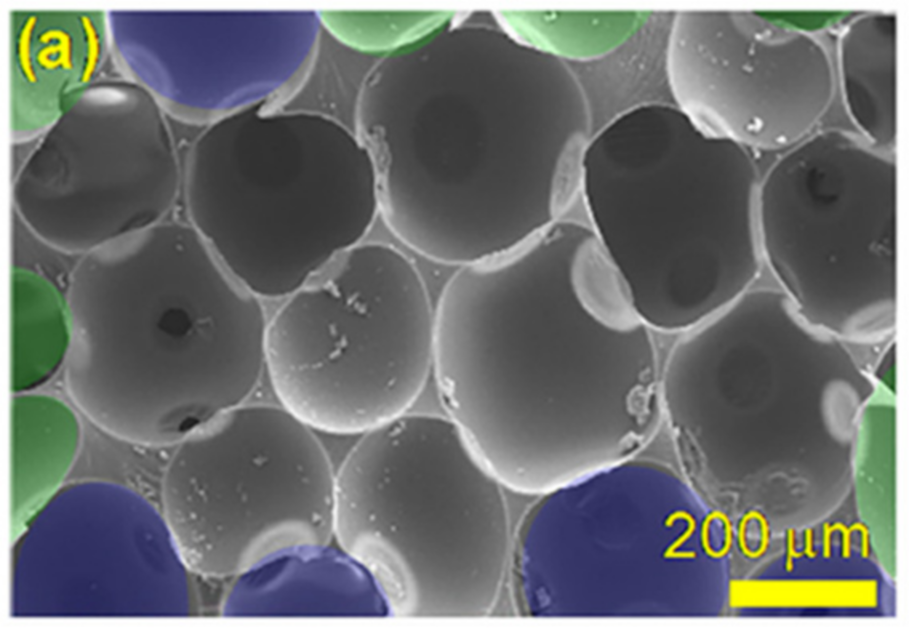
3.5.2. Polyurethane
3.5.3. Steel, Explosives, and Air
4. Model Validation and Applicability Analysis
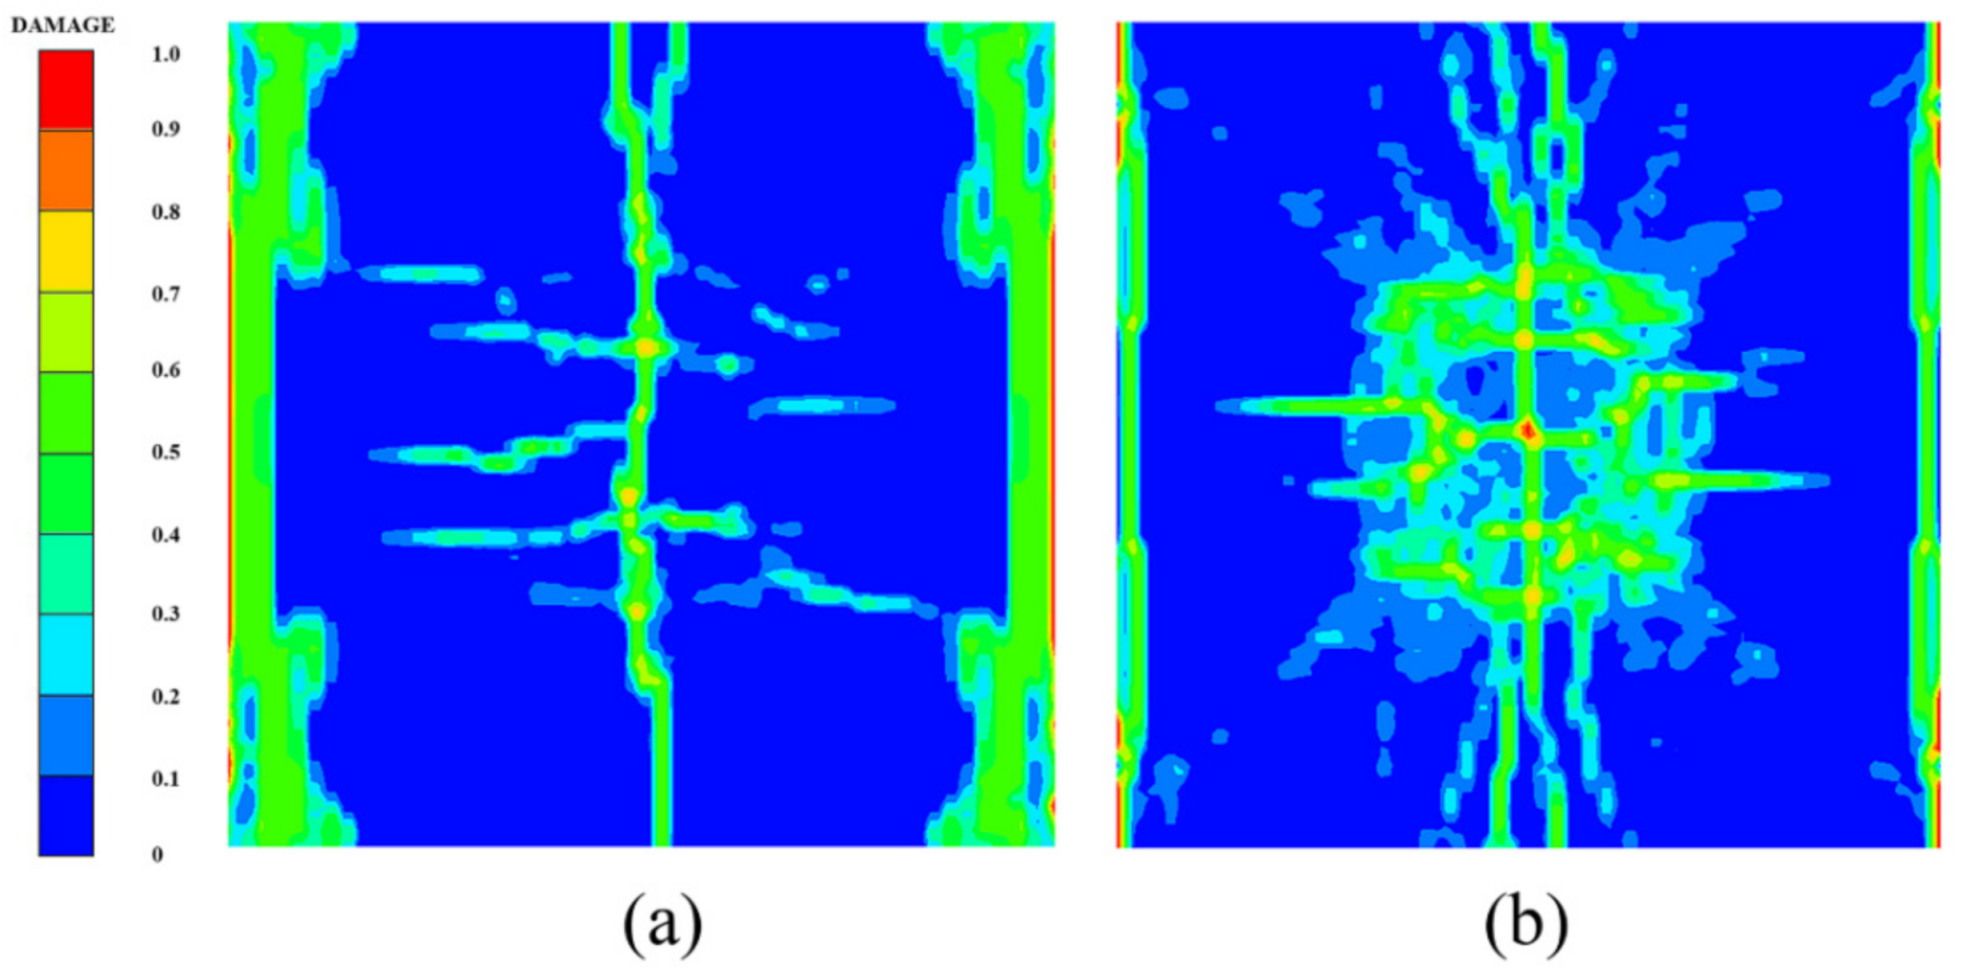
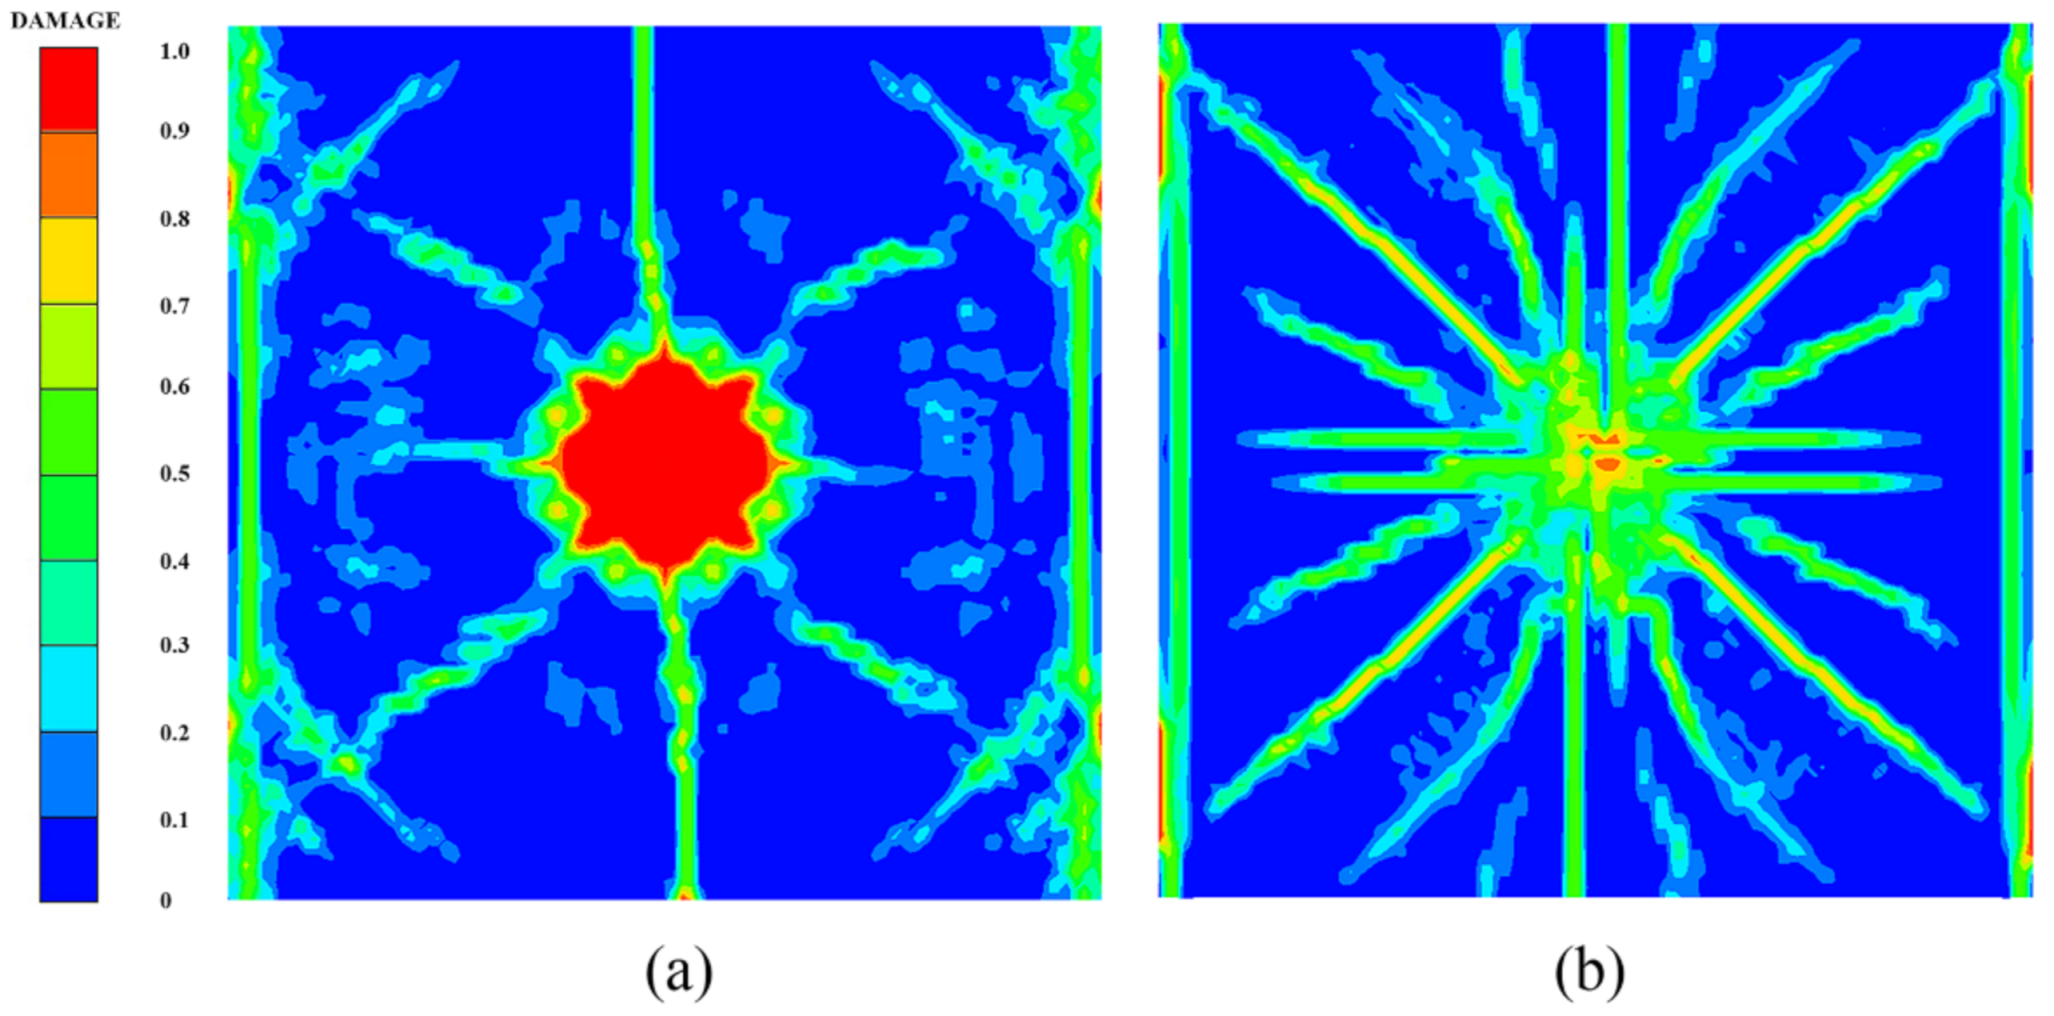
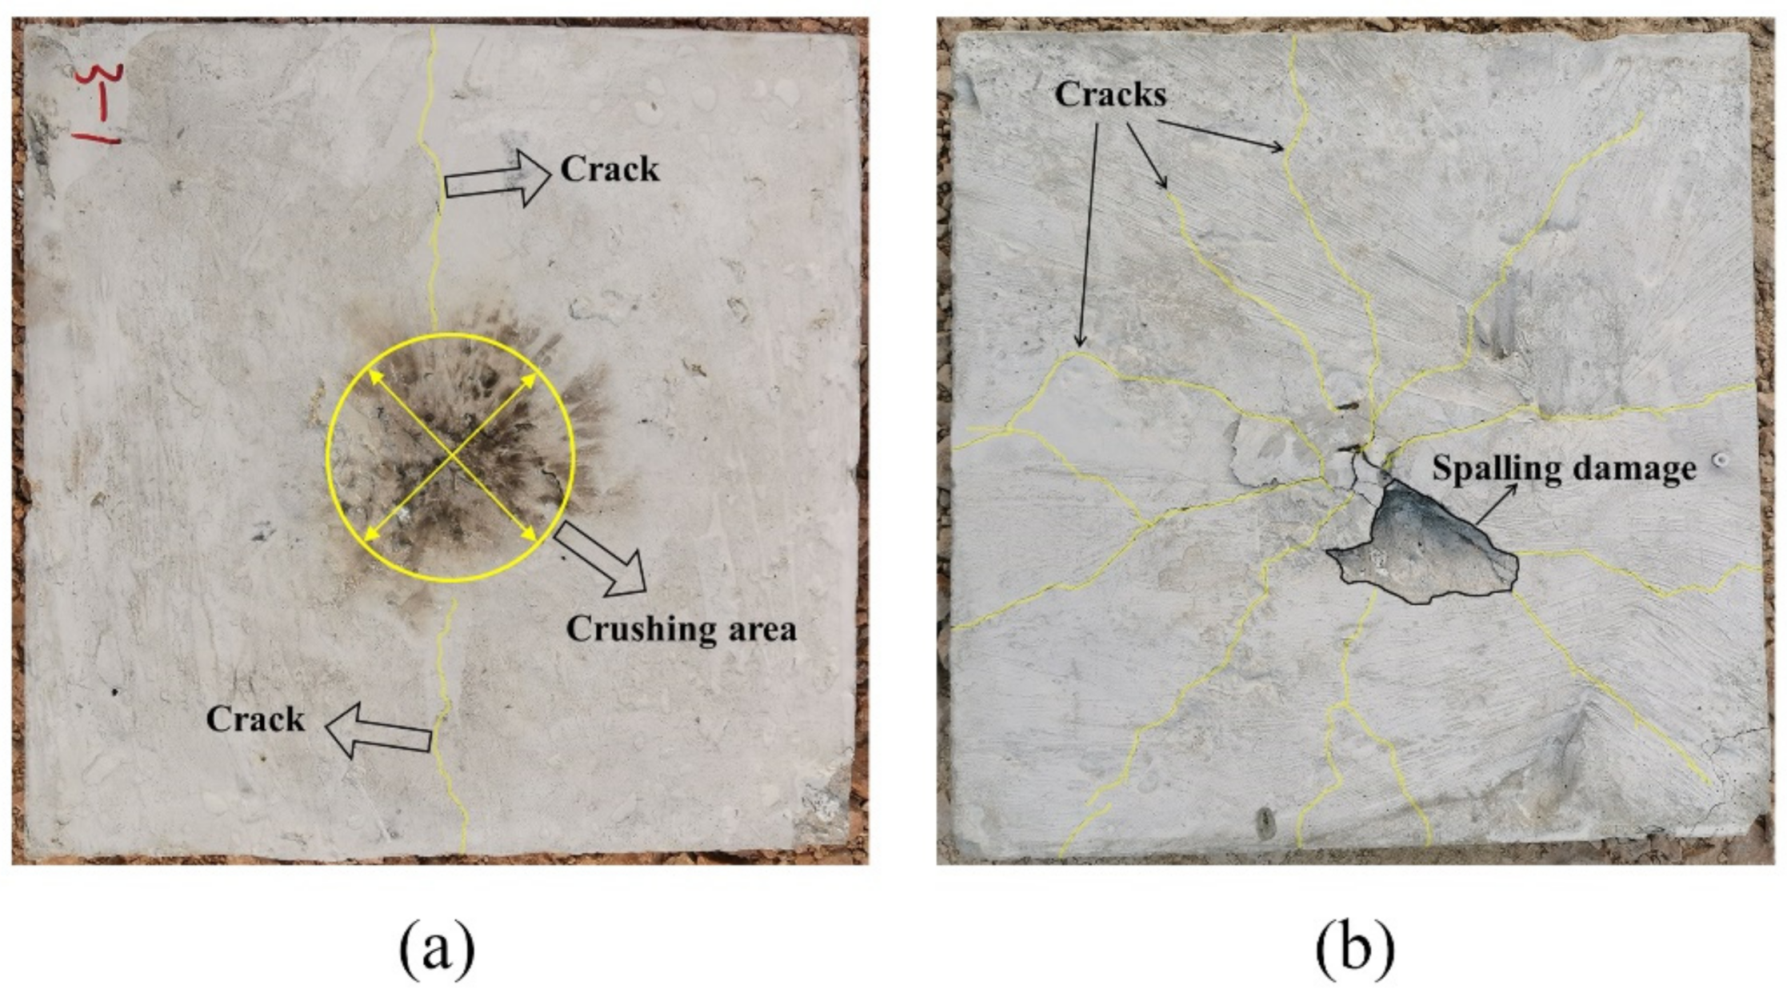
4.1. Model Validation and Comparison of Damage Features
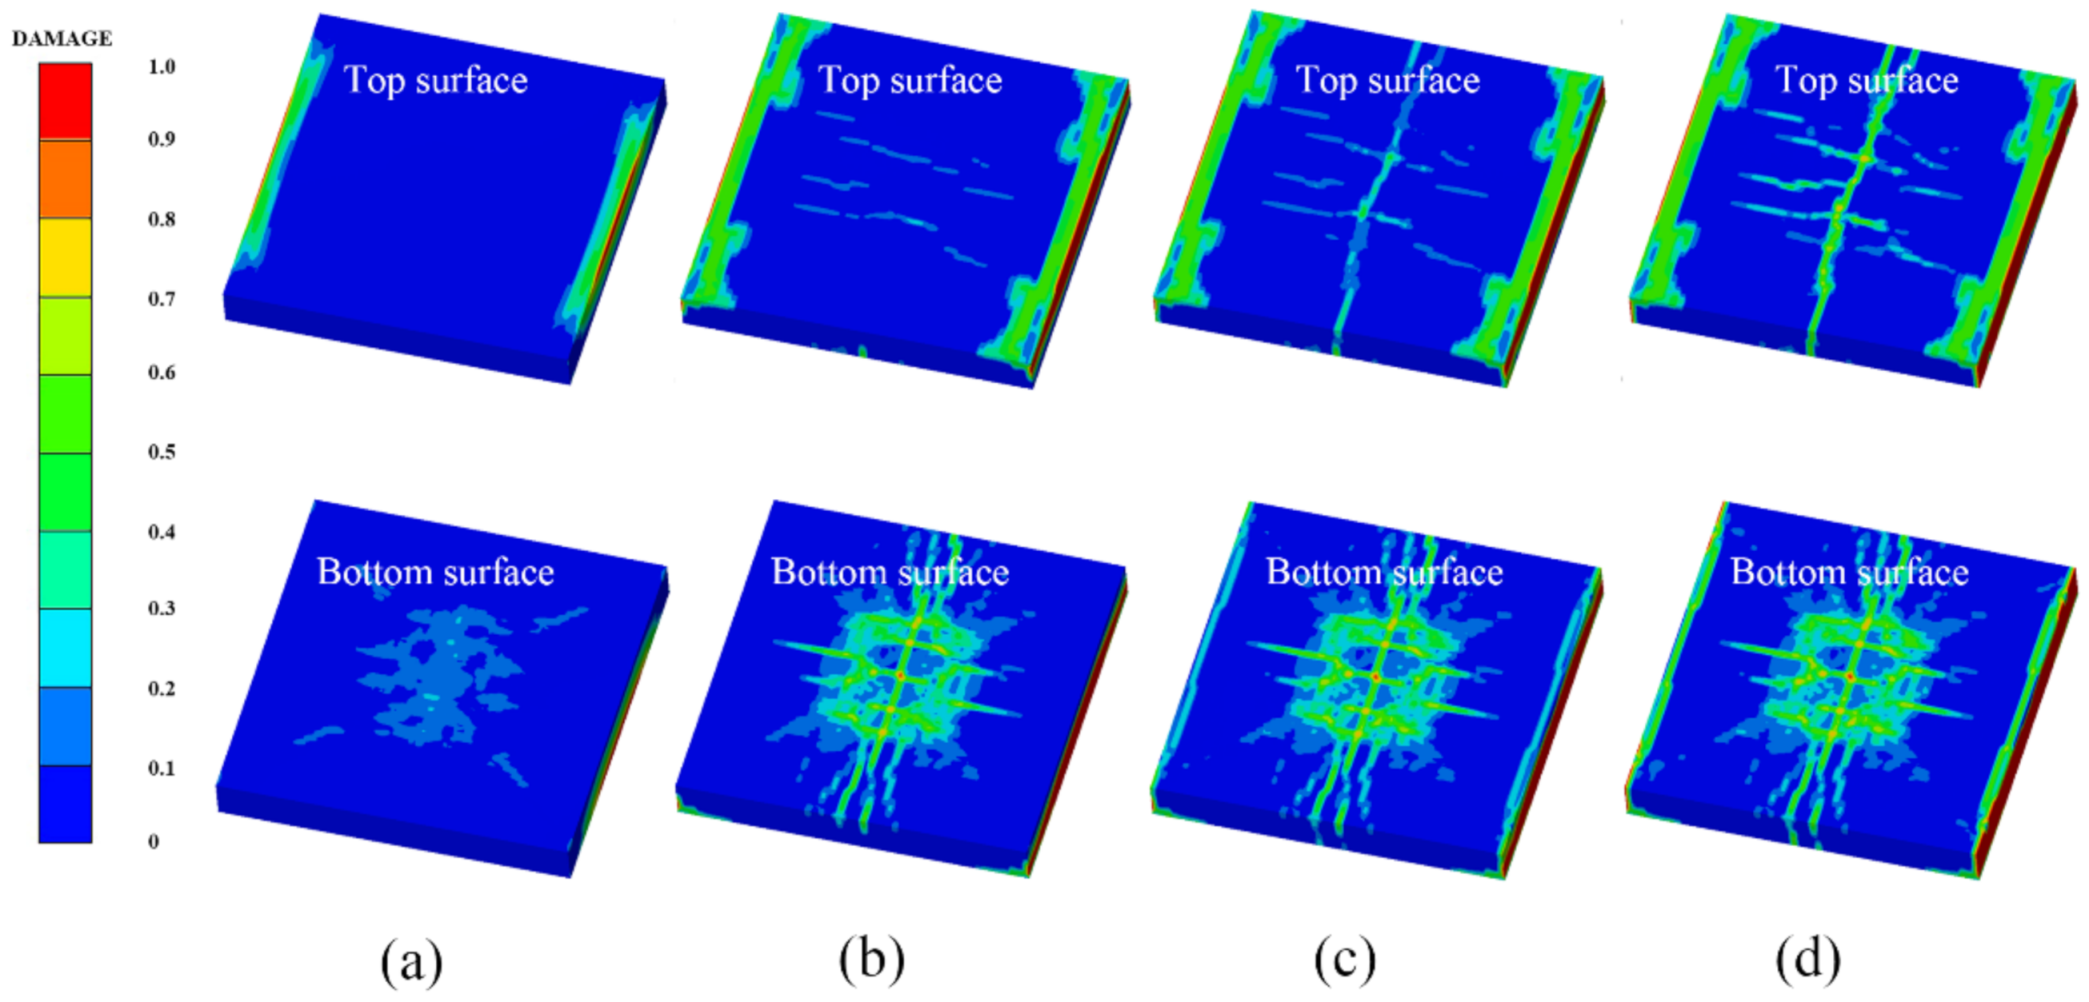
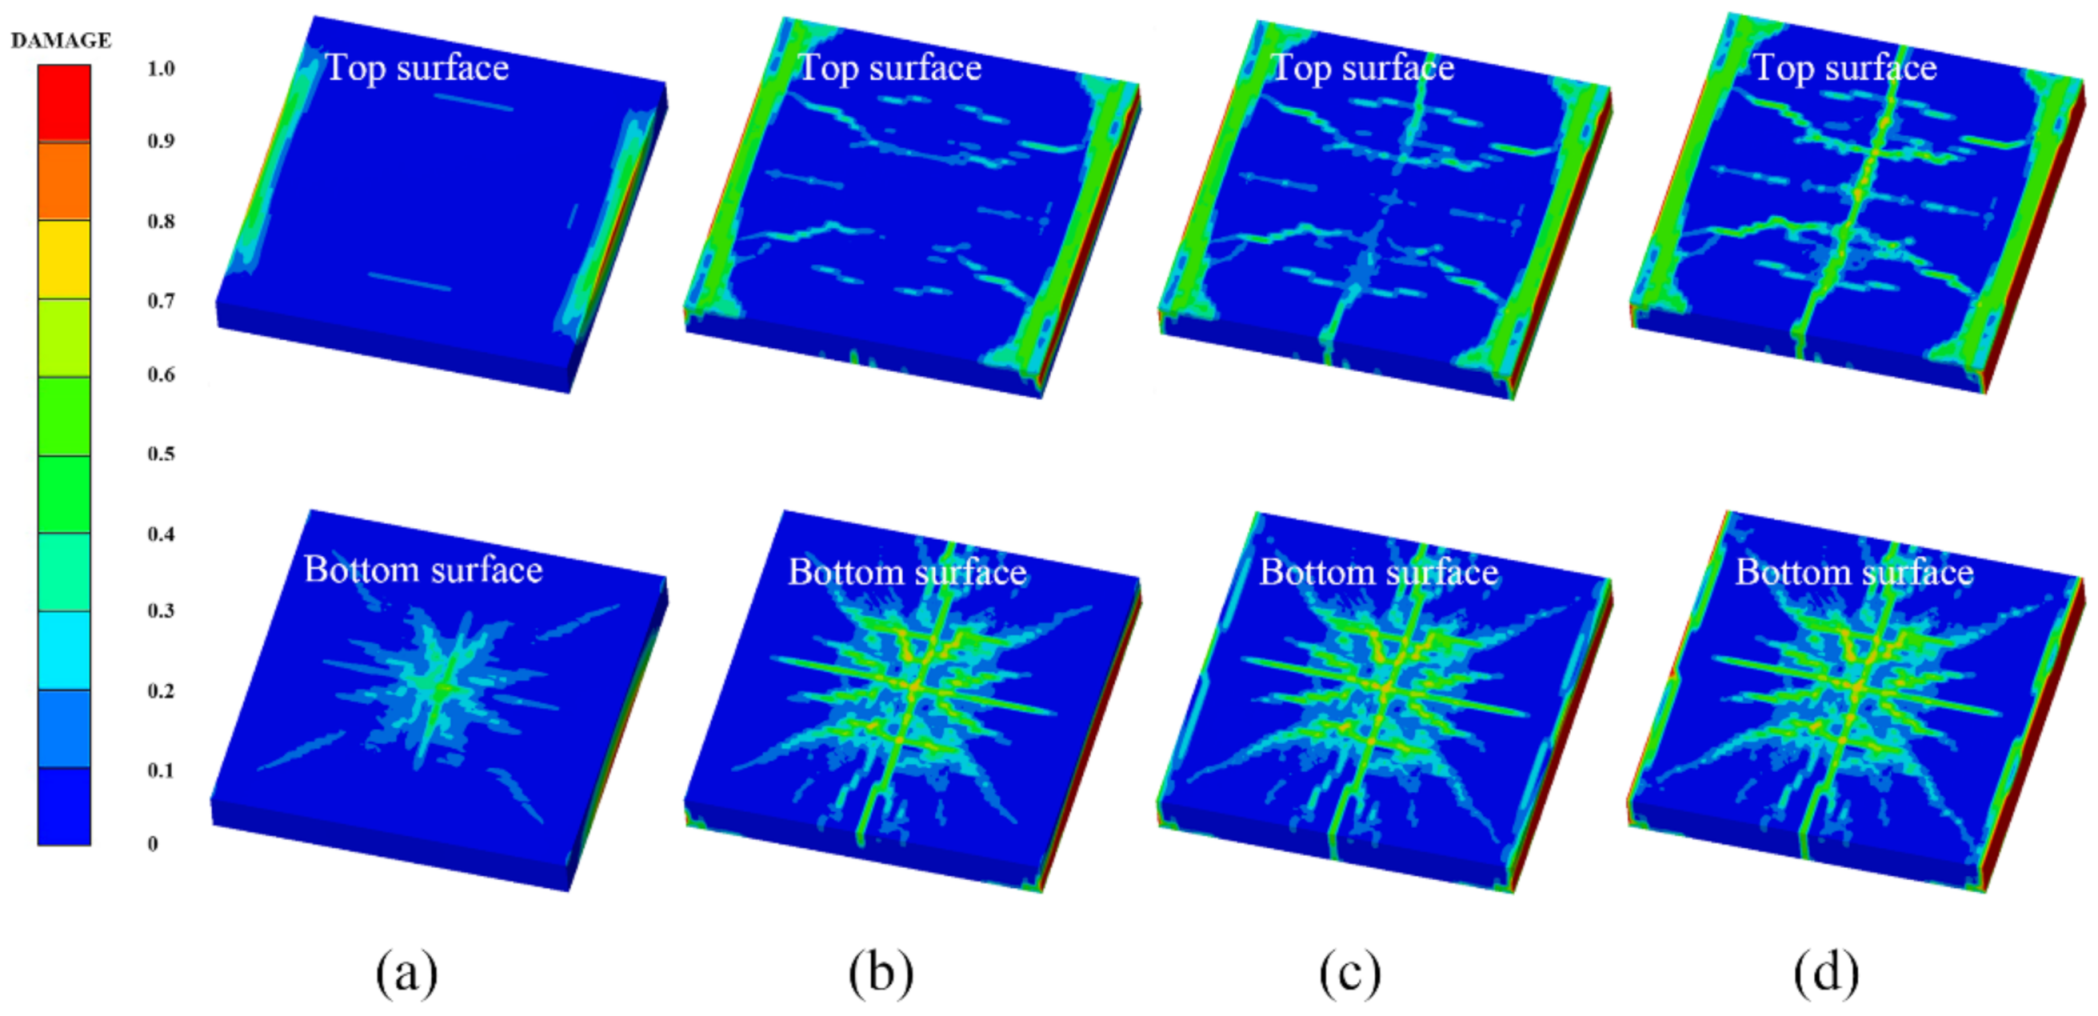
4.2. Simulation of the Damage Evolution Process of the RC Slab
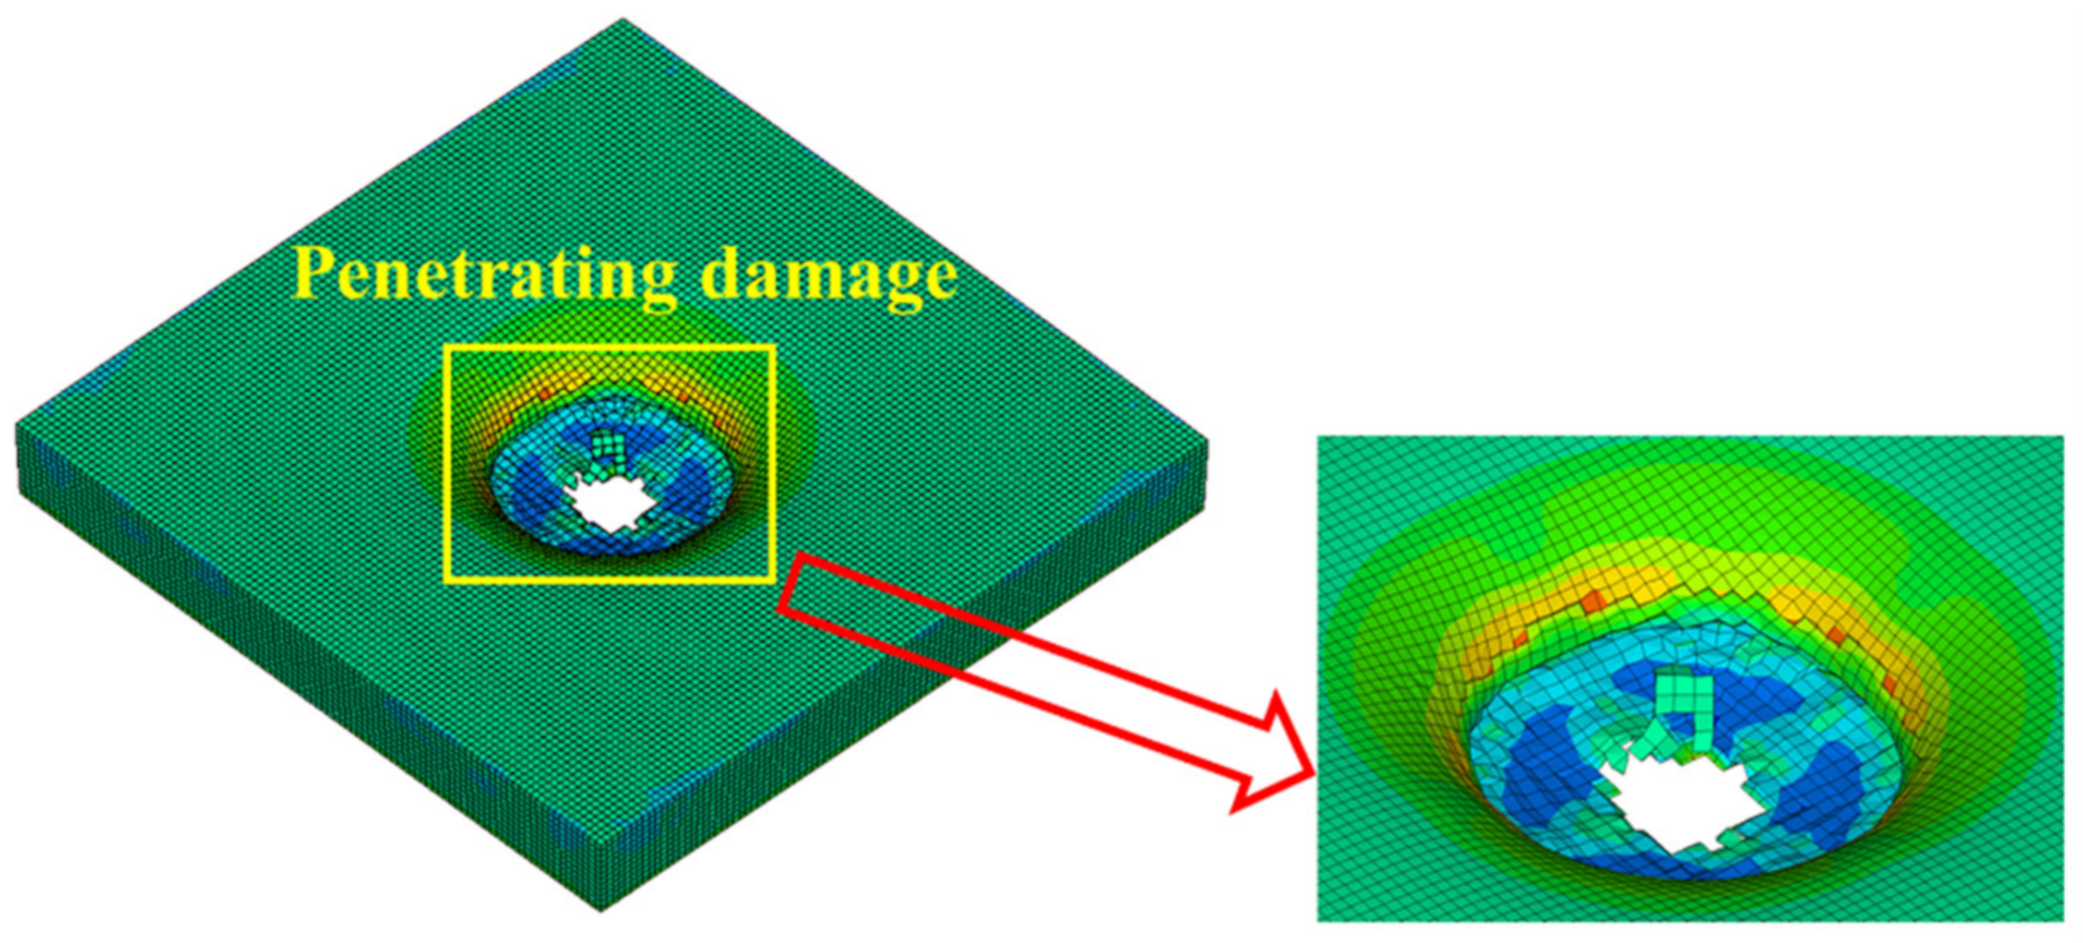
4.3. Simulation of the Failure State of the Sacrificial Cladding
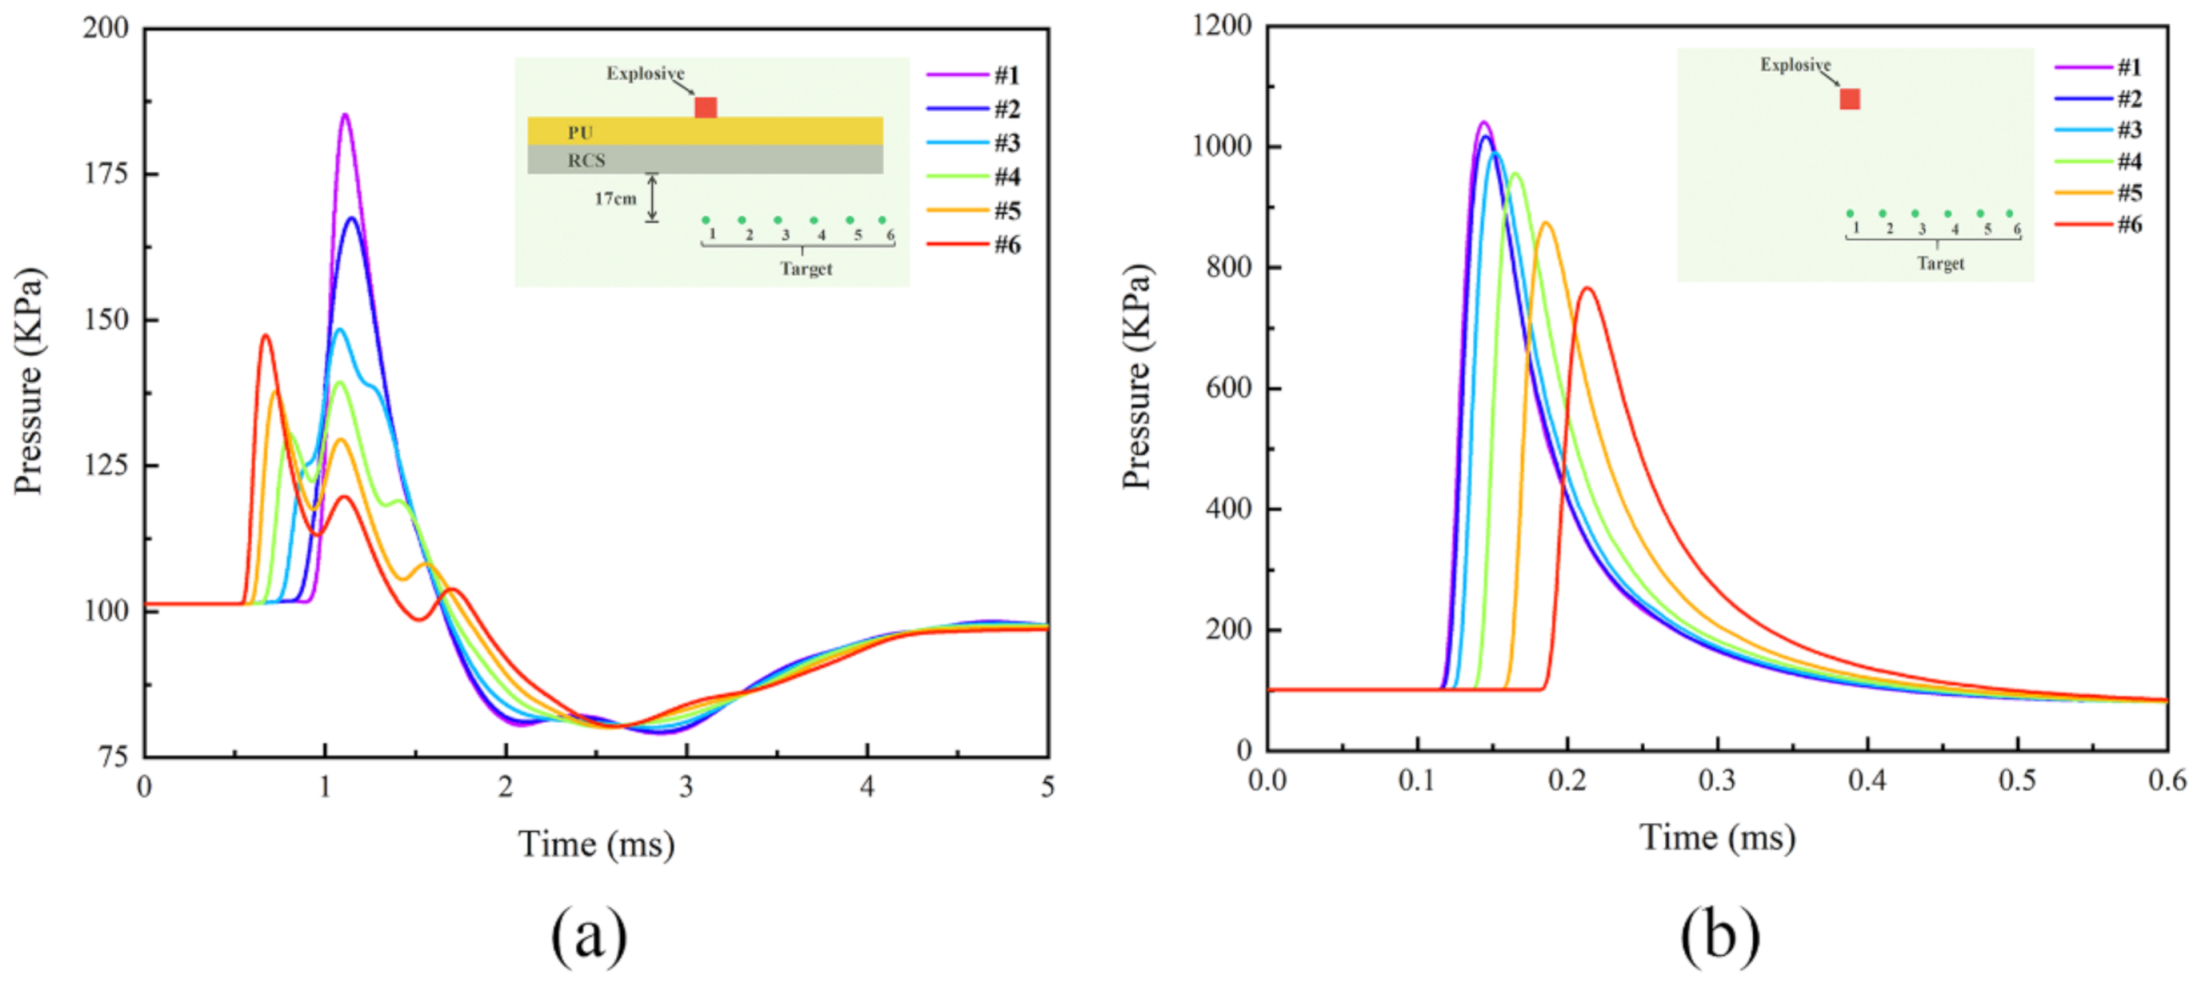
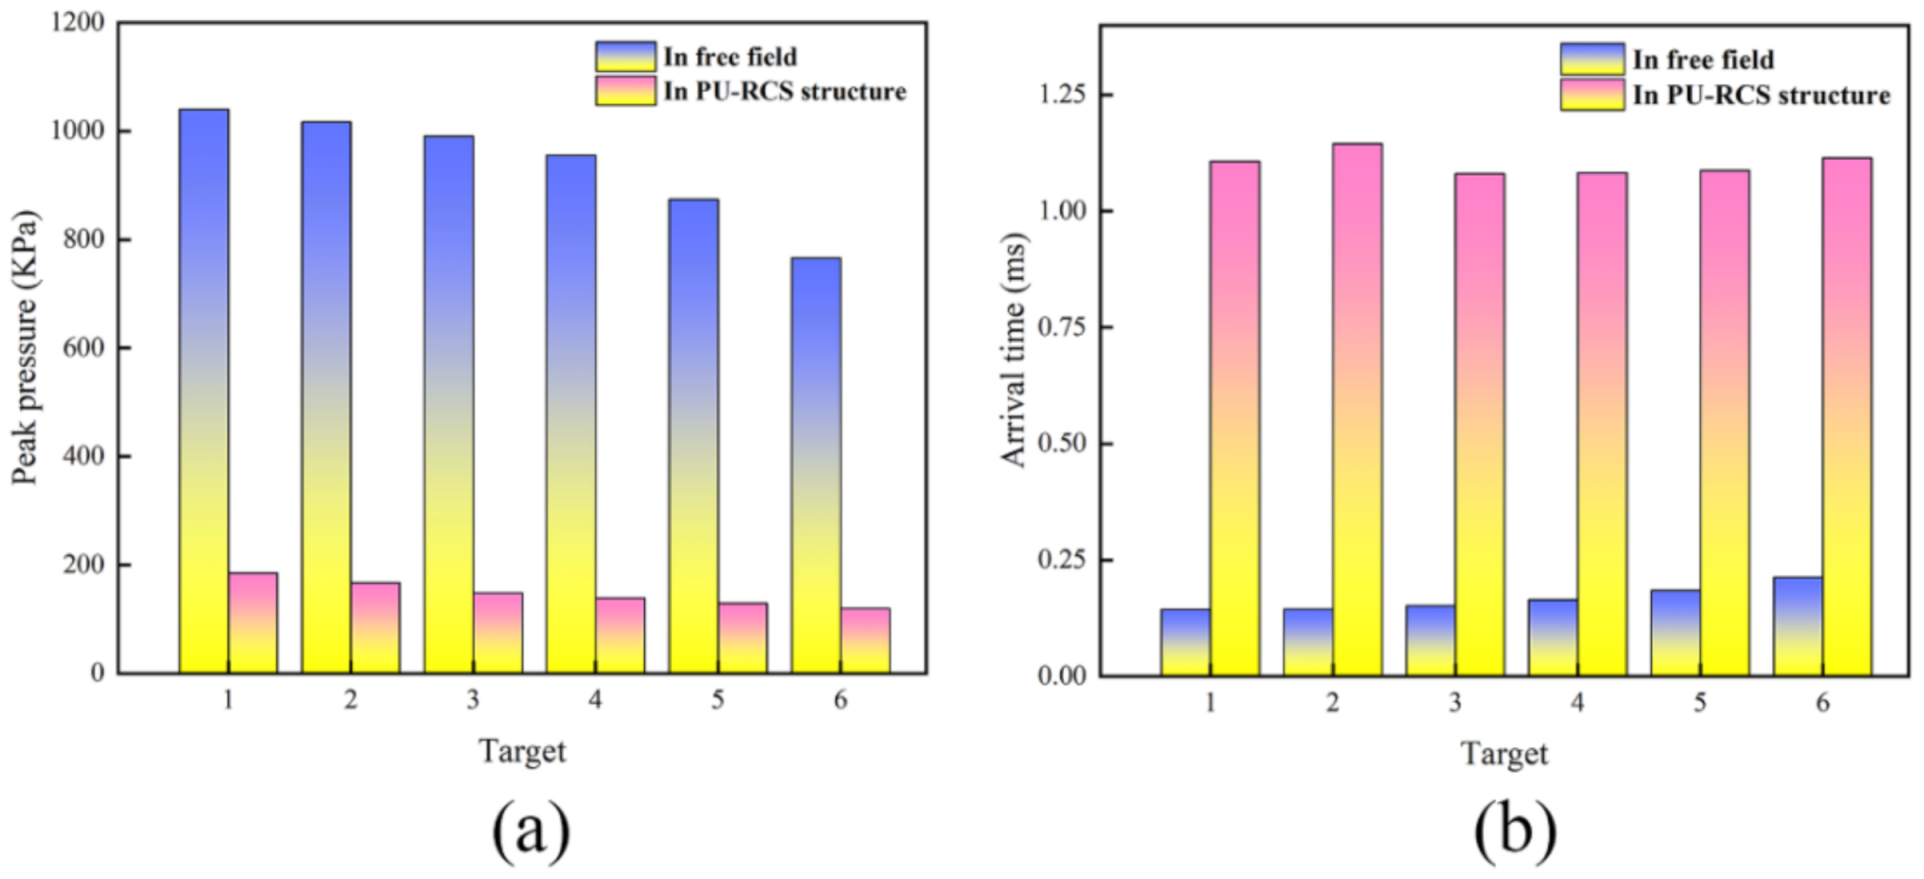
4.4. Simulation of Shock Waves
4.5. Computational Efficiency and Cost
5. Conclusions
- (1)
- The simulation results of the three coupled models established agree well with the test results, and they can all effectively simulate the damage features of PU–RCS under contact explosion, but the prediction results of the SPH–FEM coupling model are undoubtedly the most accurate, which can achieve a higher degree of accuracy in predicting the distribution range, completeness, and clarity of the cracks.
- (2)
- The three damage evolution processes show that the damage features of PU–RCS basically tend to be stable after t = 2.0 ms, and the damage degree is low, which means that the three models successfully simulated the blast mitigation effect of polyurethane sacrificial cladding. In addition, the SPH–FEM coupling model can accurately reproduce the large deformation failure state of polyurethane sacrificial cladding.
- (3)
- Compared to the SPH–FEM coupling model, both the CEL model and the ALE coupling model can reasonably simulate the influence of PU–RCS on shock wave propagation under contact explosion with a lower computational cost. The existence of PU–RCS severely reduces the peak pressure at the measuring points behind the slab, and the arrival time of the peak pressure is significantly delayed.
- (4)
- The computational cost of the SPH–FEM coupling model is relatively high among the three models. However, the focus of this study is to simulate the damage results of PU–RCS, and the simulation results of the SPH–FEM coupling model have the highest accuracy among the three models. Therefore, the SPH–FEM coupling method is undoubtedly the most suitable numerical method for this study.
Author Contributions
Funding
Institutional Review Board Statement
Informed Consent Statement
Data Availability Statement
Conflicts of Interest
References
- Shi, S.; Liao, Y.; Peng, X.; Liang, C.; Sun, J. Behavior of polyurea-woven glass fiber mesh composite reinforced RC slabs under contact explosion. Int. J. Impact. Eng. 2019, 132, 103335. [Google Scholar] [CrossRef]
- Abid, S.R.; Murali, G.; Amran, M.; Vatin, N.; Fediuk, R.; Karelina, M. Evaluation of mode II fracture toughness of hybrid fibrous geopolymer composites. Materials 2021, 14, 349. [Google Scholar] [CrossRef] [PubMed]
- Rebelo, H.B.; Cismasiu, C. Robustness assessment of a deterministically designed sacrificial cladding for structural protection. Eng. Struct. 2021, 240, 112279. [Google Scholar] [CrossRef]
- Wu, C.; Sheikh, H. A finite element modelling to investigate the mitigation of blast effects on reinforced concrete panel using foam cladding. Int. J. Impact. Eng. 2013, 55, 24–33. [Google Scholar] [CrossRef]
- Bohara, R.P.; Linforth, S.; Ghazlan, A.; Nguyen, T.; Remennikov, A.; Ngo, T. Performance of an auxetic honeycomb-core sandwich panel under close-in and far-field detonations of high explosive. Compos. Struct. 2022, 280, 114907. [Google Scholar] [CrossRef]
- Rebelo, H.B.; Lecompte, D.; Cismasiu, C.; Jonet, A.; Belkassem, B.; Maazoun, A. Experimental and numerical investigation on 3D printed PLA sacrificial honeycomb cladding. Int. J. Impact. Eng. 2019, 131, 162–173. [Google Scholar] [CrossRef]
- Zhao, H.; Yu, H.; Yuan, Y.; Zhu, H. Blast mitigation effect of the foamed cement-base sacrificial cladding for tunnel structures. Constr. Build. Mater. 2015, 94, 710–718. [Google Scholar] [CrossRef]
- Nejad, A.F.; Alipour, R.; Rad, M.S.; Yahya, M.Y.; Koloor, S.S.R.; Petrů, M. Using finite element approach for crashworthiness assessment of a polymeric auxetic structure subjected to the axial loading. Polymers 2020, 12, 1312. [Google Scholar] [CrossRef]
- Khan, M.S.; Abdul-Latif, A.; Koloor, S.; Petru, M.; Tamin, M.N. Representative cell analysis for damage-based failure model of polymer hexagonal honeycomb structure under the out-of-plane loadings. Polymers 2020, 13, 52. [Google Scholar] [CrossRef]
- Wei, Y.; Tang, S.; Chen, S.; Wang, Q.; Wang, J. Mechanical behavior of foam-filled bamboo composite tubes under axial compression. Polymers 2022, 14, 2006. [Google Scholar] [CrossRef]
- Pilipovic, A.; Ilincic, P.; Petrusa, J.; Domitran, Z. Influence of polymer composites and memory foam on energy absorption in vehicle application. Polymers 2020, 12, 1222. [Google Scholar] [CrossRef] [PubMed]
- Wang, Y.; Lu, J.; Zhai, X.; Xue, B.; Zhi, X. Response of energy absorbing connector with polyurethane foam and multiple pleated plates under impact loading. Int. J. Impact. Eng. 2019, 133, 103356. [Google Scholar] [CrossRef]
- Wang, Y.; Zhang, B.; Lu, J.; Xue, B.; Zhai, X. Quasi-static crushing behaviour of the energy absorbing connector with polyurethane foam and multiple pleated plates. Eng. Struct. 2020, 211, 110404. [Google Scholar] [CrossRef]
- Wang, Y.; Pokharel, R.; Lu, J.; Zhai, X. Experimental, numerical, and analytical studies on polyurethane foam-filled energy absorption connectors under quasi-static loading. Thin Wall Struct. 2019, 144, 106257. [Google Scholar] [CrossRef]
- Meng, L.; Wang, Y.; Zhai, X. Experimental and numerical studies on steel-polyurethane foam-steel–concrete-steel panel under impact loading by a hemispherical head. Eng. Struct. 2021, 247, 113201. [Google Scholar] [CrossRef]
- Jamil, A.; Guan, Z.W.; Cantwell, W.J.; Zhang, X.F.; Langdon, G.S.; Wang, Q.Y. Blast response of aluminium/thermoplastic polyurethane sandwich panels—Experimental work and numerical analysis. Int. J. Impact. Eng. 2019, 127, 31–40. [Google Scholar] [CrossRef]
- Ousji, H.; Belkassem, B.; Louar, M.A.; Reymen, B.; Martino, J.; Lecompte, D.; Pyl, L.; Vantomme, J. Air-blast response of sacrificial cladding using low density foams: Experimental and analytical approach. Int. J. Mech. Sci. 2017, 128–129, 459–474. [Google Scholar] [CrossRef]
- Li, M.; Du, M.; Wang, F.; Xue, B.; Zhang, C.; Fang, H. Study on the mechanical properties of polyurethane (PU) grouting material of different geometric sizes under uniaxial compression. Constr. Build. Mater. 2020, 259, 119797. [Google Scholar] [CrossRef]
- Zhao, X.; Wang, G.; Lu, W.; Yan, P.; Chen, M.; Zhou, C. Damage features of RC slabs subjected to air and underwater contact explosions. Ocean Eng. 2018, 147, 531–545. [Google Scholar] [CrossRef]
- Wang, G.; Lu, W.; Yang, G.; Yan, P.; Chen, M.; Zhao, X.; Li, Q. A state-of-the-art review on blast resistance and protection of high dams to blast loads. Int. J. Impact. Eng. 2020, 139, 103529. [Google Scholar] [CrossRef]
- Wang, G.; Zhang, S. Damage prediction of concrete gravity dams subjected to underwater explosion shock loading. Eng. Fail. Anal. 2014, 39, 72–91. [Google Scholar] [CrossRef]
- Zhang, S.; Wang, G.; Wang, C.; Pang, B.; Du, C. Numerical simulation of failure modes of concrete gravity dams subjected to underwater explosion. Eng. Fail. Anal. 2014, 36, 49–64. [Google Scholar] [CrossRef]
- Zhao, X.; Wang, G.; Lu, W.; Chen, M.; Yan, P.; Zhou, C. Effects of close proximity underwater explosion on the nonlinear dynamic response of concrete gravity dams with orifices. Eng. Fail. Anal. 2018, 92, 566–586. [Google Scholar] [CrossRef]
- Wang, W.; Zhang, D.; Lu, F.; Wang, S.; Tang, F. Experimental study and numerical simulation of the damage mode of a square reinforced concrete slab under close-in explosion. Eng. Fail. Anal. 2013, 27, 41–51. [Google Scholar] [CrossRef]
- Wu, J.; Zhou, Y.; Zhang, R.; Liu, C.; Zhang, Z. Numerical simulation of reinforced concrete slab subjected to blast loading and the structural damage assessment. Eng. Fail. Anal. 2020, 118, 104926. [Google Scholar] [CrossRef]
- Zhao, C.; Ye, X.; He, K.; Gautam, A. Numerical study and theoretical analysis on blast resistance of fabricated concrete slab. J. Build. Eng. 2020, 32, 101760. [Google Scholar] [CrossRef]
- Yang, G.; Wang, G.; Lu, W.; Wu, L.; Yan, P.; Chen, M. Experimental and numerical study of damage characteristics of RC slabs subjected to air and underwater contact explosions. Mar. Struct. 2019, 66, 242–257. [Google Scholar] [CrossRef]
- Zhao, C.; Lu, X.; Wang, Q.; Gautam, A.; Wang, J.; Mo, Y.L. Experimental and numerical investigation of steel-concrete (SC) slabs under contact blast loading. Eng. Struct. 2019, 196, 109337. [Google Scholar] [CrossRef]
- Zhao, C.; He, K.; Zhi, L.; Lu, X.; Pan, R.; Gautam, A.; Wang, A.; Li, X. Blast behavior of steel-concrete-steel sandwich panel: Experiment and numerical simulation. Eng. Struct. 2021, 246, 112998. [Google Scholar] [CrossRef]
- Chen, J.; Lien, F. Simulations for soil explosion and its effects on structures using SPH method. Int. J. Impact. Eng. 2018, 112, 41–51. [Google Scholar] [CrossRef]
- Chen, J.-Y.; Feng, D.-L.; Lien, F.-S.; Yee, E.; Deng, S.-X.; Gao, F.; Peng, C. Numerical modelling of interaction between aluminium structure and explosion in soil. Appl. Math. Model. 2021, 99, 760–784. [Google Scholar] [CrossRef]
- Yang, G.; Wang, G.; Lu, W.; Yan, P.; Chen, M.; Wu, X. A SPH-lagrangian-eulerian approach for the simulation of concrete gravity dams under combined effects of penetration and explosion. KSCE J. Civ. Eng. 2017, 22, 3085–3101. [Google Scholar] [CrossRef]
- Li, J.; Wu, C.; Hao, H.; Su, Y. Experimental and numerical study on steel wire mesh reinforced concrete slab under contact explosion. Mater. Des. 2017, 116, 77–91. [Google Scholar] [CrossRef]
- Li, Y.; Chen, Z.; Ren, X.; Tao, R.; Gao, R.; Fang, D. Experimental and numerical study on damage mode of RC slabs under combined blast and fragment loading. Int. J. Impact. Eng. 2020, 142, 103579. [Google Scholar] [CrossRef]
- Castedo, R.; Santos, A.; Alañón, A.; Reifarth, C.; Chiquito, M.; López, L.; Martínez-Almajano, S.; Pérez-Caldentey, A. Numerical study and experimental tests on full-scale RC slabs under close-in explosions. Eng. Struct. 2021, 231, 111774. [Google Scholar] [CrossRef]
- Karmakar, S.; Shaw, A. Response of R.C. plates under blast loading using FEM-SPH coupled method. Eng. Fail. Anal. 2021, 125, 105409. [Google Scholar] [CrossRef]
- Lin, J.H.; Hsu, P.Y.; Huang, C.H.; Lai, M.F.; Shiu, B.C.; Lou, C.W. Functional hollow ceramic microsphere/flexible polyurethane foam composites with a cell structure: Mechanical property and sound absorptivity. Polymers 2022, 14, 913. [Google Scholar] [CrossRef] [PubMed]
- Du, Y.; Zhang, F.; Zhang, A.; Ma, L.; Zheng, J. Consequences assessment of explosions in pipes using coupled FEM-SPH method. J. Loss Prev. Process Ind. 2016, 43, 549–558. [Google Scholar] [CrossRef]
- Farokhi, N.A.; Rahimian, K.S.; Syed, H.S.; Yahya, M.Y. Mechanical behaviour of pin-reinforced foam core sandwich panels subjected to low impact loading. Polymers 2021, 13, 3627. [Google Scholar] [CrossRef]
- Yang, G.; Wang, G.; Lu, W.; Yan, P.; Chen, M. Damage assessment and mitigation measures of underwater tunnel subjected to blast loads. Tunn. Undergr. Space Technol. 2019, 94, 103131. [Google Scholar] [CrossRef]


| Model | Concrete | Polyurethane | Explosive | Air | Rebar |
|---|---|---|---|---|---|
| CEL | Lagrange | Lagrange | Euler | Euler | Beam |
| ALE | Lagrange | ALE | Euler | Euler | Beam |
| SPH–FEM | Lagrange | SPH | SPH | / | Beam |
| Parameter | Value | Parameter | Value |
|---|---|---|---|
| Reference density | Tens./Comp. meridian ratio(Q) | 0.6805 | |
| Porous density | Brittle to ductile transition | 0.0105 | |
| Porous sound speed | G (elastic)/(elastic–plastic) | 2.000 | |
| Initial compaction pressure | Elastic strength/ft | 0.700 | |
| Solid compaction pressure | Elastic strength/fc | 0.530 | |
| Compaction pressure | 3.000 | Fractured strength constant B | 1.600 |
| Bulk modulus A1 | Fractured strength exponent M | 0.610 | |
| Parameter A2 | Compressive strain rate | 0.032 | |
| Parameter A3 | Max. fracture strength ratio | ||
| Parameter B0 | 1.220 | Tensile strain rate | 0.036 |
| Parameter B1 | 1.220 | Erosion strain | Geometric strain |
| Parameter T1 | Erosion strain | 2.000 | |
| Parameter T2 | Type of geometric strain | Instantaneous | |
| Shear modulus | Damage constant D1 | 0.040 | |
| Compressive strength (fc) | Damage constant D2 | 1.000 | |
| Tensile strength (ft/fc) | 0.060 | Minimum strain to failure | 0.010 |
| Shear strength (fs/fc) | 0.180 | Residual shear modulus fraction | 0.130 |
| Intact failure surface constant A | 1.600 | Tensile failure | Hydro |
| Intact failure surface exponent N | 0.610 |
Publisher’s Note: MDPI stays neutral with regard to jurisdictional claims in published maps and institutional affiliations. |
© 2022 by the authors. Licensee MDPI, Basel, Switzerland. This article is an open access article distributed under the terms and conditions of the Creative Commons Attribution (CC BY) license (https://creativecommons.org/licenses/by/4.0/).
Share and Cite
Liu, Z.; Zhao, X.; Liu, D.; Wang, G.; Shi, M. Comparative Study on Blast Damage Features of Reinforced Concrete Slabs with Polyurethane Sacrificial Cladding Based on Different Numerical Simulation Methods. Polymers 2022, 14, 3857. https://doi.org/10.3390/polym14183857
Liu Z, Zhao X, Liu D, Wang G, Shi M. Comparative Study on Blast Damage Features of Reinforced Concrete Slabs with Polyurethane Sacrificial Cladding Based on Different Numerical Simulation Methods. Polymers. 2022; 14(18):3857. https://doi.org/10.3390/polym14183857
Chicago/Turabian StyleLiu, Zhidong, Xiaohua Zhao, Da Liu, Gaohui Wang, and Mingsheng Shi. 2022. "Comparative Study on Blast Damage Features of Reinforced Concrete Slabs with Polyurethane Sacrificial Cladding Based on Different Numerical Simulation Methods" Polymers 14, no. 18: 3857. https://doi.org/10.3390/polym14183857
APA StyleLiu, Z., Zhao, X., Liu, D., Wang, G., & Shi, M. (2022). Comparative Study on Blast Damage Features of Reinforced Concrete Slabs with Polyurethane Sacrificial Cladding Based on Different Numerical Simulation Methods. Polymers, 14(18), 3857. https://doi.org/10.3390/polym14183857