Article

Development of a Curcumin-Loaded Lecithin/Chitosan Nanoparticle Utilizing a Box-Behnken Design of Experiment: Formulation Design and Influence of Process Parameters

1
Department of Clinical Pharmacy, College of Pharmacy, Najran University, Najran 11001, Saudi Arabia
2
Department of Pharmaceutics, College of Pharmacy, Najran University, Najran 11001, Saudi Arabia
3
Department of Pharmaceutics, College of Pharmacy, Prince Sattam Bin Abdulaziz University, Al-Kkharj 11942, Saudi Arabia
4
National Center of Biotechnology, Life Science and Environment Research Institute, King Abdulaziz City for Science and Technology (KACST), Riyadh 11442, Saudi Arabia
*
Author to whom correspondence should be addressed.
Polymers 2022, 14(18), 3758; https://doi.org/10.3390/polym14183758
Submission received: 4 August 2022 / Revised: 27 August 2022 / Accepted: 6 September 2022 / Published: 8 September 2022
(This article belongs to the Special Issue Polymers for Biomedical Imaging and Therapy)

Abstract

:
Curcumin (CUR) has impressive pharmacologic properties, including cardioprotective, neuroprotective, antimicrobial, and anticancer activity. However, the pharmaceutical application of CUR is limited due to its poor aqueous solubility and low bioavailability. The development of novel formulations has attracted considerable attention to the idea of applying nanobiotechnology to improve the therapeutic efficacy of these challenging compounds. In this study, CUR-loaded lecithin–chitosan nanoparticles (CUR/LCSNPs) were developed and optimized by the concentration of chitosan, lecithin, and stirring speed by a 3-factorial Box-Behnken statistical design, resulting in an optimal concentration of chitosan (A) and lecithin (B) with a 1200 rpm stirring speed (C), with applied constraints of minimal average particle size (Y1), optimal zeta potential (Y2), and maximum entrapment efficiency (%EE) (Y3). The mean particle size of the checkpoint formulation ranged from 136.44 ± 1.74 nm to 267.94 ± 3.72, with a zeta potential of 18.5 ± 1.39 mV to 36.8 ± 3.24 mV and %EE of 69.84 ± 1.51% to 78.50 ± 2.11%. The mean particle size, zeta potential, %EE, and % cumulative drug release from the optimized formulation were 138.43 ± 2.09 nm, +18.98 ± 0.72 mV, 77.39 ± 1.70%, and 86.18 ± 1.5%, respectively. In vitro drug release followed the Korsmeyer–Peppas model with Fickian diffusion (n < 0.45). The optimized technique has proven successful, resulting in a nanoformulation that can be used for the high loading and controlled release of lipophilic drugs.

1. Introduction

Curcumin (CUR) has been used for centuries as a conventional remedy both in ancient Indian and Chinese medicine [1]. It is derived from the rhizome of the perennial herb Curcuma longa (Zingiberaceae family) and is widely called turmeric [2]. CUR has shown remarkable pharmacologic efficacy as cardioprotective, neuroprotective, anti-microbial, and anticancer [1,2,3]. Furthermore, various clinical and preclinical studies demonstrated that CUR is considerably non-toxic at higher doses [4,5]. The fact that CUR exhibits such a wide range of safety and pharmacological efficacy increase its utility as a therapeutic agent for the prevention and treatment of a wide range of disease [6,7]. Despite CUR’s potential therapeutic efficacy, the limited bioavailability and the high variability in pharmacokinetics behavior limit its clinical application [6,7]. The bioavailability of CUR is limited by its poor aqueous solubility, inadequate tissue absorption, rapid systemic elimination, fast metabolism, and degradation at basic pH [1,2,6]. Furthermore, the lipophilic nature of CUR makes it prone to reticuloendothelial system uptake and decreases the therapeutic concentration at the desired site [8].
Various nanosystems have been utilized to increase the aqueous solubility and bioavailability of CUR by encapsulating it in a liposome, polymeric nanoparticle, lipid-based nanoparticle, biodegradable microsphere, nanoemulsion, nanoemulgel, etc. [9,10,11,12,13]. Nanoparticle (NP)-based drug delivery strategies have the potential to enhance the drug delivery of lipophilic therapeutics such as CUR through colloidal dispersion in an aqueous media, thereby avoiding the drawbacks associated with low aqueous solubility, and offer enhancement in the efficacy of loaded therapeutics [8,14]. Developing biodegradable novel drug delivery systems (NDDS) to increase the bioavailability of therapeutic agents have been the primary focus of research over the last few decades [8,15]. To meet the aforementioned requirements, drug delivery systems involving polymeric nanoparticles are emerging as promising alternatives. A controlled delivery system based on chitosan (CS) nanoparticles has been demonstrated to be effective for delivering various pharmacologically active compounds, including anticancer agents, analgesics, and peptides [16,17,18,19,20]. In the presence of various functional groups (like amino and hydroxyl groups), CS can form NPs by cross-linking with polymers with a polyanionic nature [15]. Recent studies have reported that negatively charged lecithin improves the drug delivery of poorly soluble compounds by interacting with positively charged CS. [21,22,23]. Alkholief developed CS and lecithin (L)-based NPs (LCSNP) for the simultaneous encapsulation and delivery of doxorubicin and piperine against doxorubicin-resistant cancer cells [21]. Furthermore, Lopes Rocha et al. developed LCS-based NPs encapsulated with melatonin (ML) for wound healing in diabetic rats [22]. Similarly, Murthy et al. demonstrated the formulation design of LCSNPs utilized to enhance the oral bioavailability of raloxifene hydrochloride [23]. In another study, Panda et al. reported the encapsulation of berberine inside LCSNP and evaluated wound-healing activity for improved therapeutic efficacy in a diabetic animal model [24]. A thymoquinone (TMQ)-loaded CS–lecithin delivery system for effective wound healing was reported by Negi et al. [25]. A TMQ-loaded lecithin–CS delivery system demonstrated the significantly enhanced wound-healing efficacy in comparison to the control [25]. TMQ-loaded LCSNPs induce earlier collagen deposition and wound contraction in comparison to TMQ alone [25]. In another study, Perez-Ruiz et al. demonstrated the significantly anticancer activity of (−)-epicatechin (EC)-loaded LCSNPs against different cancer cell lines (such as MDA-MB-231, MCF-7, SK-Br3, and MDA-MB-436) [26]. Ilk et al. investigated the formulation and evaluation of kaempferol-loaded lecithin–CS NPs for antifungal activity [27]. The developed formulation exhibited a significant inhibition efficacy (67%) against Fusarium oxysporum. All of the previous investigations discussed above provide proof-of-concept for the LCSNPs as promising nanocarriers to improve the biopharmaceutical performance of poorly soluble therapeutics.
In this study, we aimed to develop a CUR-loaded lecithin–CS-based self-assembled NPs drug delivery system. CUR-loaded LCSNPs (CUR/LCSNPs) were optimized through a quality-by-design (QbD) approach to understanding the impact of formulation-related factors and their interaction with the desirable attributes of the developed formulation system through a desired set of experiments. A Box-Behnken experimental design was employed in the current investigation as a statistical tool to optimize the concentration of formulation variables/process parameters and to investigate the combined influence of independent variables (concentration of nanoparticles components [chitosan, and lecithin], as well as the stirring speed used in its preparation) on dependent responses (particle size, surface charge, and entrapment efficiency). It helps to optimize the CUR-containing nanoparticulate system of specific dimensions as per the suitability requirement in a particular disease and/or its drug delivery prospects through a particular route of drug administration, which ultimately leads to the enhancement of the therapeutic efficacy of CUR at the target site.

2. Materials and Methods

2.1. Materials

Curcumin (CUR), low molecular chitosan (CS) (with viscosity average molecular weight of 50,000–190,000 Da, 75–85% deacetylated), isopropyl myristate (IPM), L-α-lecithin (L), and 95% v/v ethanol (ETOH) were obtained from Sigma Aldrich, (Taufkirchen, Germany). A 0.45 µm membrane filter was purchased from MF-Millipore®, Merck KGaA, (Darmstadt, Germany). Purified water was obtained from Milli-Q® Type 1 Ultrapure Water Systems (Burlington, MA, USA).

2.2. Preparation of Curcumin Loaded Lecithin-Chitosan Nanoparticles

CUR/LCSNPs were prepared according to a method described by Sonvico et al. (2006) with some modifications [28]. Briefly, 10 mL of lecithin solutions of different concentrations (2.5%, 3.75%, and 5% w/v) were prepared by dissolving an appropriate quantity (250, 375, and 500 mg) of lecithin in 95% ETOH (containing 0.25 mL of IPM). Then, each solution of L was treated with 10 mg of CUR to yield a 0.1% w/v CUR solution. Similarly, an aqueous solution of CS (1% w/v) was prepared by dissolving 1 g of CS in 100 mL of an acetic acid solution (1%) with stirring overnight [23,24]. The chitosan solution was filtered [23]. An appropriate volume (0.5 mL, 1.25 mL, 2 mL) of CS (1% w/v) was further diluted with a (1% v/v) acetic acid solution to obtain a final volume of 23 mL [23,24]. Then, 2 mL of L-ethanolic CUR solution was injected using a 20-gauge needle into the 23 mL of diluted CS solution in 1% acetic acid under magnetic stirring for 60 min to formulate CUR/LCSNPs [21,28]. The CUR/LCSNPs suspension was then filtered under a vacuum. The filtrate was collected and centrifuged at 20,000 rpm for 30 min at 4 °C. The sediment was re-suspended with an appropriate volume of purified water.

2.3. Optimization of CUR/LCSNPs

In this optimization process, a 3-factorial Box-Behnken statistical design was applied to optimize CUR/LCSNPs through Design Expert® software (version 13.0.5.0. Stat-Ease., Minneapolis, MN, USA). In this study, 3 factors and 3 levels of each variable (−1, 0, and +1) were applied to investigate the impact of independent variables (amount/concentration of chitosan, lecithin, and stirring speed during the preparation of CUR/LCSNPs) on dependent variables (particle size, zeta potential, and entrapment efficiency of CUR/LCSNPs) (Table 1).
The amount of chitosan (A), lecithin (B), and the stirring speed (C) during the preparation were selected as independent variables, considering their overall impact, and the particle size (Y1), zeta potential (Y2), and entrapment efficiency (Y3) were selected as dependent variables. Seventeen formulations of different combinations, including five center points, were prepared according to the Box-Behnken design suggestions and are shown in Table 2. The observed response in the form of particle size, zeta potential, and %EE of all seventeen formulations of CUR/LCSNPs was recorded. All experiments were performed in triplicate, the results of which are presented as ±SD.

2.3.1. Particle Size and Zeta Potential Measurements

The particle size and polydispersity index (PDI) of CUR/LCSNPs were measured using dynamic light scattering (DLS) techniques with the Nano ZS90 zeta sizer (Malvern Instruments, Malvern, UK). Purified water was used to dilute the samples (50 times) for analysis (Milli-Q® Type 1 Ultrapure Water Systems) [29,30]. For the determination of zeta potential, the sample was transferred into disposable folded capillary cells (DTS1070), and the zeta potential was determined using the same instruments [31].

2.3.2. Determination of Encapsulation Efficiency

The encapsulation efficiency (%EE) was calculated using the following Equation (1), as previously reported in [21,22,24,27]. Briefly, the obtained supernatant from the prepared samples (as described in Section 2.2) was diluted and analyzed for free CUR concentration through a UV-visible spectrophotometer at λmax 425 nm [30].
% E E = I n i t i a l   a m o u n t   o f   C U R   µ g F r e e   C U R   i n   s u p e r n a t a n t i n i t i a l   a m o u n t   o f   C U R   µ g × 100    
ANOVA was used to statistically validate the polynomial equations created using the Box-Behnken design. Statistically, the significance of coefficient and r2 values for all the responses were evaluated by fitting them to linear, second-order (2FI), and quadratic models [32]. Different approaches were explored to determine the components of optimized NPs. The optimized CUR/LCSNPs were selected and characterized for the selected response. Prediction error (%) was calculated by comparing the actual response data and the predicted data [32].

2.3.3. Scanning Electron Microscopy (SEM)

SEM characterization was performed using a JEOL SEM (JSM-IT500HR), ASIA PTE. Ltd., (Singapore city, Singapore). In preparation for imaging, samples were centrifuged at 15,000 rpm for 2 h, and then a drop of each sample’s supernatant was deposited on a SEM stub and left to dry before platinum coating (2 nm thickness) using the Auto Fine Coater (JEC-3000FC), JEOL, ASIA PTE. Ltd., Singapore.

2.3.4. X-ray Diffraction (XRD) Analysis

A Rigaku miniflex 300/600 (Tokyo, Japan), equipped with a 40 kV radiation source and a 15 mA current source, was used to investigate the different physical forms of curcumin, lecithin, chitosan, LCSNPs, and CUR/LCSNPs. The data recording was taken between 2θ ranging from 0° to 60° at a scan speed of 10°/min.

2.4. In Vitro Drug Release and Kinetics

The in vitro release profile of CUR from the optimized CUR/LCSNPs and an aqueous suspension of CUR were studied by the dialysis bag method [30,31]. A total of 2.0 mL of each CUR/LCSNP and an aqueous suspension of CUR were placed in the dialysis tube of molecular weight cutoff 12–14 kD (Spectra® dialysis tubing, New Brunswick, NJ USA). Both ends of the dialysis tube were tightly sealed and then placed in the 1000 mL capacity beaker containing 500 mL of release media (phosphate buffer pH 7.4 with 5% ethyl alcohol as co-solubilizer) [30]. The whole system was maintained at 37 °C under constant stirring (100 rpm) with magnetic beads. Aliquots of 5 mL samples were withdrawn at the predetermined time points of 0, 0.5, 1, 2, 4, 6, 8, 10, 12, and 24 h and was replaced with fresh media. Withdrawn samples were suitably diluted, and the concentration of CUR in each sample was determined by UV–visible spectroscopy at λmax 425 nm [30]. The obtained release data of CUR from the optimized formulation systems were fitted to several kinetic models, including the zero-order, first-order, Higuchi, Korsmeyer–Peppas, and Hixon–Crowell models. The best fit model was identified based on the R2 value (approaching 1) [30].

2.5. Physical Stability Study

The physical stability of the optimized CUR/LCSNPs suspension was determined by the previously described method with a slight modification [22]. Briefly, a volume of 2 mL of CUR/LCSNPs was placed into screw-capped glass vials and stored at 30 ± 1 °C, away from direct sunlight, and the particle size, zeta potential, PDI, and %drug content during the storage conditions were monitored for 0, 7, 15, and 45 days.

3. Results and Discussion

3.1. Optimization of CUR/LCSNPs Utilizing a Box-Behnken Statistical Design

A 3-factor 3-level Box-Behnken design was used in this study to investigate the correlations between the dependent and independent factors of CUR/LCSNPs. The composition characteristics for the independent variables are shown in Table 2.
The polynomial equation generated for this investigation is represented as follows
Y = α0 + α1A + α2B + α3C + α12AB + α13 AC + α23BC + α11A2 + α22B2 + α33C2
where Y = dependent variables; α0 is the intercept; α1, α2, and α3 represent the regression coefficient. A, B, and C are independent variables. Terms (AB, AC, and BC) and (A2, B2, and C2) represent the interaction and quadratic effect, respectively [32,33]. The quadratic model was the best-fitted model for all three dependent responses, as shown in Table 3.

3.1.1. Fitting of the Data on the Model Suggested by a Box-Behnken Statistical Design

The regression equation in terms of the coded factor was used to predict the effect of the interaction of independent factors (amount/concentration of chitosan, lecithin, and stirring speed during the preparation of CUR/LCSNPs) on responses. As indicated in Table 4, according to the ANOVA for the quadratic model, the model F-value of 26.81 for response (Y1) implies the model is significant. The probability of a larger F-value occurring due to noise is only 0.01. For the response (Y2), the F-value of 73.82 indicates that the model is significant. The probability of a larger F-value occurring due to noise is only 0.01.
Similarly, for the drug %EE, (Y3), the model F-value of 20.64 implies the model is significant. The probability of a larger F-value occurring due to noise is only 0.03. The p-value less than 0.05 indicates that the model factors are significant. The significant model factors were A, C, AB, BC, and C2 for (Y1); A, B, BC and A2 for (Y2); and A, C, AB, B2, and C2 for (Y3). The lack of fit F values such as 1.468 for (Y1), 0.7163 for (Y2), and 3.37 for (Y3) indicates that the results were not significant in comparison to the pure error. Furthermore, there is a 72.17% for (Y1), 59.18% for (Y2), and 13.58% (Y3) chance that noise could cause a lack of a larger F-value.

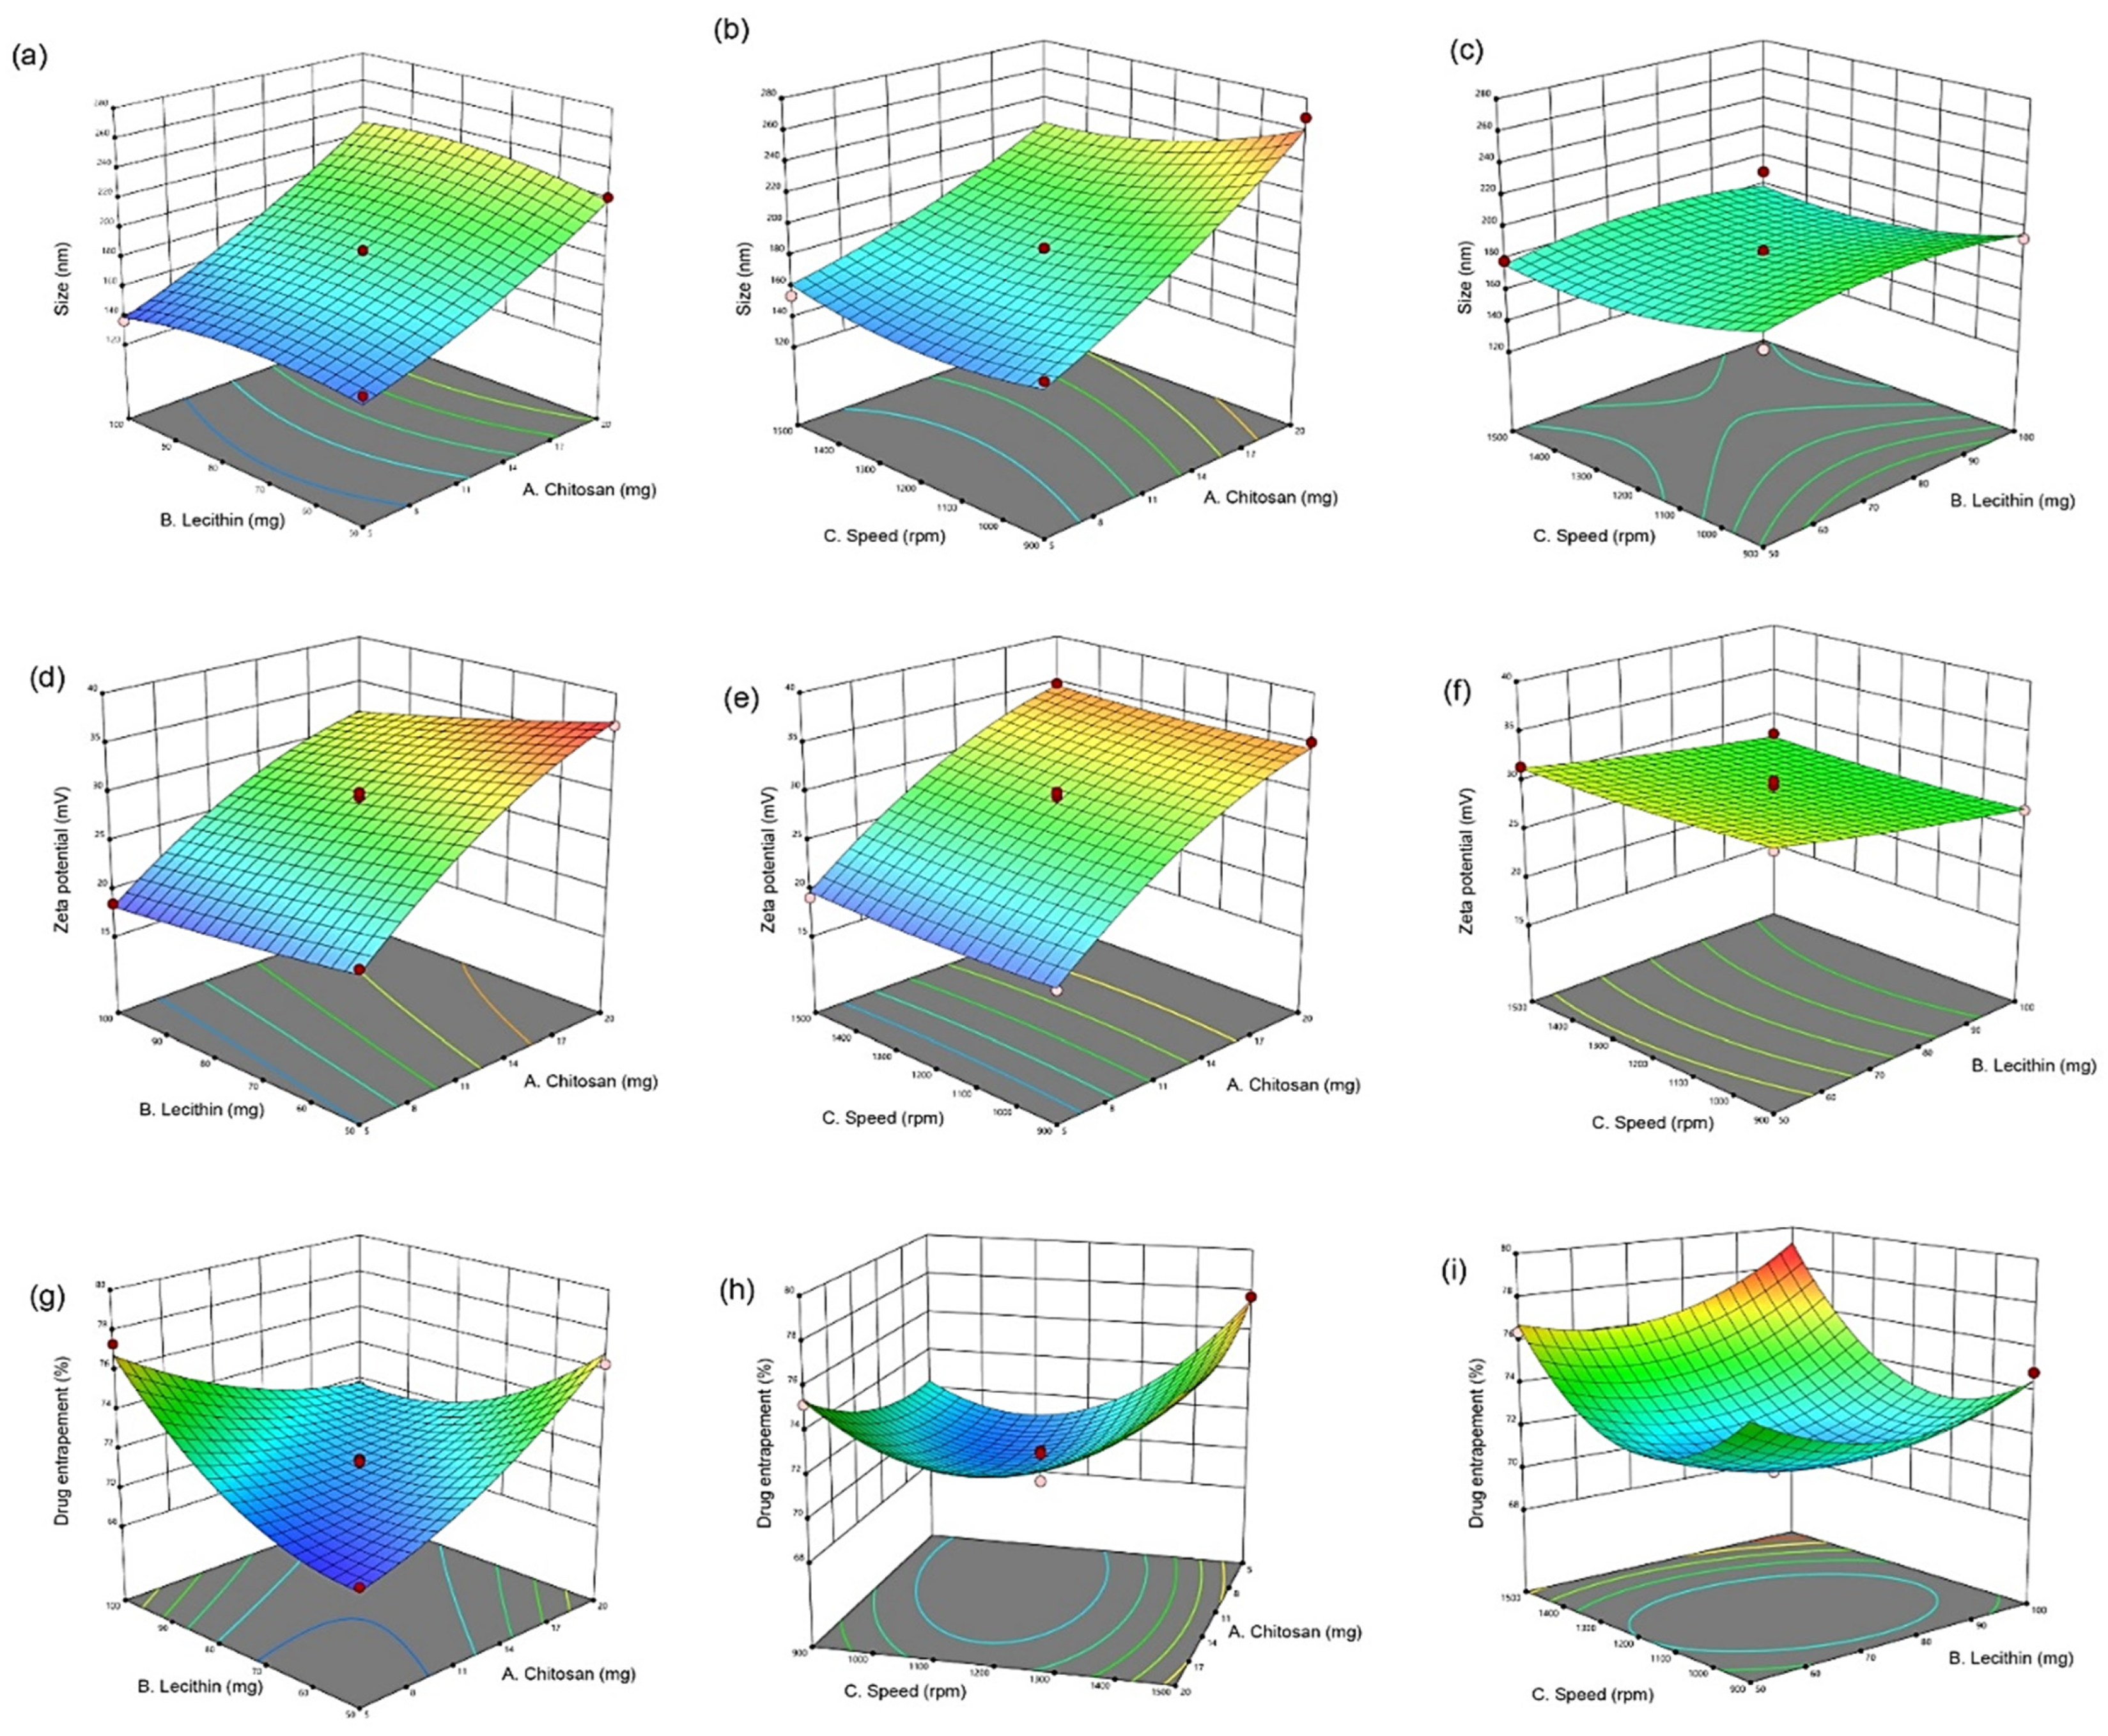
3.1.2. Interaction Effect of Independent Variables in the Responses

In our study, we observed that lecithin and CS total amounts influence the mean particle size of the obtained CUR/LCSNPs. CS was found to have the greatest impact on the mean particle size compared to other independent factors (such as the amount of lecithin in the CUR/LCSNPs composition and the stirring speed applied during its preparation). The mathematical relationship obtained utilizing a Box-Behnken statistical design suggested a quadratic model with the following polynomial equation for mean particle size.
Y1 = 184.79 + 41.02A + 3.09B − 8.30C + 4.24AB − 10.25 AC + 0.169BC + 6.33A2 − 8.04B2 + 9.66C2
The interaction effect of A and B for the CUR/LCSNPs was found to have a positive impact on the response Y1, while C has a negative impact on Y1. The combined effect of A and B and B and C has a positive impact on Y1 (the impact effect of combined A and B is approximately 25 times higher than the effect of combined B and C), while the combined effect of A and C has a negative impact on Y1. The mathematical relationship obtained utilizing a Box-Behnken statistical design suggested a quadratic model with the following polynomial equations for mean particle size (Y2) and %EE (Y3).
Y2 = 28.93 + 7.36A − 2.10B − 0.0125C − 0.06AB + 0.075AC + 0.20BC − 2.10A2 + 0.22B2 + 0.345C2
Y3 = 71.07 + 2.57A + 0.51B + 1.65C − 3.06AB − 0.90AC + 0.722BC + 0.956A2 + 1.76B2 + 3.52C2
It was observed that the effect of A was found to have a positive impact on responses Y2, while B and C have a negative impact. For response Y3, the influence of A, B, and C has a positive impact on Y3. However, Y3 is negatively impacted by the interaction of AB and AC, while Y3 is positively impacted by BC.
The mean particle size of the checkpoint formulation ranged from 136.44 ± 1.70 nm to 267.94 ± 3.72 nm. The amount of CS and lecithin in the different formulations (Table 2) has an influence on the mean particle size. The particle size of CUR/LCSNPs was 136.44 ± 1.70 nm in (F9) consisting of 5 mg of CS, while it was 267.94 ± 3.70 nm in (F17) consisting of 20 mg of CS. At the mean concentration (12.5 mg) of CS, the mean particle size was observed to be 189.40 ± 1.02 nm (F7) Table 2. The particle size was observed to be 162.43 ± 2.50 nm in (F11) consisting of 50 mg of lecithin, while it was 218.63 ± 2.70 nm in (F4) consisting of 75 mg of lecithin (Table 2).
The stirring speed also influenced the mean particle size across the different formulations (Table 2). It was 267.94 ± 3.70 nm (F17) when the stirring speed was 900 rpm, while it became 228.63 ± 2.70 nm (F4) at 1500 rpm. The effect of the three independent factors on the mean particle size of CUR/LCSNPs was observed to be in the following order: amount of CS > amount of lecithin > stirring speed.
The effect of independent variables on the mean particle size of CUR/LCSNPs is illustrated in Figure 1a–c as 3D-response surface plots. The ANOVA test revealed a statistically significant relationship between the mean particle size (Y1) and independent variables at 95% CI (p < 0.05) for A, B, and C, as shown in Table 4. Furthermore, R2 fit statistics showed 99.84% of the mean particle size variability demonstrated by the fitted model.
The zeta potential value of the prepared CUR/LCSNPs was found to be in the range of +18.5 ± 1.40 to 36.8 ± 3.20 mV. The CS in the composition of CUR/LCSNPs is responsible for inducing a positive charge on the surface of CUR/LCSNPs. The increase in the positive value of zeta potential was observed with the increase in the CS concentration in all checkpoint formulations (F1–F17). There was no noticeable influence of lecithin on the inducing of the negative charge on the surface of CUR/LCSNPs. The effect of independent variables (amount/concentration of chitosan, lecithin, and stirring speed during the preparation of CUR/LCSNPs) on the zeta potential of CUR/LCSNPs is illustrated in Figure 1d–f as 3D-response surface plots. The ANOVA test revealed a statistically significant relationship between zeta potential (Y2) and independent variables at the 95% CI (p < 0.05) for A, B, and C, as shown in Table 4. Furthermore, R2 fit statistics revealed that 98.96% of the zeta potential variability demonstrated the fitted model.
The quantity of CS and the stirring speed (rpm) applied during the preparation of CUR/LCSNPs were the main factors that influenced the %EE of CUR in developed CUR/LCSNPs formulations. The %EE of all checkpoint formulations suggested by the Box-Behnken statistical design varies from 69.84 ± 1.50% to 78.50 ± 2.10%. It was observed that the %EE of the prepared CUR/LCSNPs (F3) consisting of 5 mg CS was found to be 69.84 ± 1.50% while it was 76.33 ± 2.10% at (F6) consisting of 20 mg of CS. In the case of stirring speed, the %EE of prepared CUR/LCSNPs was found to be 71.46 ± 2.30% at (F11) when the stirring speed was 900 rpm, while it was 77.69 ± 2.70% at (F10) when the stirring speed was 1500 rpm. The influence of three designated independent factors on the %EE of CUR/LCSNPs was observed to be in the following order: quantity of CS > stirring speed (rpm) > quantity of lecithin. The independent variables’ effect on EE% of CUR/LCSNPs is illustrated in Figure 1g–i as 3D-response surface plots. The ANOVA test revealed a statistically significant relationship between %EE (Y3) and independent variables at the 95% CI (p < 0.05) for A, B, and C, as shown in Table 4. Furthermore, R2 fit statistics revealed that 98.37% of the %EE variability was demonstrated by the fitted model.

3.1.3. Applied Model Validation

The determination of the interaction effect of independent variables on dependent variables was desirable (Figure 1). The 3D plot displays the impact of two factors on a specific response, and the third factor remains constant. The optimized CUR/LCSNPs were selected based on the point-prediction methodology, i.e., the selection was based on attaining the minimum mean particle size and maximum entrapment efficiency (%EE) with optimal zeta potential [34]. A Box-Behnken statistical design model yielded the desirable values for mean particle size, zeta potential, and %EE CUR/LCSNPs of 141.40 nm, +18.19 mV, and 76.78%, respectively. Therefore, considering the suggested compositions of CUR/LCSNPs for the desirable predicted values of dependent variables, a desirable CUR/LCSNPs was prepared and evaluated to know the desirable value of the dependent variables of CUR/LCSNPs. It was found that desirable CUR/LCSNPs have a mean particle size of 138.4 ± 2.10 nm, a zeta potential of +18.98 ± 0.72 mV (Figure 2 a,b), and %EE of 77.40 ± 1.70. The experimental/observed values obtained for dependent variables of CUR/LCSNPs were found to be near the predicted values. The percentage prediction error was calculated and found to be within the permissible limit (as shown in Table 5).
The linear correlation plot (A, B, and C) between predicted and observed values are presented in Figure 3. The prediction error (%) is regarded as an appropriate method for determining errors that may occur during the experiment [21]. The prediction error (%) is close to zero, indicating that the obtained values are precise in comparison to the target value [21,35,36,37,38]. Furthermore, the prediction error (%) ensured that the obtained regression equation is valid [32,33].

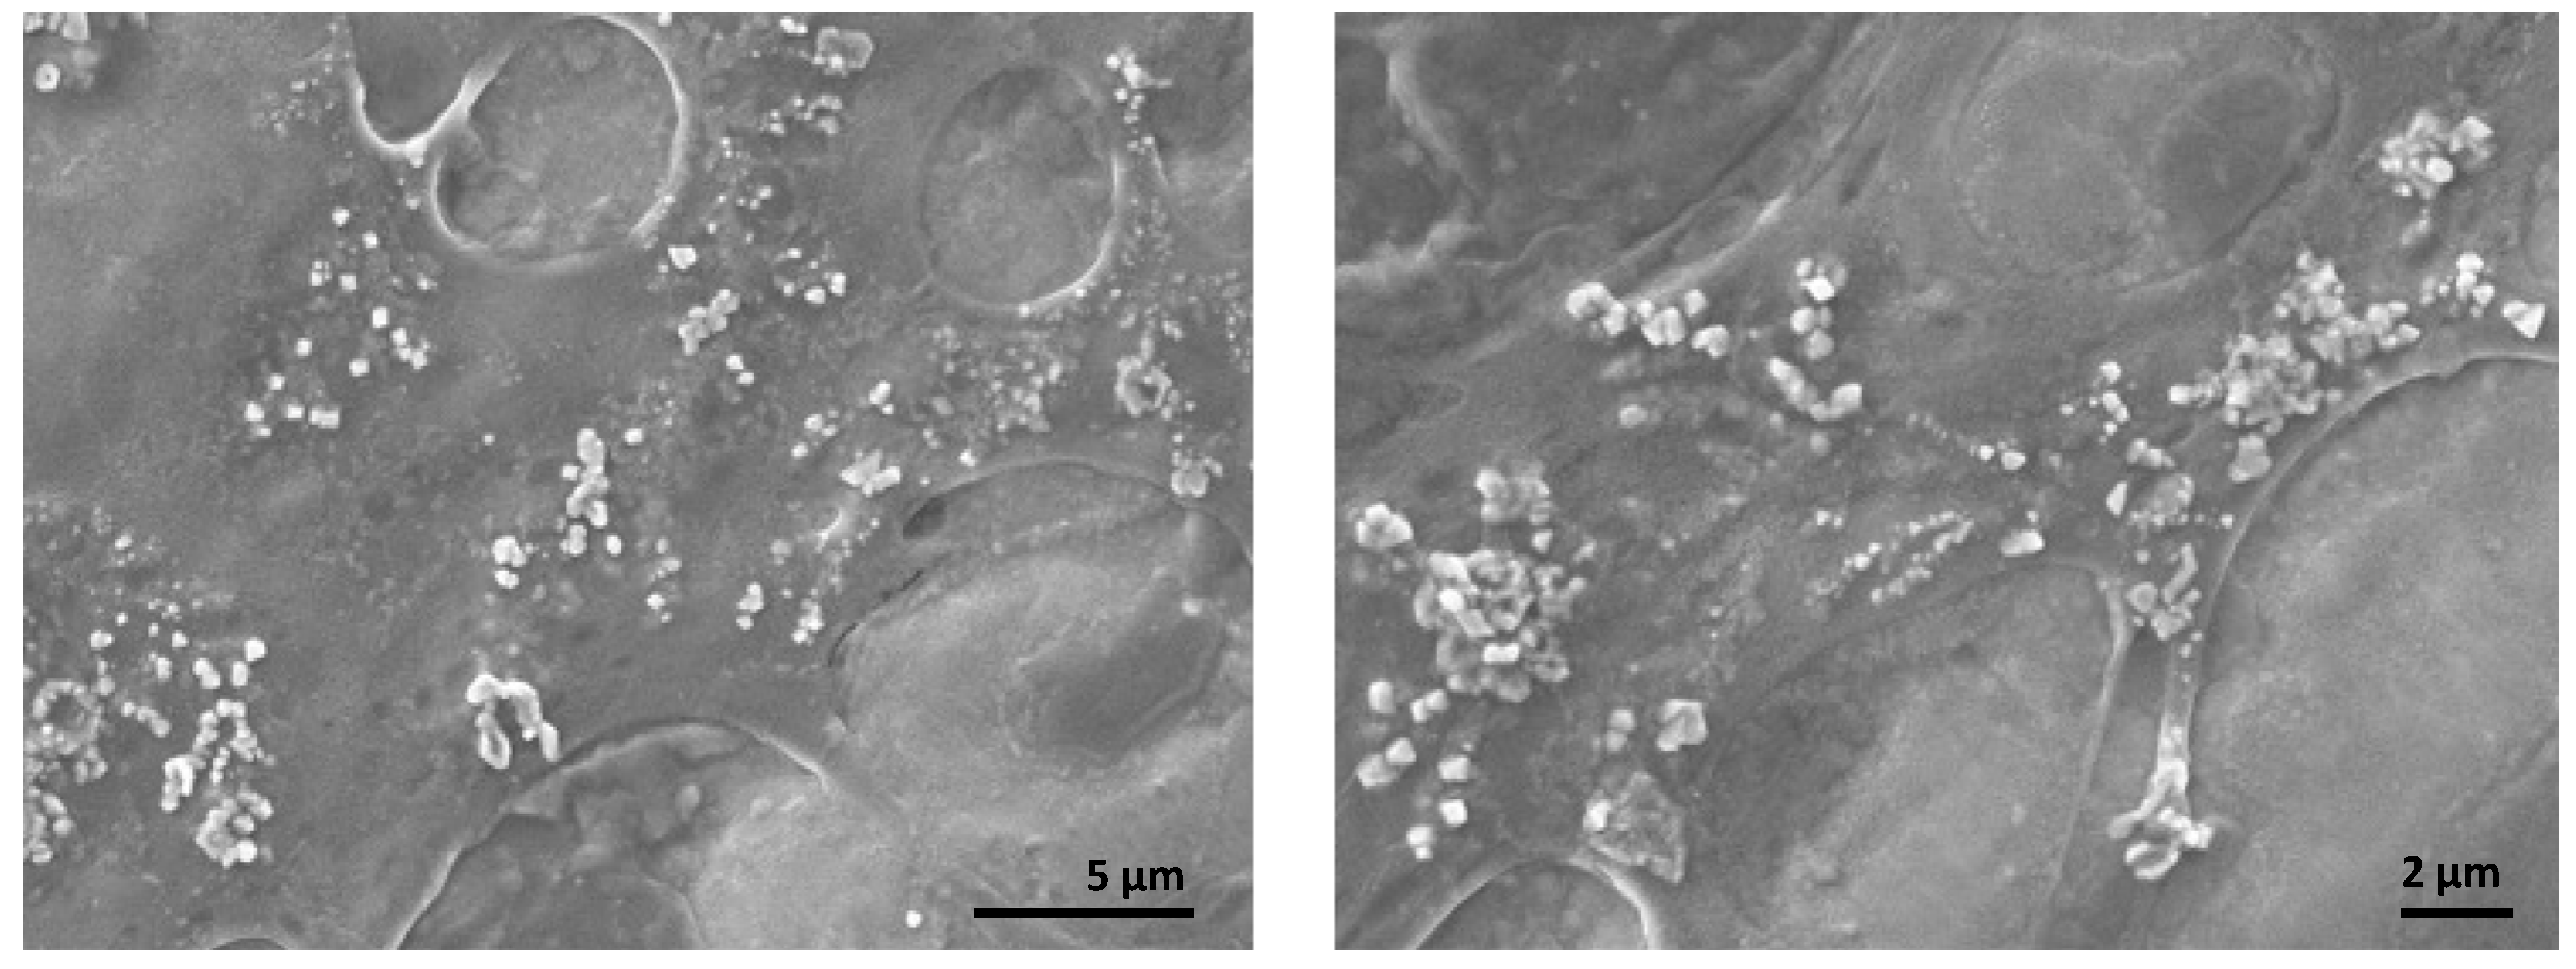
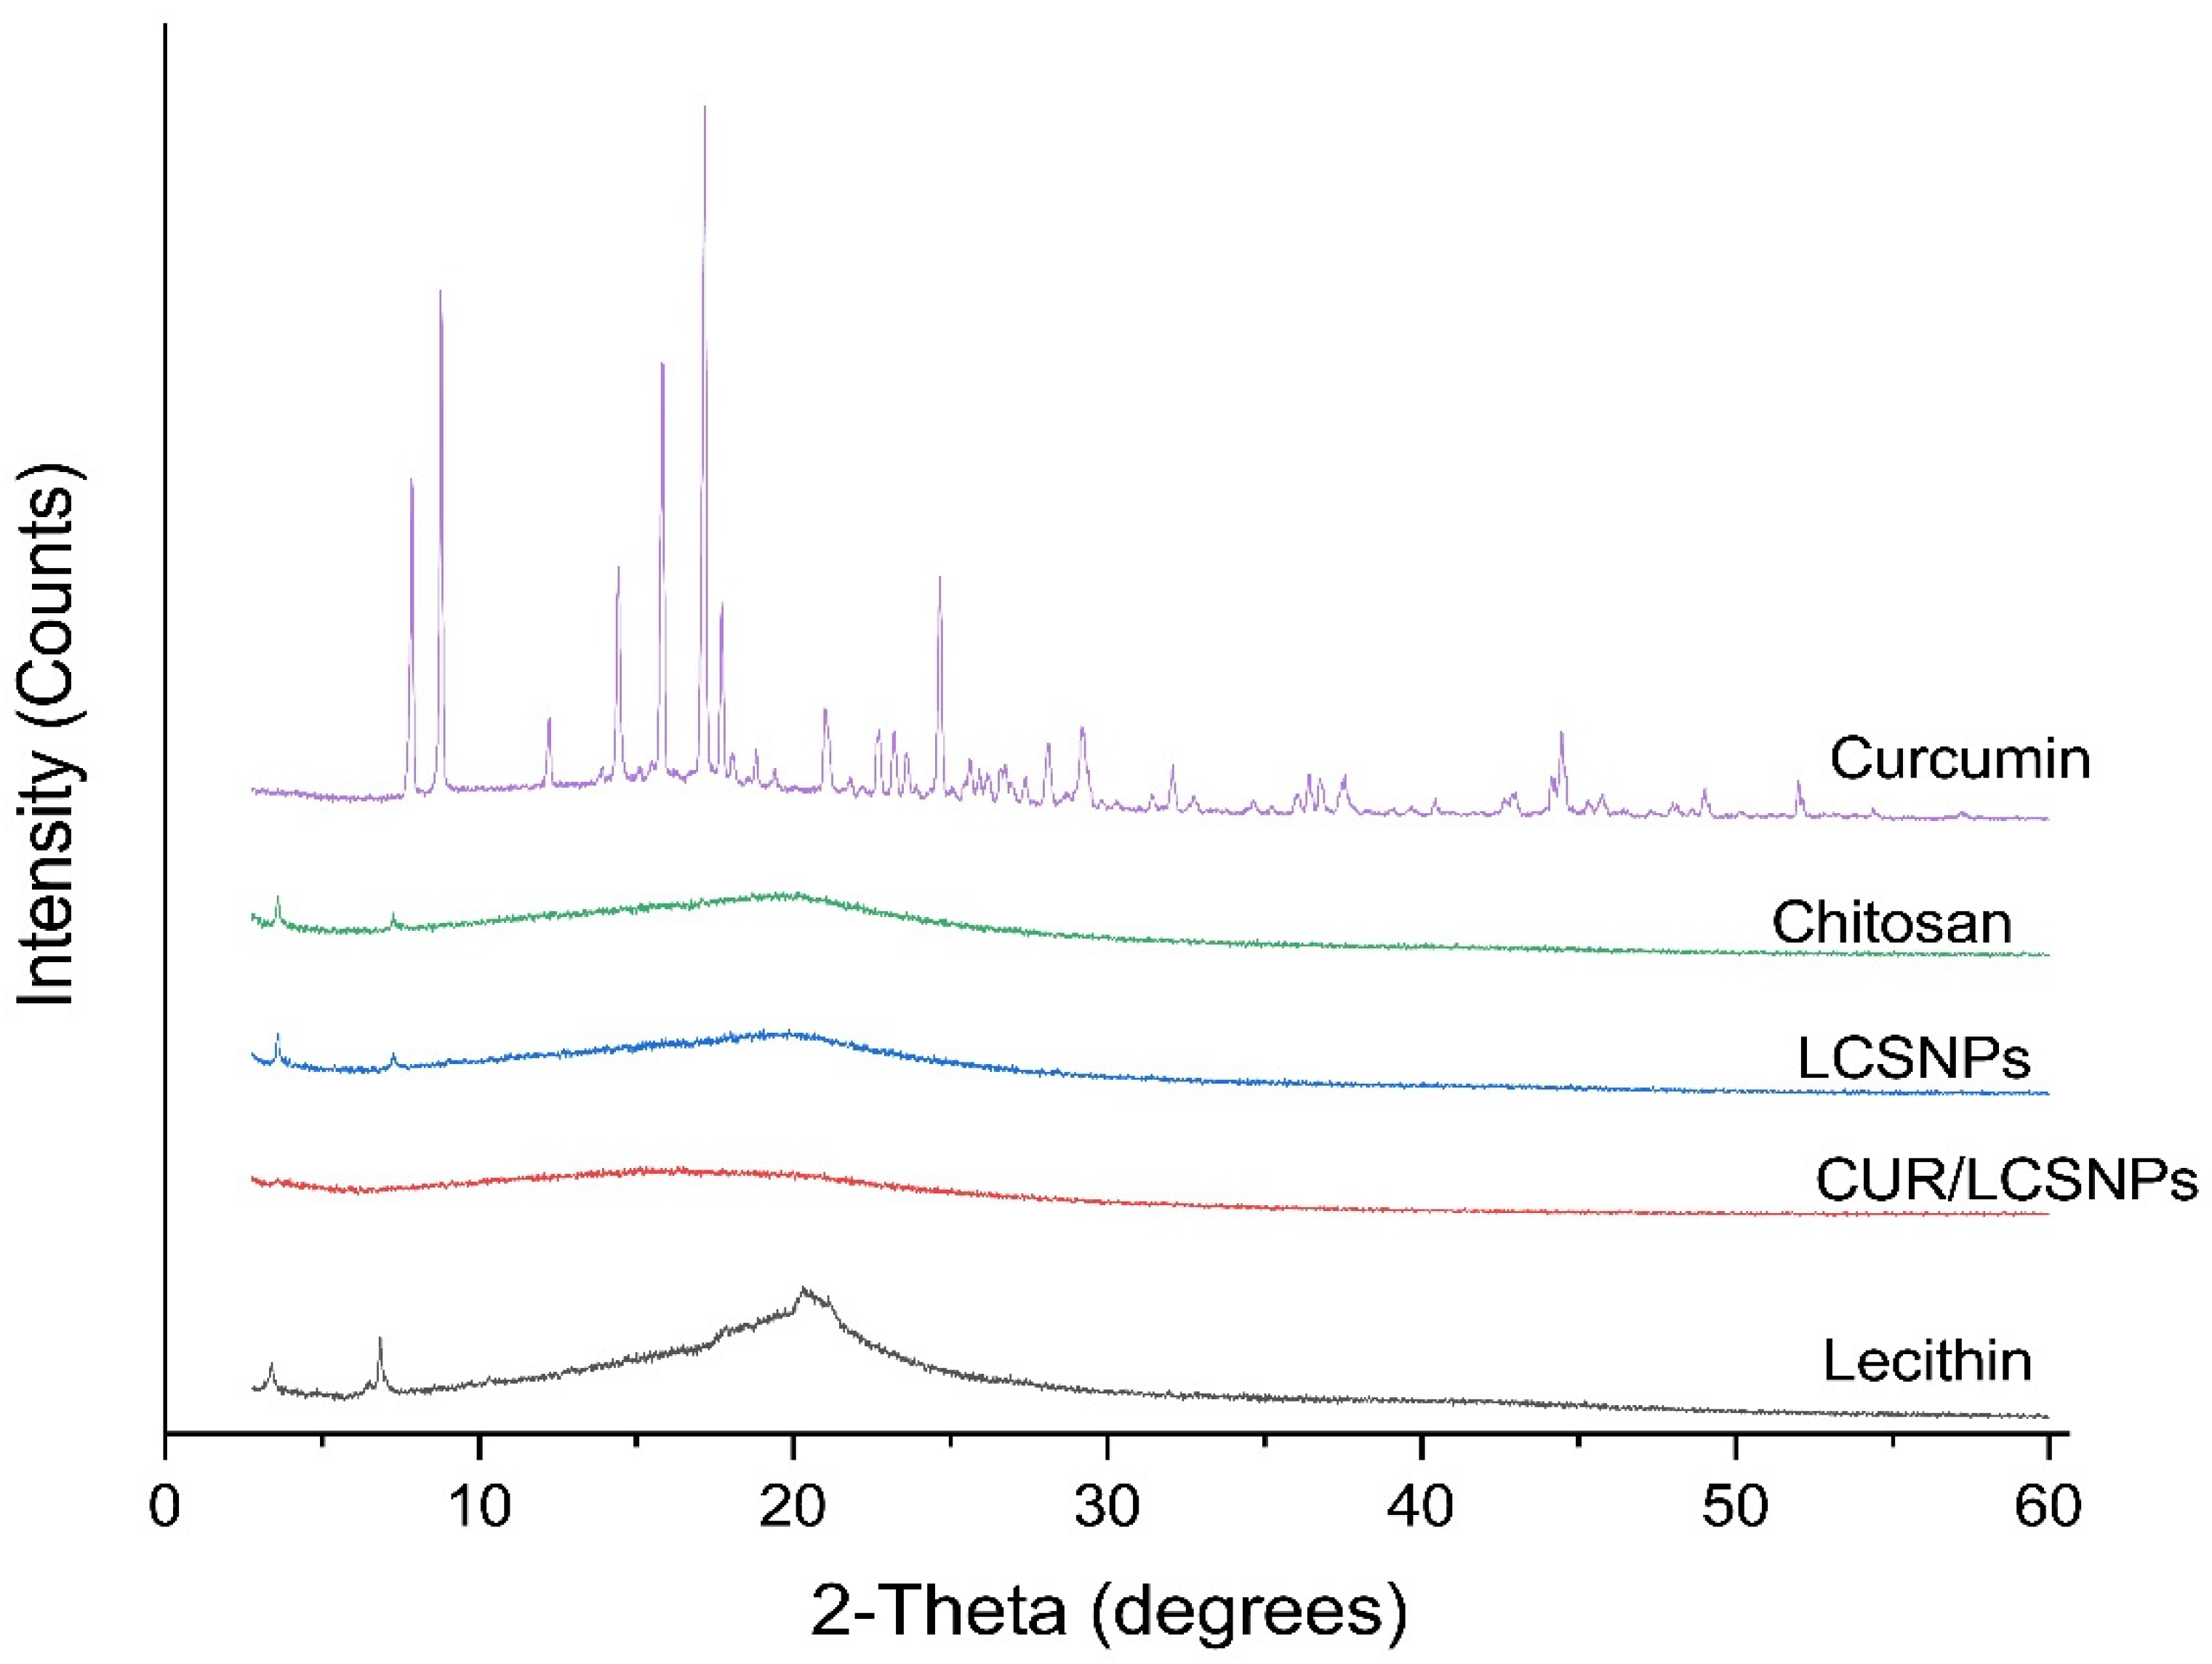
3.2. SEM and XRD Analysis

Further analysis with SEM and XRD confirmed the presence of synthesized nanoparticles and the loading of curcumin onto LCSNPs. SEM images in Figure 4 show that CUR/LCSNPs have an irregular nanostructured shape, as well as aggregated nanoparticles. Comparative XRD spectra of pure curcumin, lecithin, chitosan, LCSNPs, and CUR/LCSNPs are presented in Figure 5. An XRD diffractogram of pure curcumin showed a series of intense peaks at 7.87°, 8.77°, 12.25°, 14.43°, 15.85°, 17.17°, 17.71°, 21.05°, 22.73°, 23.25°, 24.65°, 28.13°, and 29.23° at diffraction angles at the 2-theta axis, indicating the crystallinity nature of the curcumin as reported in the literature [39]. In the prepared CUR/LCSNPs, these peaks’ intensity was significantly reduced, indicating less crystallin (Figure 5). Thus, it indicated that the curcumin was adequately loaded within the chitosan in the nanoparticles.

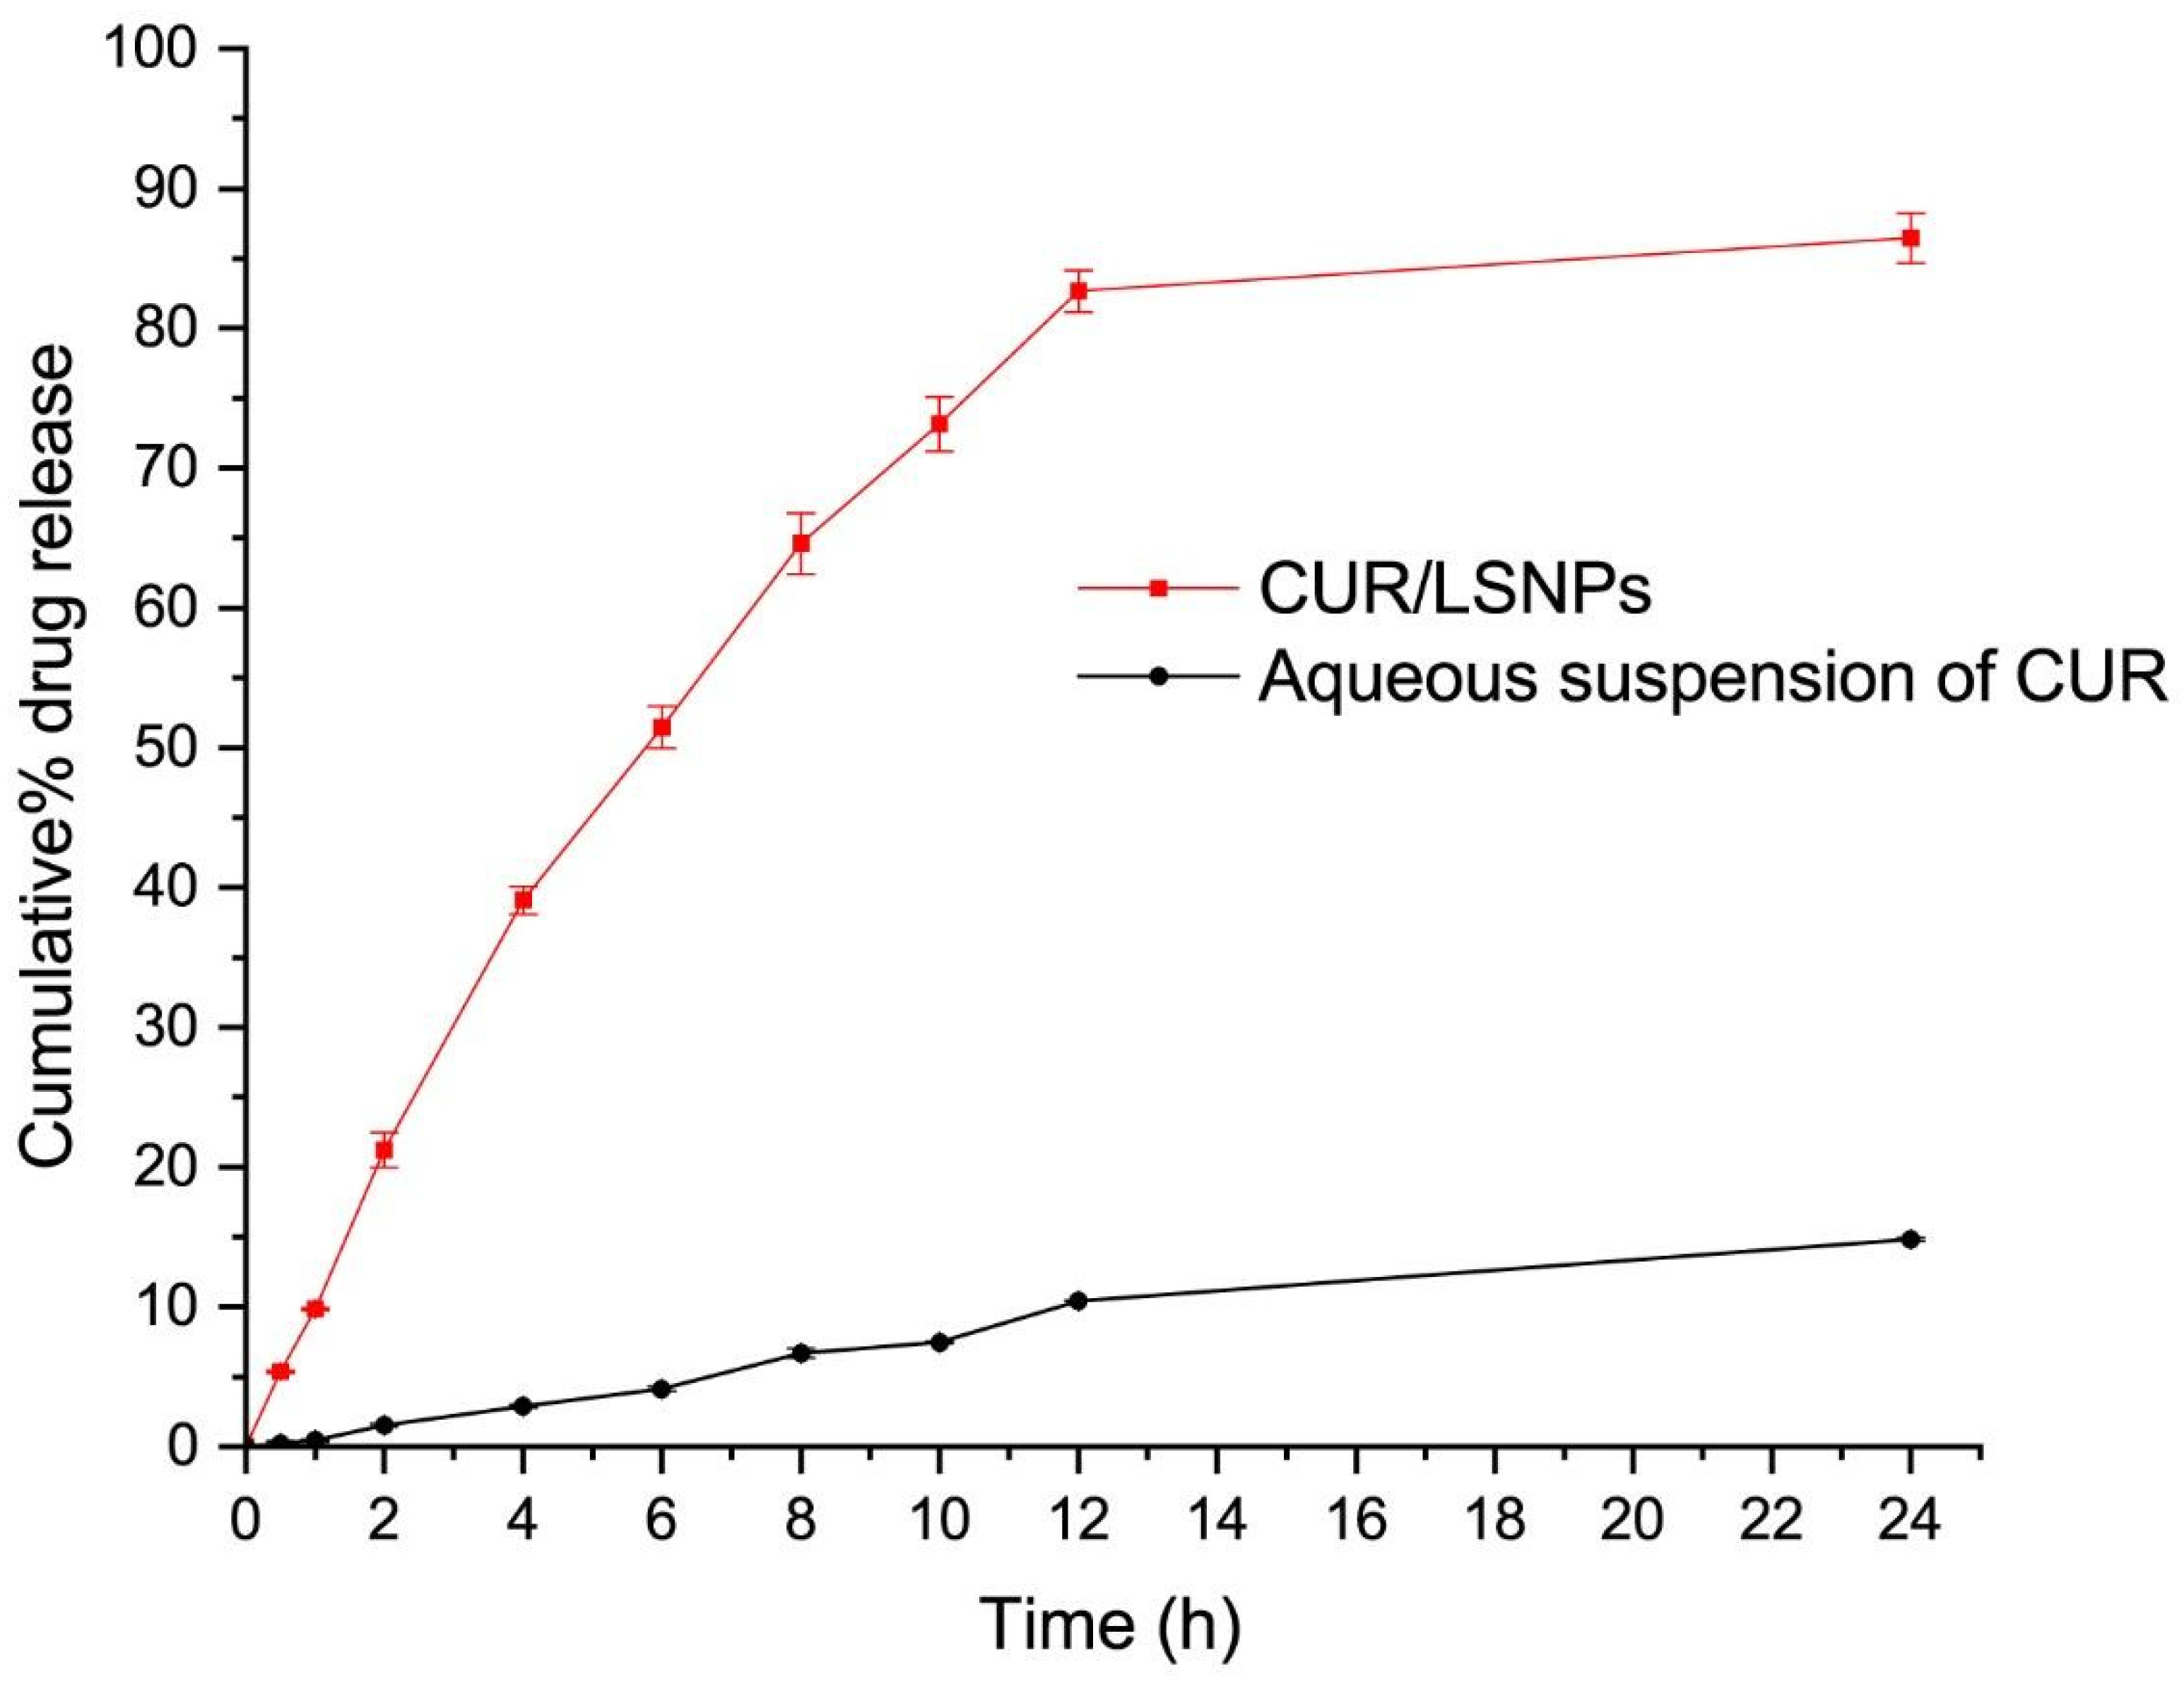
3.3. In Vitro Release Kinetics of CUR/LCSNPs

To investigate the in vitro release profile of CUR for CUR/LCSNPs at pH 7.4, ethanol (5%) was used as a co-solubilizer to facilitate the release of CUR from the CUR/LCSNPs. The addition of 5% ethanol in the release media will not alter the release of CUR from CUR/LCSNPs, since it was previously investigated that ethanol concentration up to 40% v/v did not interfere with the release behavior of lipophilic drugs [40]. The in vitro release study demonstrated the slow and sustained release profile (Figure 6). The optimized CUR/LCSNPs formulation demonstrated 51.46 ± 1.49% of cumulative release of CUR in 6 h and 86.18 ± 1.5% of cumulative release of CUR in 24 h from the developed system at pH 7.4 (Figure 6). On the other hand, only 14.81 ± 0.10% of CUR was released from the aqueous suspension of CUR in 24 h at pH 7.4. The release of a drug from any formulation is affected by a variety of variables, including the dissolution and absorption of the drug from the aqueous media, the swelling behavior of the polymers, and the diffusion of the drug throughout the polymer network [41]. When exposed to aqueous media, CS hydrates to form a gelatinous layer, allowing the drug to be released from its matrix [42]. A major regulator of this process is the diffusion of the drug through the swollen matrix of the CS, as well as the erosion of the swollen matrix of the CS [43]. Various drug-release kinetic models were fit to the drug-release behavior of the optimized CUR/LCSNPs (Supplementary Figure S1). According to the overall curve fitting (Table 6), the release of CUR from the optimized CUR/LCSNPs followed the Korsmeyer–Peppas model. This indicates that the CUR release from the optimized CUR/LCSNPs is diffusion-controlled and follows Fickian diffusion (n < 0.45) [44].

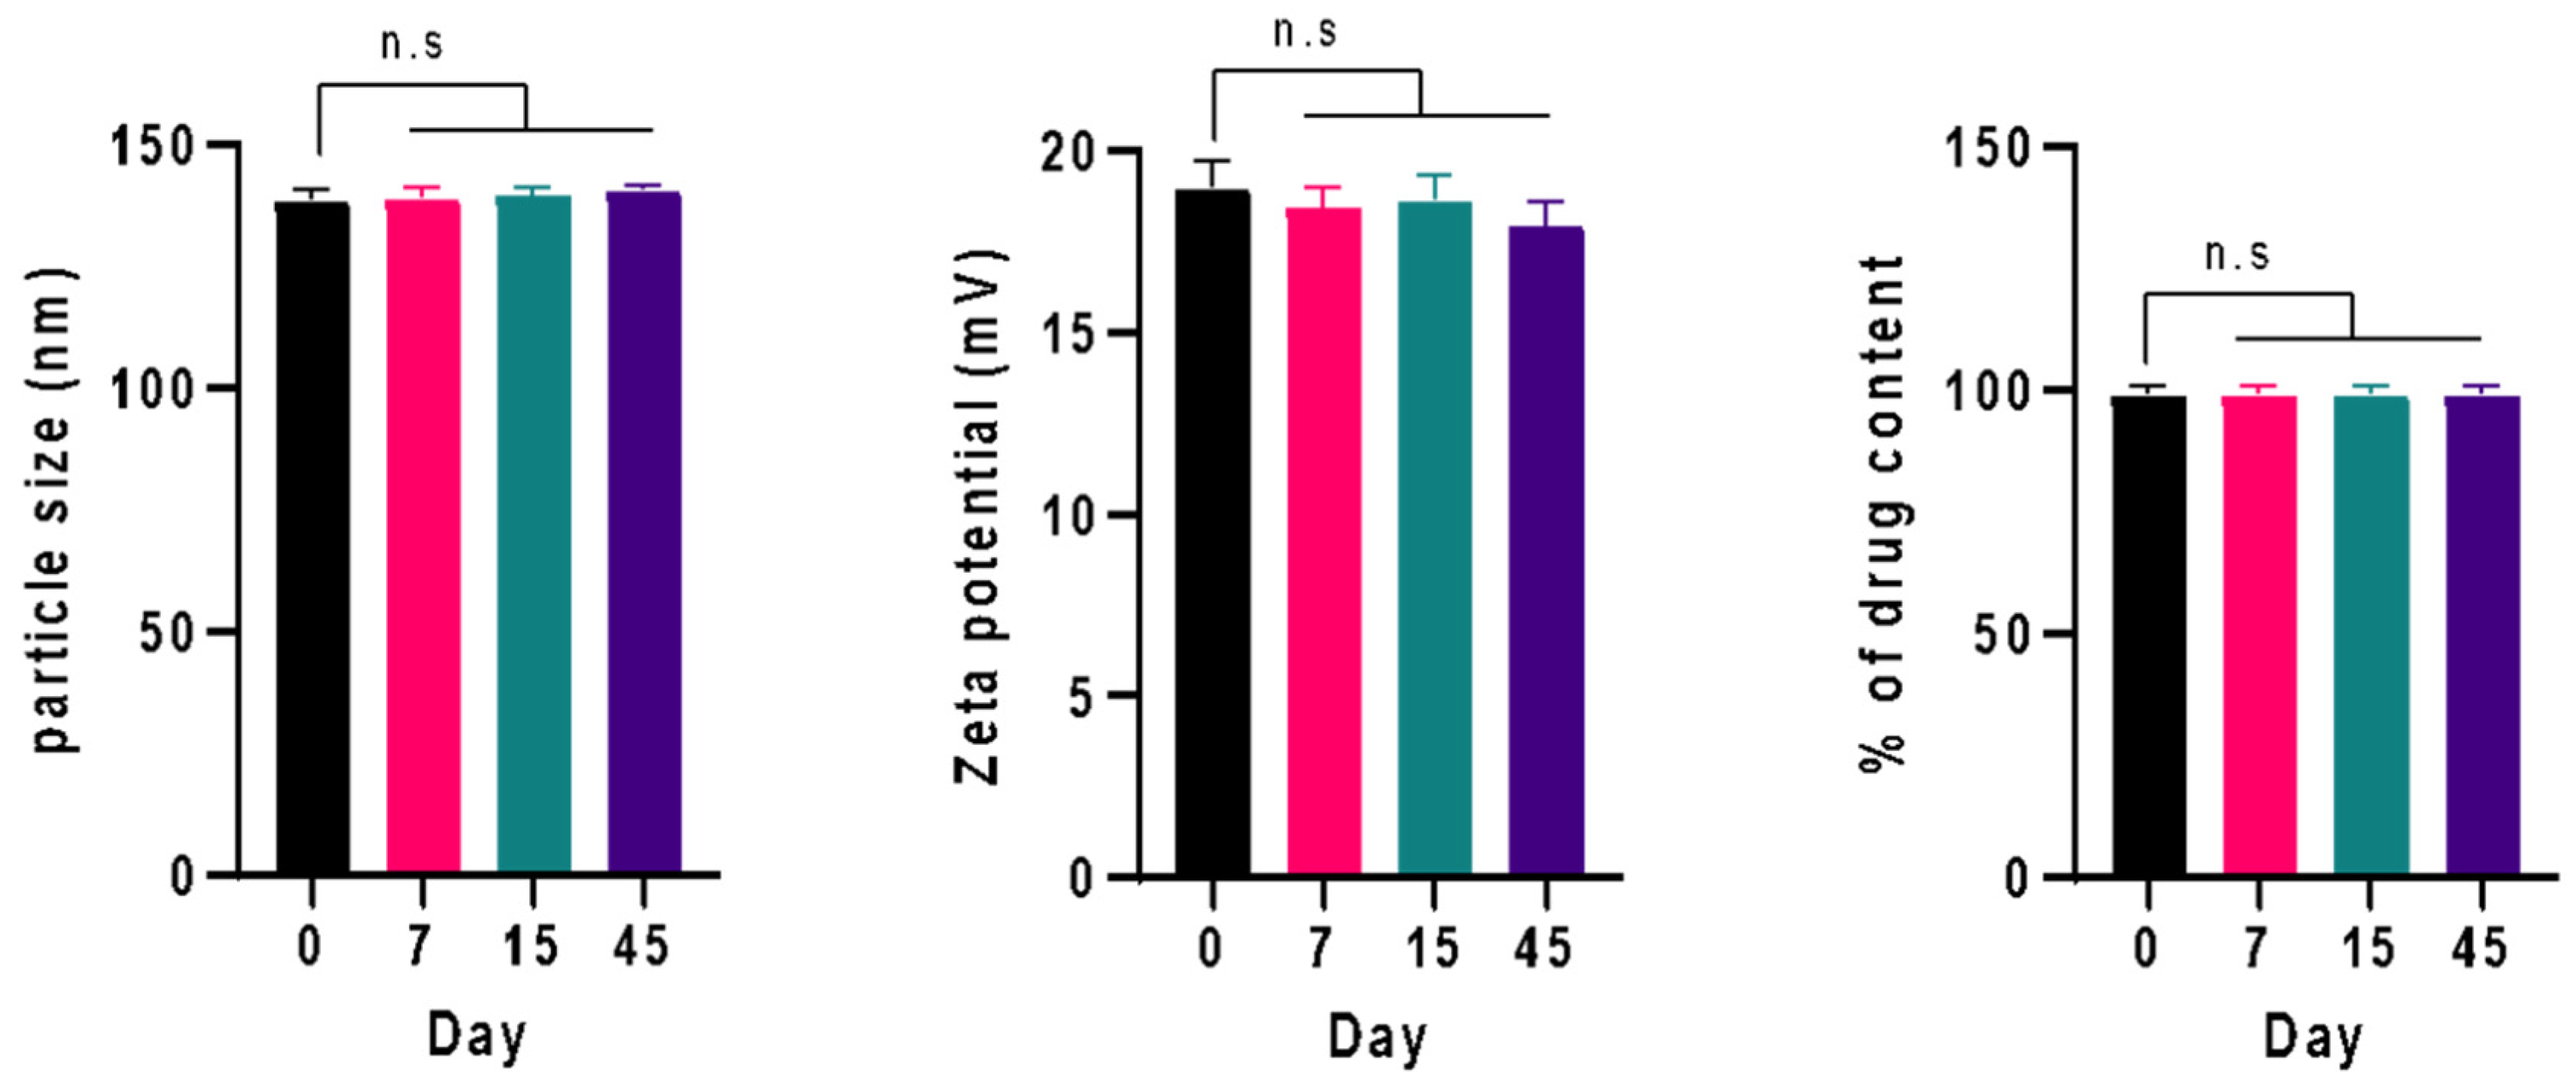
3.4. Physical Stability Study

The physical stability of the optimized formulation of CUR/LCSNPs for 45 days was performed at 30 ± 1 °C. CUR/LCSNPs did not show any significant changes in the average particle size, PDI, zeta potential, and % drug content (Table 7 and Figure 7). At the end of 45 days, CUR/LCSNPs exhibited a slight increase in mean particle size due to CS’ swelling or adsorption to water [21].

4. Conclusions

Self-assembled CUR/LCSNPs with high %EE, appropriate drug release, and good physical stability at room temperature were developed by the application of a Box-Behnken design. CUR was successfully encapsulated into the matrix of LCSNPs. The quantitative effect of independent variables at various stages on achieving the smallest possible average particle size, the optimal zeta potential, and the highest possible %EE would be predicted using polynomial equations. The linear relationship between the predicted and actual values of the optimized formulation suggests that the response surface methodology is predictive. It was determined that the developed CUR/LCSNPs at a w/w ratio of 20:1 (L:CS) were suitable for further investigation in terms of average particle size, PDI, and zeta potential. The release kinetics of the optimized formulation suggested the release of CUR from the optimized CUR/LCSNPs formulation followed the Korsmeyer–Peppas model with Fickian diffusion (n < 0.45). We believe that the CUR-loaded LCSNPs developed in this study can serve as an optimal model for encapsulating hydrophobic drugs/bioactive for therapeutic/biomedical applications.

Supplementary Materials

The following supporting information can be downloaded at: https://www.mdpi.com/article/10.3390/polym14183758/s1, Figure S1: Schematic illustration highlight various drug release kinetic models that were fitted to the drug release behavior of the optimized CUR/LCSNPs. High resolution figures is provided for Figure 1, Figure 2 and Figure 3.

Author Contributions

Conceptualization, I.A.W. and H.A.A.; methodology, I.A.W. and M.Z.A.; validation, H.A.A. and M.Z.A.; formal analysis, M.Z.A., A.S.A., S.A.A. and A.H.A.; investigation, J.A. and M.S.A.; writing—original draft preparation, I.A.W., H.A.A. and M.Z.A.; writing—review and editing, J.A. and M.S.A.; supervision, I.A.W. and H.A.A. All authors have read and agreed to the published version of the manuscript.

Funding

This study received financial and technical support from the Deanship of Scientific Research, Najran University, Kingdom of Saudi Arabia, under code number (NU/MID/17/074).

Institutional Review Board Statement

Not applicable.

Informed Consent Statement

Not applicable.

Data Availability Statement

The data presented in this study are available in article or Supplementary Materials.

Acknowledgments

The authors would like to express their gratitude to the ministry of education and the deanship of scientific research–Najran University–Kingdom of Saudi Arabia for their financial and technical support under code number (NU/MID/17/074).

Conflicts of Interest

The authors declare no conflict of interest.

References

  1. Ahmad, M.Z.; Alkahtani, S.A.; Akhter, S.; Ahmad, F.J.; Ahmad, J.; Akhtar, M.S.; Mohsin, N.; Abdel-Wahab, B.A. Progress in nanotechnology-based drug carrier in designing of curcumin nanomedicines for cancer therapy: Current state-of-the-art. J. Drug Target. 2016, 24, 273–293. [Google Scholar] [CrossRef] [PubMed]
  2. Ahmad, M.Z.; Akhter, S.; Mohsin, N.; Abdel-Wahab, B.A.; Ahmad, J.; Warsi, M.H.; Rahman, M.; Mallick, N.; Ahmad, F.J. Transformation of curcumin from food additive to multifunctional medicine: Nanotechnology bridging the gap. Curr. Drug Discov. Technol. 2014, 11, 197–213. [Google Scholar] [CrossRef] [PubMed]
  3. Lee, W.H.; Loo, C.Y.; Young, P.M.; Traini, D.; Mason, R.S.; Rohanizadeh, R. Recent advances in curcumin nanoformulation for cancer therapy. Expert Opin. Drug Deliv. 2014, 11, 1183–1201. [Google Scholar] [CrossRef] [PubMed]
  4. Aggarwal, M.L.; Chacko, K.M.; Kuruvilla, B.T. Systematic and comprehensive investigation of the toxicity of curcuminoid-essential oil complex: A bioavailable turmeric formulation. Mol. Med. Rep. 2016, 13, 592–604. [Google Scholar] [CrossRef]
  5. Mohanty, C.; Das, M.; Sahoo, S.K. Emerging role of nanocarriers to increase the solubility and bioavailability of curcumin. Expert Opin. Drug Deliv. 2012, 9, 1347–1364. [Google Scholar] [CrossRef]
  6. Anand, P.; Kunnumakkara, A.B.; Newman, R.A.; Aggarwal, B.B. Bioavailability of curcumin: Problems and promises. Mol. Pharm. 2007, 4, 807–818. [Google Scholar] [CrossRef]
  7. Sharma, R.A.; Gescher, A.J.; Steward, W.P. Curcumin: The story so far. Eur. J. Cancer 2005, 41, 1955–1968. [Google Scholar] [CrossRef]
  8. Duan, J.; Zhang, Y.; Han, S.; Chen, Y.; Li, B.; Liao, M.; Chen, W.; Deng, X.; Zhao, J.; Huang, B. Synthesis and in vitro/in vivo anti-cancer evaluation of curcumin-loaded chitosan/poly(butyl cyanoacrylate) nanoparticles. Int. J. Pharm. 2010, 400, 211–220. [Google Scholar] [CrossRef]
  9. Algahtani, M.S.; Ahmad, M.Z.; Nourein, I.H.; Albarqi, H.A.; Alyami, H.S.; Alyami, M.H.; Alqahtani, A.A.; Alasiri, A.; Algahtani, T.S.; Mohammed, A.A.; et al. Preparation and Characterization of Curcumin Nanoemulgel Utilizing Ultrasonication Technique for Wound Healing: In Vitro, Ex Vivo, and In Vivo Evaluation. Gels 2021, 7, 213. [Google Scholar] [CrossRef]
  10. Feng, T.; Wei, Y.; Lee, R.J.; Zhao, L. Liposomal curcumin and its application in cancer. Int. J. Nanomed. 2017, 12, 6027–6044. [Google Scholar] [CrossRef] [Green Version]
  11. Ipar, V.S.; Dsouza, A.; Devarajan, P.V. Enhancing Curcumin Oral Bioavailability Through Nanoformulations. Eur. J. Drug Metab. Pharmacokinet. 2019, 44, 459–480. [Google Scholar] [CrossRef] [PubMed]
  12. Ma, Z.; Wang, N.; He, H.; Tang, X. Pharmaceutical strategies of improving oral systemic bioavailability of curcumin for clinical application. J. Control. Release 2019, 316, 359–380. [Google Scholar] [CrossRef] [PubMed]
  13. Wei, Y.; Guo, A.; Liu, Z.; Zhang, L.; Liao, W.; Liu, J.; Mao, L.; Yuan, F.; Gao, Y. Development of curcumin loaded core-shell zein microparticles stabilized by cellulose nanocrystals and whey protein microgels through interparticle interactions. Food Funct. 2021, 12, 6936–6949. [Google Scholar] [CrossRef] [PubMed]
  14. Nano Water Soluble Curcumin Offers Bioavailability Solution. Available online: https://www.vitafoodsinsights.com/ingredients/nano-water-soluble-curcumin-offers-bioavailability-solution (accessed on 17 February 2022).
  15. Ahmad, M.Z.; Rizwanullah, M.; Ahmad, J.; Alasmary, M.Y.; Akhter, M.H.; Abdel-Wahab, B.A.; Warsi, M.H.; Haque, A. Progress in nanomedicine-based drug delivery in designing of chitosan nanoparticles for cancer therapy. Int. J. Polym. Mater. Polym. Biomater. 2021, 71, 602–623. [Google Scholar] [CrossRef]
  16. Naruphontjirakul, P.; Viravaidya-Pasuwat, K. Development of anti-HER2-targeted doxorubicin-core-shell chitosan nanoparticles for the treatment of human breast cancer. Int. J. Nanomed. 2019, 14, 4105–4121. [Google Scholar] [CrossRef]
  17. Yoncheva, K.; Merino, M.; Shenol, A.; Daskalov, N.T.; Petkov, P.S.; Vayssilov, G.N.; Garrido, M.J. Optimization and in-vitro/in-vivo evaluation of doxorubicin-loaded chitosan-alginate nanoparticles using a melanoma mouse model. Int. J. Pharm. 2019, 556, 1–8. [Google Scholar] [CrossRef]
  18. Lopes, V.F.; Giongo, C.N.; de Almeida Campos, L.; Abraham, W.R.; Mainardes, R.M.; Khalil, N.M. Chitosan Nanoparticles Potentiate the in vitro and in vivo Effects of Curcumin and other Natural Compounds. Curr. Med. Chem. 2021, 28, 4935–4953. [Google Scholar] [CrossRef]
  19. Hou, X.; Zhang, W.; He, M.; Lu, Y.; Lou, K.; Gao, F. Preparation and characterization of β-cyclodextrin grafted N-maleoyl chitosan nanoparticles for drug delivery. Asian J. Pharm. Sci. 2017, 12, 558–568. [Google Scholar] [CrossRef]
  20. Yemisci, M.; Caban, S.; Fernandez-Megia, E.; Capan, Y.; Couvreur, P.; Dalkara, T. Preparation and Characterization of Biocompatible Chitosan Nanoparticles for Targeted Brain Delivery of Peptides. Methods Mol. Biol. 2018, 1727, 443–454. [Google Scholar] [CrossRef]
  21. Alkholief, M. Optimization of Lecithin-Chitosan nanoparticles for simultaneous encapsulation of doxorubicin and piperine. J. Drug Deliv. Sci. Technol. 2019, 52, 204–214. [Google Scholar] [CrossRef]
  22. Lopes Rocha Correa, V.; Assis Martins, J.; Ribeiro de Souza, T.; de Castro Nunes Rincon, G.; Pacheco Miguel, M.; Borges de Menezes, L.; Correa Amaral, A. Melatonin loaded lecithin-chitosan nanoparticles improved the wound healing in diabetic rats. Int. J. Biol. Macromol. 2020, 162, 1465–1475. [Google Scholar] [CrossRef] [PubMed]
  23. Murthy, A.; Ravi, P.R.; Kathuria, H.; Vats, R. Self-assembled lecithin-chitosan nanoparticles improve the oral bioavailability and alter the pharmacokinetics of raloxifene. Int. J. Pharm. 2020, 588, 119731. [Google Scholar] [CrossRef]
  24. Panda, D.S.; Eid, H.M.; Elkomy, M.H.; Khames, A.; Hassan, R.M.; Abo El-Ela, F.I.; Yassin, H.A. Berberine Encapsulated Lecithin-Chitosan Nanoparticles as Innovative Wound Healing Agent in Type II Diabetes. Pharmaceutics 2021, 13, 1197. [Google Scholar] [CrossRef] [PubMed]
  25. Negi, P.; Sharma, G.; Verma, C.; Garg, P.; Rathore, C.; Kulshrestha, S.; Lal, U.R.; Gupta, B.; Pathania, D. Novel thymoquinone loaded chitosan-lecithin micelles for effective wound healing: Development, characterization, and preclinical evaluation. Carbohydr. Polym. 2020, 230, 115659. [Google Scholar] [CrossRef] [PubMed]
  26. Perez-Ruiz, A.G.; Ganem, A.; Olivares-Corichi, I.M.; García-Sánchez, J.R. Lecithin–chitosan–TPGS nanoparticles as nanocarriers of (−)-epicatechin enhanced its anticancer activity in breast cancer cells. RSC Adv. 2018, 8, 34773–34782. [Google Scholar] [CrossRef] [PubMed]
  27. Ilk, S.; Saglam, N.; Özgen, M. Kaempferol loaded lecithin/chitosan nanoparticles: Preparation, characterization, and their potential applications as a sustainable antifungal agent. Artif. Cells Nanomed. Biotechnol. 2017, 45, 907–916. [Google Scholar] [CrossRef]
  28. Sonvico, F.; Cagnani, A.; Rossi, A.; Motta, S.; Di Bari, M.T.; Cavatorta, F.; Alonso, M.J.; Deriu, A.; Colombo, P. Formation of self-organized nanoparticles by lecithin/chitosan ionic interaction. Int. J. Pharm. 2006, 324, 67–73. [Google Scholar] [CrossRef]
  29. Alam, M.S.; Algahtani, M.S.; Ahmad, J.; Kohli, K.; Shafiq-Un-Nabi, S.; Warsi, M.H.; Ahmad, M.Z. Formulation design and evaluation of aceclofenac nanogel for topical application. Ther. Deliv. 2020, 11, 767–778. [Google Scholar] [CrossRef]
  30. Algahtani, M.S.; Ahmad, M.Z.; Ahmad, J. Nanoemulsion loaded polymeric hydrogel for Topical delivery of curcumin in Psoriasis. J. Drug Deliv. Sci. Technol. 2020, 59, 101847. [Google Scholar] [CrossRef]
  31. Algahtani, M.S.; Ahmad, M.Z.; Nourein, I.H.; Ahmad, J. Co-delivery of imiquimod and curcumin by nanoemugel for improved topical delivery and reduced psoriasis-like skin lesions. Biomolecules 2020, 10, 968. [Google Scholar] [CrossRef]
  32. Abul Kalam, M.; Khan, A.A.; Khan, S.; Almalik, A.; Alshamsan, A. Optimizing indomethacin-loaded chitosan nanoparticle size, encapsulation, and release using Box-Behnken experimental design. Int. J. Biol. Macromol. 2016, 87, 329–340. [Google Scholar] [CrossRef]
  33. Abul Kalam, M.; Sultana, Y.; Ali, A.; Aqil, M.; Mishra, A.K.; Aljuffali, I.A.; Alshamsan, A. Part I: Development and optimization of solid-lipid nanoparticles using Box-Behnken statistical design for ocular delivery of gatifloxacin. J. Biomed. Mater. Res. Part A 2013, 101, 1813–1827. [Google Scholar] [CrossRef] [PubMed]
  34. Zidan, A.S.; Mokhtar Ibrahim, M.; Megrab, N.A.E. Optimization of methotrexate loaded niosomes by Box-Behnken design: An understanding of solvent effect and formulation variability. Drug Dev. Ind. Pharm. 2017, 43, 1450–1459. [Google Scholar] [CrossRef] [PubMed]
  35. Gunda, R.K.; Manchineni, P.R. Statistical Design and Optimization of Sustained Release Formulations of Pravastatin. Turk. J. Pharm. Sci. 2020, 17, 221–227. [Google Scholar] [CrossRef]
  36. Hosny, K.M.; Alharbi, W.S.; Almehmady, A.M.; Bakhaidar, R.B.; Alkhalidi, H.M.; Sindi, A.M.; Hariri, A.H.; Shadab, M.D.; Zaki, R.M. Preparation and optimization of pravastatin-naringenin nanotransfersomes to enhance bioavailability and reduce hepatic side effects. J. Drug Deliv. Sci. Technol. 2020, 57, 101746. [Google Scholar] [CrossRef]
  37. Abosabaa, S.A.; ElMeshad, A.N.; Arafa, M.G. Chitosan Nanocarrier Entrapping Hydrophilic Drugs as Advanced Polymeric System for Dual Pharmaceutical and Cosmeceutical Application: A Comprehensive Analysis Using Box-Behnken Design. Polymers 2021, 13, 677. [Google Scholar] [CrossRef]
  38. Zidan, A.S.; Mokhtar, M. Multivariate Optimization of Formulation Variables Influencing Flurbiprofen Proniosomes Characteristics. J. Pharm. Sci. 2011, 100, 2212–2221. [Google Scholar] [CrossRef]
  39. Sayyar, Z.; Malmiri, H.J. Photocatalytic and antibacterial activities study of prepared self-cleaning nanostructure surfaces using synthesized and coated ZnO nanoparticles with Curcumin nanodispersion. Z. Für Krist.-Cryst. Mater. 2019, 234, 307–328. [Google Scholar] [CrossRef]
  40. Asare-Addo, K.; Conway, B.R.; Hajamohaideen, M.J.; Kaialy, W.; Nokhodchi, A.; Larhrib, H. Aqueous and hydro-alcoholic media effects on polyols. Colloids Surf. B Biointerfaces 2013, 111, 24–29. [Google Scholar] [CrossRef]
  41. Siepmann, J.; Siepmann, F. Mathematical modeling of drug dissolution. Int. J. Pharm. 2013, 453, 12–24. [Google Scholar] [CrossRef]
  42. Mohammed, M.A.; Syeda, J.T.M.; Wasan, K.M.; Wasan, E.K. An Overview of Chitosan Nanoparticles and Its Application in Non-Parenteral Drug Delivery. Pharmaceutics 2017, 9, 53. [Google Scholar] [CrossRef] [PubMed]
  43. Notario-Pérez, F.; Martín-Illana, A.; Cazorla-Luna, R.; Ruiz-Caro, R.; Bedoya, L.M.; Tamayo, A.; Rubio, J.; Veiga, M.D. Influence of Chitosan Swelling Behaviour on Controlled Release of Tenofovir from Mucoadhesive Vaginal Systems for Prevention of Sexual Transmission of HIV. Mar. Drugs 2017, 15, 50. [Google Scholar] [CrossRef] [PubMed]
  44. Yurtdaş Kirimlioğlu, G.; Öztürk, A.A. Levocetirizine Dihydrochloride-Loaded Chitosan Nanoparticles: Formulation and In Vitro Evaluation. Turk. J. Pharm. Sci. 2020, 17, 27–35. [Google Scholar] [CrossRef] [PubMed]
Figure 1. 3D-response surface plots for the graphical optimization of CUR/LCSNPs, illustrating the interaction effect of (a) lecithin and chitosan on mean particle size. (b) Speed and chitosan on mean particle size. (c) Speed and lecithin on mean particle size. (d) Lecithin and chitosan on ZP. (e) Speed and chitosan on ZP. (f) Speed and lecithin on ZP. (g) Lecithin and chitosan on EE(%). (h) Speed and chitosan on EE (%). (i) Speed and lecithin on EE (%).
Polymers 14 03758 g001
Figure 2. (a) Particle size distribution and (b) the zeta-potential of optimized CUR/LCSNPs.
Polymers 14 03758 g002
Figure 3. Liner correlation plot (ac) between predicted and actual values and corresponding residual plot (a’c’) for the three responses, i.e., mean particle size (nm), ZP (mV), and EE(%) for the CUR/LCSNPs. The scattered residual plot indicates the spread of the dependent variables under 17 different experimental conditions (run number).
Polymers 14 03758 g003
Figure 4. SEM images of CUR/LCSNPs at different magnifications.
Polymers 14 03758 g004
Figure 5. X-ray diffractograms of pure curcumin, lecithin, chitosan, LCSNPs, and CUR/LCSNPs.
Polymers 14 03758 g005
Figure 6. Cumulative percentage of the drug released from optimized CUR/LCSNPs in comparison to the aqueous suspension of the CUR.
Polymers 14 03758 g006
Figure 7. Physical stability of the optimized formulation of CUR/LCSNPs within 45 days. The difference among groups was analyzed using one-way ANOVA followed by Dunnet’s multiple comparisons to the mean value of day 0 (first column).
Polymers 14 03758 g007
Table 1. Independent and dependent variables in the optimization of CUR/LCSNPs through a Box-Behnken statistical design.
FactorsLevel Used
Low (−1)Medium (0)High (+1)
Independent variables
A = Chitosan (mg)512.520
B = Lecithin (mg)5075100
C = Speed (rpm)90012001500
Dependent variables: Y1 = Particle size (nm), Y2 = Zeta potential (mV), Y3 = Entrapment efficiency (%).
Table 2. CUR/LCSNPs experimental runs and observed responses for all of the seventeen formulations (F1–F17) exploiting the Box-Behnken statistical design.
Independent VariablesDependent Variables
A (mg)B (mg)C (rpm)Y1 (nm)Y2 (mV)Y3 (%)
F112.550900183.74 ± 1.7031.5 ± 1.2575.62 ± 2.60
F212.5751200185.33 ± 3.5029.6 ± 1.1570.04 ± 2.40
F35501200150.63 ± 4.9021.7 ± 2.1069.84 ± 1.50
F420751500218.63 ± 2.7034.8 ± 2.1077.79 ± 2.90
F512.5751200183.15 ± 2.7028.8 ± 1.4070.91 ± 1.60
F620501200221.22 ± 4.2036.8 ± 3.2076.33 ± 2.10
F712.51001500189.40 ± 1.1027.9 ± 2.2078.50 ± 2.10
F8201001200224.01 ± 4.3031.2 ± 12.071.59 ± 2.50
F951001200136.44 ± 1.7018.5 ± 1.4077.34 ± 2.20
F105751500154.10 ± 2.1019.1 ± 1.2077.69 ± 2.70
F11575900162.43 ± 2.5019.7 ± 1.1071.46 ± 2.30
F1212.5751200185.48 ± 4.3028.3 ± 2.4071.53 ± 2.70
F1312.5751200184.32 ± 3.1027.9 ± 2.4071.37 ± 3.0
F1412.5100900193.45 ± 3.5027.1 ± 2.1574.86 ± 2.50
F1512.5501500179.01 ± 1.9031.5 ± 1.9076.37 ± 2.60
F1612.5751200185.66 ± 3.1030.1 ± 1.8071.47 ± 2.30
F172075900267.94 ± 3.7035.1 ± 3.2075.20 ± 2.90
Table 3. Best-fitted model for all three dependent responses (particle size, zeta potential, and entrapment efficiency of CUR/LCSNPs).
ResponseModelR-Squared (r2)Adjusted r2Predicted r2Std. Dev.%CVAdequate Precision Remarks
Particle size (nm)Linear0.95130.94010.90106.86---
Second order (2FI)0.92060.87300.611111.19---
Quadratic0.99840.98340.93894.572.4447.4997Suggested
Zeta potential (mV)Linear0.94810.93600.90281.41---
Second order (2FI)0.95130.92200.79811.55---
Quadratic0.98960.97620.94110.863.0428.75Suggested
%EELinear0.87780.82290.63383.08---
Second order (2FI)0.86430.84290.65802.83---
Quadratic0.98370.96700.93780.881.1914.20Suggested
Table 4. ANOVA test for the dependent variables (particle size, zeta potential, and entrapment efficiency of CUR/LCSNPs).
SourceSum of SquareDegree of FreedomMean SquareF valuep-ValueRemarks
Y1 (nm)
Model-Quadratic15,323.9591702.6626.810.0001significant
A-Chitosan13,464.08113,464.08211.99<0.0001
B-Lecithin9.4319.430.14850.7114
C-Speed551.621551.628.690.0215
AB71.99171.991.130.3224
AC419.861419.866.610.0369
BC0.114610.11460.00180.9673
A2168.611168.612.650.1473
B2272.471272.474.290.0771
C2392.631392.636.180.0418
Lack of fit440.163146.721.4680.7217Not significant
Pure error4.4341.11
Total correlation 15,768.5416
Y2 (mV)
Model-Quadratic489.50954.3973.82<0.0001significant
A-Chitosan433.651433.65588.56<0.0001
B-Lecithin35.28135.2847.880.0002
C-Speed0.001210.00120.00170.9683
AB1.4411.441.950.2048
AC0.022510.02250.03050.8662
BC0.160010.16000.21720.6554
A218.65118.6525.310.0015
B20.204710.20470.27780.6144
C20.502610.50260.68220.4361
Lack of fit1.8030.60080.71630.5918not significant
Pure error3.3640.8388
Total correlation 494.6616
Y3 (%EE)
Model-Quadratic144.09916.0120.640.0003significant
A-Chitosan2.6112.613.370.1090
B-Lecithin2.1112.112.720.1429
C-Speed21.86121.8628.180.0011
AB37.45137.4548.300.0002
AC3.3013.304.260.0780
BC2.0912.092.690.1448
A23.8513.854.960.0612
B213.00113.0016.760.0046
C252.13152.1367.22<0.0001
Lack of fit3.8931.303.370.1358not significant
Pure error1.5440.3850
Total correlation 149.5216
Table 5. Predicted and observed response of CUR/LCSNPs with maximum desirability suggested by the Box-Behnken statistical design.
ResponsePredicted ValueObserved ValuePrediction Error (%)
= O b s e r v e d P r e d i c t e d P r e d i c t e d × 100
Particle size141.40138.4 ± 2.10−2.09%
Zeta potential+18.19+18.98 ± 0.724.36%
%EE76.7877.40 ± 1.700.79%
Table 6. Kinetic modeling of CUR release from the optimized CUR/LCSNPs.
FormulationZero-OrderFirst-OrderHiguchi ModelHixon–CrowellKorsmeyer–Peppas Model
R2R2R2R2R2n
Optimized CUR/LCSNPs0.79180.97940.98760.97470.99370.343
Aqueous suspension of CUR0.88120.97860.98750.98330.92450.519
Table 7. Physical stability of the optimized formulation of CUR/LCSNPs within 45 days.
Periods
Parameter (Mean ± SD, n = 3)0 Days7 Days15 Days45 Days
Particle size (nm)138.43 ± 2.09138.97 ± 2.05139.56 ± 1.55140.54 ± 0.92
PDI0.172 ± 0.0310.175 ± 0.0290.182 ± 0.0240.188 ± 0.025
Zeta potential (mV)+18.98 ± 0.7218.46 ± 0.5318.63 ± 0.6817.93 ± 0.66
%drug content99.19 ± 1.7199.01 ± 1.7798.97 ± 1.8898.95 ± 1.92
Publisher’s Note: MDPI stays neutral with regard to jurisdictional claims in published maps and institutional affiliations.

