
Micronized Recycle Rubber Particles Modified Multifunctional Polymer Composites: Application to Ultrasonic Materials Engineering

 and
and
Abstract
:1. Introduction
2. Materials and Methods
2.1. Materials
2.1.1. Raw Materials
2.1.2. Composite Material Samples
2.1.3. Equipment Used
2.2. Experimental Methods
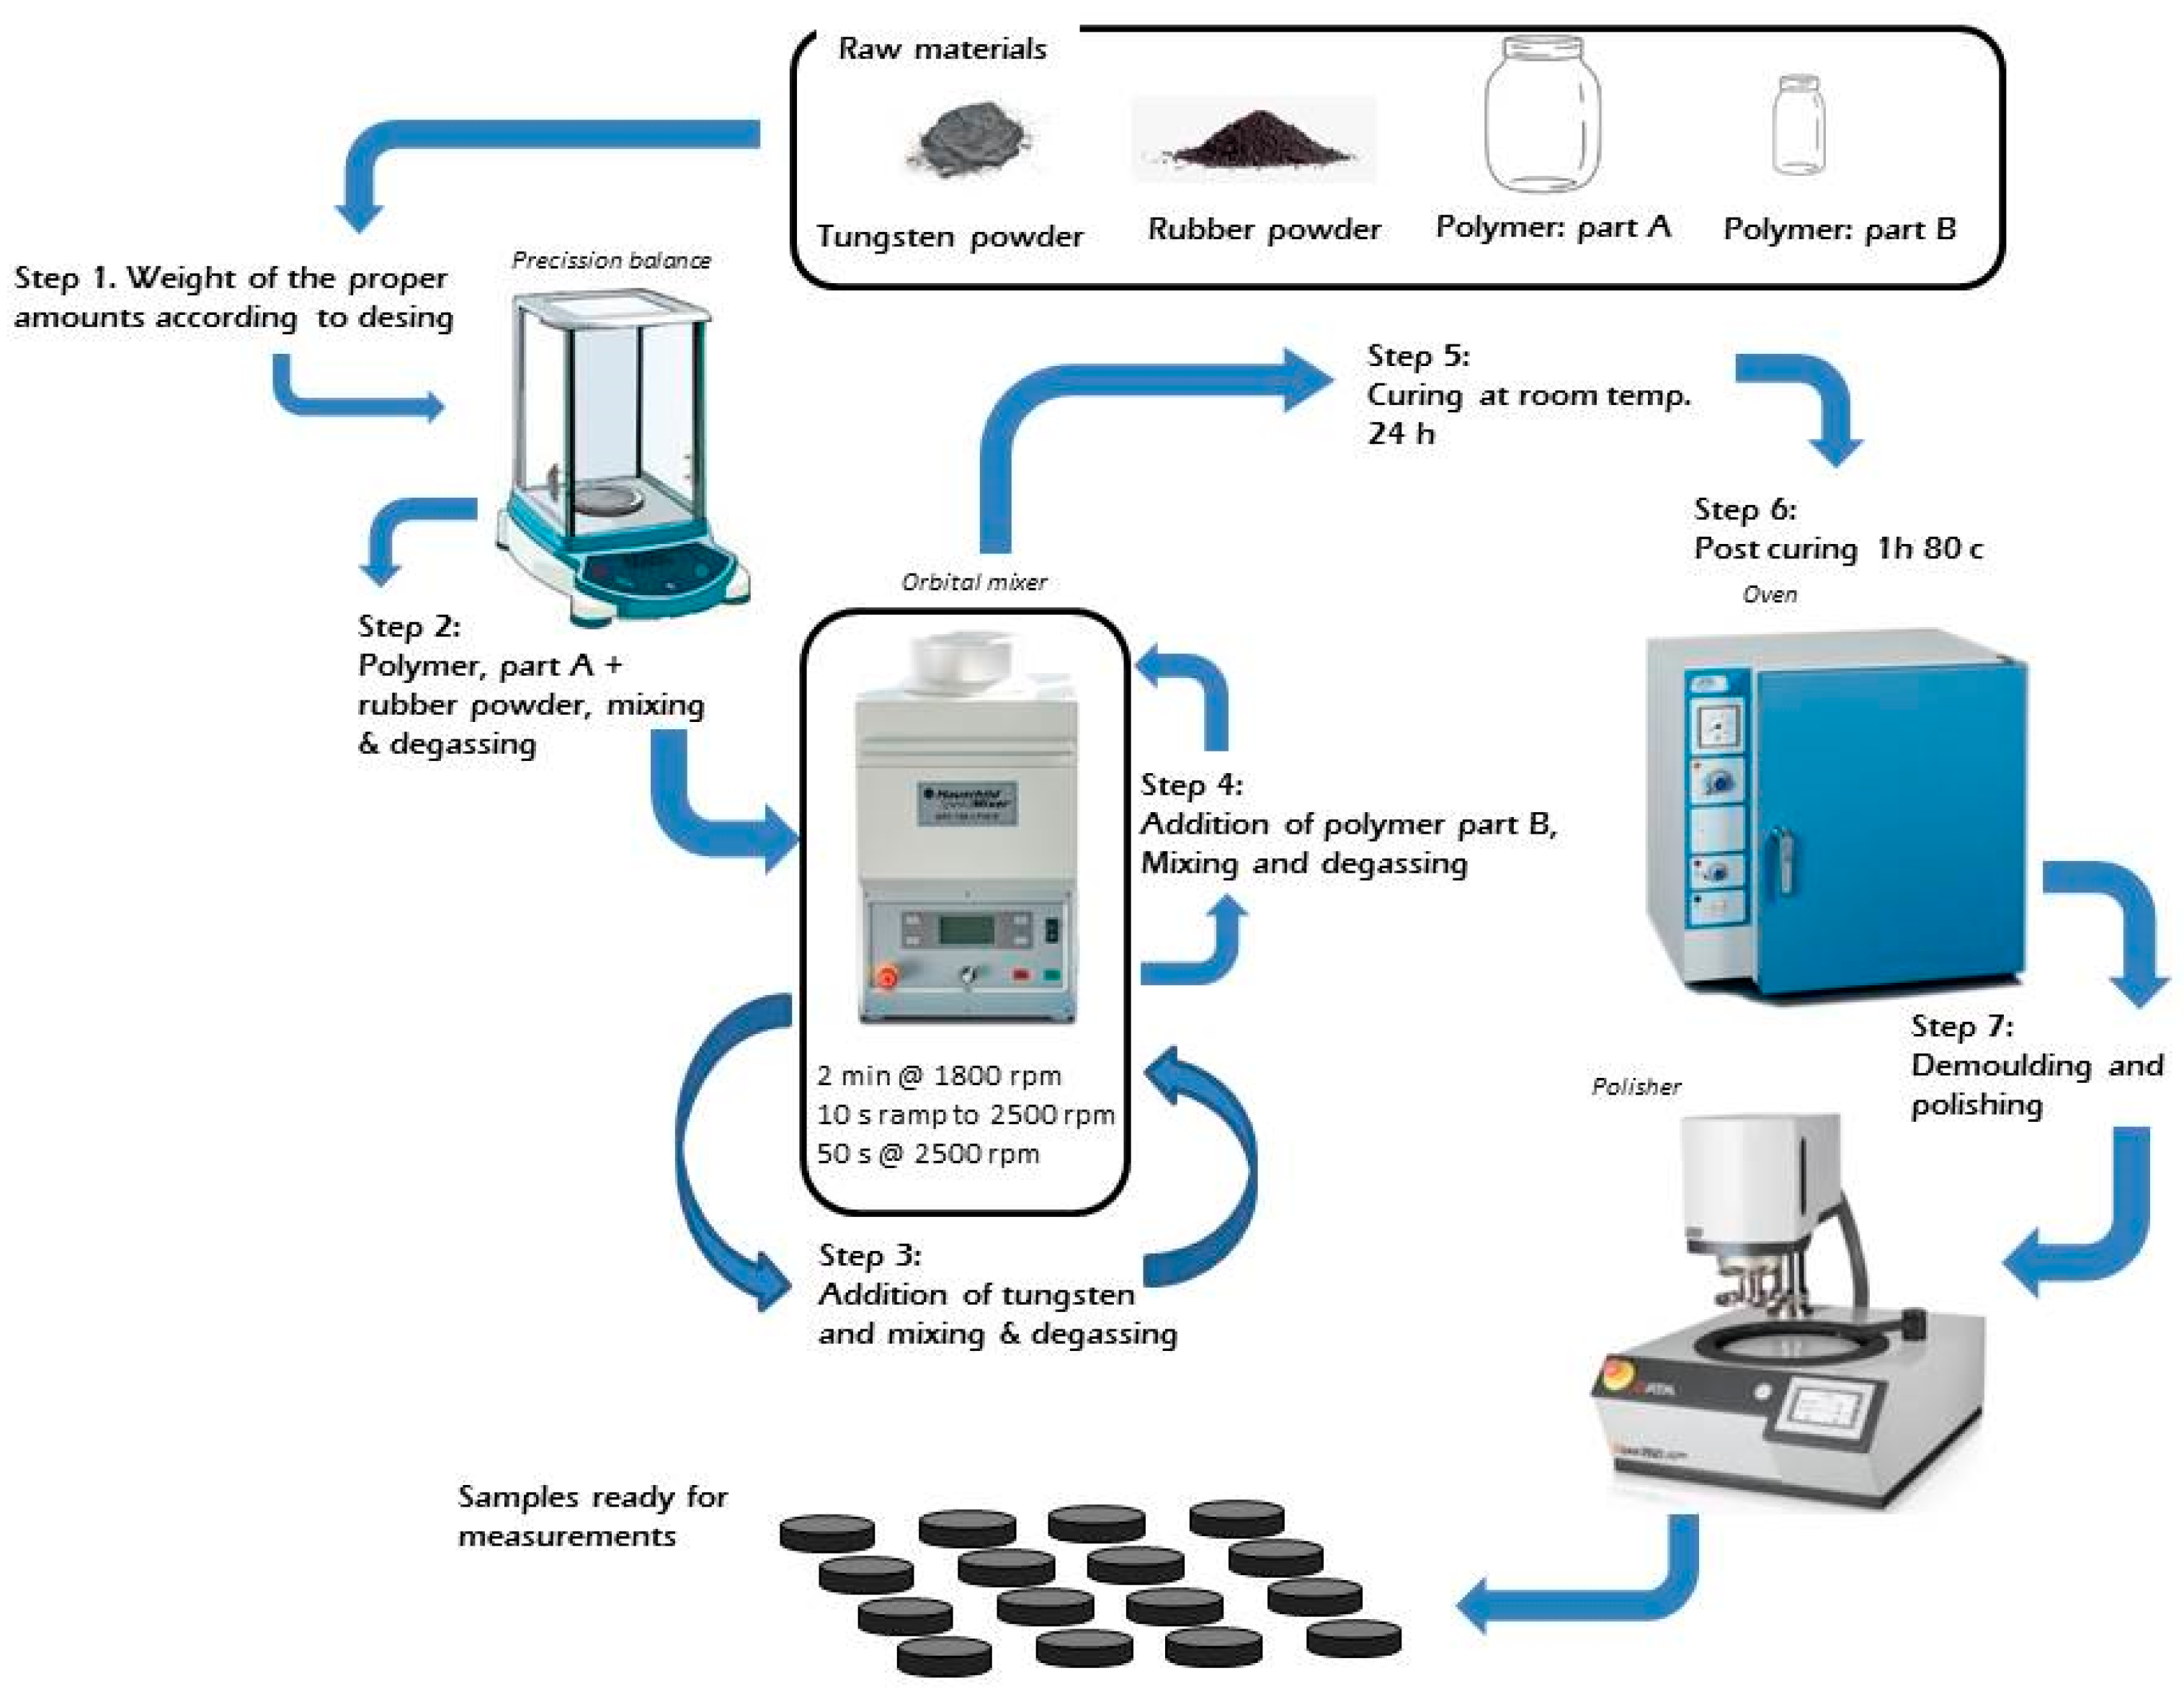
2.2.1. Fabrication of Composite Samples
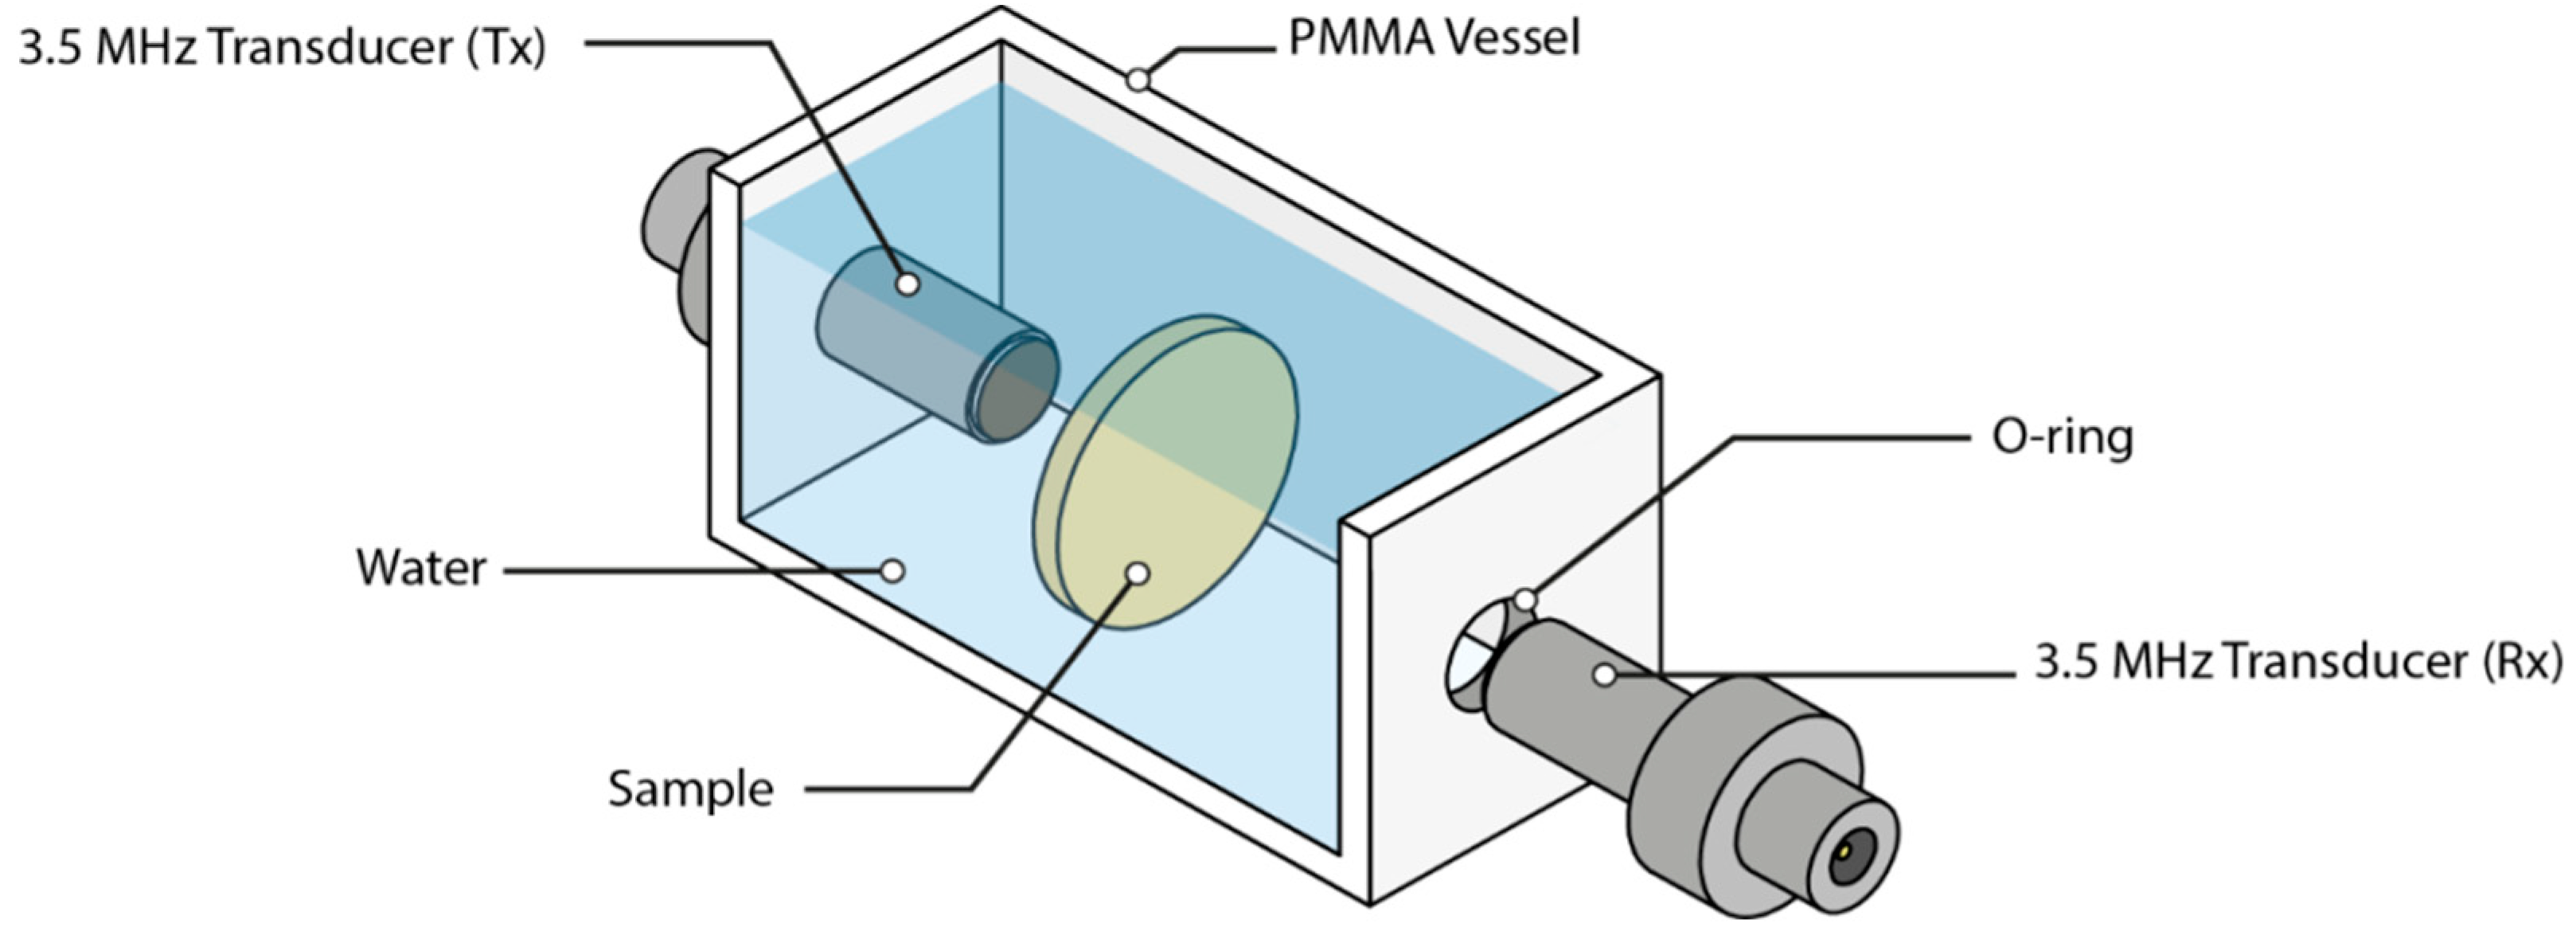
2.2.2. Ultrasonic Measurements
2.2.3. Other Measurements
2.3. Theoretical Methods: Moelling Composite Properties
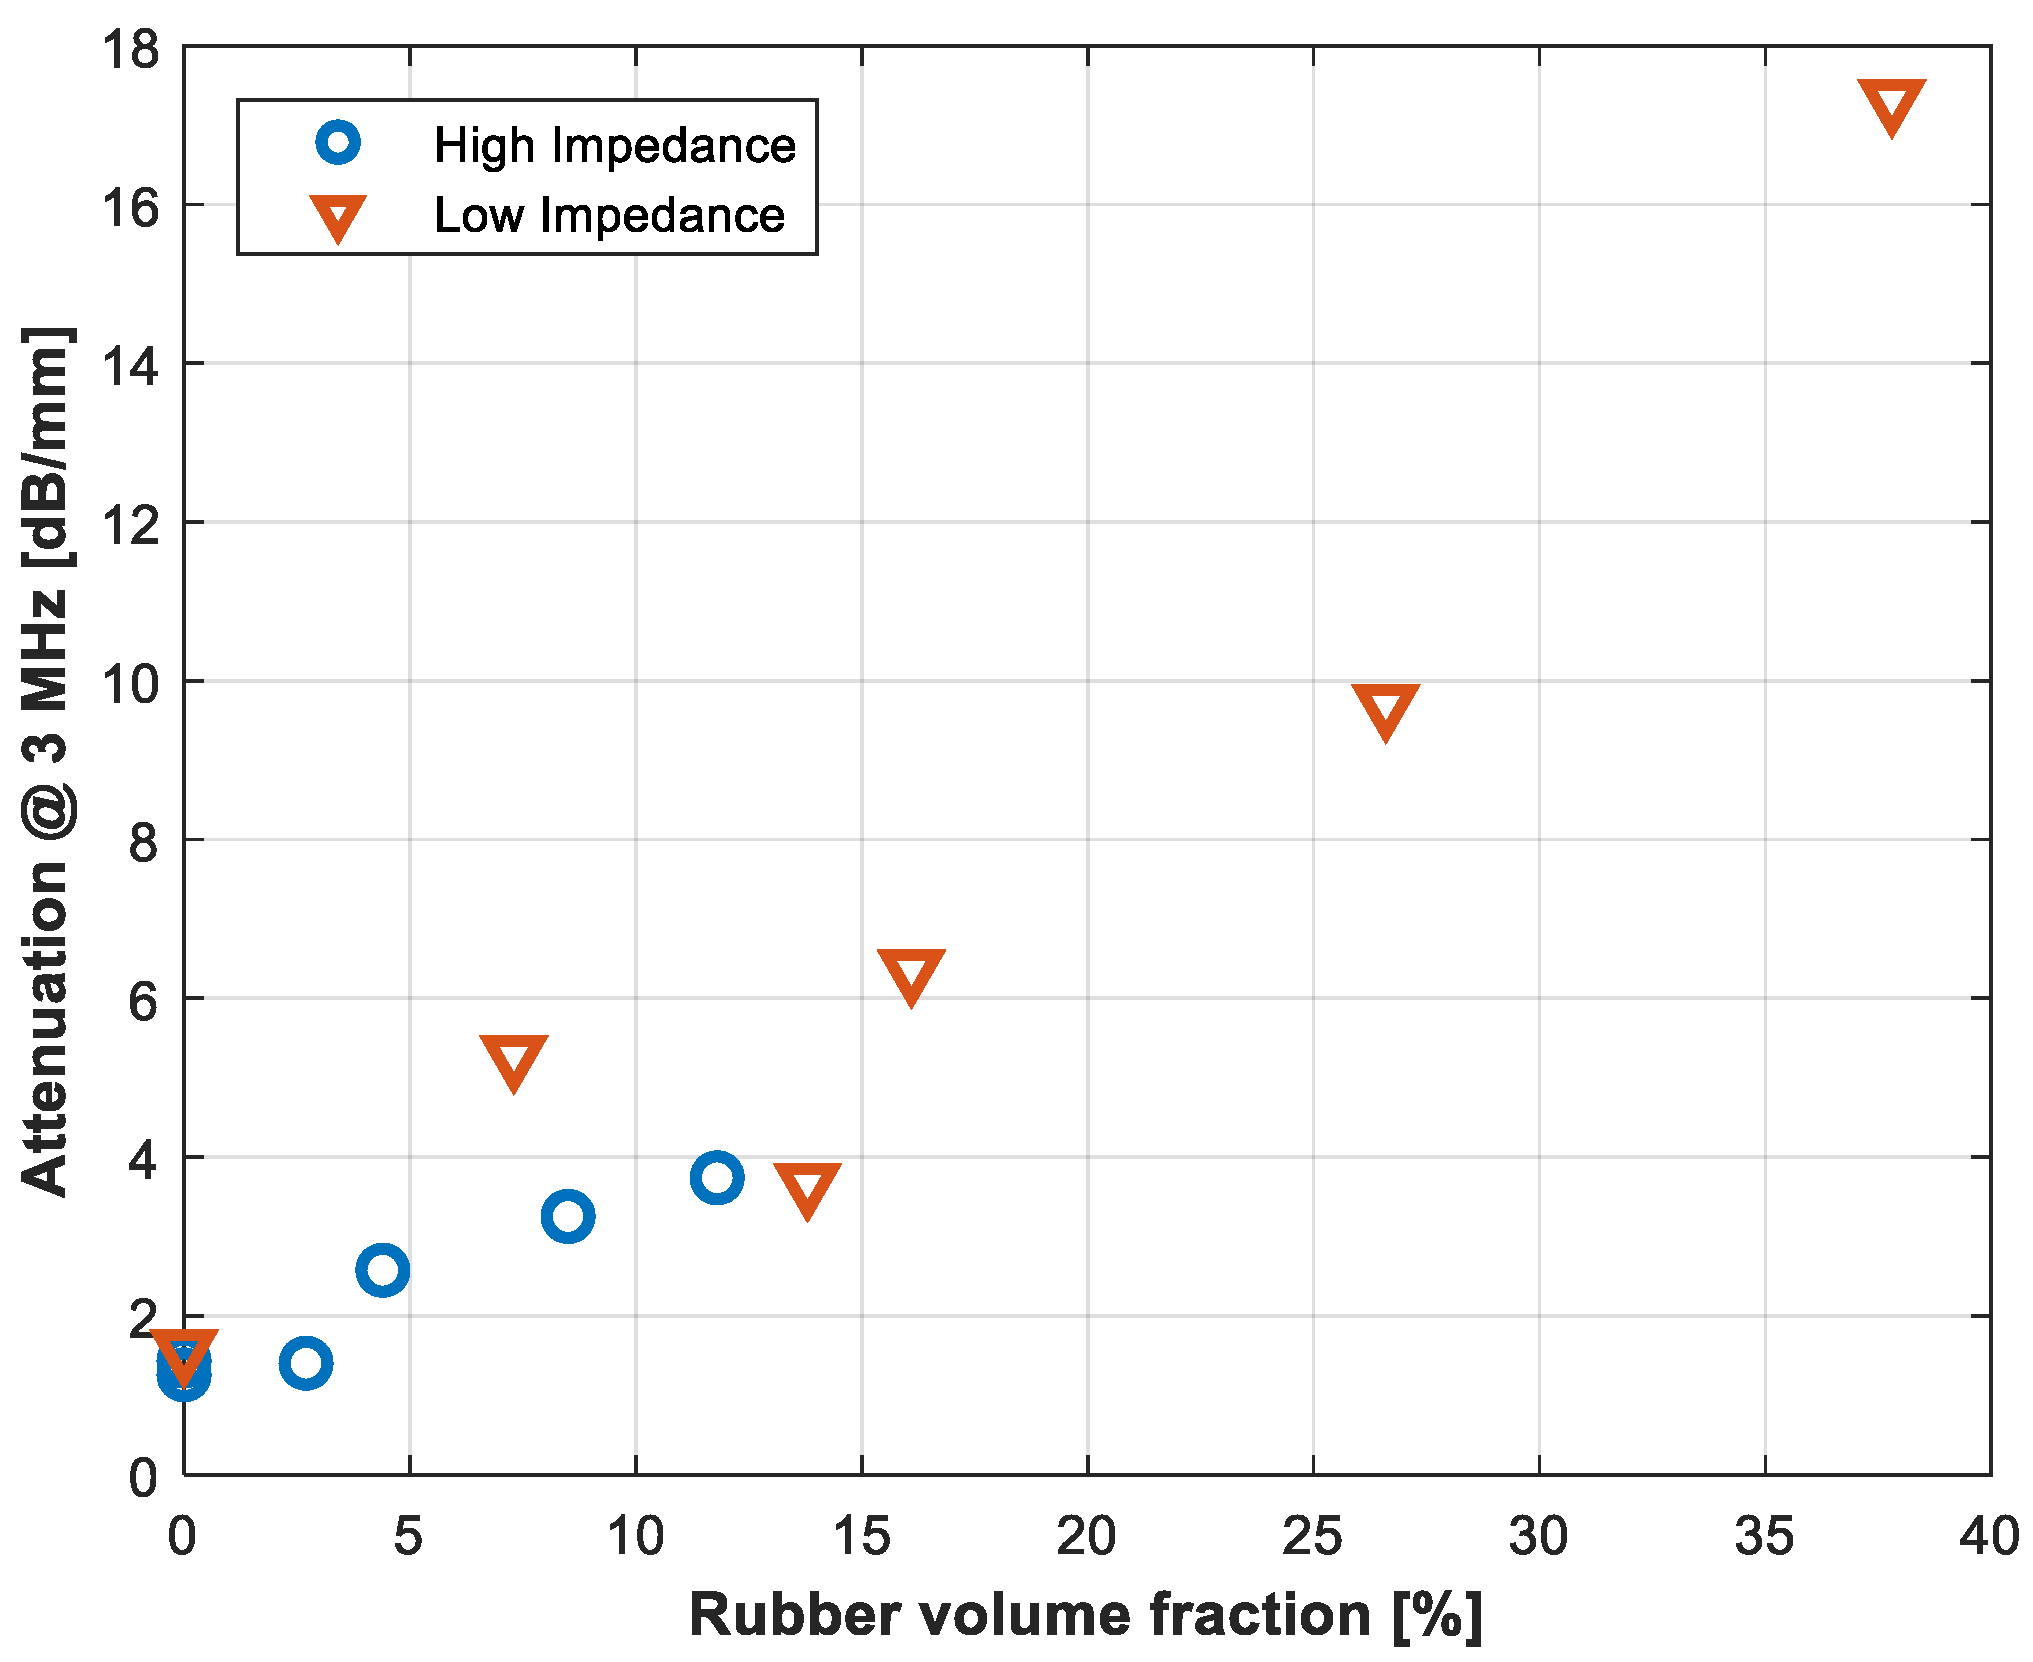
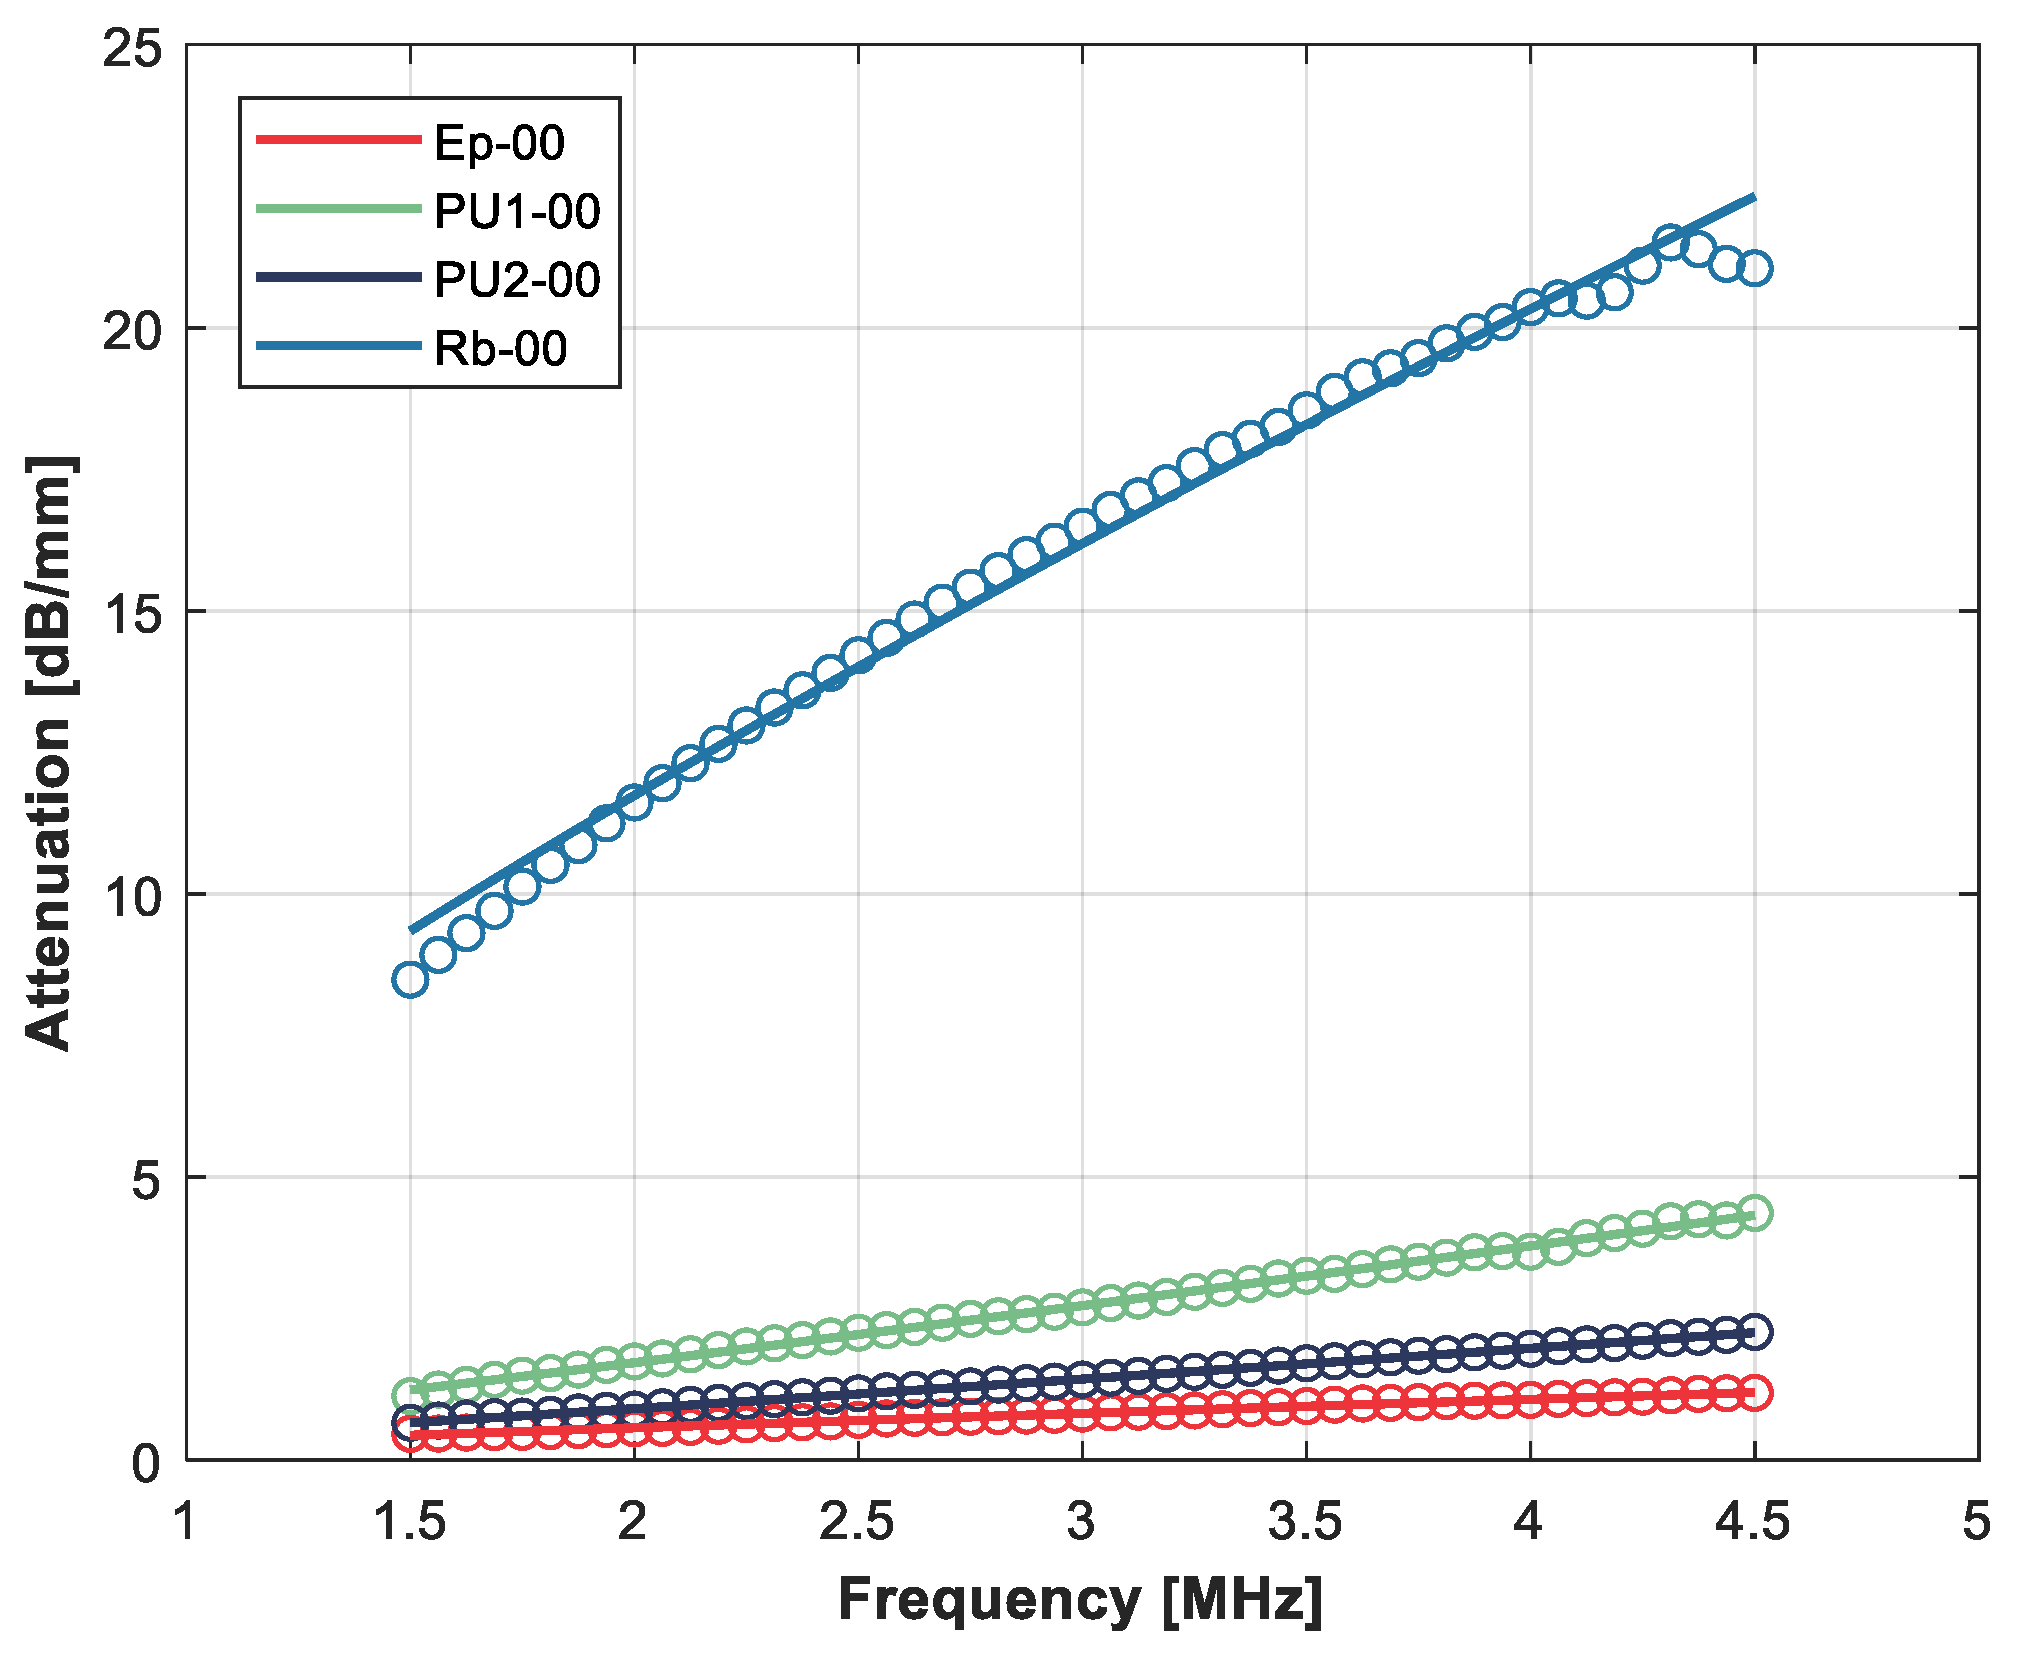
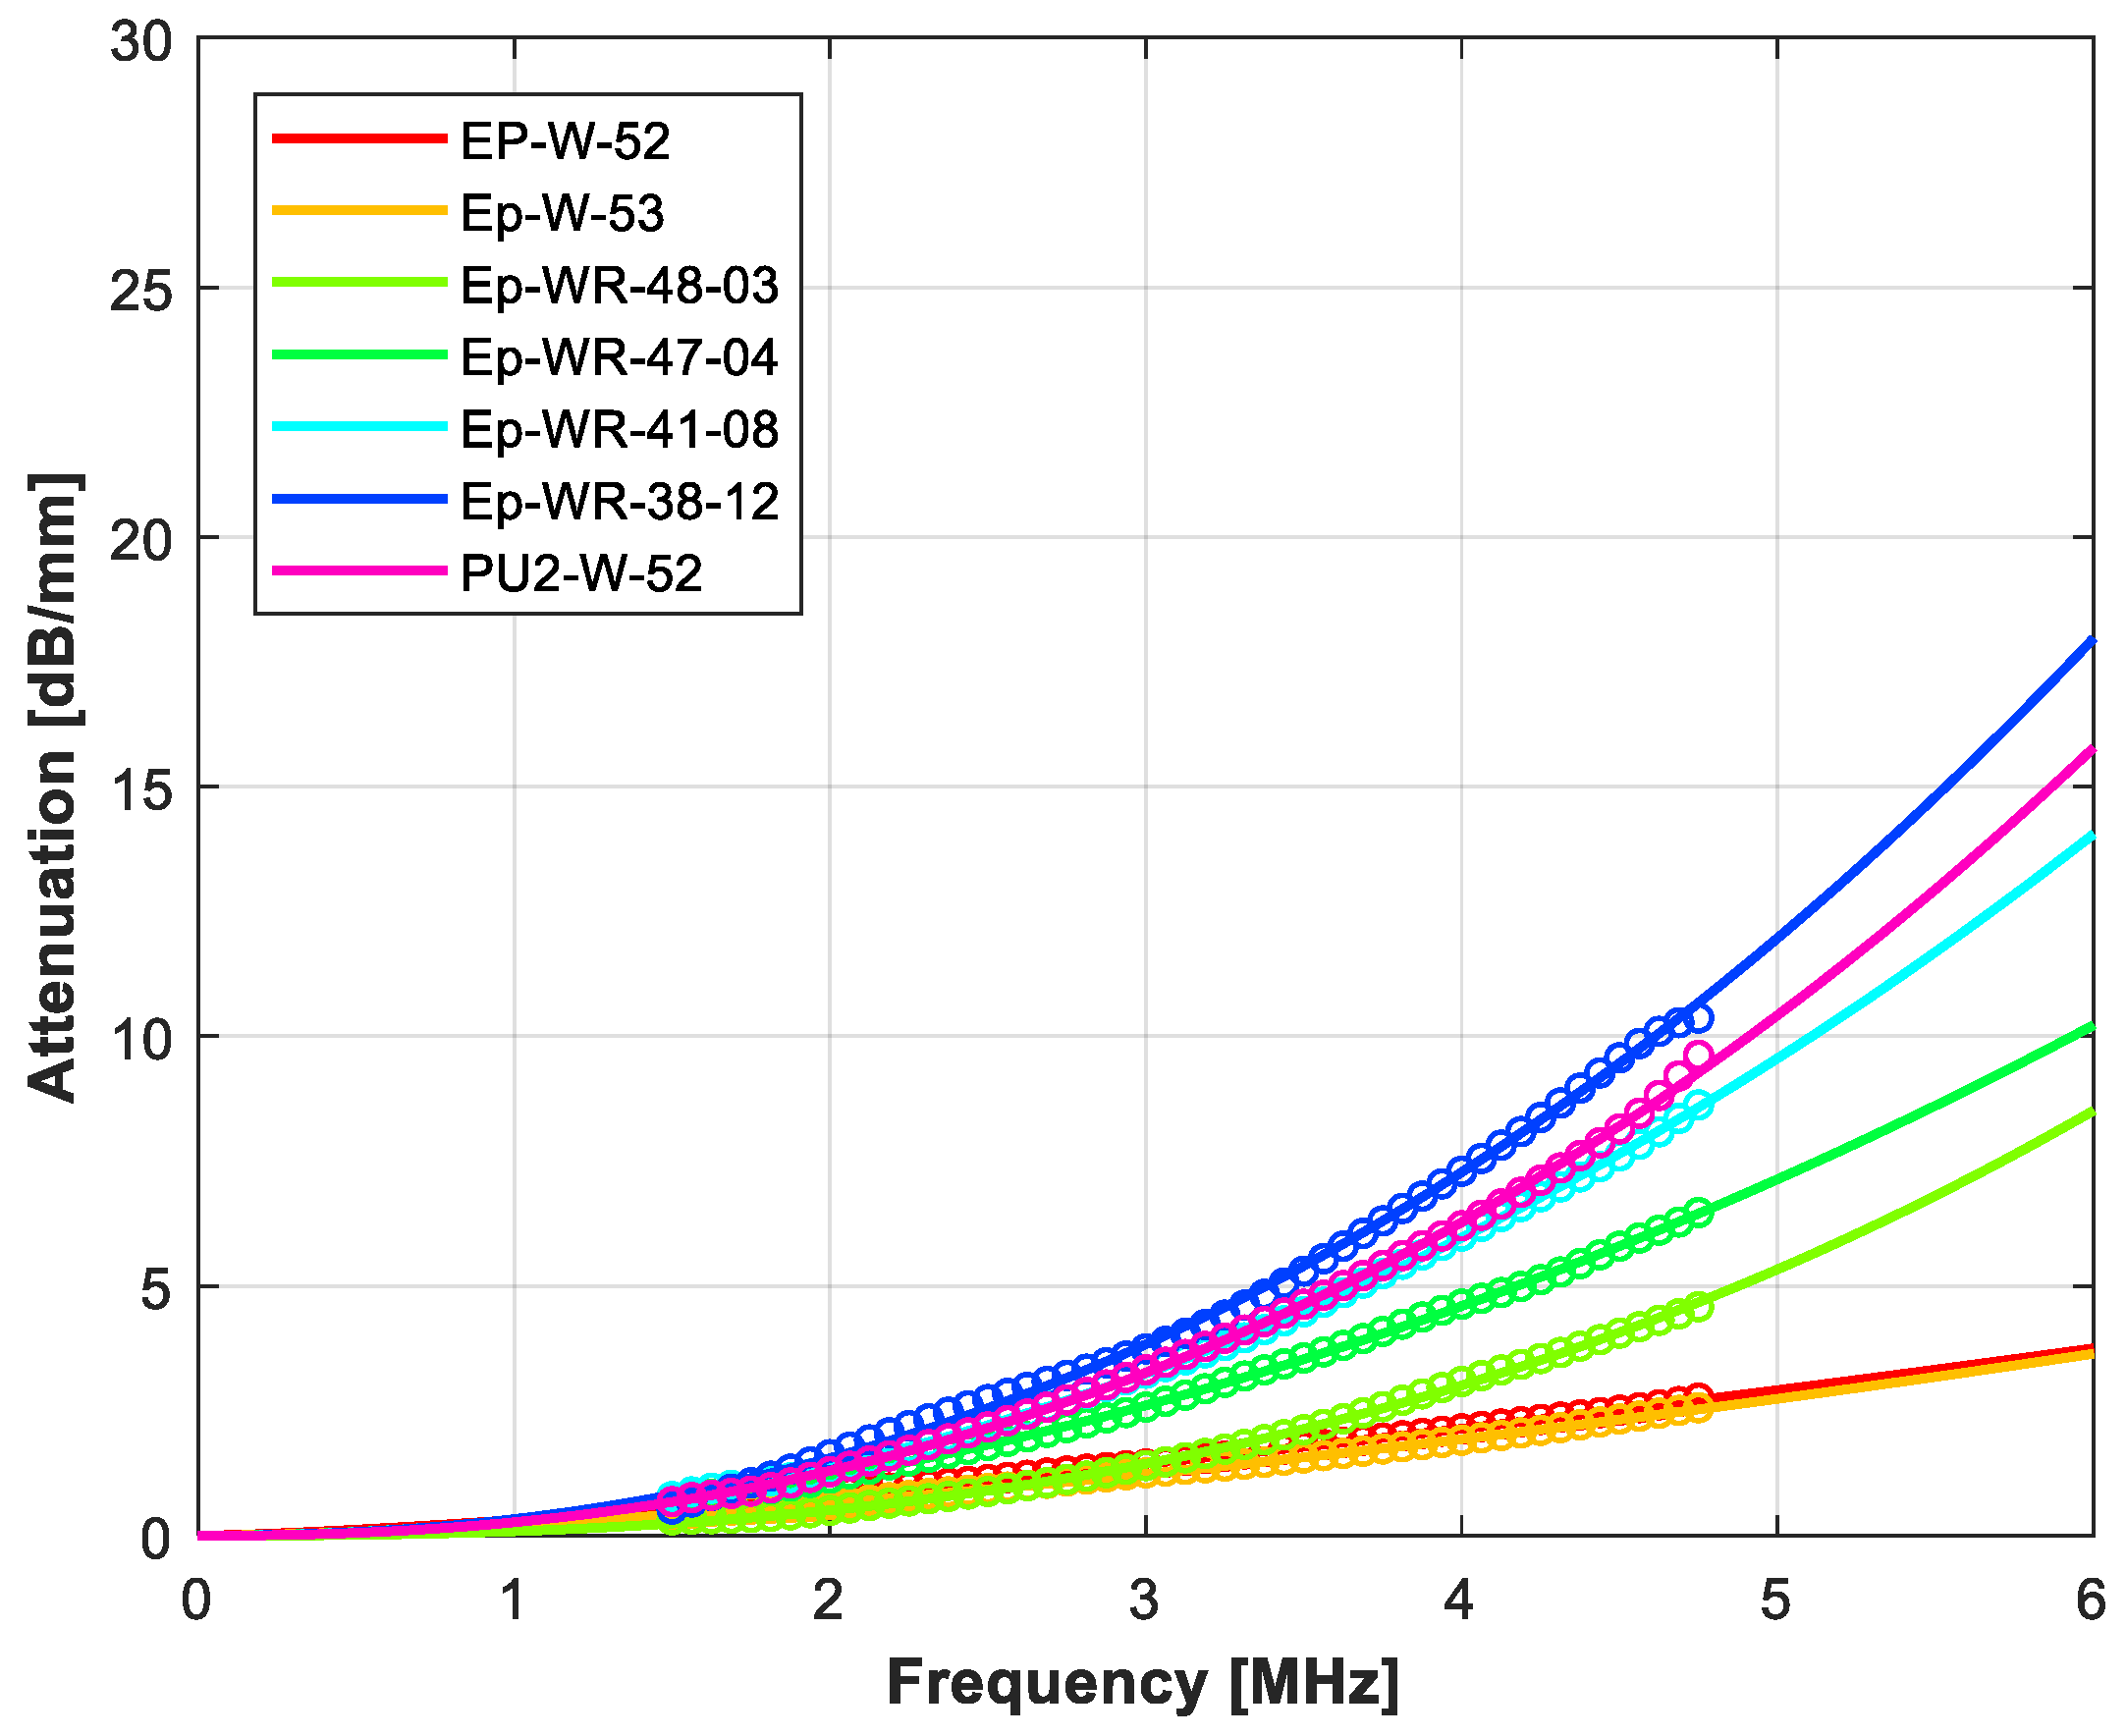
3. Results
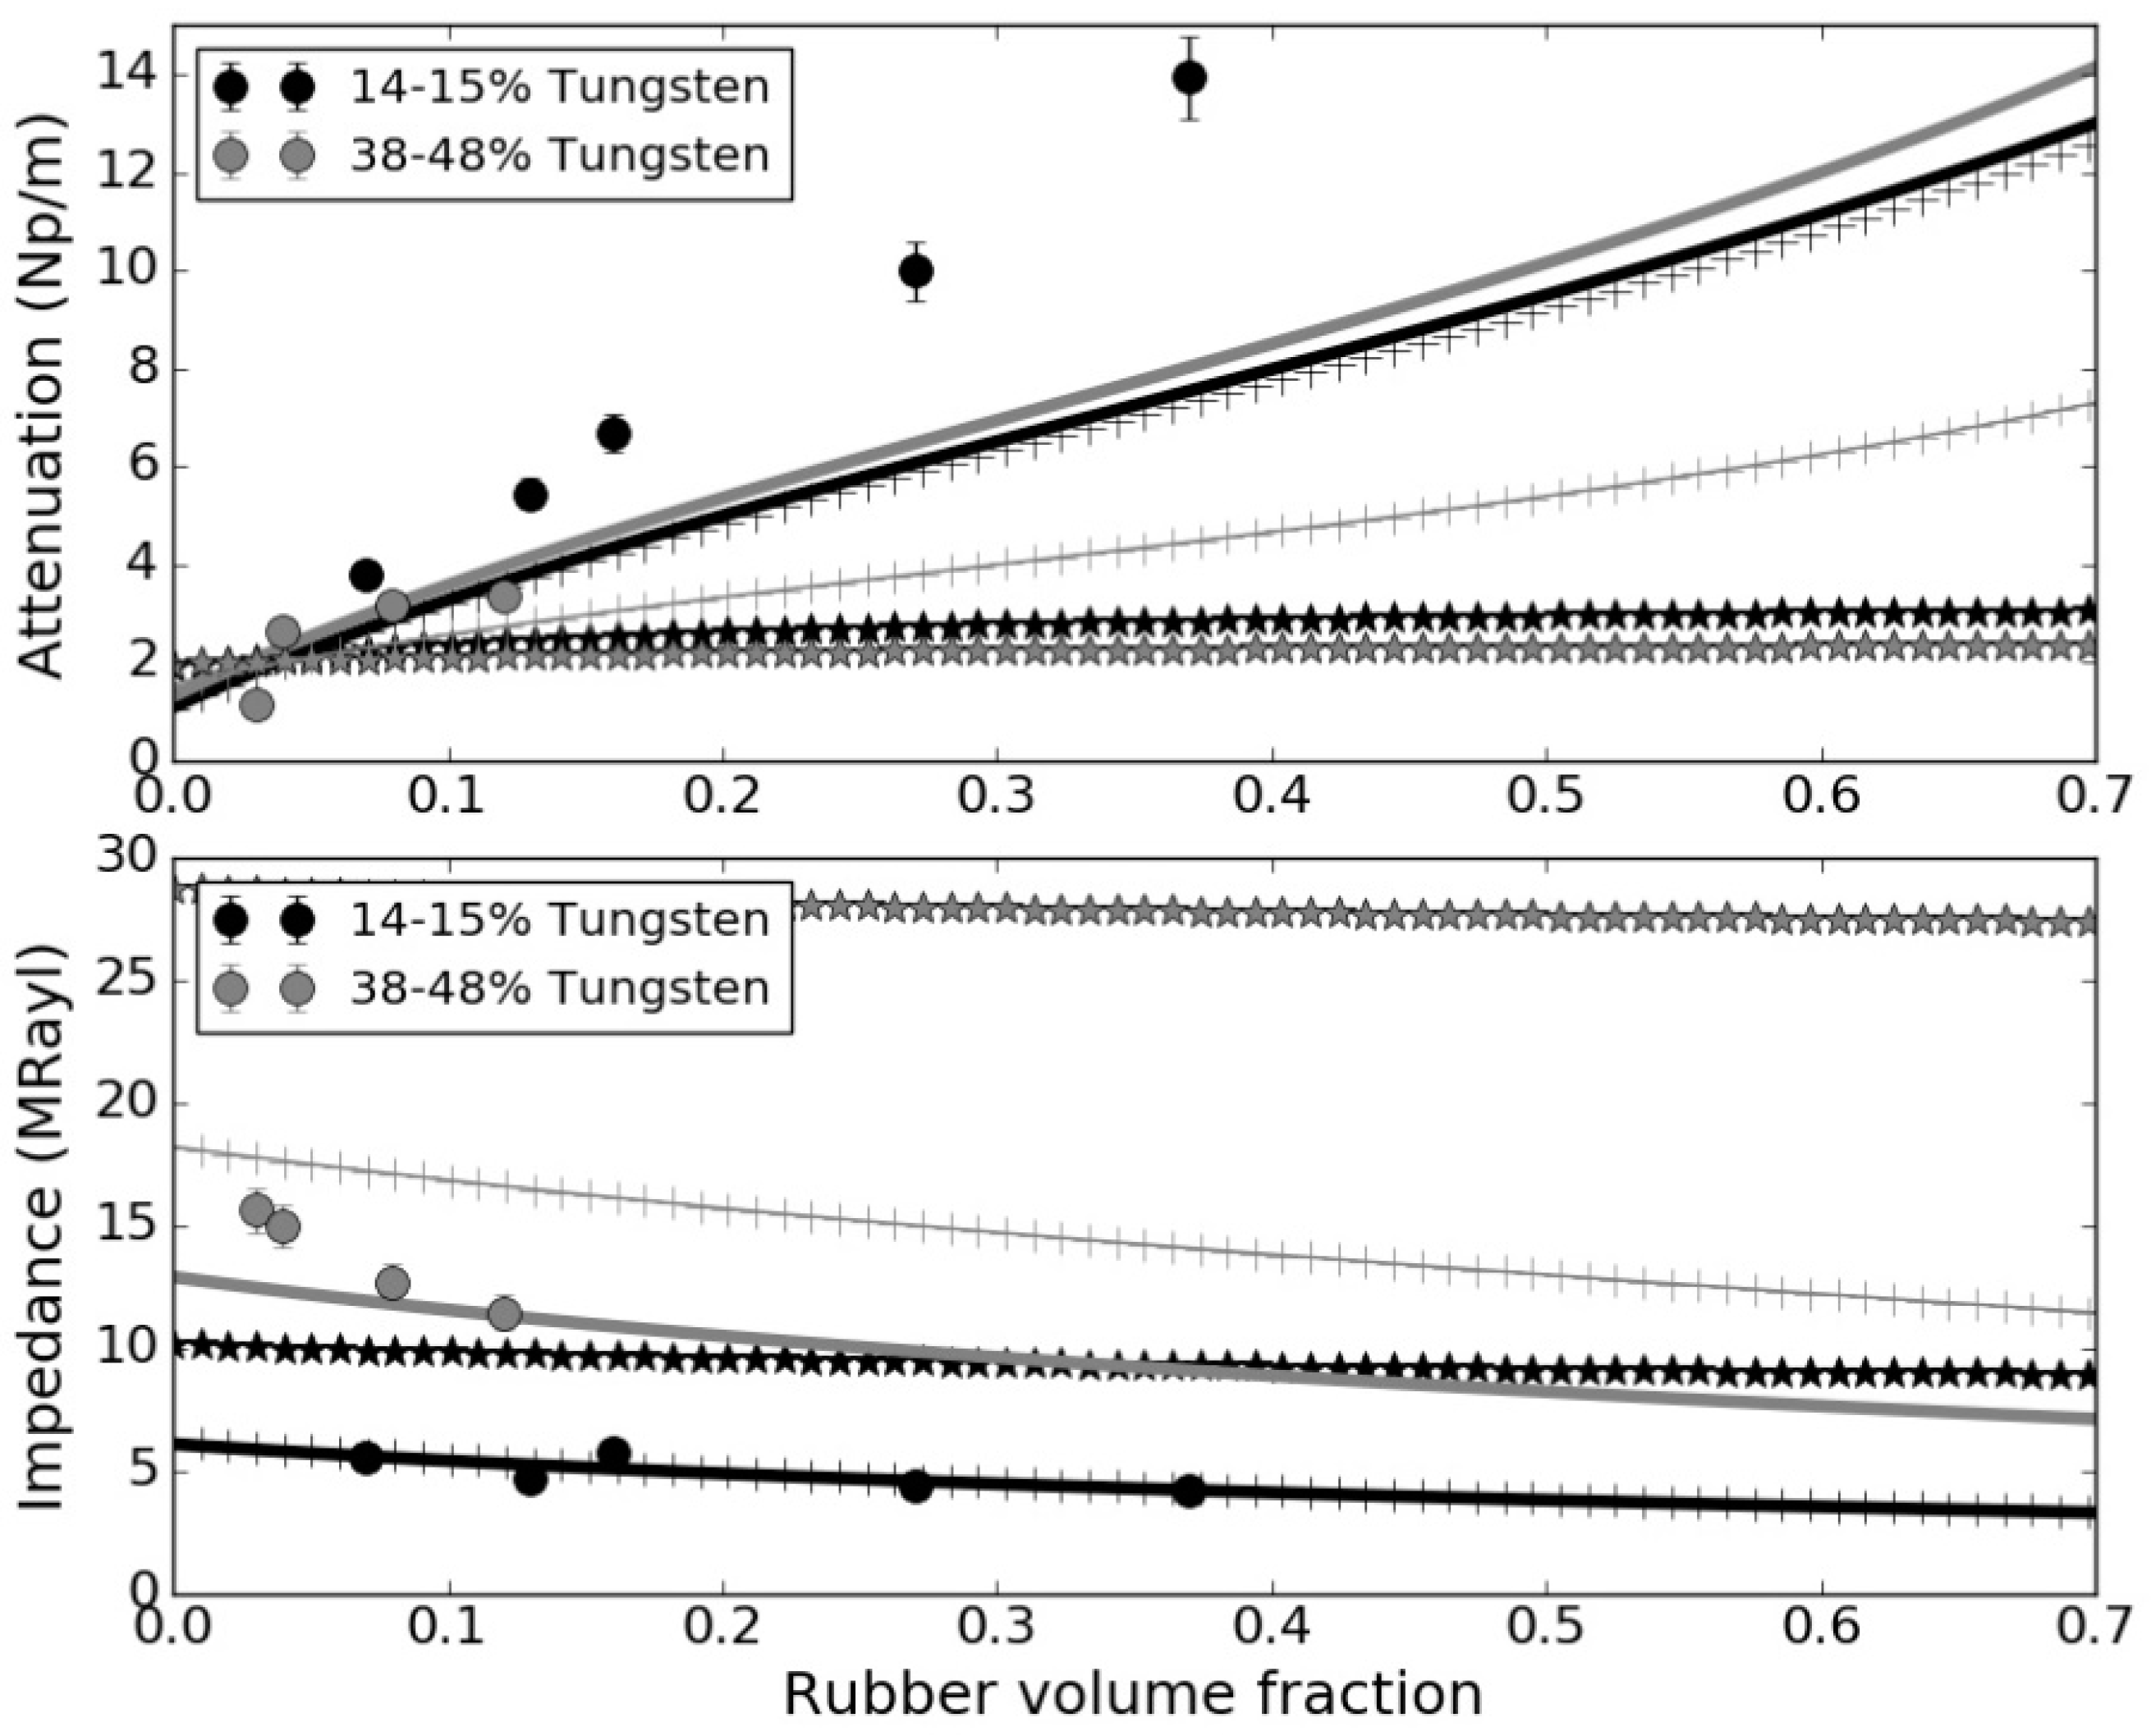
4. Discussion

| Reference | Attenuation Coeff @ 3 MHz (dB/mm) | Acoustic Impedance (MRayl) |
|---|---|---|
| Lutsch [27] | 2.4 | ~8 |
| Tiefensee et al. [36] | 5 | 4-7 |
| State et al. [37] | 13–15 7.1 | 2.6–3.3 |
| Cho et al. [40] | 3–5 | 4–5 |
| Nguyen et al. [42] | 10 | 8.7 |
| 1.8 | 11.7 | |
| Abas et al. [32] | 1 | 7 |
| Nguyen et al. [46] | 9 | 8.7 |
| El-Tantawy &. Sung [41] | 2.2–3.9 | 2–7.8 |
| Wang et al. [48] | ~5.0 | 3–5.5 |
| This work | ||
| Rubber + epoxy | 0.96–2.35 | 2.3–2.9 |
| Tungsten + epoxy | 1.4–1.5 | 6.8–18.5 |
| Tungsten + polyurethane | 4–27 | 6.9–10.5 |
| Rubber + Tungsten (low) + epoxy | 4–14 | 4–5 |
| Rubber + Tungsten (high) + epoxy | 1.2–3.4 | 12–16 |
5. Conclusions
6. Patents
Author Contributions
Funding
Data Availability Statement
Conflicts of Interest
References
- Rothon, B. (Ed.) Fillers for Polymer Applications; Springer: Berlin/Heidelberg, Germany, 2017; ISBN 978-3-319-28116-2. [Google Scholar]
- Bagheri, R.; Marouf, B.T.; Pearson, R.A. Rubber-toughened epoxies: A critical review. Polym. Rev. 2009, 49, 201–225. [Google Scholar] [CrossRef]
- Kargarzadeh, H.; Ahmad, I.; Abdullah, I. Chapter 10: Mechanical Properties of Epoxy-Rubber Blends. In Handbook of Epoxy Blends; Springer International Publishing: Cham, Switzerland, 2015. [Google Scholar]
- Ismail, H.; Omar, N.F.; Othman, N. Effect of carbon black loading on curing characteristics and mechanical properties of waste tyre dust/carbon black hybrid filler filled natural rubber compounds. J. Appl. Polym. Sci. 2011, 121, 1143–1150. [Google Scholar] [CrossRef]
- Colom, X.; Carrillo, F.; Cañavate, J. Composites reinforced with reused tyres: Surface oxidant treatment to improve the interfacial compatibility. Compos. Part A Appl. Sci. Manufac. 2007, 38, 44–50. [Google Scholar] [CrossRef]
- Valášek, P. Mechanical Properties of Epoxy Resins Filled with Waste Rubber. Manuf. Technol. 2014, 14, 632–637. [Google Scholar] [CrossRef]
- Ramarad, S.; Khalid, M.; Ratnam, C.T.; Chua, A.I.; Rashmi, W. Waste tire rubber in polymer blends: A review on the evolution, properties and future. Prog. Mater. Sci. 2015, 72, 100–140. [Google Scholar] [CrossRef]
- Woldemariam, M.H.; Belingardi, G.; Koricho, E.G.; Reda, D.T. Effects of nanomaterials and particles on mechanical properties and fracture toughness of composite materials: A short review. AIMS Mater. Sci. 2019, 6, 1191–1212. [Google Scholar] [CrossRef]
- Móczó, J.; Pukánszky, B. Particulate Fillers in Thermoplastics. In Encyclopedia of Polymers and Composites; Palsule, S., Ed.; Springer: Berlin/Heidelberg, Germany, 2015. [Google Scholar]
- Lakes, R.S. High damping composite materials: Effect of structural hierarchy. J. Compos. Mater. 2002, 36, 287–297. [Google Scholar] [CrossRef]
- Sankaran, S.; Deshmukh, K.; Ahamed, M.B.; Khadheer Pasha, S.K. Recent advances in electromagnetic interference shielding properties of metal and carbon filler reinforced flexible polymer composites: A review. Compos. Part A Appl. Sci. Manufact. 2018, 114, 49–71. [Google Scholar] [CrossRef]
- Quesenberry, M.J.; Madison, P.H.; Jensen, R.E. Characterization of Low Density Glass Filled Epoxies, Army Research Laboratory, March 2003, ATRL-TR-2938. Available online: https://apps.dtic.mil/sti/pdfs/ADA412137.pdf (accessed on 26 August 2022).
- Valentín, J.L.; Pérez-Aparicio, R.; Fernandez-Torres, A.; Posadas, P.; Herrero, R.; Salamanca, F.M.; Navarro, R.; Saiz-Rodríguez, L. Advanced Characterization of Recycled Rubber from End-of-life Tires. Rubber Chem. Technol. 2020, 93, 683–703. [Google Scholar] [CrossRef]
- Valentín, J.L.; Saiz-Rodríguez, L.; Pérez-Aparicio, R. Guía para el empleo de caucho reciclado procedente del neumático en la industria del caucho. Rev. De Plaásticos Mod. 2021, 122, 4. [Google Scholar]
- Newnham, R.E.; Skinner, D.P.; Cross, L.E. Connectivity and piezoelectric-pyroelectric composites. Mat. Res. Bull. 1978, 13, 525–536. [Google Scholar] [CrossRef]
- Levassort, F.; Lethiecq, M.; Desmare, R. Effective electroelastic moduli of 3-3(0-3) piezocomposites. IEEE Trans. Ultrason. Ferroelectr. Freq. Control 1999, 46, 1028–1034. [Google Scholar] [CrossRef] [PubMed]
- Gómez Alvarez-Arenas, T.E.; Mulholland, A.J.; Hayward, G.; Gomatam, J. Wave propagation in 0-3/3-3 connectivity composites with complex microstructure. Ultrasonics 2000, 38, 897–907. [Google Scholar] [CrossRef]
- Newnham, R.E.; Bowen, L.J.; Klicker, K.A.; Cross, L.E. Composite piezoelectric transducers. Mater. Des. 1980, 2, 93–106. [Google Scholar] [CrossRef]
- Haifeng Wang, K.S.; Ritter, T.; Cao, W. High frequency properties of passive materials for ultrasonic transducers. IEEE Trans. Ultrason. Freq. Control 2001, 48, 78–84. [Google Scholar] [CrossRef]
- Banno, H.; Saito, S. Piezoelectric and dielectric properties of composites of synthetic rubber and PbTiO or PZT. Jpn. J. Appl. Phys. 1983, 22, 67–69. [Google Scholar] [CrossRef]
- Gururaja, T.R.; Xu, Q.C.; Ramachandran, A.R.; Halliyal, A.; Newnham, R.E. Preparation and piezoelectric properties of fired 0–3 composites. In Proceedings of the IEEE 1986 Ultrasonics Symposium, Williamsburg, VA, USA, 17–19 November 1986; pp. 703–706. [Google Scholar] [CrossRef]
- Levassort, F.; Lethiecq, M.; Certon, D.; Patat, F. A matrix method for modelling electroelastic moduli of 0–3 piezo-composites. IEEE Trans. Ultrason. Ferroelect. Freq. Control 1997, 44, 445–452. [Google Scholar] [CrossRef]
- Gómez Álvarez-Arenas, T.E.; Montero, F.; Levassort, F.; Lethieq, M.; James, A.; Ringgard, E.; Millar, C.E.; Hawkins, P. Ceramic powder–polymer piezocomposites for electroacoustic transduction: Modeling and design. Ultrasonics 1998, 36, 907–923. [Google Scholar] [CrossRef]
- Lau, S.; Li, X.; Zhang, X.; Zhou, Q.; Shung, K.K.; Ji, H.; Ren, W. High frequency ultrasonic transducer with KNN/BNT 0–3 composite active element. In Proceedings of the 2010 IEEE International Ultrasonics Symposium, San Diego, CA, USA, 11–14 October 2010; pp. 76–79. [Google Scholar] [CrossRef]
- Hanner, K.A.; Safari, A.; Newnham, R.E.; Runt, J. Thin-film 0–3 polymer piezo- electric ceramic composites-piezoelectric paints. Ferroelectrics 1989, 100, 255–260. [Google Scholar] [CrossRef]
- Wang, F.; Wang, H.; Song, Y.; Sun, H. High piezoelectricity 0–3 cement-based piezoelectric composites. Mater. Lett. 2012, 76, 208–210. [Google Scholar] [CrossRef]
- Lutsch, A. Solid Mixtures with Specified Impedances and High Attenuation for Ultrasonic Waves. J. Acoust. Soc. Am. 1962, 34, 131–132. [Google Scholar] [CrossRef]
- Lees, S.; Gilmore, R.S.; Kranz, P.R. Acoustic Properties of Tungsten-Vinyl Composites. IEEE Trans. Sonics Ultrason. 1973, 20, 1–10. [Google Scholar] [CrossRef]
- Ju-Zhen, W. Backing Material for the Ultrasonic Transducer. USA Patent 4800316, 24 June 1989. [Google Scholar]
- Sayers, C.M.; Tait, C.E. Ultrasonic properties of transducer backings. Ultrasonics 1984, 22, 57–60. [Google Scholar] [CrossRef]
- Grewe, M.G.; Gururaja, T.R.; Shrout, T.R.; Newnham, R.E. Acoustic properties of particle/polymer composites for ultrasonic transducer backing applications. IEEE Trans. Ultrason. Ferroelect. Freq. Control 1990, 37, 506–514. [Google Scholar] [CrossRef] [PubMed]
- Abas, A.A.; Ismail, D.M.P.; Sani, S.; Noorul, M.; Ahmed, I. Effect of Backing layer Composition on Ultrasonic Probe Bandwith. In Proceedings of the RnD Seminar 2010: Research and Development Seminar, Bangi, Malaysia, 12–15 October 2010. [Google Scholar]
- Hidayat, D.; Syafei, N.S.; Wibawa, B.M.; Taufik, M.; Bahtiar, A.; Risdiana, R. Metal-Polymer Composite as an Acoustic Attenuating Material for Ultrasonic Transducers. KEM 2020, 860, 303–309. [Google Scholar] [CrossRef]
- Zhang, W.; Jia, H.; Gao, G.; Cheng, X.; Du, P.; Xu, D. Backing layers on electroacoustic properties of the acoustic emission sensors. Appl. Acoust. 2019, 156, 387–393. [Google Scholar] [CrossRef]
- Zhou, Q.; Cha, J.H.; Huang, Y.; Zhang, R.; Cao, W.; Shung, K.K. Alumina/epoxy nanocomposite matching layers for high-frequency ultrasound transducer application. IEEE Trans. Ultrason. Ferroelect. Freq. Control 2009, 56, 213–219. [Google Scholar] [CrossRef]
- Tiefensee, F.; Becker-Willinger, C.; Heppe, G.; Herbeck-Engel, P.; Jakob, A. Nanocomposite cerium oxide polymer matching layers with adjustable acoustic impedance between 4 MRayl and 7 MRayl. Ultrasonics 2010, 50, 363–366. [Google Scholar] [CrossRef]
- State, M.; Brands, P.J.; van de Vosse, F.N. Improving the thermal dimensional stability of flexible polymer composite backing materials for ultrasound transducers. Ultrasonics 2010, 50, 458–466. [Google Scholar] [CrossRef]
- Cafarelli, A.; Verbeni, A.; Poliziani, A.; Dario, P.; Menciassi, A.; Ricotti, L. Tuning acoustic and mechanical properties of materials for ultrasound phantoms and smart substrates for cell cultures. Acta Biomater. 2017, 49, 368–378. [Google Scholar] [CrossRef]
- Culjat, M.O.; Goldenberg, D.; Tewari, P.; Singh, R.S. A review of tissue substitutes for ultrasound imaging. Ultrasound Med. Biol. 2010, 36, 861–873. [Google Scholar] [CrossRef] [PubMed]
- Cho, E.; Park, G.; Lee, J.-W.; Cho, S.-M.; Kim, T.; Kim, J.; Choi, W.; Ohm, W.-S.; Kang, S. Effect of alumina composition and surface integrity in alumina/epoxy composites on the ultrasonic attenuation properties. Ultrasonics 2016, 66, 133–139. [Google Scholar] [CrossRef]
- El-Tantawy, F.M.; Sung, Y.K. A novel ultrasonic transducer backing from porous epoxy resin-titanium-silane coupling agent and plasticizer composites. Mater. Lett. 2004, 58, 154–158. [Google Scholar] [CrossRef]
- Nguyen, N.T.; Lethiecq, M.; Karlsson, B.; Patat, F. Highly attenuative rubber modified epoxy for ultrasonic transducer backing applications. Ultrasonics 1996, 34, 669–675. [Google Scholar] [CrossRef]
- Thomas, R.; Ahmad, I.; Ahmad, S.; Koshy, S. Blends and IPNs of Natural Rubber with Thermo-Setting Polymers. In Natural Rubber Materials; Thomas, S., Chan, C.H., Pothan, L., Rajisha, K.R., Maria Hanna, J., Eds.; Royal Society of Chemistry: Cambridge, UK, 2014; pp. 336–348. [Google Scholar]
- Sachse, W.; Pao, Y.H. On the determination of phase and group velocities of dispersive waves in solids. J. Appl. Phys. 1978, 49, 4320–4327. [Google Scholar] [CrossRef]
- Kline, R.A. Measurement of attenuation and dispersion using an ultrasonic spectroscopy technique. J. Acoust. Soc. Am. 1984, 76, 498–504. [Google Scholar] [CrossRef]
- Nguyen, T.N.; Lethiecq, M.; Levassort, F.; Pourcelot, L. Experimental verification of the theory of elastic properties using scattering approximations in (0-3) connectivity composite materials. IEEE Trans. Ultrason. Ferroelectr. Freq. Control 1996, 43, 640–645. [Google Scholar] [CrossRef]
- Hashin, Z.; Shtrikman, S. A variational approach to the theory of the elastic behavior of multiphase materials. J. Mech. Phys. Solids 1963, 11, 127–140. [Google Scholar] [CrossRef]
- Wang, H.; Ritter, T.A.; Cao, W.; Shung, K.K. Passive materials for high frequency ultrasound transducers. In Proceedings of the SPIE Conference on Ultrasonic Transducer Engineering, San Diego, CA, USA, 24–25 February 1999; Volume 3664, pp. 35–42. [Google Scholar] [CrossRef]


| Material Description | Commercial Name | Supplier | Other Info |
|---|---|---|---|
| Epoxy resin | EpoxAmite 101 | SmoothOn (Macungie, PA, USA) | Viscosity: 1000 cps Pot life: 11 min |
| Polyurethane resin | Urebond | SmoothOn (PA, USA) | Viscosity: 5400 cps Pot life: 5 min |
| Polyurethane resin | Liquid Plastic | SmoothOn (PA USA) | Viscosity: 80 cps Pot life: 3 min |
| Tungsten powder | -- | Alfa Aesar (Haverhill, MA, USA) | Tungsten 99.9% Particle size 12 μm |
| Cryogenic rubber powder | MicroDyne 75-TR | Lehigh Technologies (Atlanta, GA, USA) | Particle size < 70 μm (90% wt has a smaller size than 70 μm |
| Sample Denomination | Material | Thickness (mm) |
|---|---|---|
| Ep-00 | EpoxAmite | 4.25 ± 0.13 |
| PU1-00 | Urebond | 4.82 ± 0.15 |
| PU2-00 | Liquid Plastic | 4.45 ± 0.13 |
| Rb-00 | Rubber | 2.73 ± 0.14 |
| Sample | Density (kg/m3) | Ultrasound Velocity (m/s) | α @ 3 MHz (dB/mm) | n |
|---|---|---|---|---|
| Ep-00 | 1150 ± 33 | 2620 ± 75 | 0.69 ± 0.02 | 0.90 |
| PU1-00 | 1125 ± 32 | 1700 ± 50 | 1.34 ± 0.04 | 1.13 |
| PU2-00 | 1130 ± 30 | 2195 ± 66 | 2.66 ± 0.08 | 1.11 |
| Rb-00 | 1100 ± 50 | 1200 ± 60 | 16.43 ± 0.80 | 0.79 |
| Property | Value |
|---|---|
| Longitudinal velocity (m/s) | 5200 |
| Bulk modulus (GPa) | 305 |
| E (GPa) | 414 |
| Longitudinal attenuation @ 5 MHz (dB/m) | 66.5 |
| “n” | 1.0 |
| Shear Modulus (GPa) | 162.3 |
| Density (kg/m3) | 19,300 |
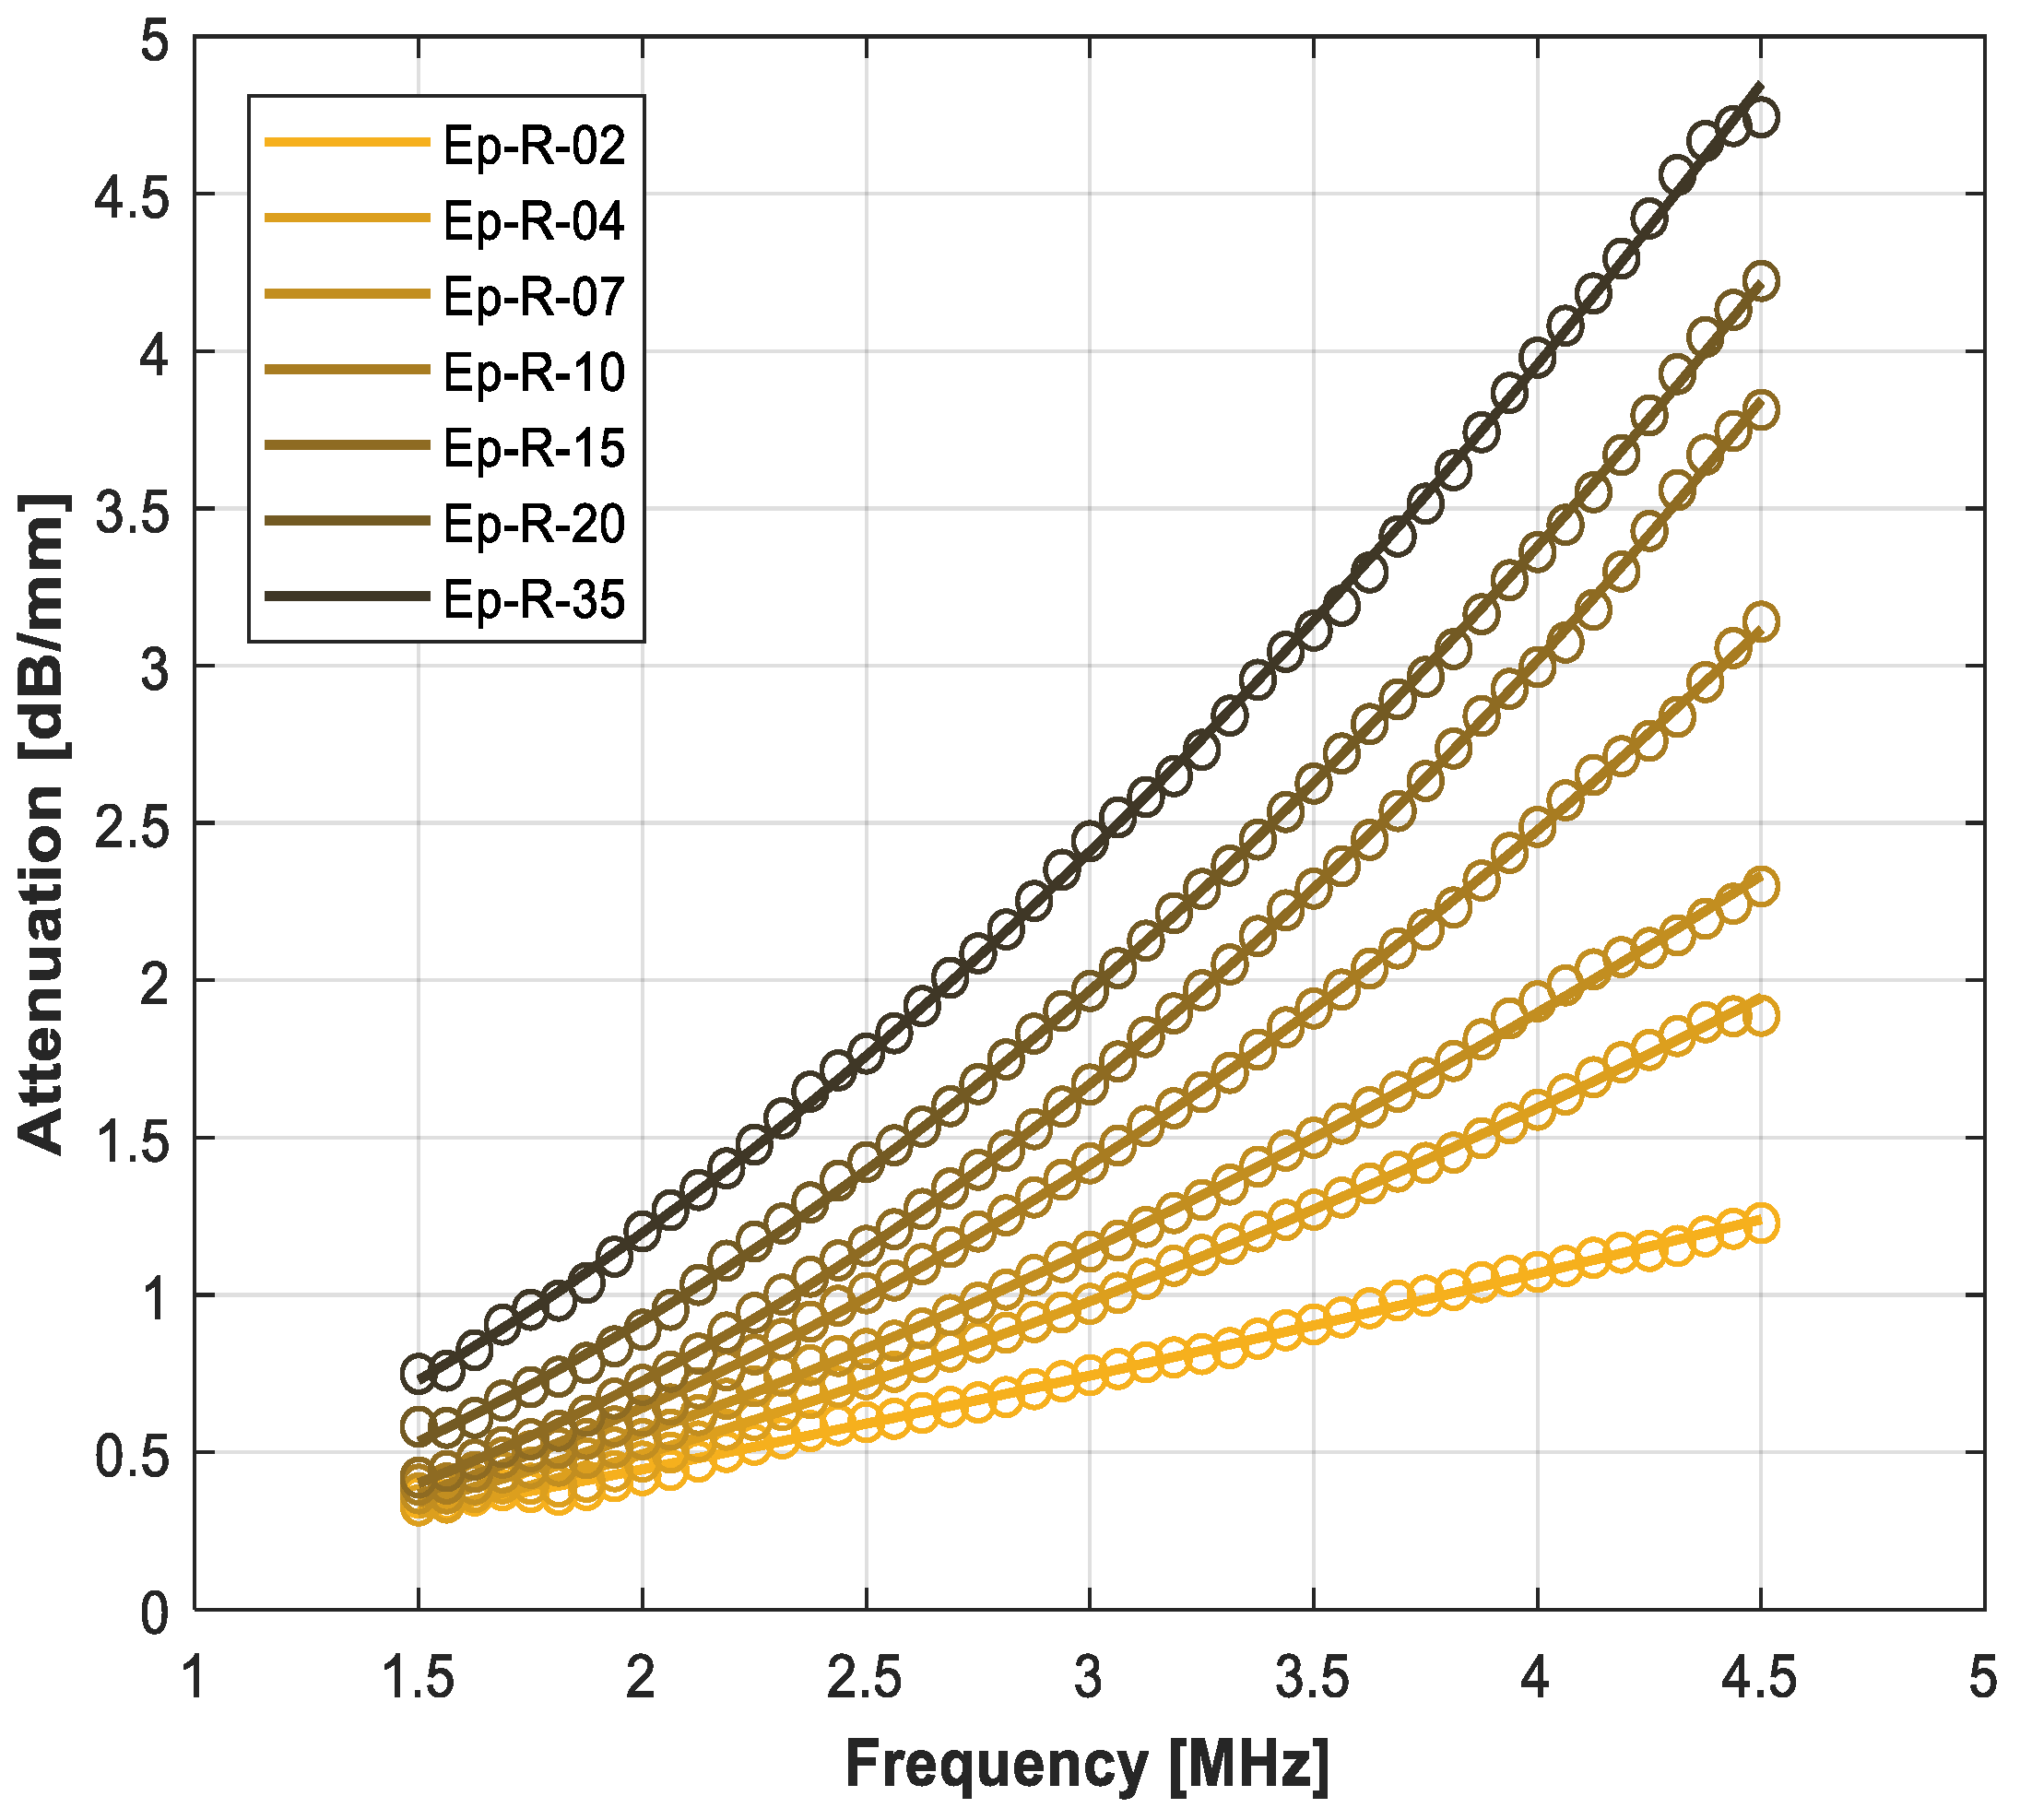
| Sample Denomination | Rubber Volume Fraction (%) | Sample Thickness (mm) | Density Deviation (%) |
|---|---|---|---|
| Ep-R-02 | 2 | 4.5 ± 0.13 | −0.32 |
| Ep-R-04 | 4 | 4.1 ± 0.12 | −0.39 |
| Ep-R-10 | 10 | 3.9 ± 0.12 | −2.32 |
| Ep-R-15 | 15 | 4.7 ± 0.14 | −2.49 |
| Ep-R-20 | 20 | 4.2 ± 0.13 | −4.39 |
| Ep-R-30 | 30 | 3.9 ± 0.12 | −1.92 |
| Ep-R-35 | 35 | 4.1 ± 0.12 | −0.32 |
| Sample Denomination | Tungsten/Rubber Volume Fraction (%) | Sample Thickness (mm) | Density Deviation (%) | |
|---|---|---|---|---|
| Low W load | Ep-WR-14-7 | 14.1/7.3 | 2.96 ± 0.14 | −2.44 |
| Ep-WR-13-13 | 13.9/13.8 | 2.82 ± 0.16 | −3.84 | |
| Ep-WR-16-16 | 15.9/16.1 | 2.67 ± 0.15 | −1.73 | |
| Ep-WR-15-27 | 15.2/26.6 | 3.27 ± 0.18 | −2.93 | |
| Ep-WR-15-37 | 15.2/37.8 | 4.35 ± 0.27 | −4.35 | |
| High W load | Ep-WR-48-03 | 48/3.2 | 3.8 ± 0.24 | −1.54 |
| Ep-WR-47-04 | 47.1/4.4 | 3.2 ± 0.21 | −2.38 | |
| Ep-WR-41-08 | 41.1/8.3 | 1.8 ± 0.15 | −1.62 | |
| Ep-WR-38-12 | 38.1/12.5 | 4.0 ± 0.26 | −1.97 |
| Sample Denomination | Tungsten Volume Fraction (%) | Sample Thickness (mm) | Density Deviation (%) |
|---|---|---|---|
| Ep-W-16 | 16.0 | 2.4 ± 0.12 | −5.32 |
| Ep-W-52 | 52.2 | 2.6 ± 0.13 | 2.81 |
| Ep-W-53 | 53.2 | 2.7 ± 0.13 | −3.55 |
| Sample Denomination | Tungsten Volume Fraction (%) | Sample Thickness (mm) | Density Deviation (%) |
|---|---|---|---|
| PU1-W-45 | 45.9 | 1.88 ± 0.11 | −7.5 |
| PU1-W-37 | 37.0 | 3.9 ± 0.23 | 1.7 |
| PU2-W-52 | 51.7 | 2.63 ± 0.16 | −11.7 |
| PU2-W-37 | 37.0 | 4.8 ± 0.29 | −3.0 |
| Sample | Longitudinal Ultrasound Velocity (m/s) | Impedance (MRayl) | α @ 3 MHz (dB/mm) | n |
|---|---|---|---|---|
| Ep-R-02 | 2567 ± 77 | 2.94 ± 0.09 | 0.96 ± 0.03 | 1.7 |
| Ep-R-04 | 2536 ± 75 | 2.90 ± 0.09 | 1.12 ± 0.03 | 1.8 |
| Ep-R-10 | 2423 ± 70 | 2.71 ± 0.08 | 1.39 ± 0.04 | 1.9 |
| Ep-R-15 | 2298 ± 67 | 2.56 ± 0.08 | 1.66 ± 0.05 | 2.0 |
| Ep-R-20 | 2202 ± 66 | 2.40 ± 0.07 | 1.97 ± 0.06 | 1.9 |
| Ep-R-35 | 2111 ± 62 | 2.35 ± 0.07 | 2.35 ± 0.07 | 1.7 |
| Sample | Longitudinal Ultrasound Velocity (m/s) | Impedance (MRayl) | α @ 3 MHz (dB/mm) | n | |
|---|---|---|---|---|---|
| Low W-load | Ep-WR-14-7 | 1562 ± 94 | 5.57 ± 0.3 | 3.80 ± 0.2 | 2.3 |
| Ep-WR-13-13 | 1311 ± 81 | 4.66 ± 0.3 | 5.46 ± 0.3 | 2.3 | |
| Ep-WR-16-16 | 1463 ± 87 | 5.77 ± 0.3 | 6.69 ± 0.4 | 2.3 | |
| Ep-WR-15-27 | 1166 ± 69 | 4.40 ± 0.3 | 10.01 ± 0.6 | 2.0 | |
| Ep-WR-15-37 | 1127 ± 69 | 4.17 ± 0.3 | 13.95 ± 0.8 | 3.2 | |
| High W-load | Ep-WR-48-03 | 1618 ± 95 | 15.64 ± 0.9 | 1.18 ± 0.07 | 2.5 |
| Ep-WR-47-04 | 1594 ± 94 | 15.01 ± 0.9 | 2.66 ± 0.1 | 2.0 | |
| Ep-WR-41-08 | 1507 ± 90 | 12.70 ± 0.9 | 3.19 ± 0.2 | 2.1 | |
| Ep-WR-38-12 | 1459 ± 89 | 11.48 ± 0.9 | 3.36 ± 0.2 | 2.2 |
| Sample | Longitudinal Ultrasound Velocity (m/s) | Impedance (MRayl) | α @ 3 MHz (dB/mm) | n |
|---|---|---|---|---|
| Ep-W-17 | 1695 | 6.77 | 1.44 | 1.7 |
| Ep-W-52 | 1706 | 18.48 | 1.53 | 1.4 |
| Ep-W-53 | 1666 | 17.22 | 1.35 | 1.6 |
| Sample | Longitudinal Ultrasound Velocity (m/s) | Impedance (MRayl) | α @ 3 MHz (dB/mm) | n |
|---|---|---|---|---|
| PU1-W-45 | 788 | 6.90 | 24.44 | 1.2 |
| PU1-W-37 | 863 | 6.90 | 27.02 | 1.05 |
| PU2-W-52 | 1139 | 10.58 | 3.97 | 2.3 |
| PU2-W-37 | 1259 | 9.59 | 6.69 | 1.05 |
| PU1-W-45 | 788 | 6.90 | 24.44 | 1.2 |
Publisher’s Note: MDPI stays neutral with regard to jurisdictional claims in published maps and institutional affiliations. |
© 2022 by the authors. Licensee MDPI, Basel, Switzerland. This article is an open access article distributed under the terms and conditions of the Creative Commons Attribution (CC BY) license (https://creativecommons.org/licenses/by/4.0/).
Share and Cite
Genovés, V.; Fariñas, M.D.; Pérez-Aparicio, R.; Saiz-Rodríguez, L.; Valentín, J.L.; Álvarez-Arenas, T.G. Micronized Recycle Rubber Particles Modified Multifunctional Polymer Composites: Application to Ultrasonic Materials Engineering. Polymers 2022, 14, 3614. https://doi.org/10.3390/polym14173614
Genovés V, Fariñas MD, Pérez-Aparicio R, Saiz-Rodríguez L, Valentín JL, Álvarez-Arenas TG. Micronized Recycle Rubber Particles Modified Multifunctional Polymer Composites: Application to Ultrasonic Materials Engineering. Polymers. 2022; 14(17):3614. https://doi.org/10.3390/polym14173614
Chicago/Turabian StyleGenovés, Vicente, María Dolores Fariñas, Roberto Pérez-Aparicio, Leticia Saiz-Rodríguez, Juan López Valentín, and Tomás Gómez Álvarez-Arenas. 2022. "Micronized Recycle Rubber Particles Modified Multifunctional Polymer Composites: Application to Ultrasonic Materials Engineering" Polymers 14, no. 17: 3614. https://doi.org/10.3390/polym14173614
APA StyleGenovés, V., Fariñas, M. D., Pérez-Aparicio, R., Saiz-Rodríguez, L., Valentín, J. L., & Álvarez-Arenas, T. G. (2022). Micronized Recycle Rubber Particles Modified Multifunctional Polymer Composites: Application to Ultrasonic Materials Engineering. Polymers, 14(17), 3614. https://doi.org/10.3390/polym14173614