
An Environmentally-Friendly Three-Dimensional Computer-Aided Verification Technique for Plastic Parts


Abstract
:
1. Introduction
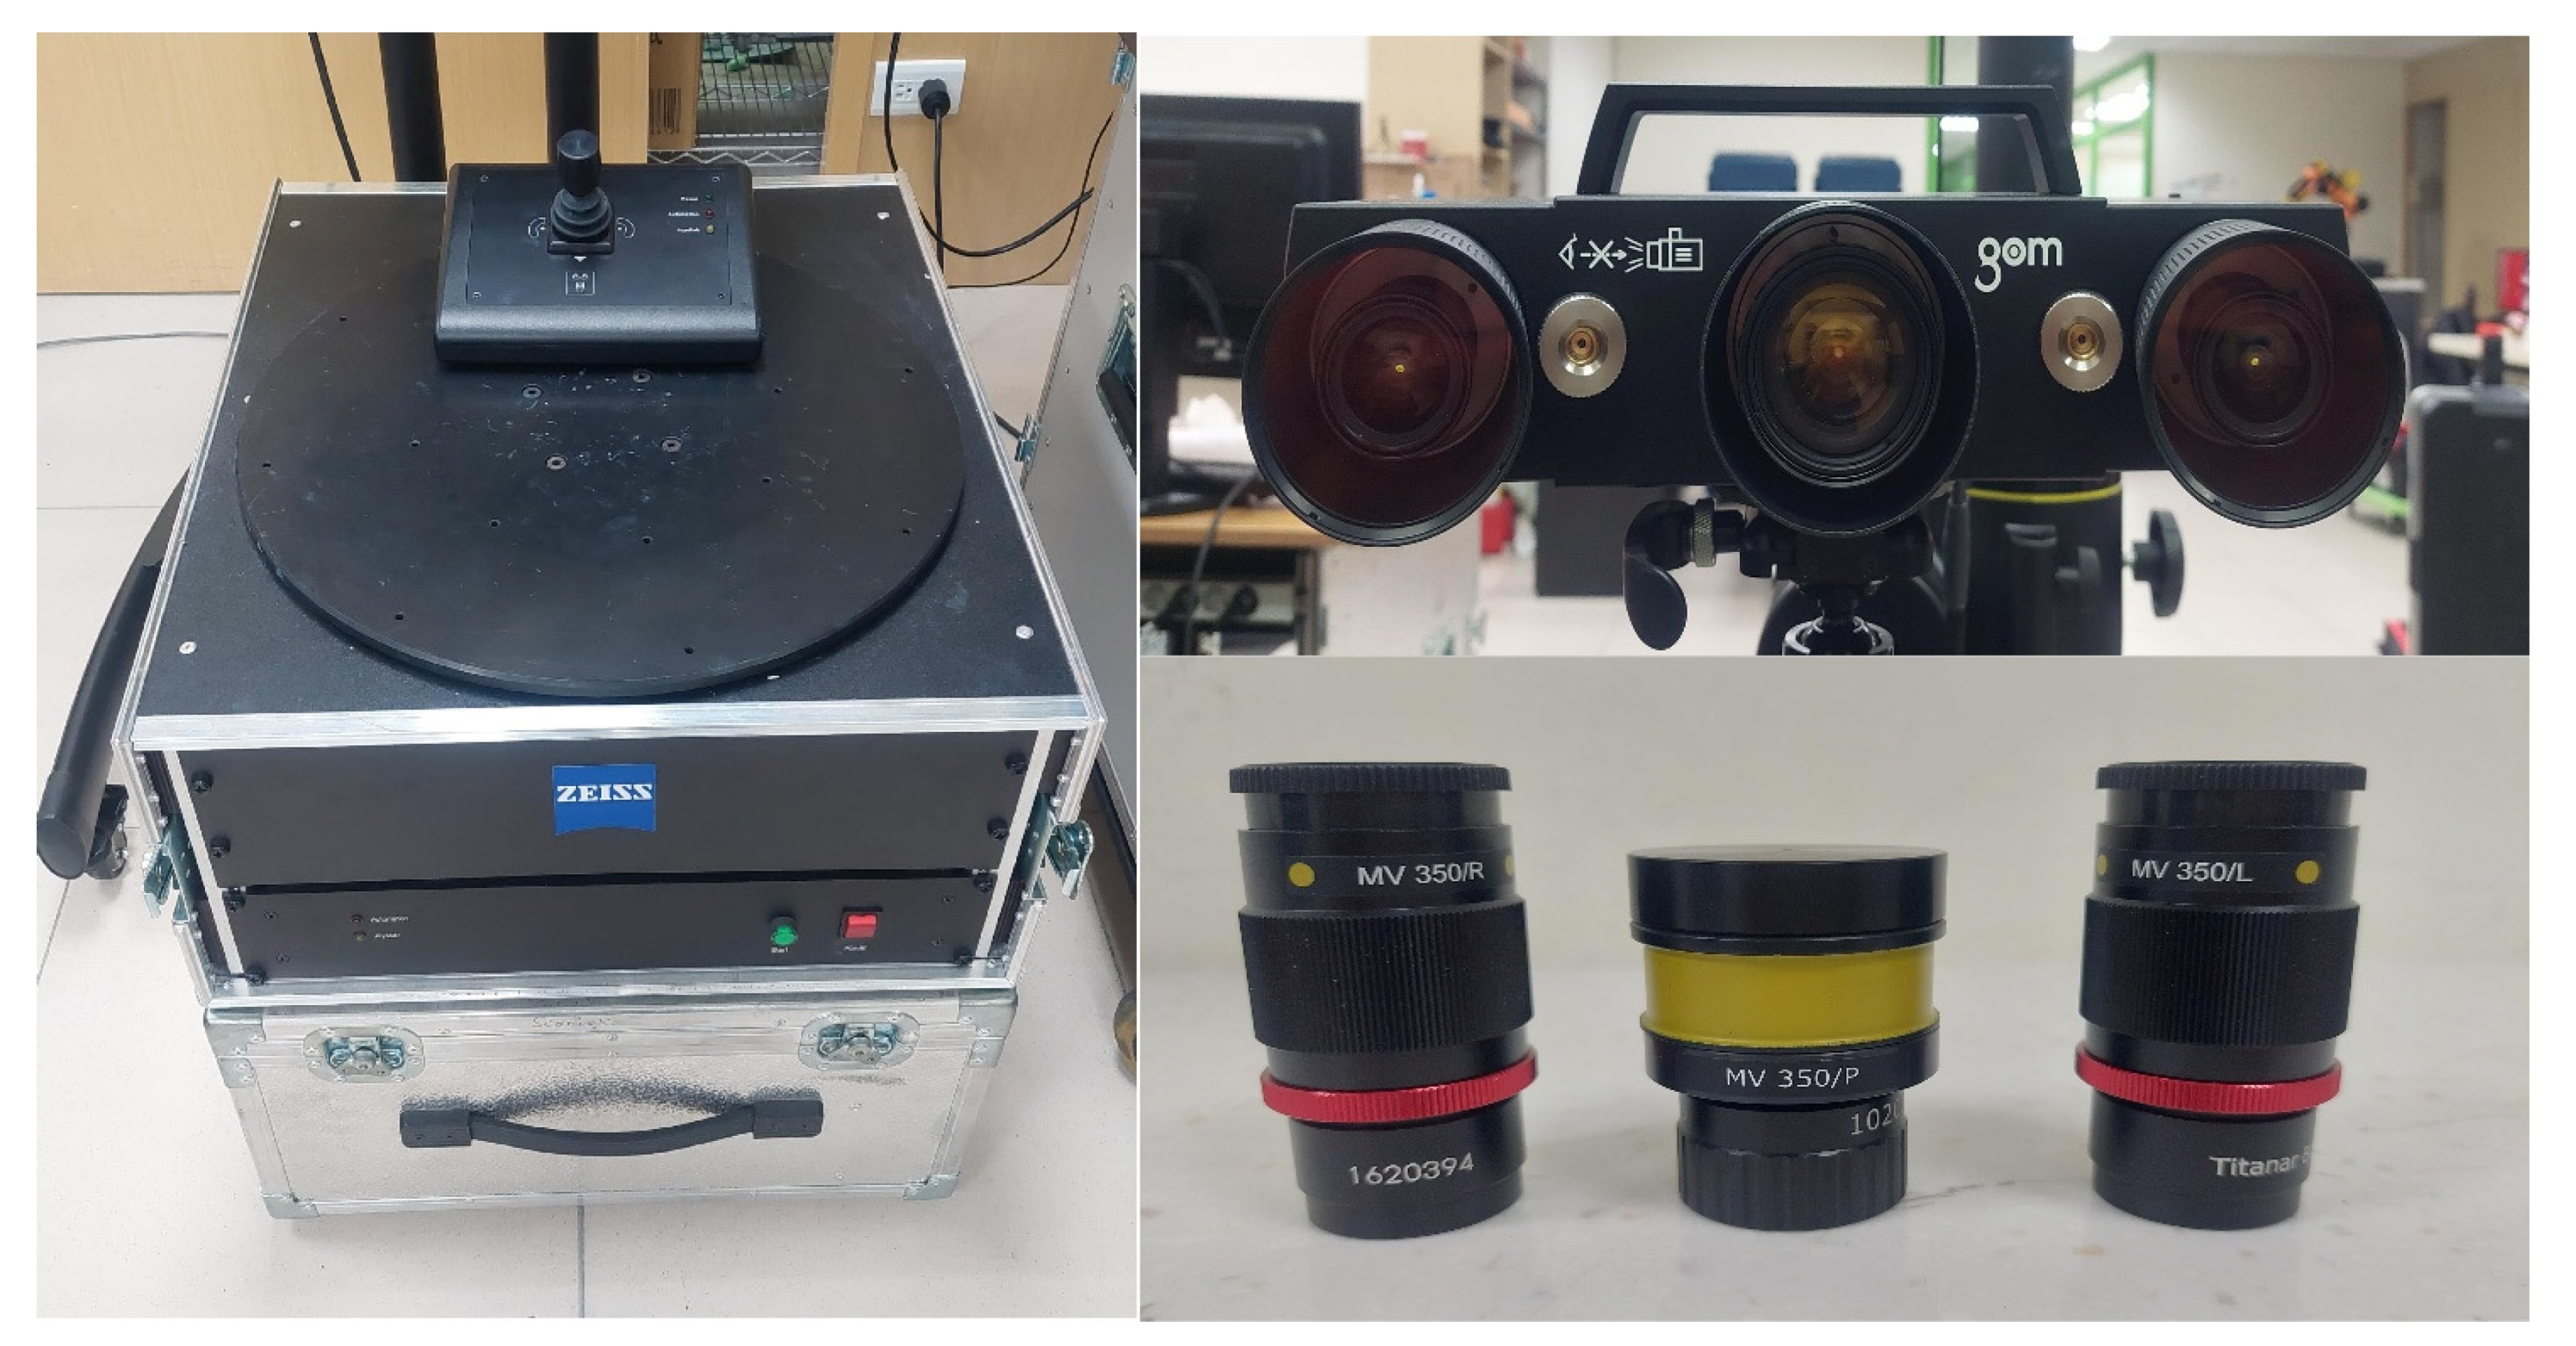
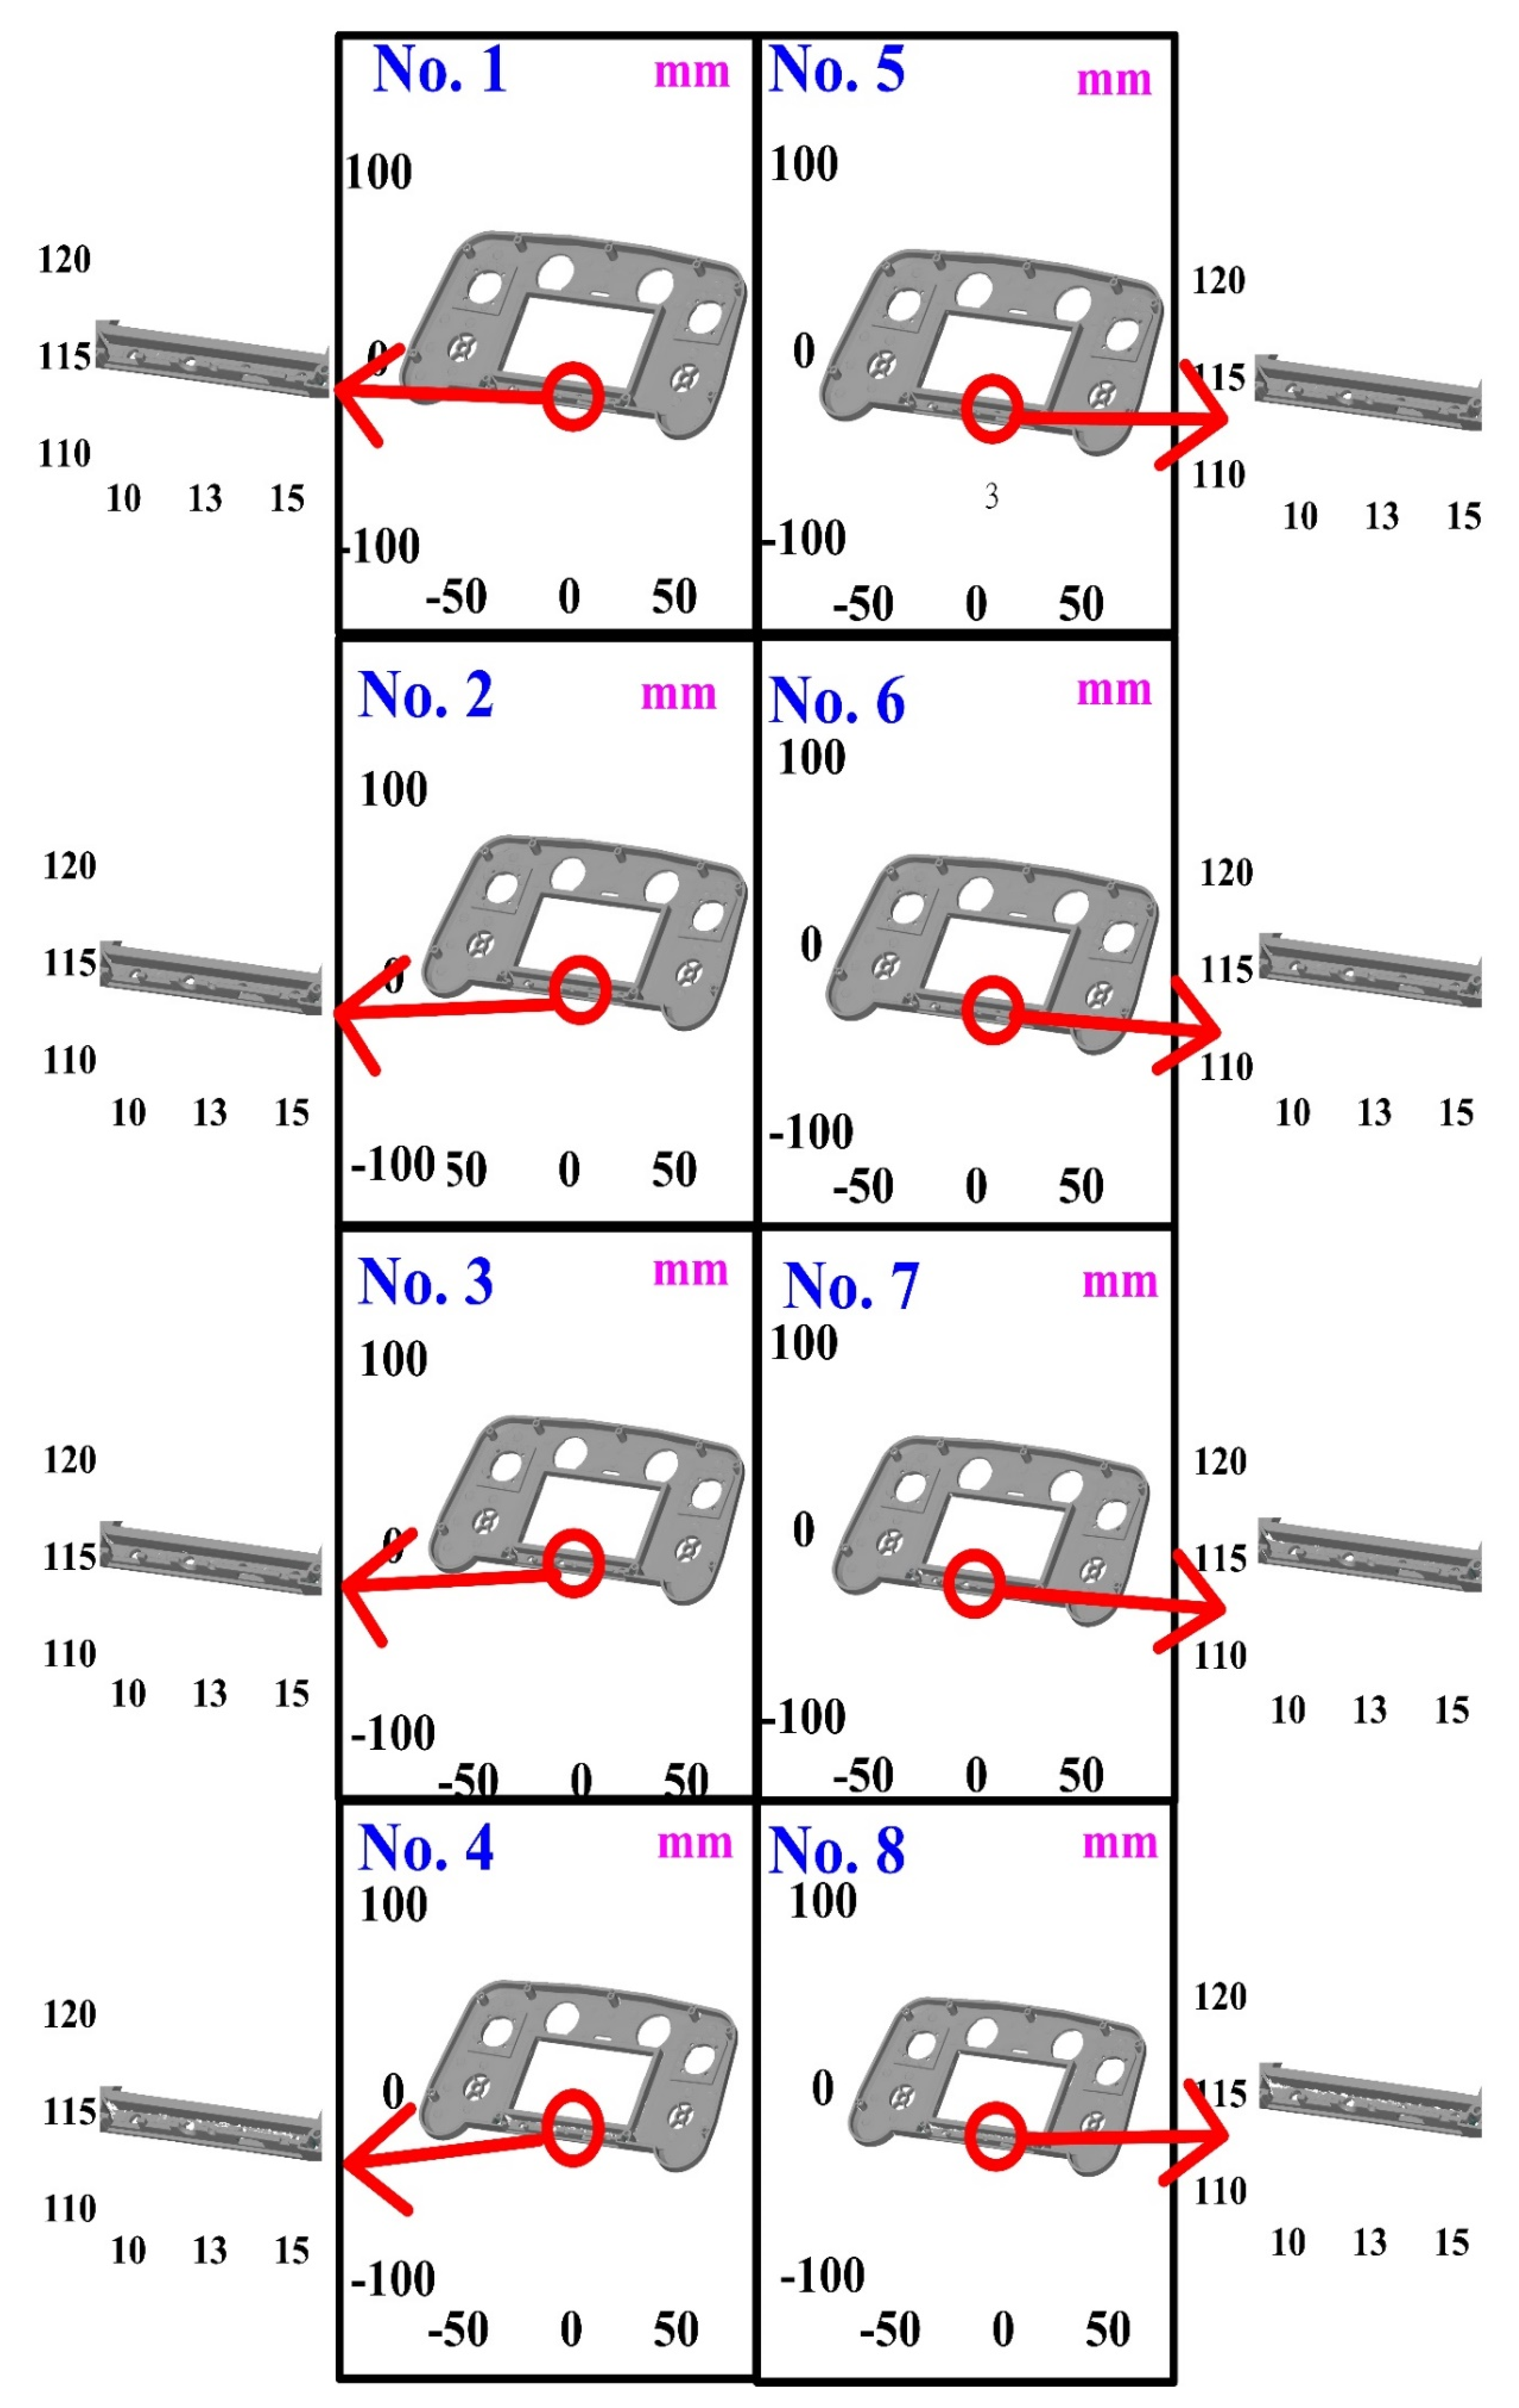
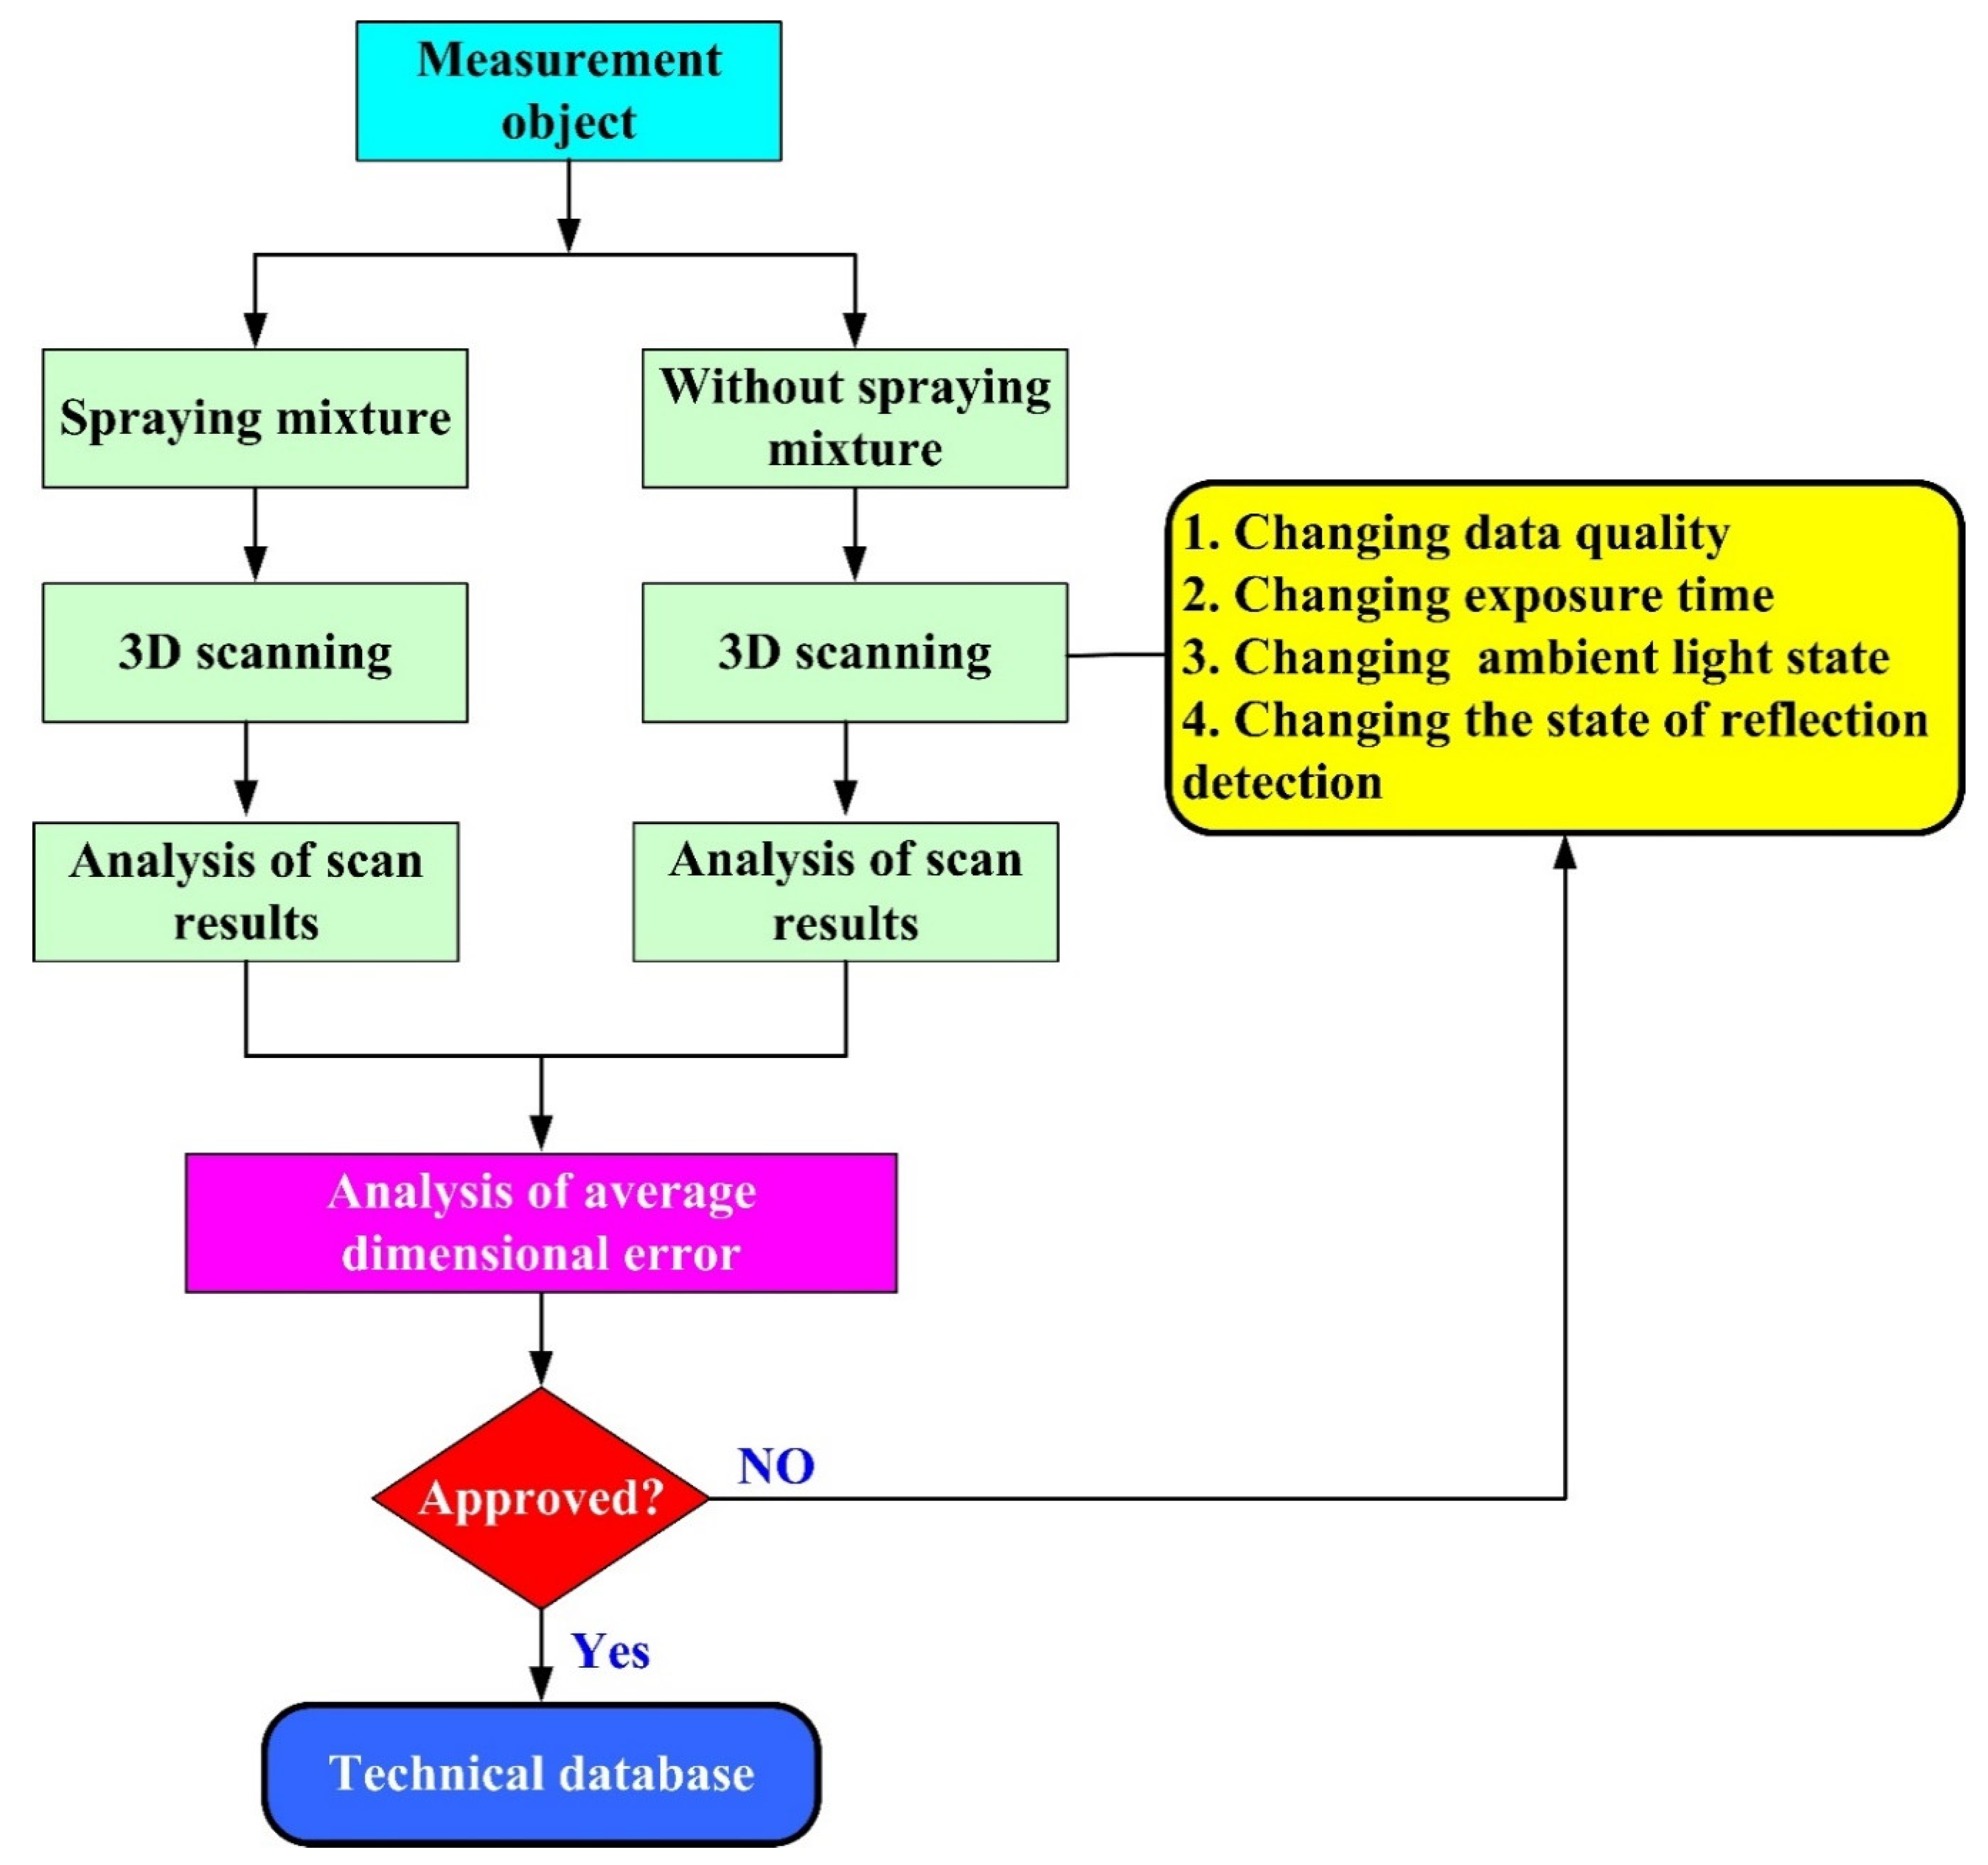
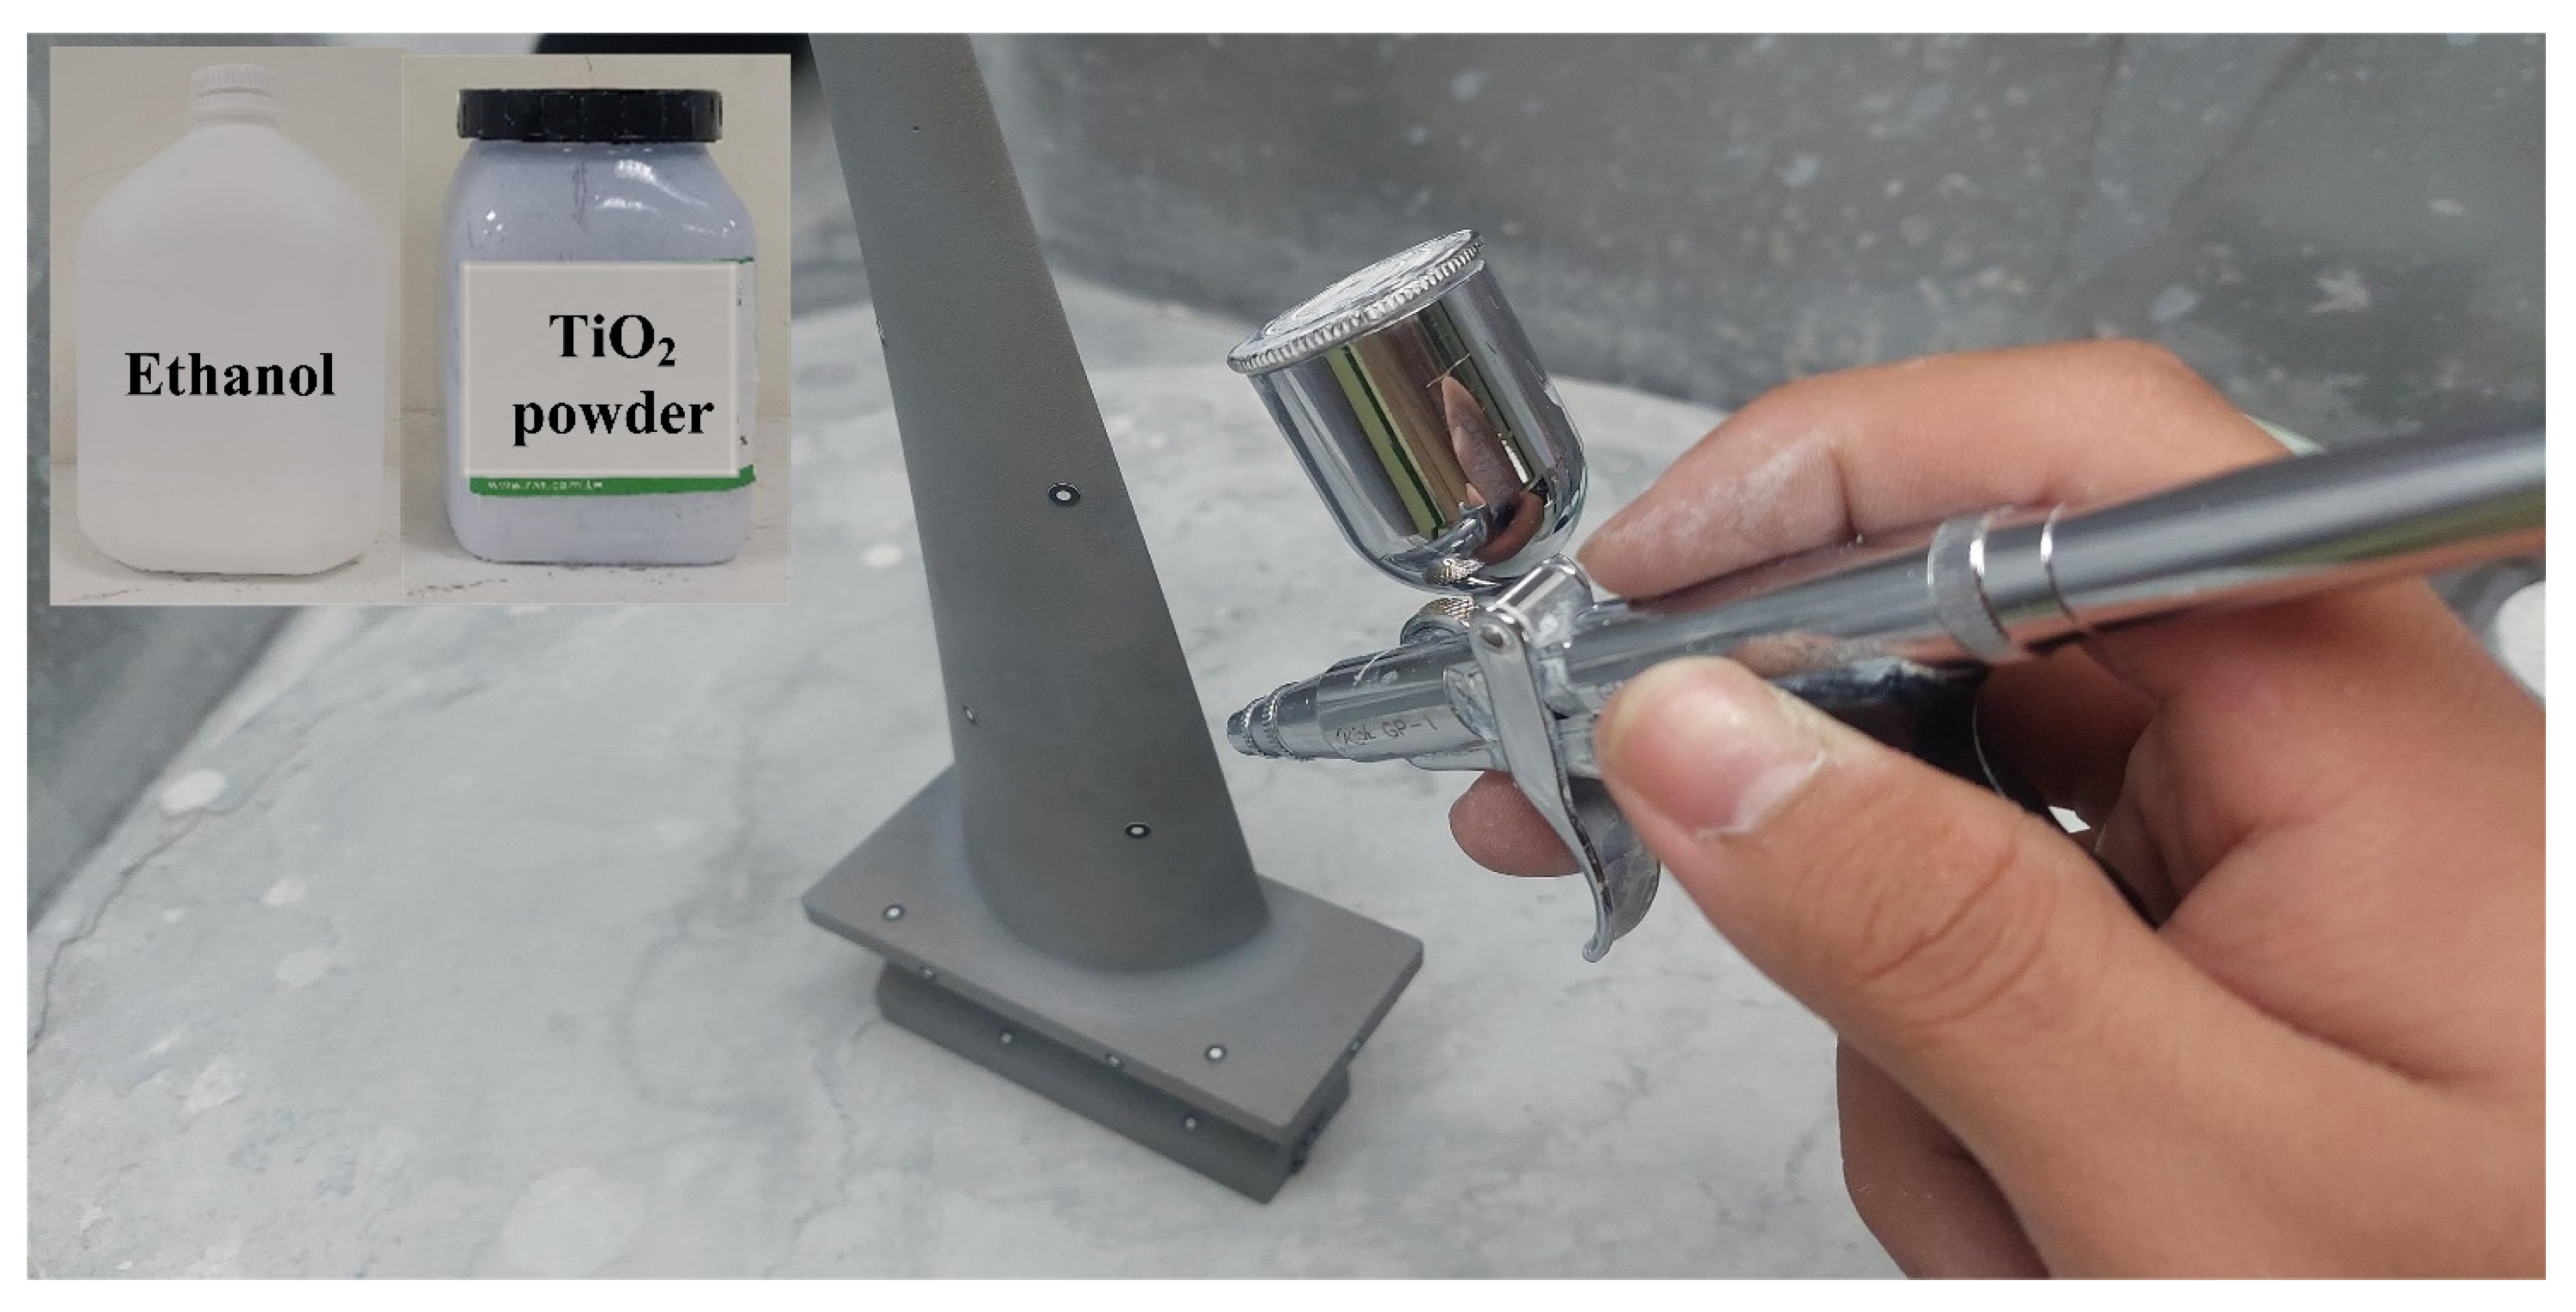
2. Experimental Details
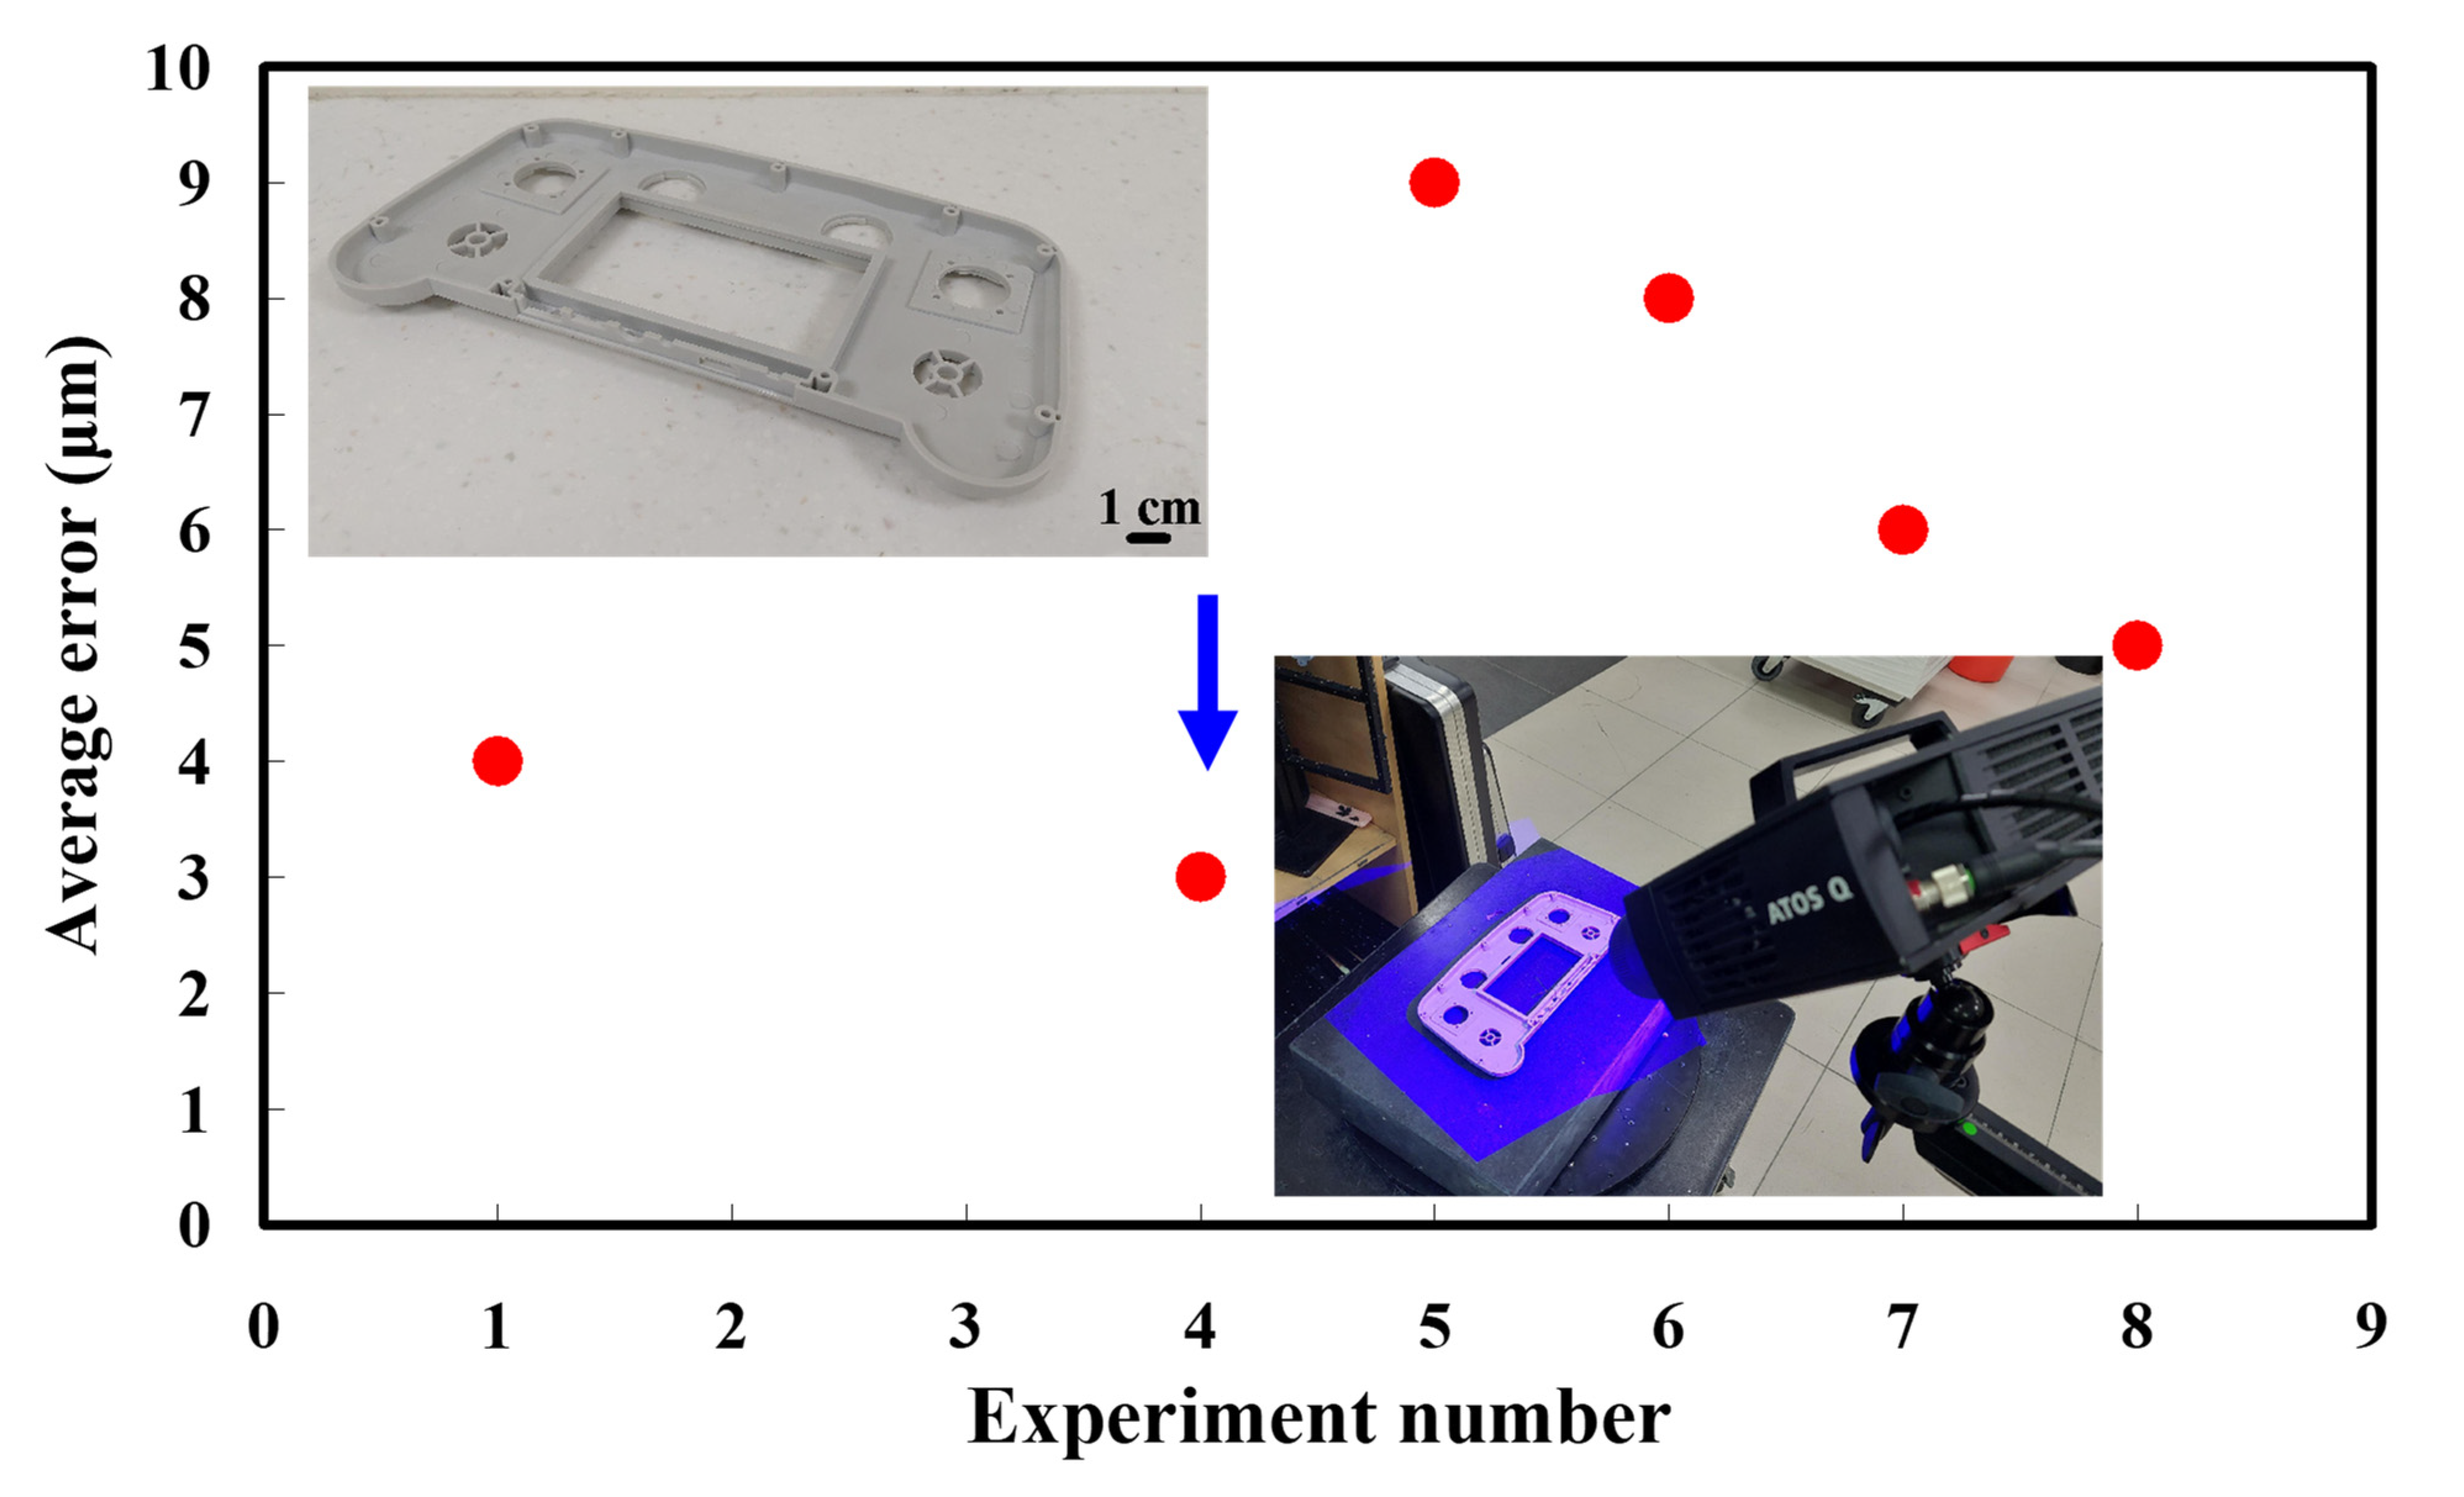
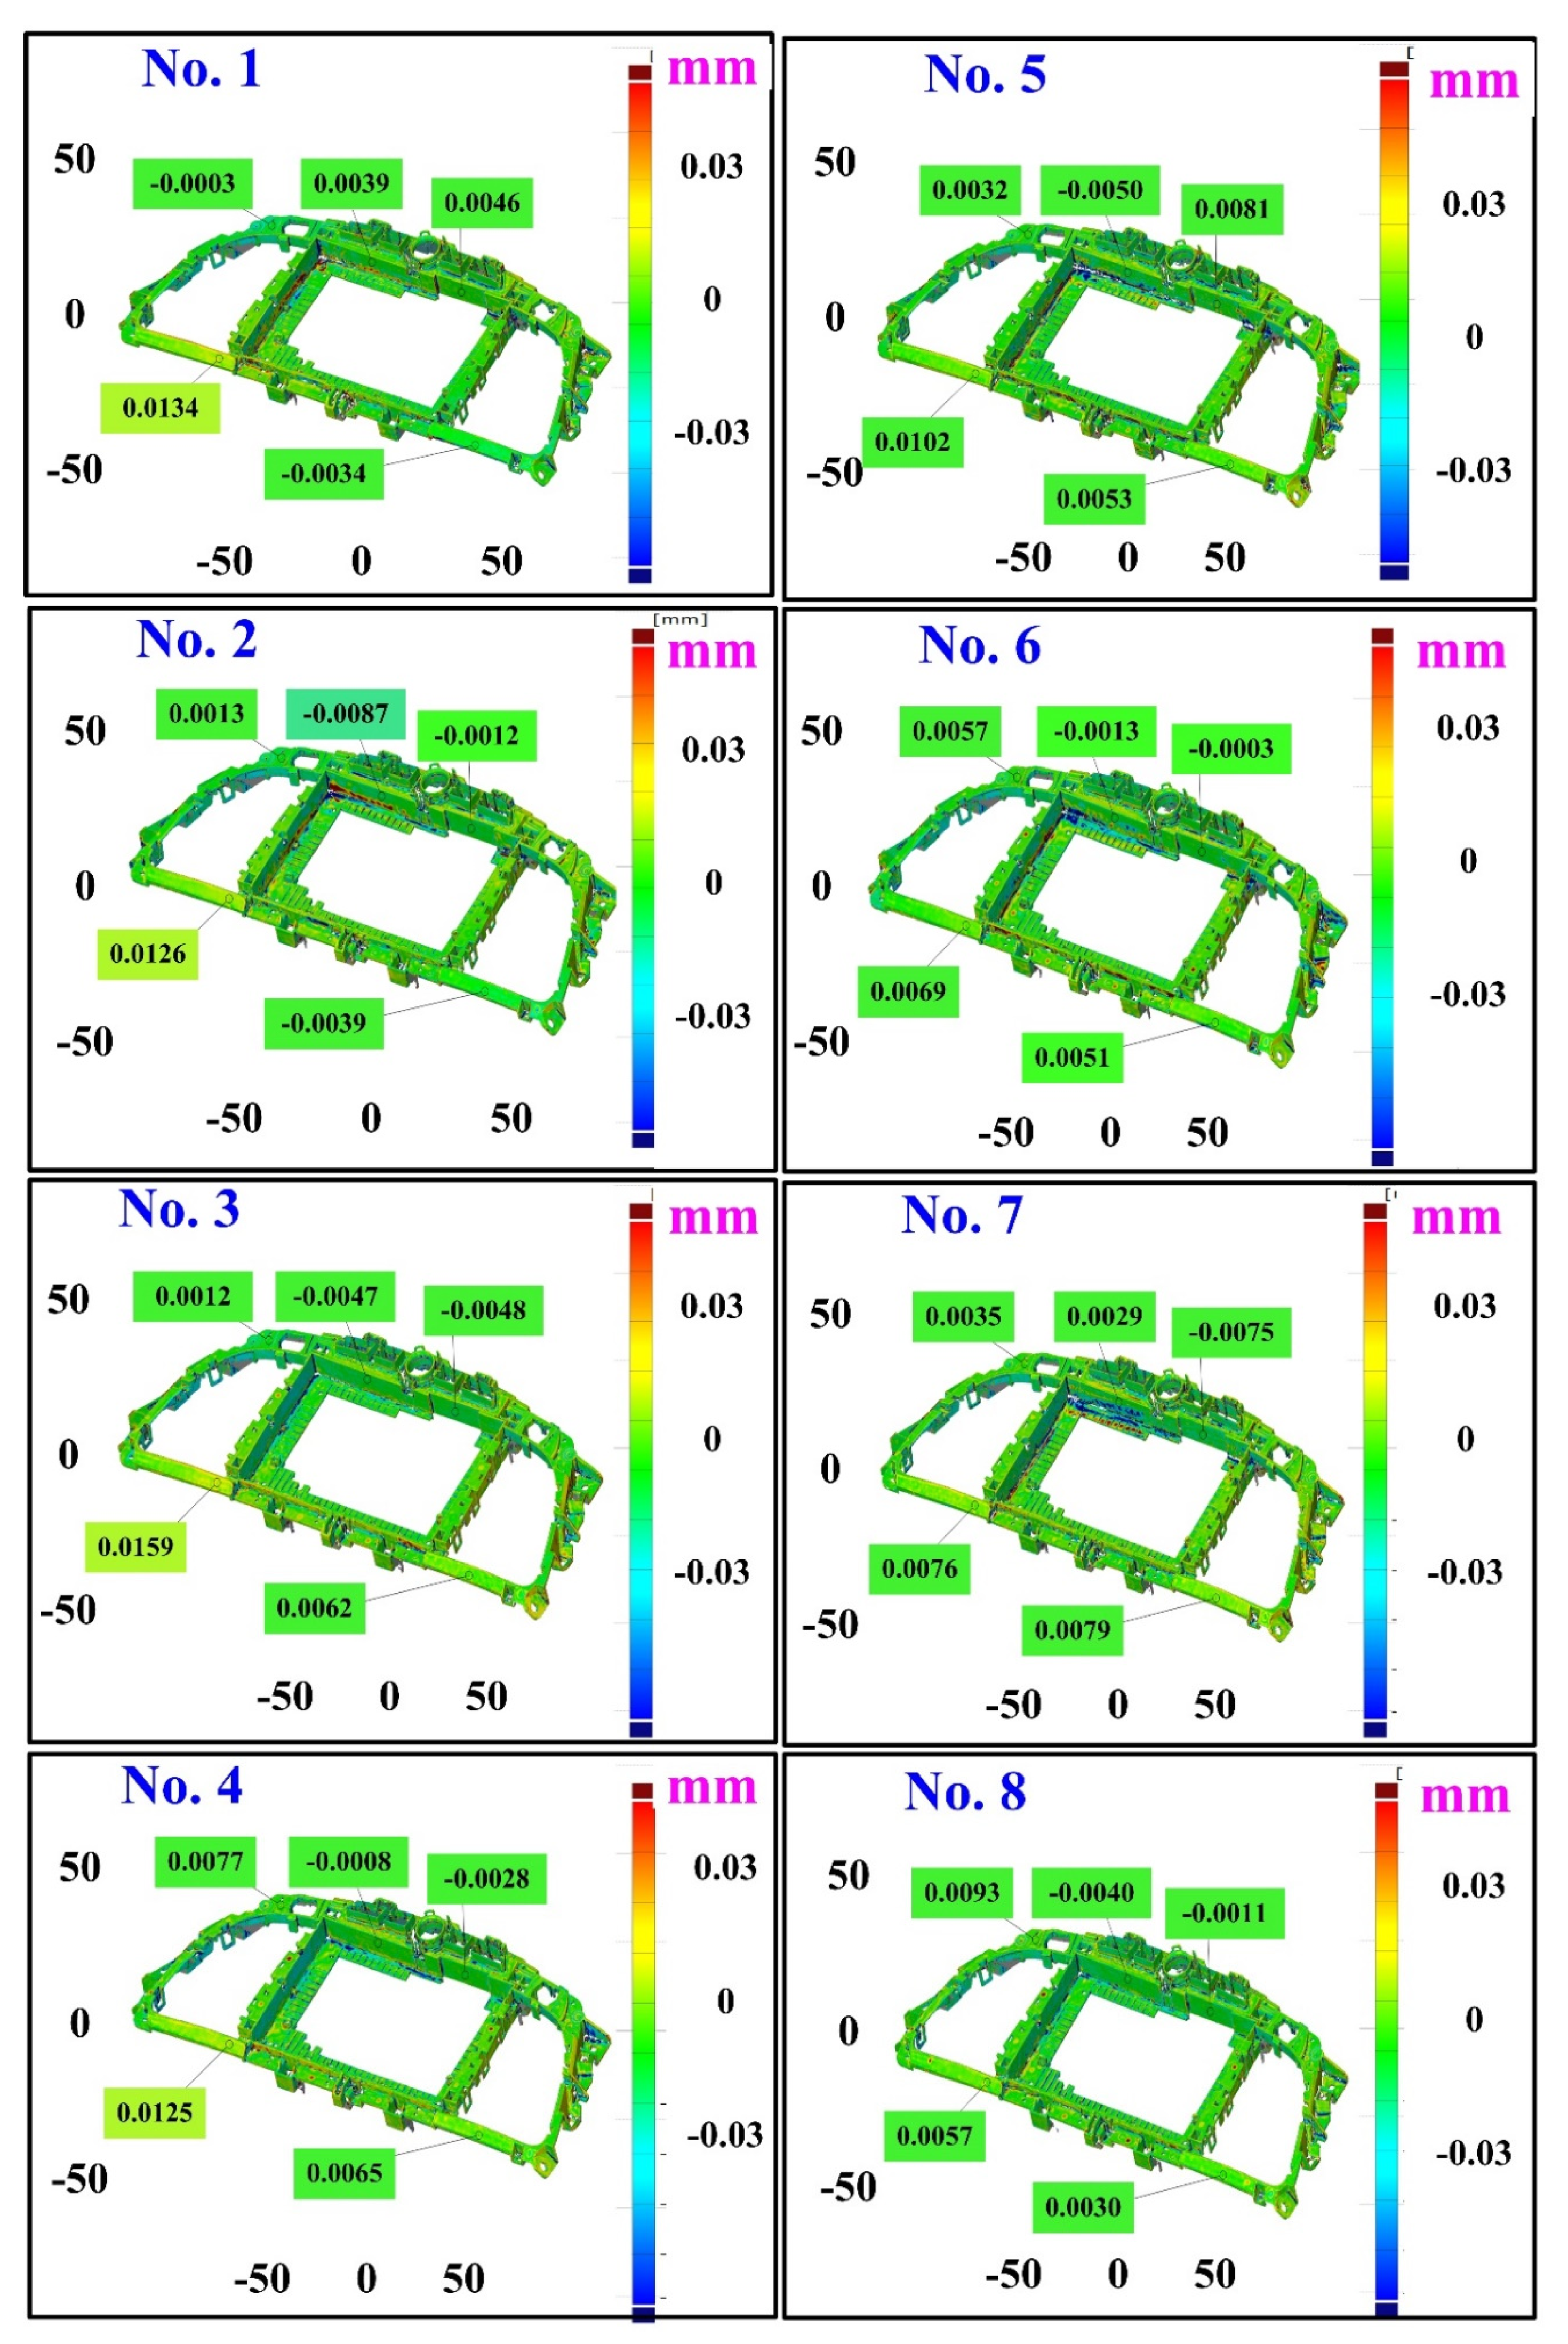
3. Results and Discussion
4. Conclusions
- The remarkable findings in this study are very practical and provide the greatest application potential in the plastic industry because precise 3D optical measurements of objects that have not been sprayed with anything has been proven to work;
- The research results meet the requirements of the SDGs because an empirical technical database for precise 3D optical measurements of objects that have not been sprayed on their surfaces has been created;
- An empirical technical database for two plastic parts with different surfaces has been built;
- The dimensional average error of the two different kinds of plastic can be controlled by approximately 3 µm and 4.7 µm.
Author Contributions
Funding
Institutional Review Board Statement
Informed Consent Statement
Data Availability Statement
Conflicts of Interest
References
- Uyen, T.M.T.; Do, T.T.; Minh, P.S. Internal Gas-Assisted Mold Temperature Control for Improving the Filling Ability of Polyamide 6 + 30% Glass Fiber in the Micro-Injection Molding Process. Polymers 2022, 14, 2218. [Google Scholar] [CrossRef] [PubMed]
- Li, X.; Meng, L.; Zhang, Y.; Qin, Z.; Meng, L.; Li, C.; Liu, M. Research and Application of Polypropylene Carbonate Composite Materials: A Review. Polymers 2022, 14, 2159. [Google Scholar] [CrossRef] [PubMed]
- Tunalioglu, M.S.; Agca, B.V. Wear and Service Life of 3-D Printed Polymeric Gears. Polymers 2022, 14, 2064. [Google Scholar] [CrossRef]
- Otaibi, A.A.A.; Alsukaibi, A.K.D.; Rahman, M.A.; Mushtaque, M.; Haque, A. From Waste to Schiff Base: Upcycling of Aminolysed Poly(ethylene terephthalate) Product. Polymers 2022, 14, 1861. [Google Scholar] [CrossRef]
- Melchor-Martínez, E.M.; Macías-Garbett, R.; Alvarado-Ramírez, L.; Araújo, R.G.; Sosa-Hernández, J.E.; Ramírez-Gamboa, D.; Parra-Arroyo, L.; Alvarez, A.G.; Monteverde, R.P.B.; Cazares, K.A.S.; et al. Towards a Circular Economy of Plastics: An Evaluation of the Systematic Transition to a New Generation of Bioplastics. Polymers 2022, 14, 1203. [Google Scholar] [CrossRef]
- Kwak, J.B. Completely in situ and non-contact warpage assessment using 3D DIC with virtual patterning method. Int. J. Adv. Manuf. Technol. 2019, 100, 2803–2811. [Google Scholar] [CrossRef]
- Mussatayev, M.; Huang, M.; Beshleyev, S. Thermal influences as an uncertainty contributor of the coordinate measuring machine (CMM). Int. J. Adv. Manuf. Technol. 2020, 111, 537–547. [Google Scholar] [CrossRef]
- Wang, R.; Law, A.C.; Garcia, D.; Yang, S.; Kong, Z. Development of structured light 3D-scanner with high spatial resolution and its applications for additive manufacturing quality assurance. Int. J. Adv. Manuf. Technol. 2021, 117, 845–862. [Google Scholar] [CrossRef]
- Szatkiewicz, T.; Laskowska, D.; Bałasz, B.; Mitura, K. The Influence of the Structure Parameters on the Mechanical Properties of Cylindrically Mapped Gyroid TPMS Fabricated by Selective Laser Melting with 316L Stainless Steel Powder. Materials 2022, 15, 4352. [Google Scholar] [CrossRef]
- Mercado Rivera, F.J.; Rojas Arciniegas, A.J. Additive manufacturing methods: Techniques, materials, and closed-loop control applications. Int. J. Adv. Manuf. Technol. 2020, 109, 17–31. [Google Scholar] [CrossRef]
- Kogo, B.; Xu, C.; Wang, B.; Chizari, M.; Reza Kashyzadeh, K.; Ghorbani, S. An Experimental Analysis to Determine the Load-Bearing Capacity of 3D Printed Metals. Materials 2022, 15, 4333. [Google Scholar] [CrossRef] [PubMed]
- Rękas, A.; Kaczmarek, T.; Wieczorowski, M.; Gapiński, B.; Jakubowicz, M.; Grochalski, K.; Kucharski, D.; Marciniak-Podsadna, L. Analysis of Tool Geometry for the Stamping Process of Large-Size Car Body Components Using a 3D Optical Measurement System. Materials 2021, 14, 7608. [Google Scholar] [CrossRef] [PubMed]
- Affatato, S.; Valigi, M.C.; Logozzo, S. Knee Wear Assessment: 3D Scanners Used as a Consolidated Procedure. Materials 2020, 13, 2349. [Google Scholar] [CrossRef] [PubMed]
- Valigi, M.C.; Logozzo, S.; Affatato, S. New Challenges in Tribology: Wear Assessment Using 3D Optical Scanners. Materials 2017, 10, 548. [Google Scholar] [CrossRef] [PubMed]
- Affatato, S.; Valigi, M.C.; Logozzo, S. Wear Distribution Detection of Knee Joint Prostheses by Means of 3D Optical Scanners. Materials 2017, 10, 364. [Google Scholar] [CrossRef] [PubMed]
- Urbas, U.; Zorko, D.; Vukašinović, N.; Černe, B. Comprehensive Areal Geometric Quality Characterisation of Injection Moulded Thermoplastic Gears. Polymers 2022, 14, 705. [Google Scholar] [CrossRef]
- Sun, M.; Bao, T.; Xie, D.; Lv, H.; Si, G. Towards Application-Driven Task Offloading in Edge Computing Based on Deep Reinforcement Learning. Micromachines 2021, 12, 1011. [Google Scholar] [CrossRef]
- Abdo, H.S.; Abdus Samad, U.; Abdo, M.S.; Alkhammash, H.I.; Aijaz, M.O. Electrochemical Behavior of Inductively Sintered Al/TiO2 Nanocomposites Reinforced by Electrospun Ceramic Nanofibers. Polymers 2021, 13, 4319. [Google Scholar] [CrossRef]
- Tambrallimath, V.; Keshavamurthy, R.; Bavan, S.D.; Patil, A.Y.; Yunus Khan, T.M.; Badruddin, I.A.; Kamangar, S. Mechanical Properties of PC-ABS-Based Graphene-Reinforced Polymer Nanocomposites Fabricated by FDM Process. Polymers 2021, 13, 2951. [Google Scholar] [CrossRef]
- Lin, W.-C.; Fan, F.-Y.; Huang, C.-F.; Shen, Y.-K.; Wang, H. Analysis of the Warpage Phenomenon of Micro-Sized Parts with Precision Injection Molding by Experiment, Numerical Simulation, and Grey Theory. Polymers 2022, 14, 1845. [Google Scholar] [CrossRef]
- Ratautas, K.; Vosylius, V.; Jagminienė, A.; Stankevičienė, I.; Norkus, E.; Račiukaitis, G. Laser-Induced Selective Electroless Plating on PC/ABS Polymer: Minimisation of Thermal Effects for Supreme Processing Speed. Polymers 2020, 12, 2427. [Google Scholar] [CrossRef] [PubMed]
- Verma, P.; Ubaid, J.; Schiffer, A.; Jain, A.; Martínez-Pañeda, E.; Kumar, S. Essential work of fracture assessment of acrylonitrile butadiene styrene (ABS) processed via fused filament fabrication additive manufacturing. Int. J. Adv. Manuf. Technol. 2021, 113, 771–784. [Google Scholar] [CrossRef]
- Lluch-Cerezo, J.; Meseguer, M.D.; García-Manrique, J.A.; Benavente, R. Influence of Thermal Annealing Temperatures on Powder Mould Effectiveness to Avoid Deformations in ABS and PLA 3D-Printed Parts. Polymers 2022, 14, 2607. [Google Scholar] [CrossRef] [PubMed]
- Ertugrul Ayyildiz, Fermatean fuzzy step-wise Weight Assessment Ratio Analysis (SWARA) and its application to prioritizing indicators to achieve sustainable development goal-7. Renew. Energy 2022, 193, 136–148. [CrossRef]
- Warsi, S.S.; Ahmad, R.; Jaffery, S.H.I.; Agha, M.H.; Khan, M. Development of specific cutting energy map for sustainable turning: A study of Al 6061 T6 from conventional to high cutting speeds. Int. J. Adv. Manuf. Technol. 2020, 106, 2949–2960. [Google Scholar] [CrossRef]
- Li, K.; Zhou, T.; Liu, B.-h. Internet-based intelligent and sustainable manufacturing: Developments and challenges. Int. J. Adv. Manuf. Technol. 2020, 108, 1767–1791. [Google Scholar] [CrossRef]


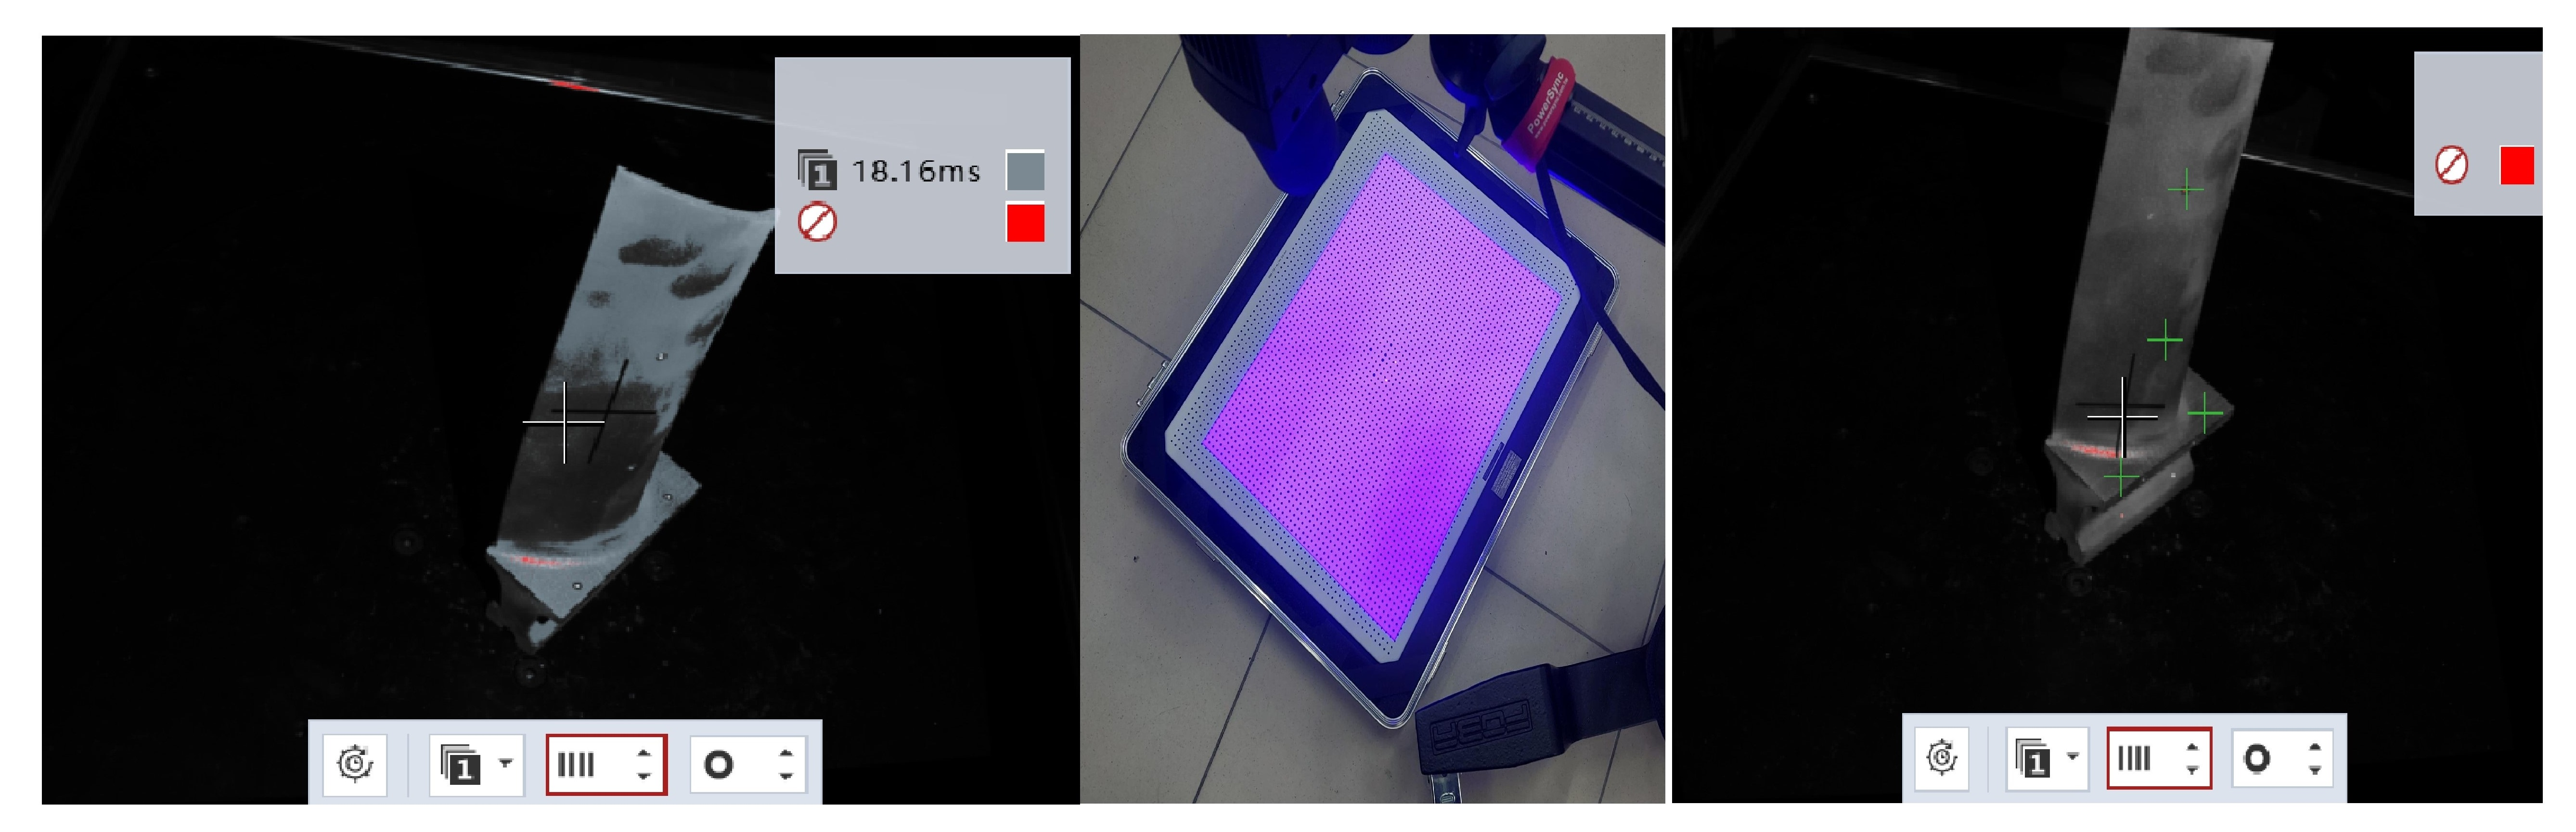
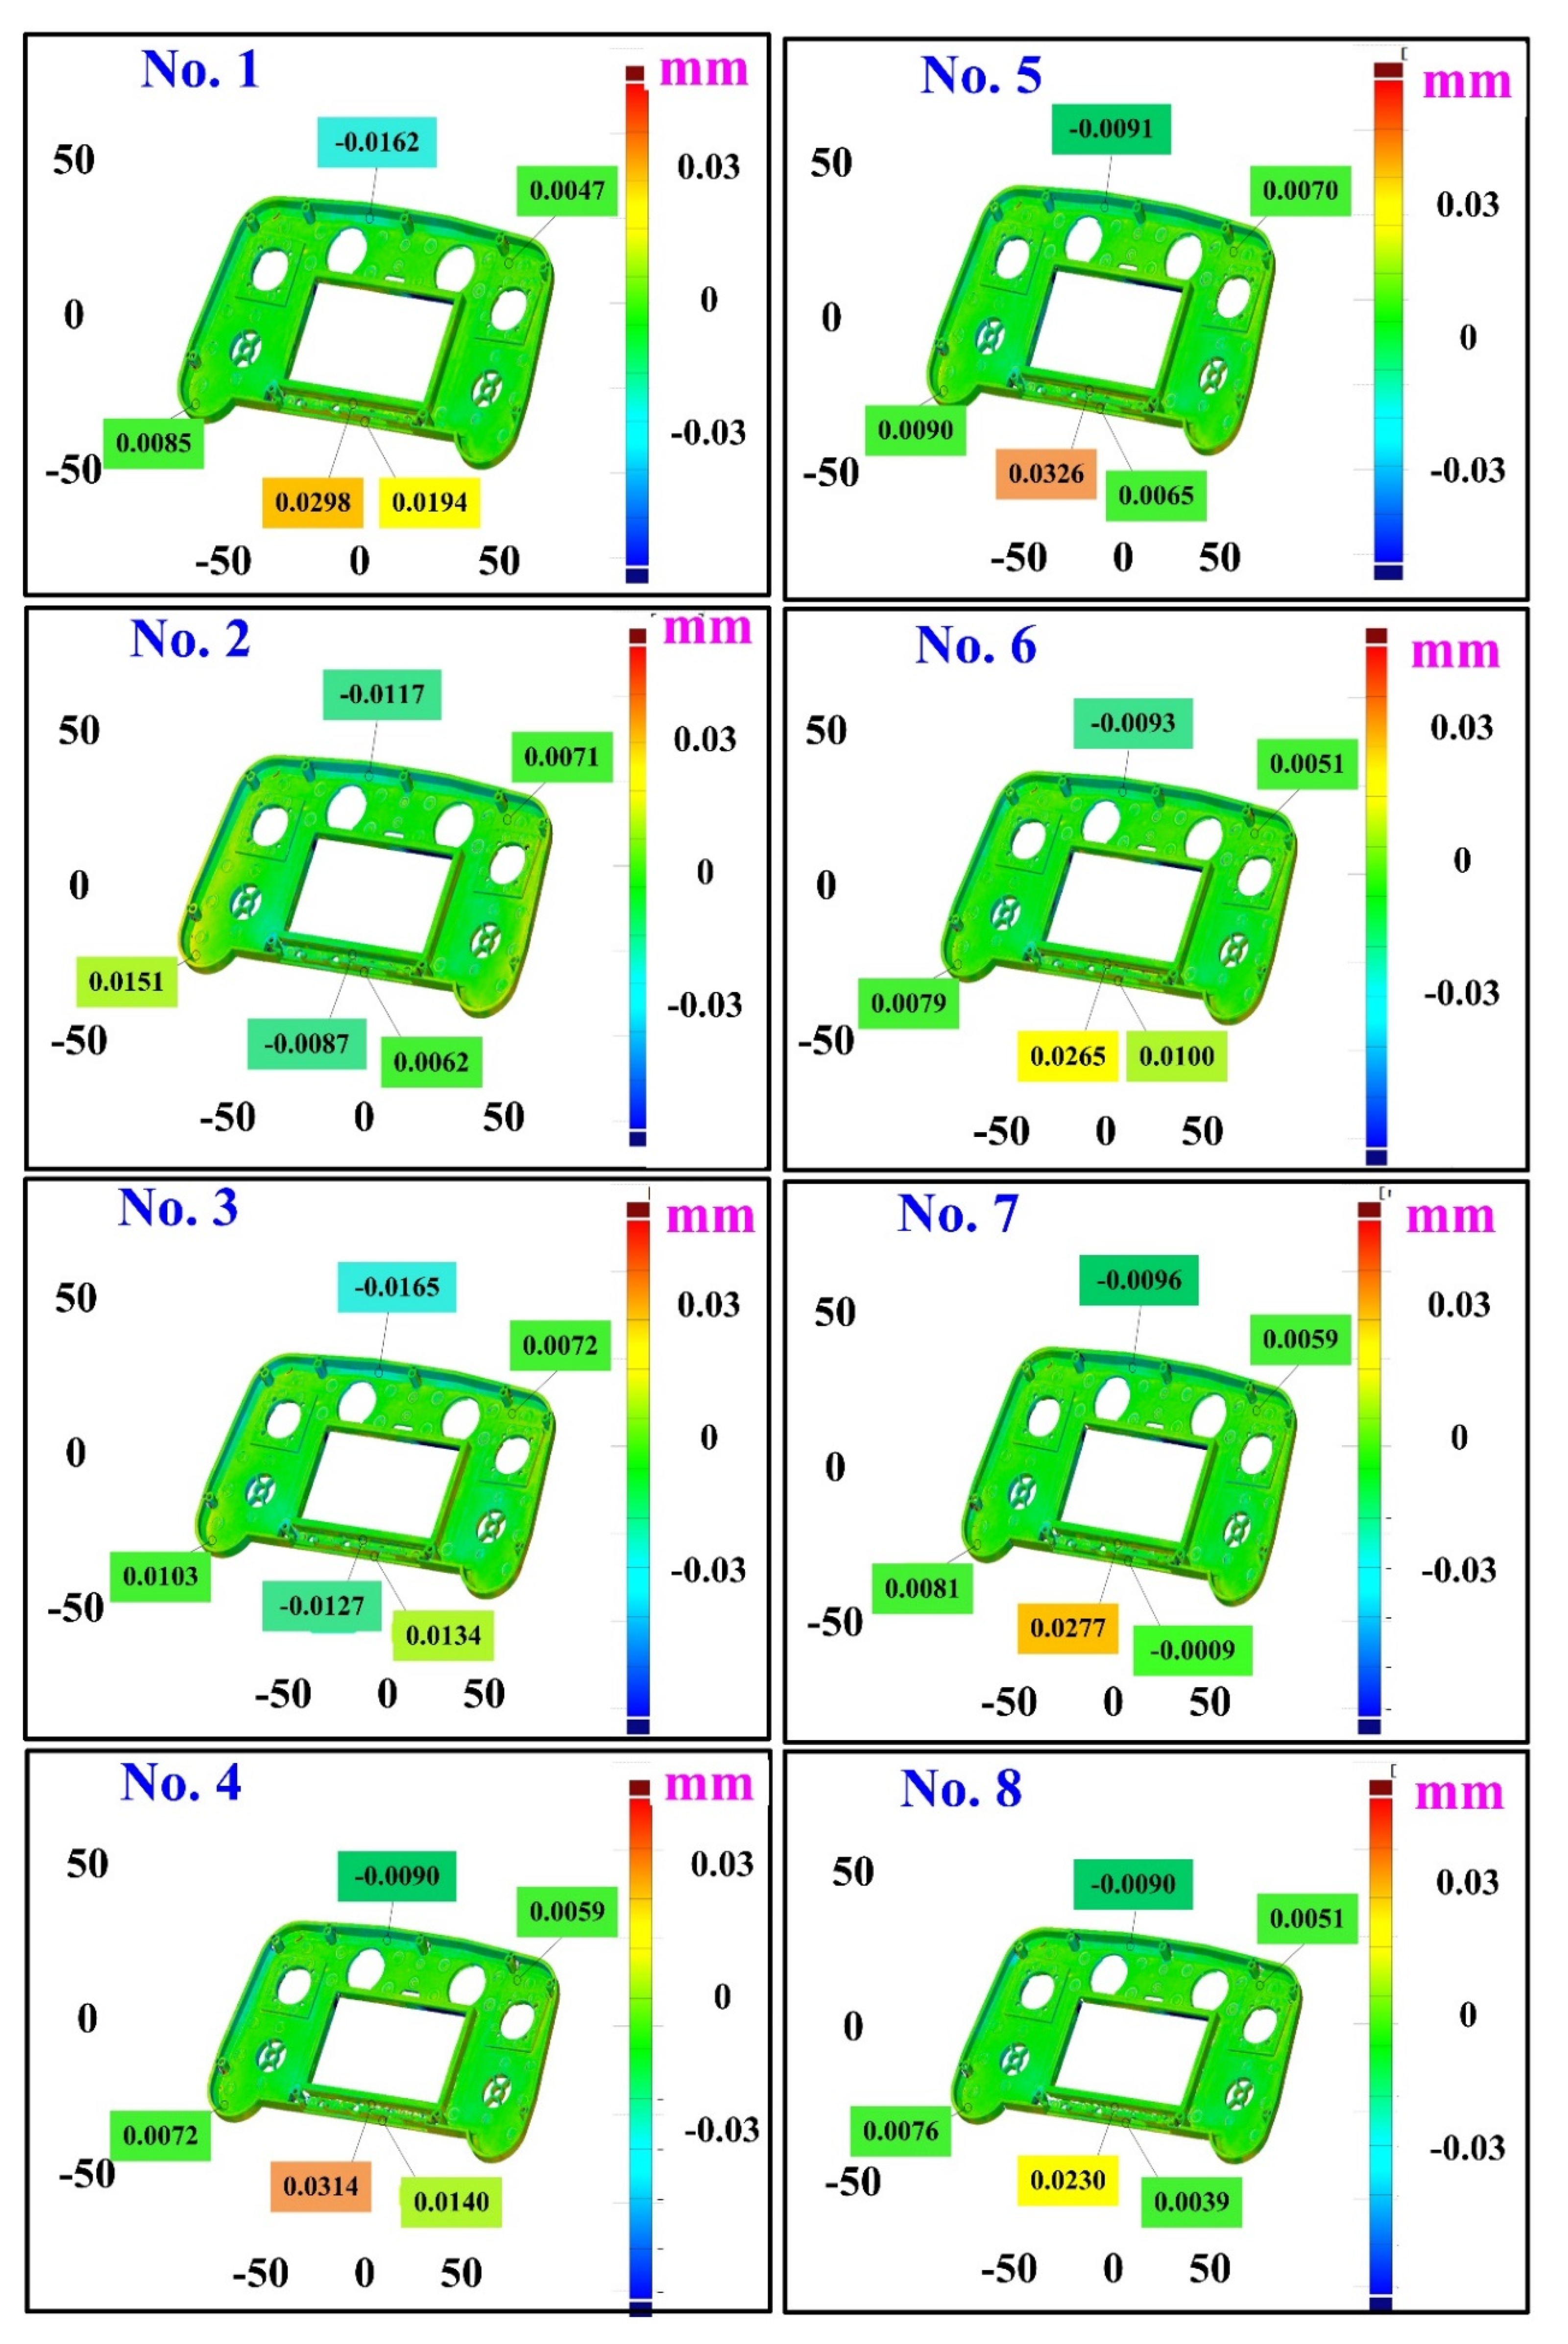
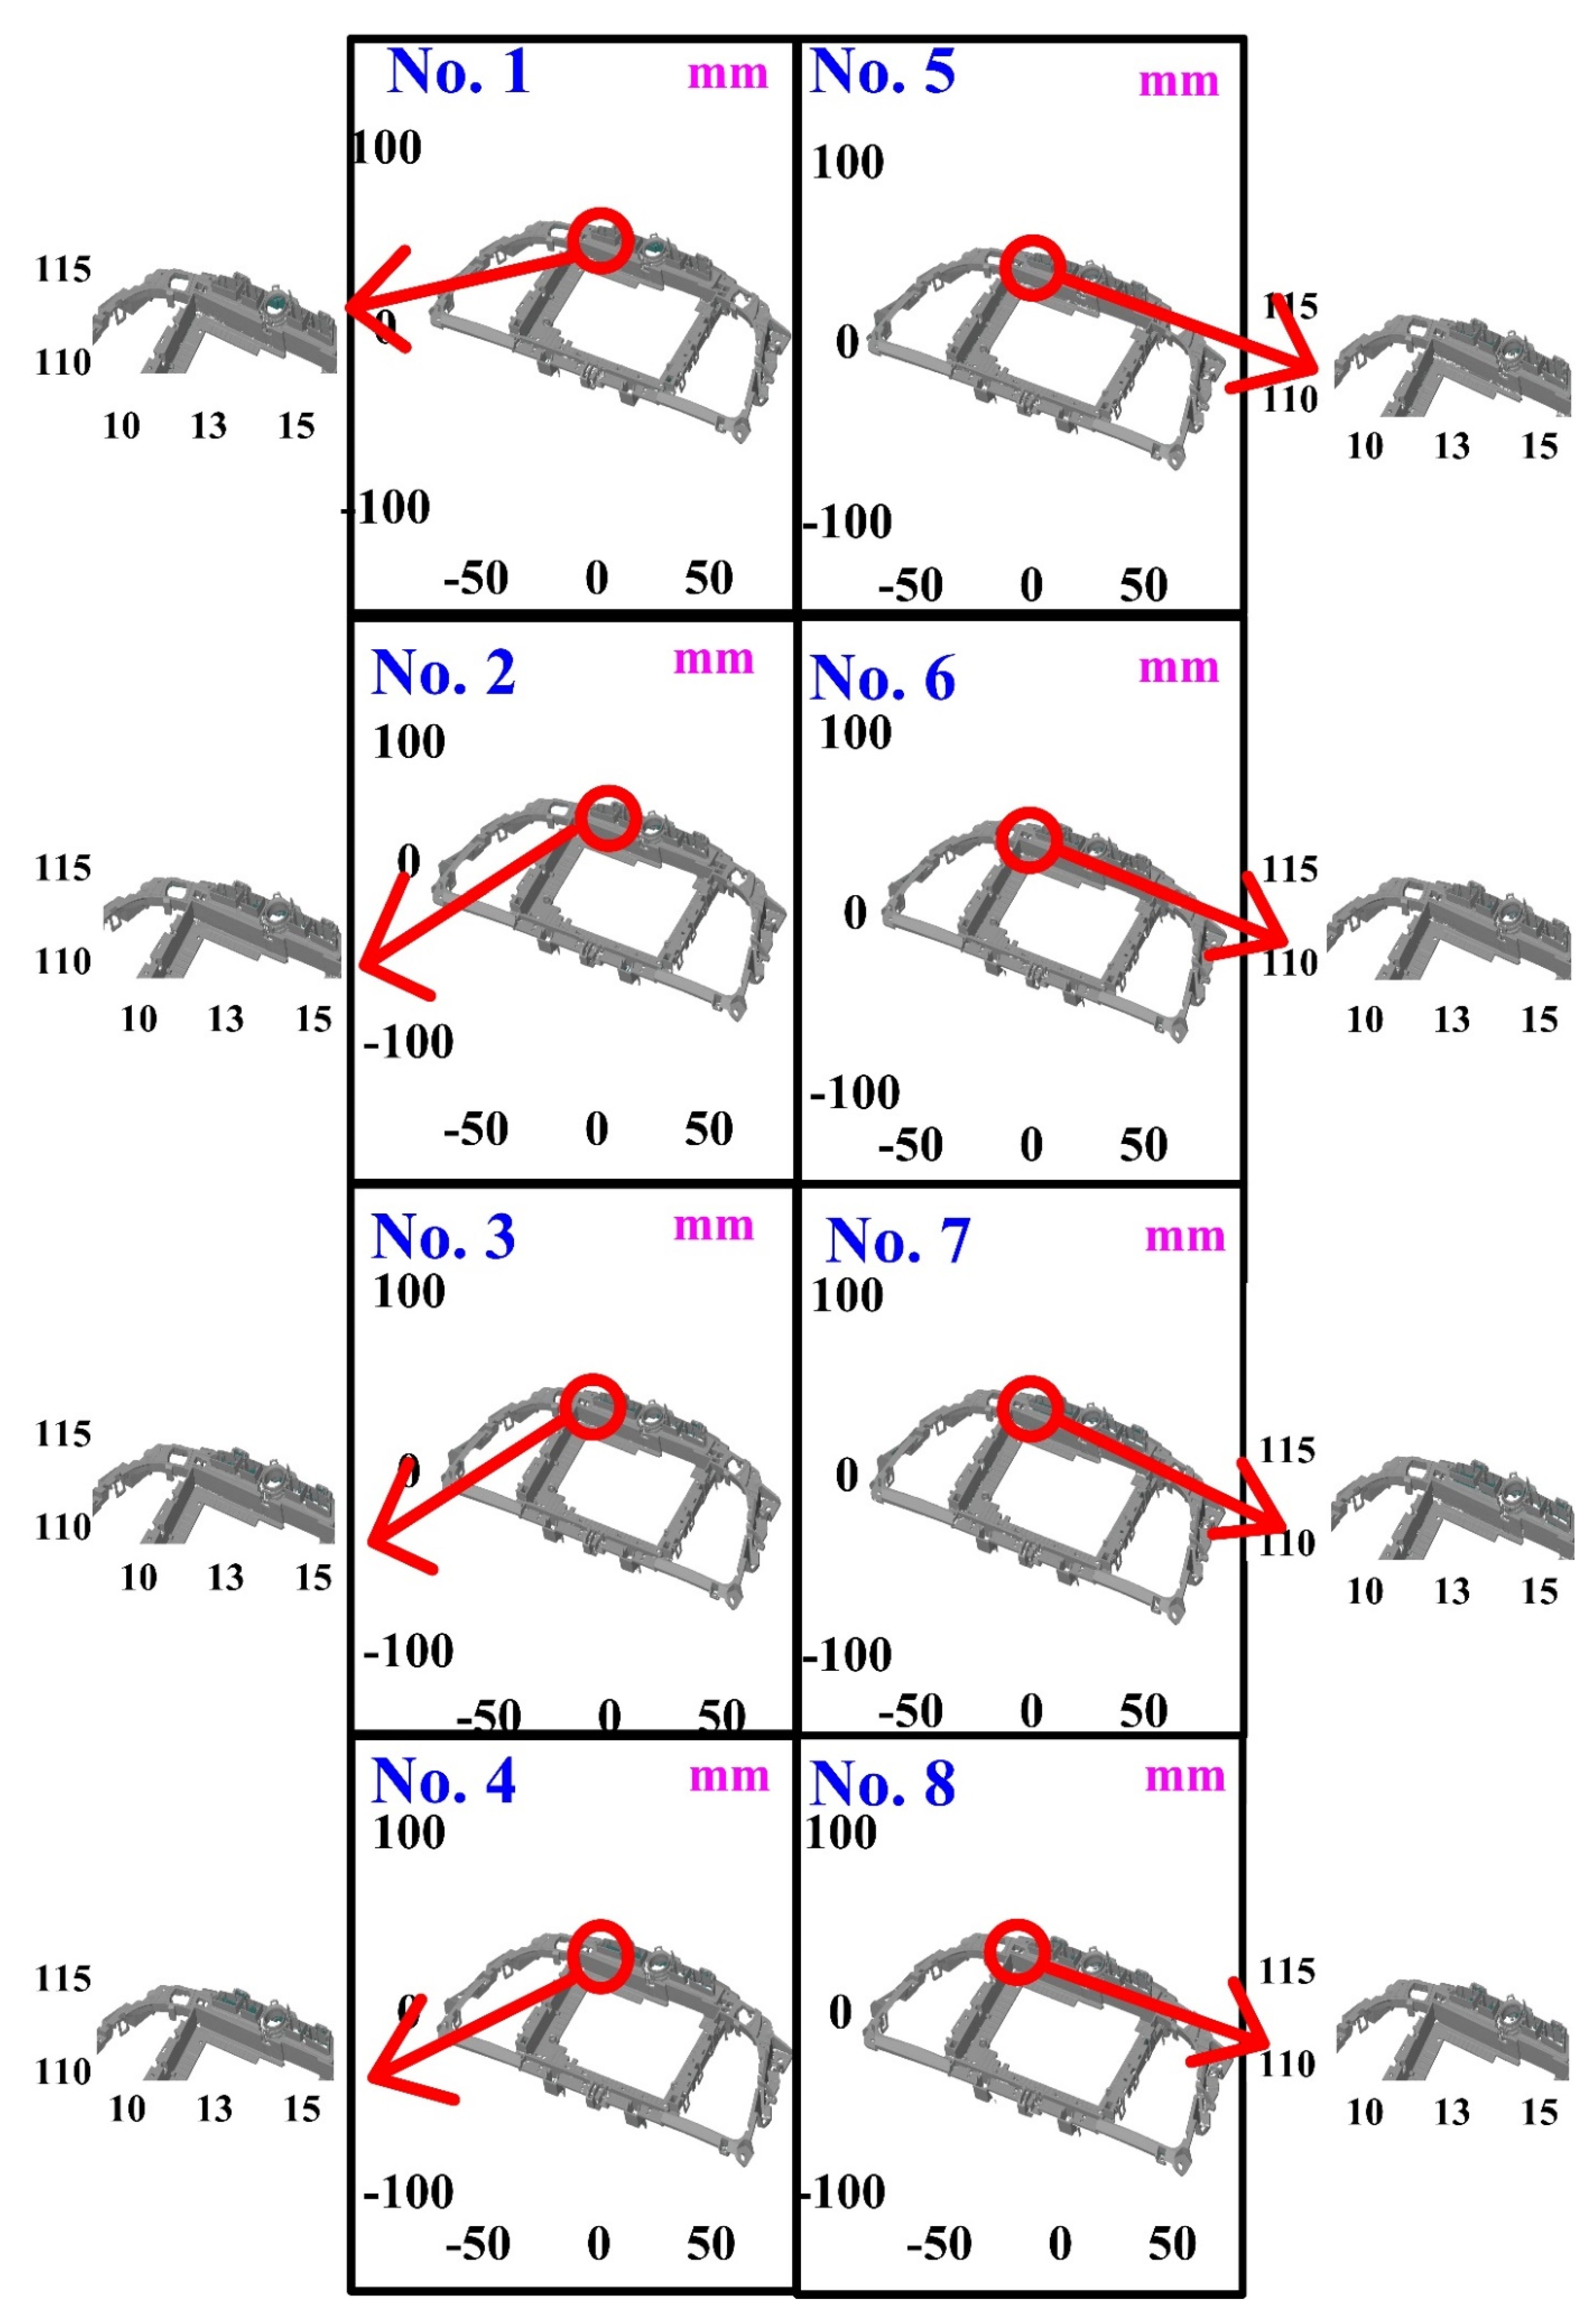
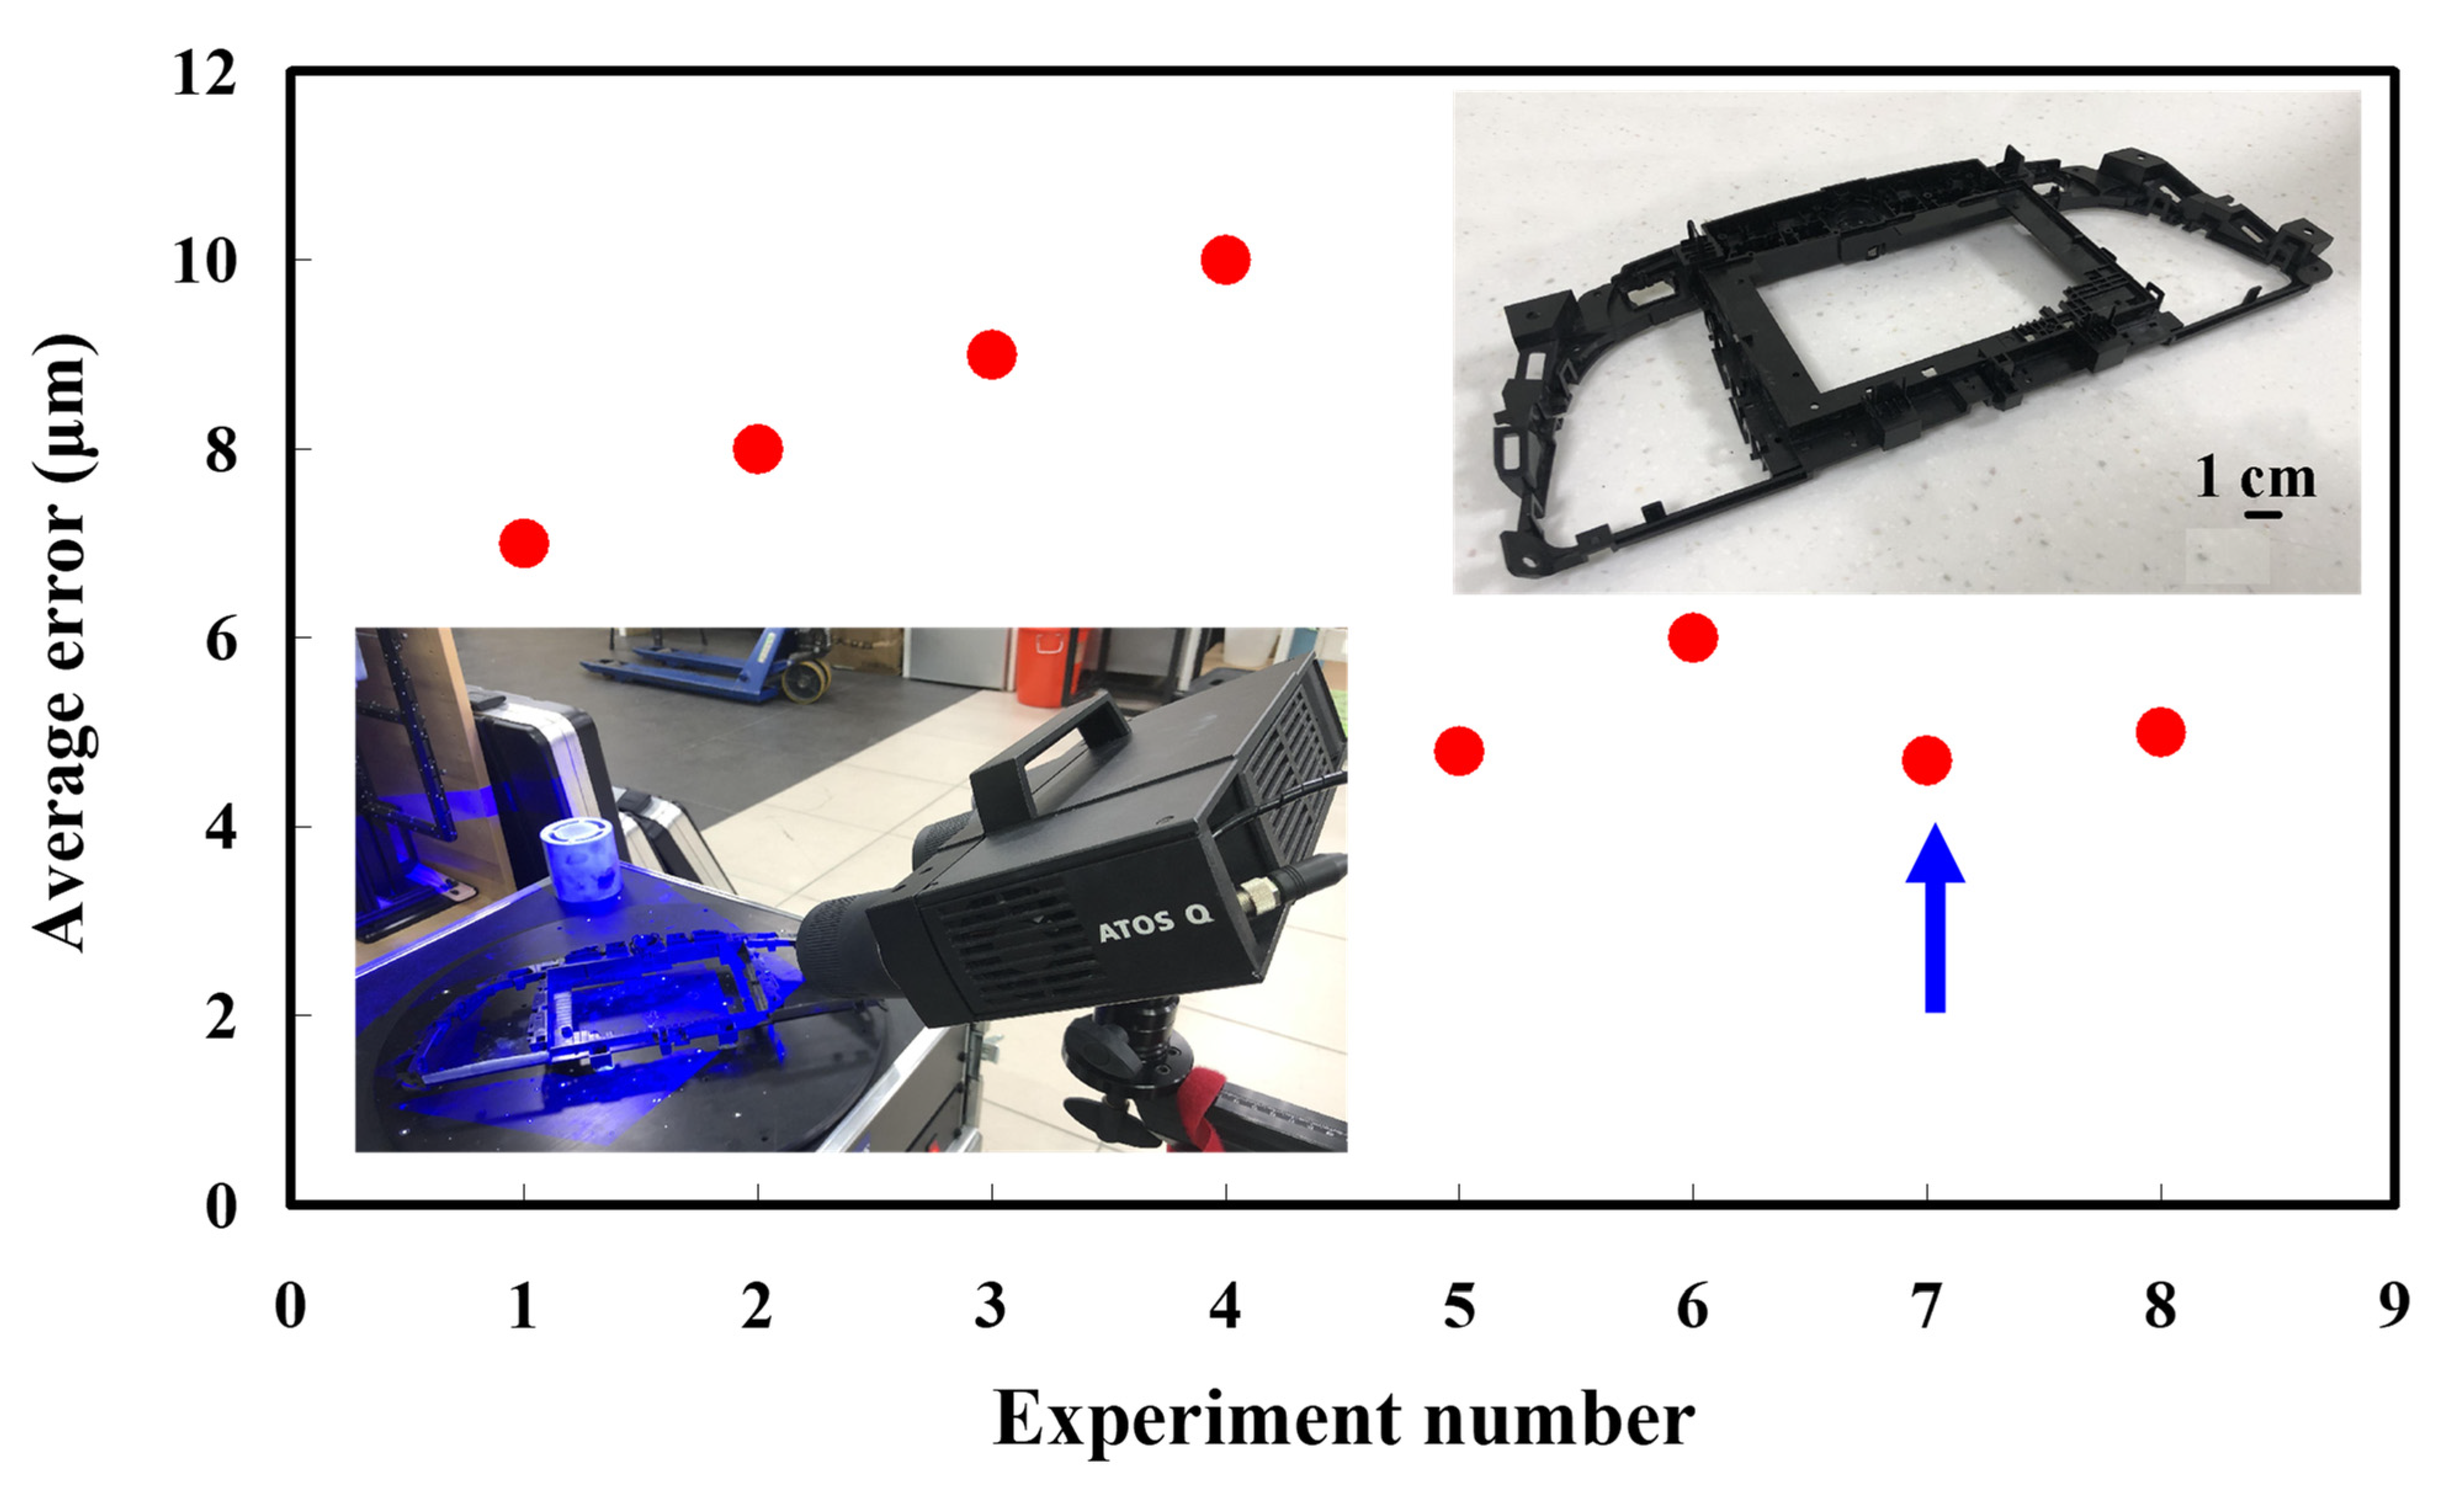
| No. | Resolution | Data Quality | Scan Area | Ambient Light | Exposure Time |
|---|---|---|---|---|---|
| 1 | Full resolution | More point | Scan all | ON | One |
| 2 | Full resolution | More point | Scan all | ON | Two |
| 3 | Full resolution | More point | Reflection detection | ON | One |
| 4 | Full resolution | More point | Reflection detection | ON | Two |
| 5 | Full resolution | More point | Scan all | OFF | One |
| 6 | Full resolution | More point | Scan all | OFF | Two |
| 7 | Full resolution | More point | Reflection detection | OFF | One |
| 8 | Full resolution | More point | Reflection detection | OFF | Two |
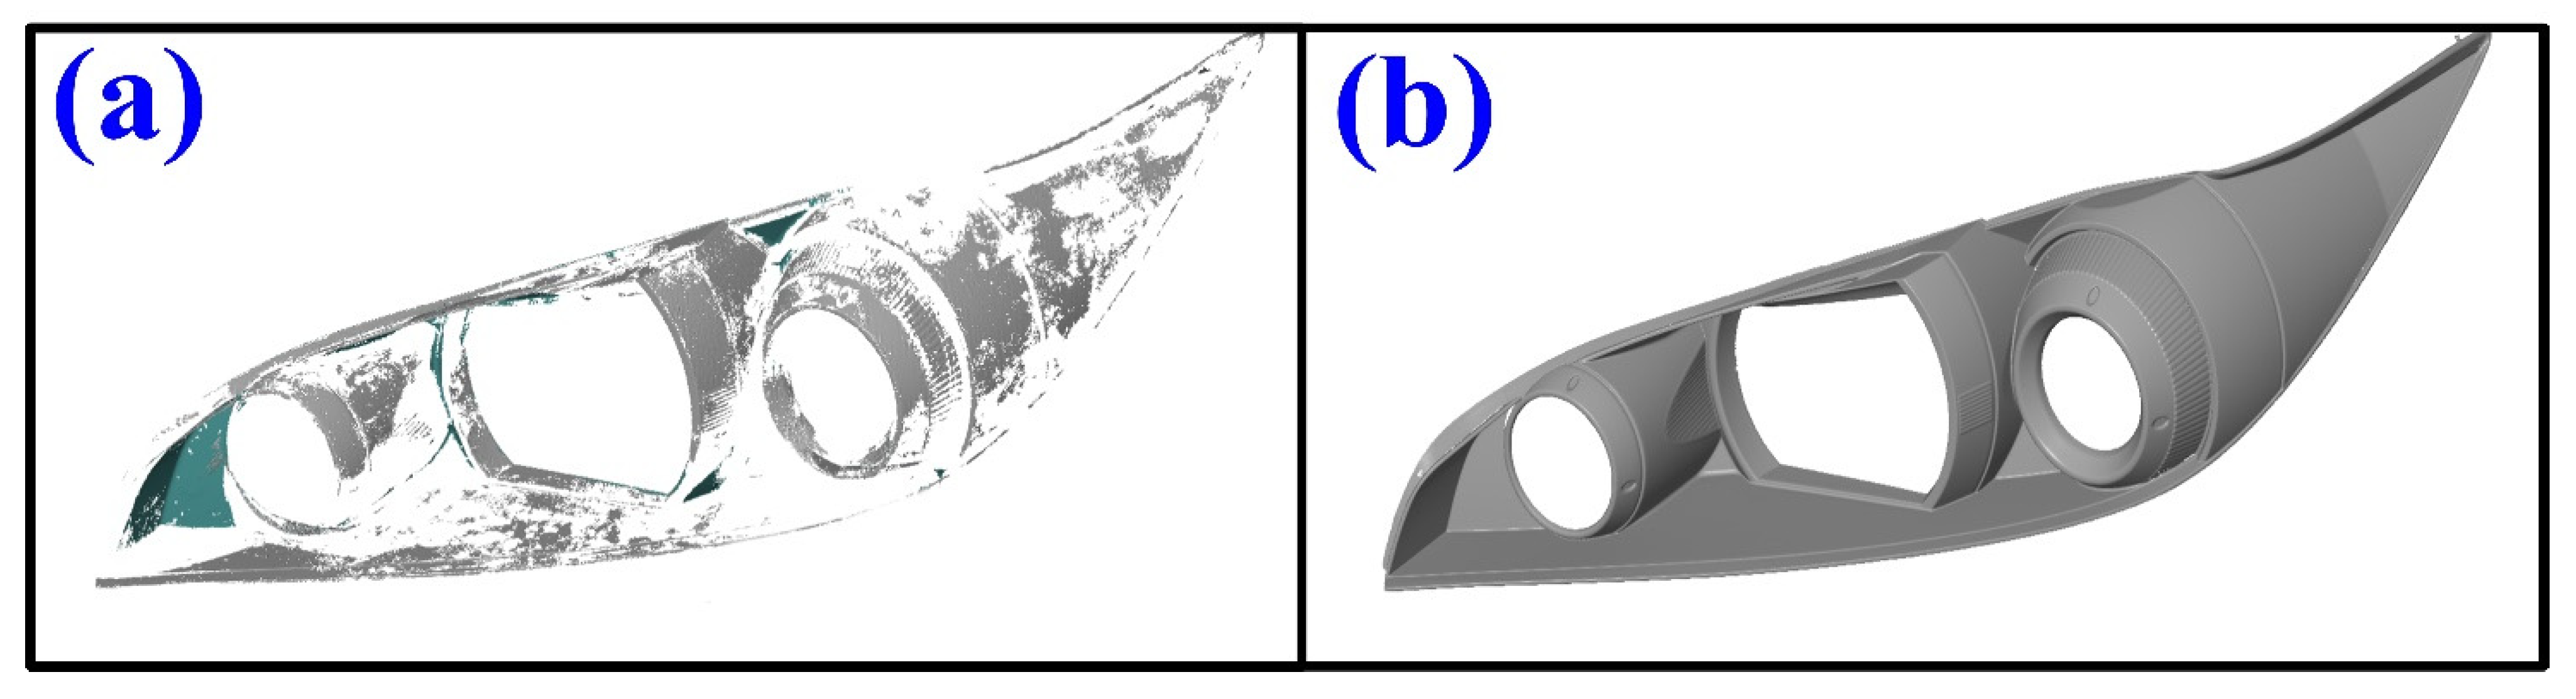
| No. | Measurement Objects | Characteristics of Measurement Objects |
|---|---|---|
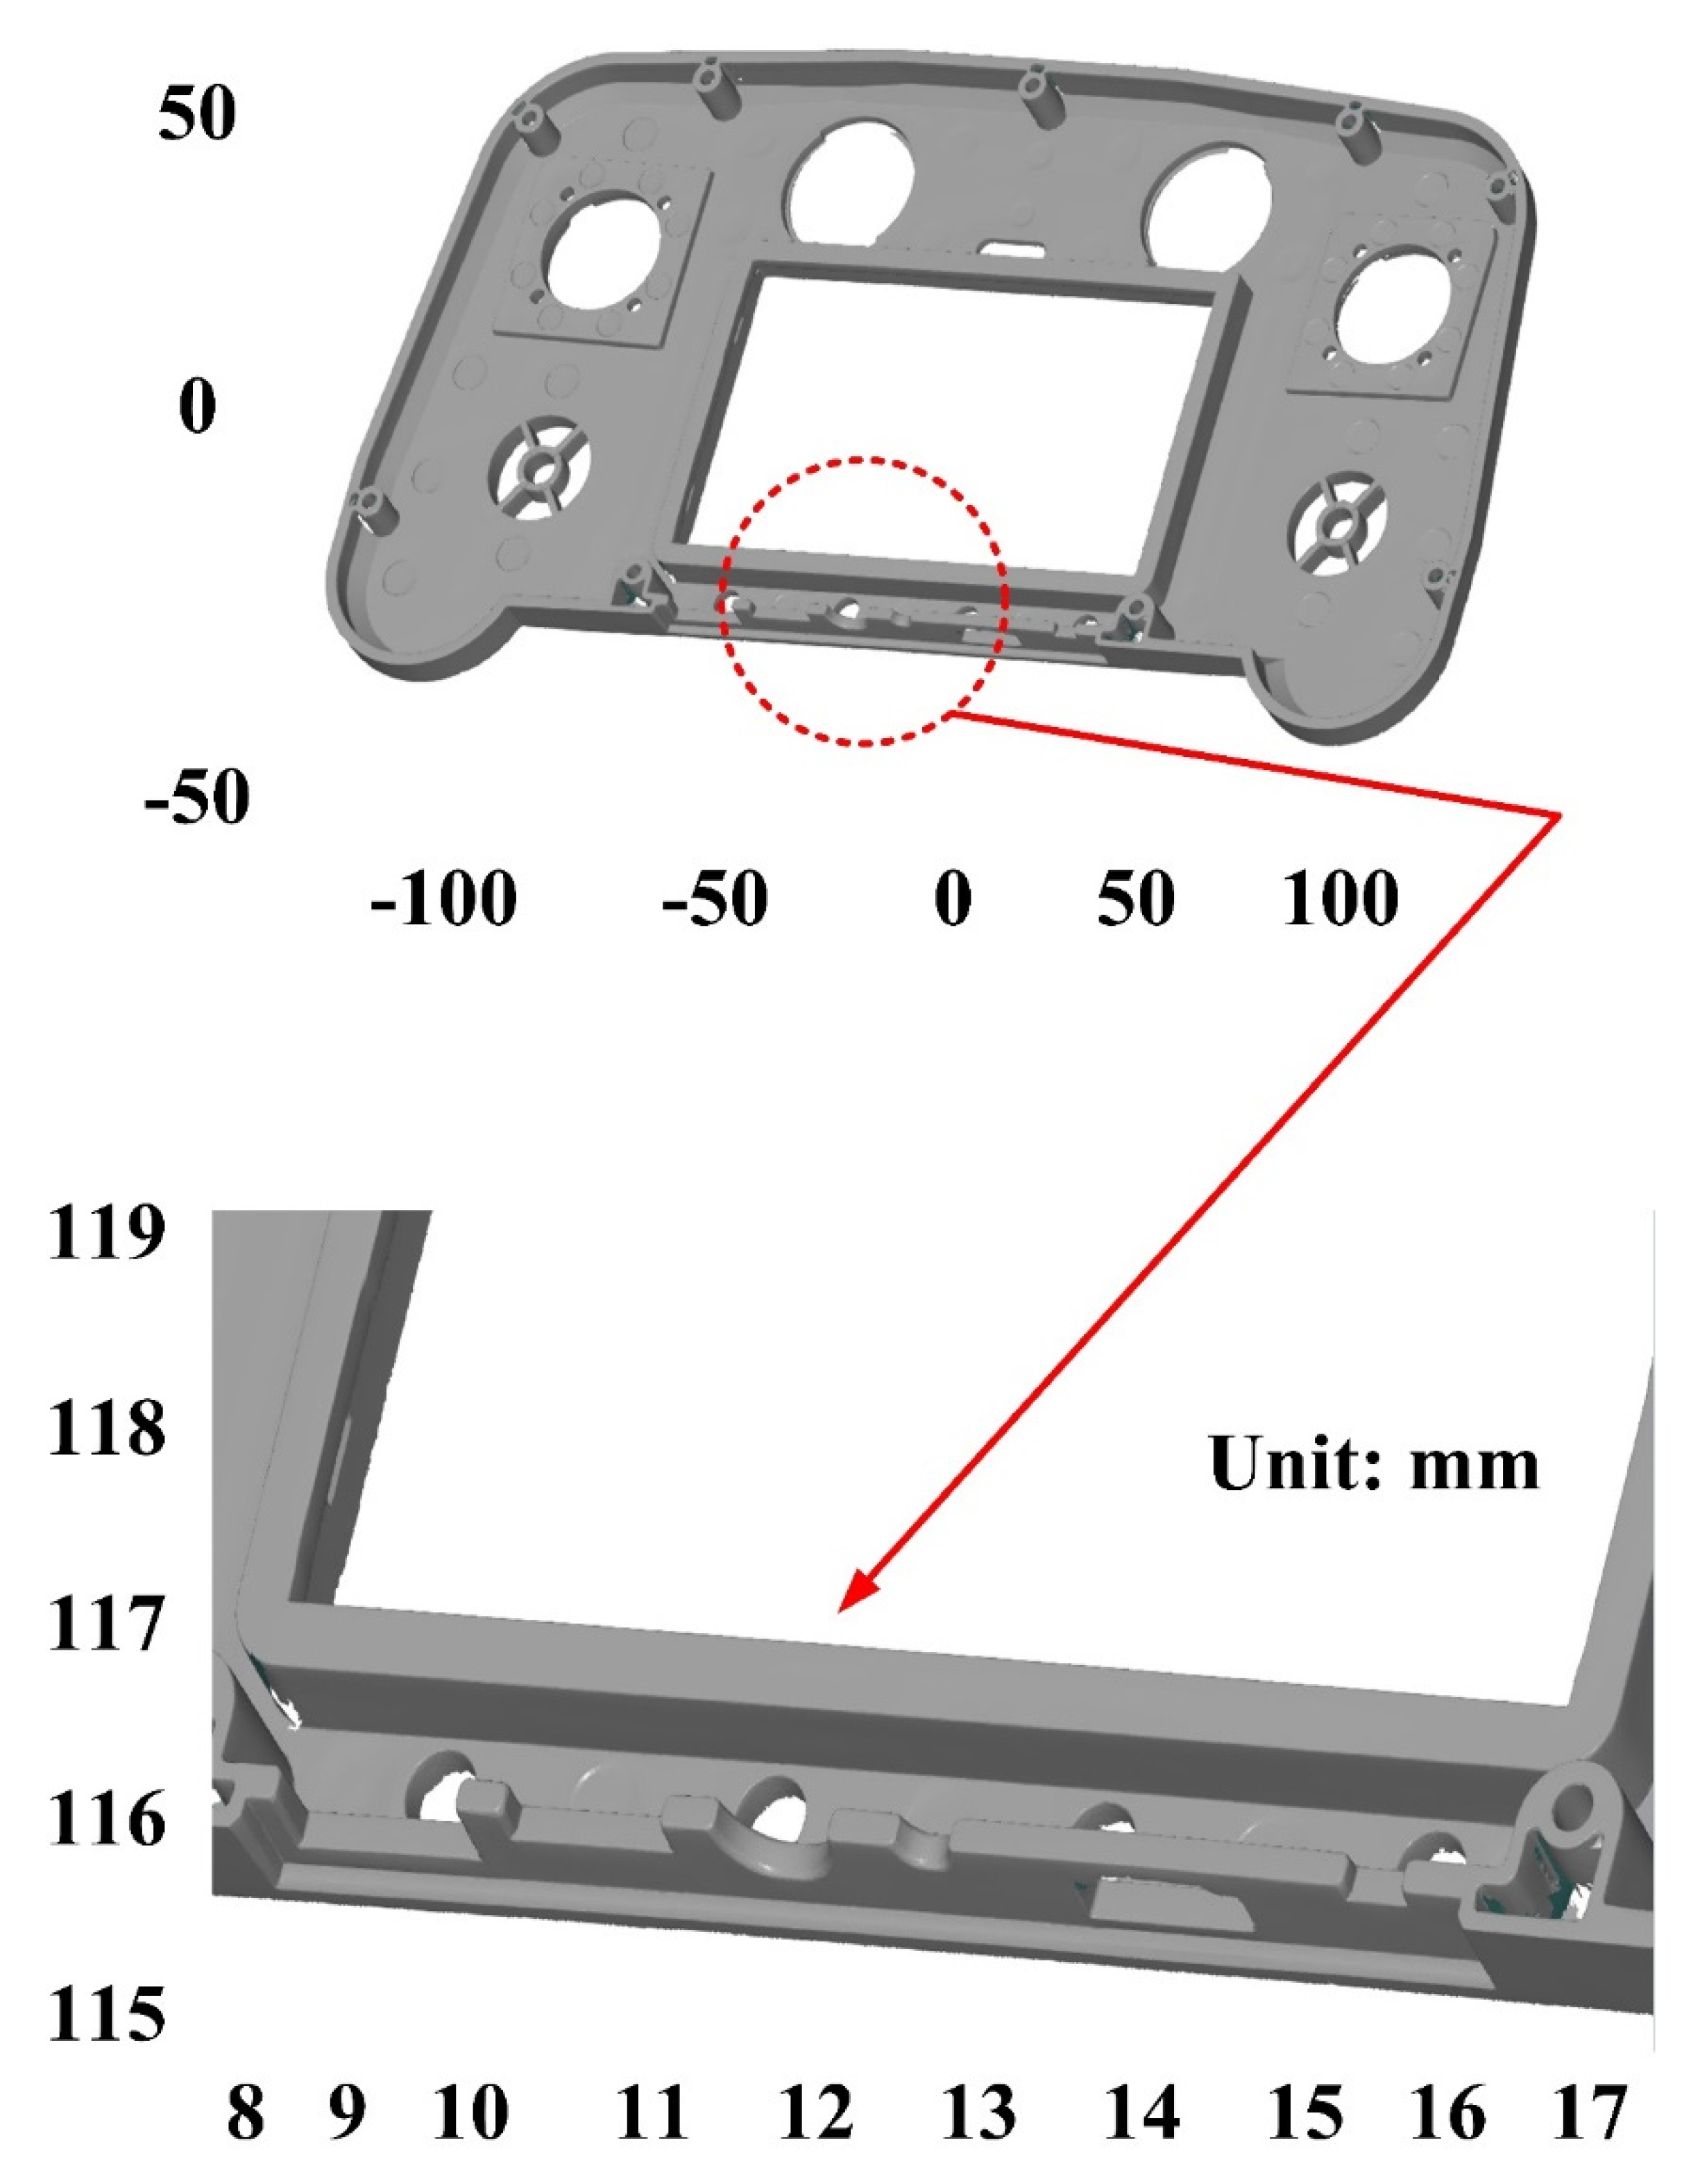
| 1 | Light-colored plastic part | Light-colored plastic part has reflections but the brightness and area are less than those of dark-colored plastic parts |
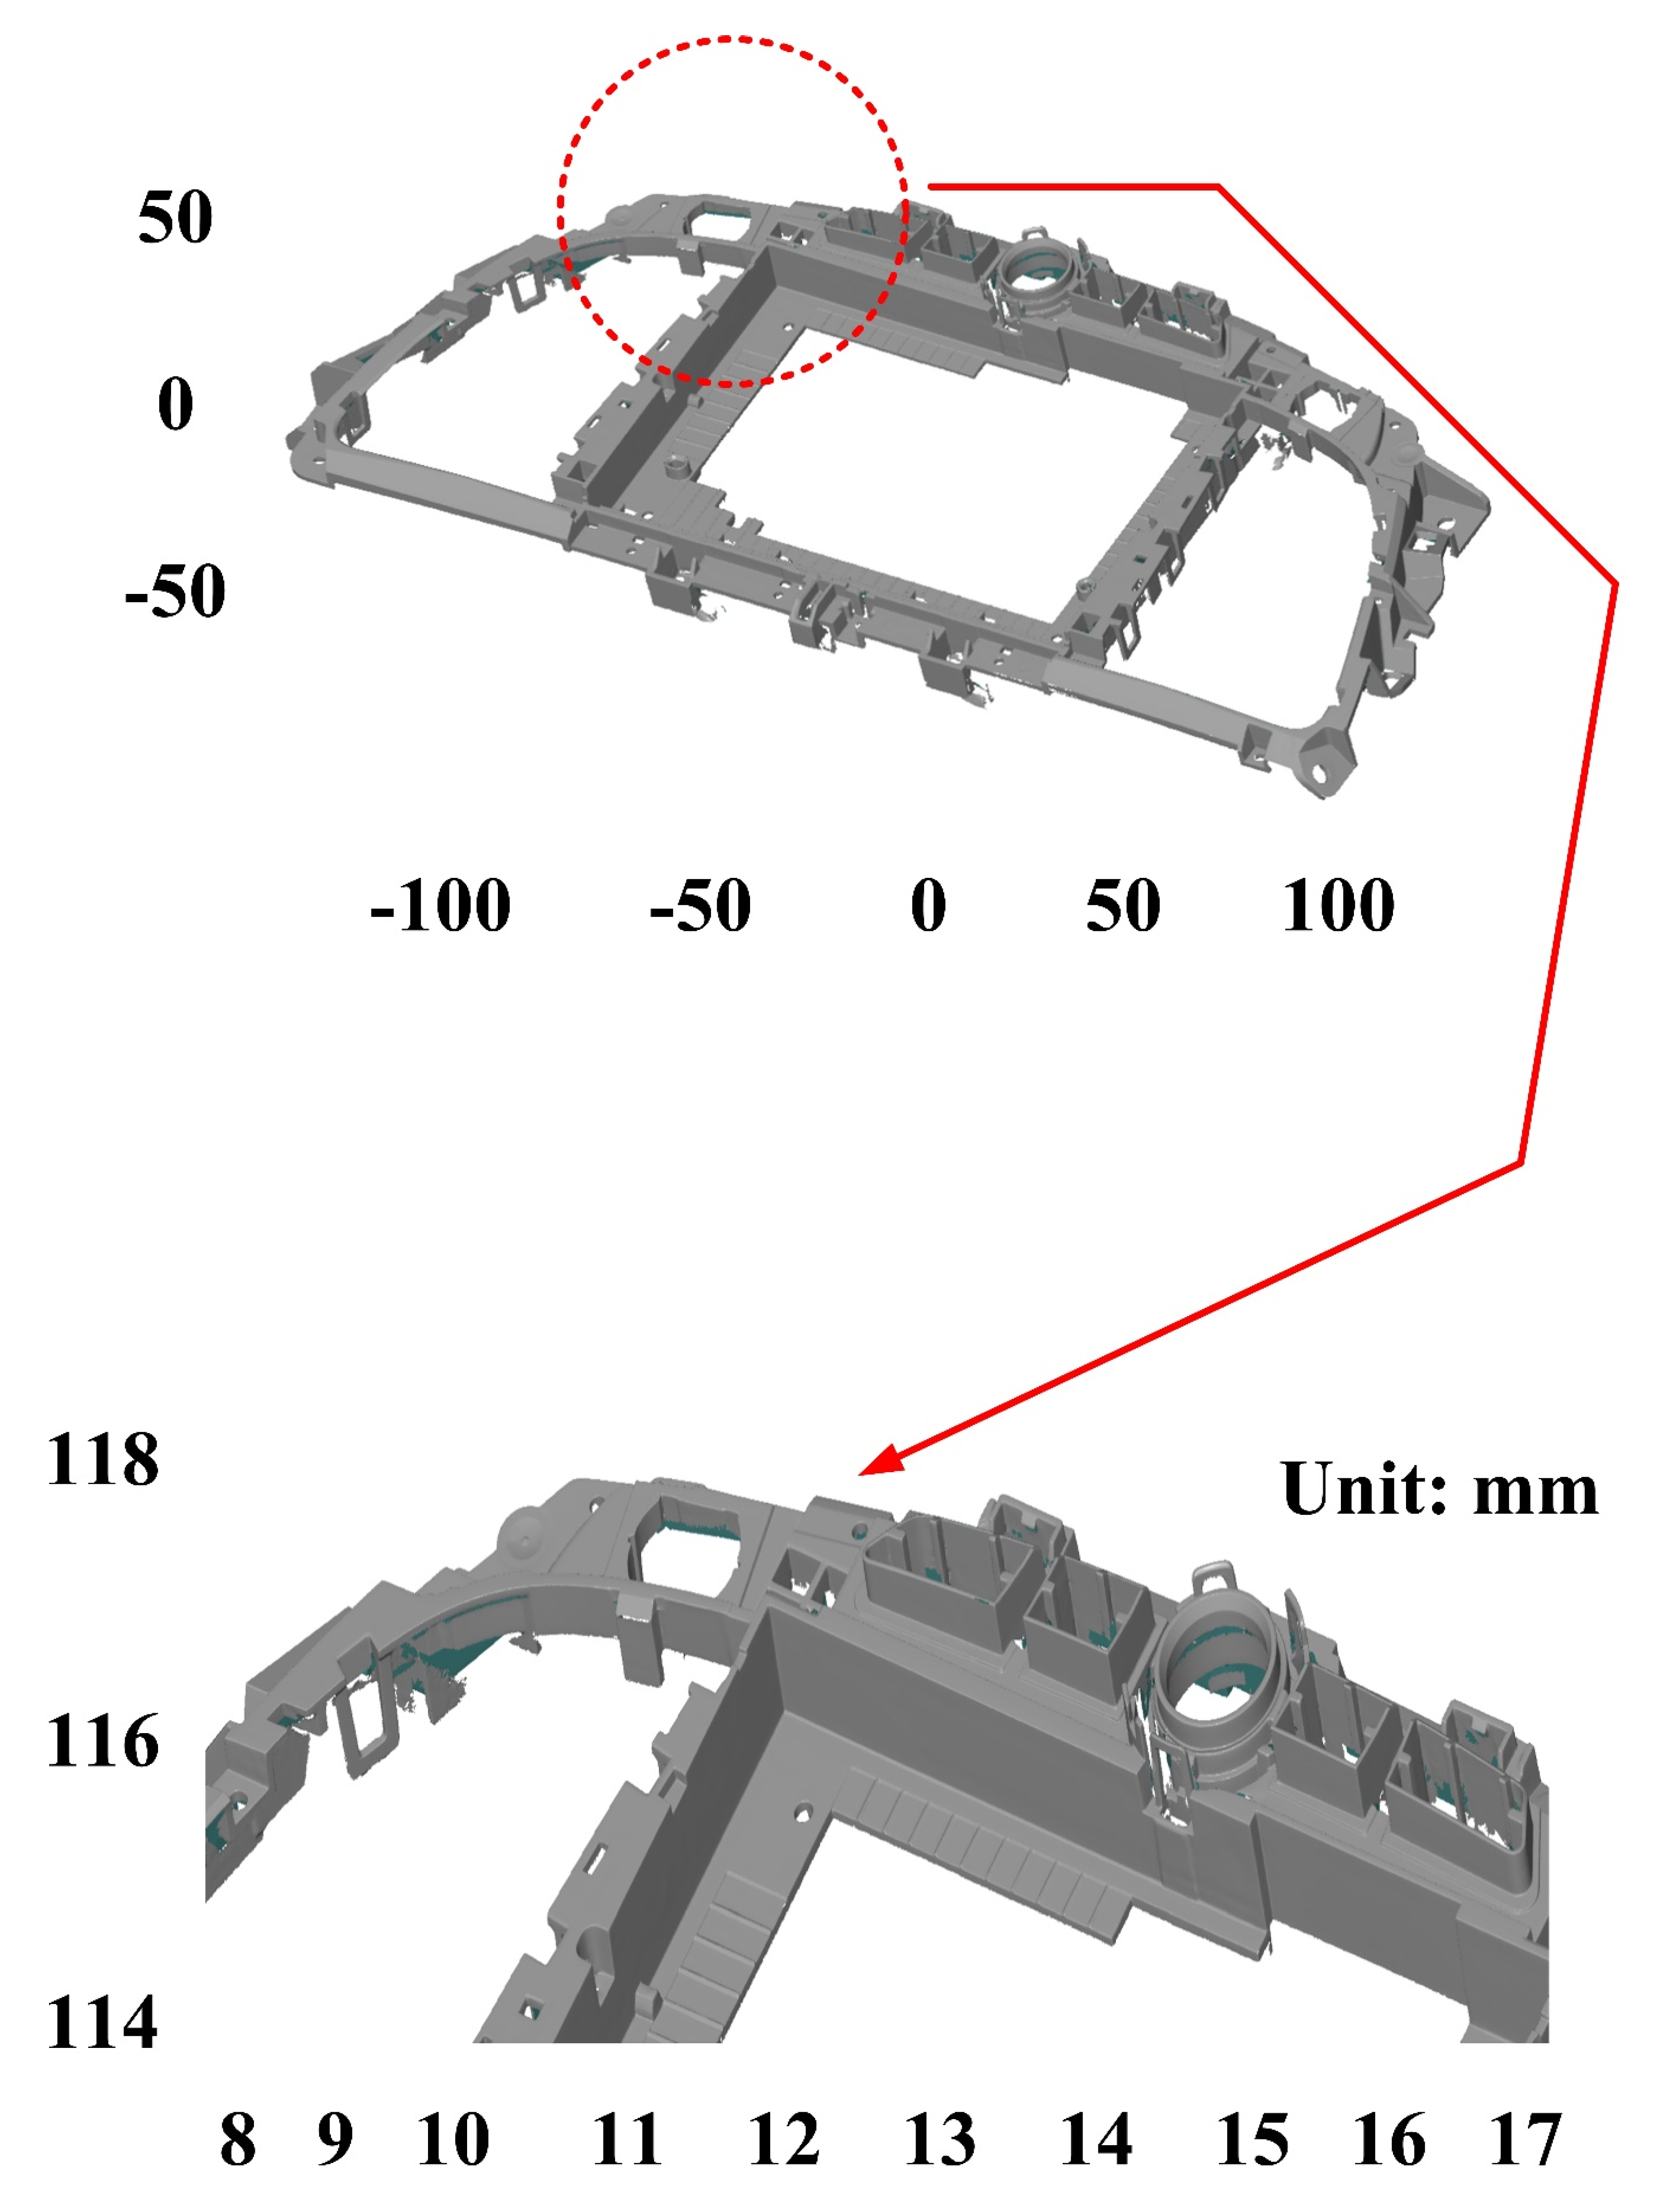
| 2 | Dark plastic part | Dark plastic part has reflections but the brightness and area are more than light-colored plastic parts |
| Measurement Objects | Method | Optical Measurement Parameters | Average Size Error (µm) |
|---|---|---|---|
| Light-colored plastic part | 4 | Full resolution, more point, reflection detection on, ambient light on, and two exposure times | 3 |
| Dark plastic part | 7 | Full resolution, more point, reflection detection on, ambient light off, and one exposure time | 4.7 |
Publisher’s Note: MDPI stays neutral with regard to jurisdictional claims in published maps and institutional affiliations. |
© 2022 by the authors. Licensee MDPI, Basel, Switzerland. This article is an open access article distributed under the terms and conditions of the Creative Commons Attribution (CC BY) license (https://creativecommons.org/licenses/by/4.0/).
Share and Cite
Kuo, C.-C.; He, Z.-Y.; Lee, C.-X. An Environmentally-Friendly Three-Dimensional Computer-Aided Verification Technique for Plastic Parts. Polymers 2022, 14, 2996. https://doi.org/10.3390/polym14152996
Kuo C-C, He Z-Y, Lee C-X. An Environmentally-Friendly Three-Dimensional Computer-Aided Verification Technique for Plastic Parts. Polymers. 2022; 14(15):2996. https://doi.org/10.3390/polym14152996
Chicago/Turabian StyleKuo, Chil-Chyuan, Zong-Yan He, and Chil-Xian Lee. 2022. "An Environmentally-Friendly Three-Dimensional Computer-Aided Verification Technique for Plastic Parts" Polymers 14, no. 15: 2996. https://doi.org/10.3390/polym14152996
APA StyleKuo, C.-C., He, Z.-Y., & Lee, C.-X. (2022). An Environmentally-Friendly Three-Dimensional Computer-Aided Verification Technique for Plastic Parts. Polymers, 14(15), 2996. https://doi.org/10.3390/polym14152996