
A Modified Langmuir Model for Moisture Diffusion in UGFRE of Composite Insulator Considering the Composite Degradation

 ,
, 
Abstract
:1. Introduction
2. Samples and Experiment
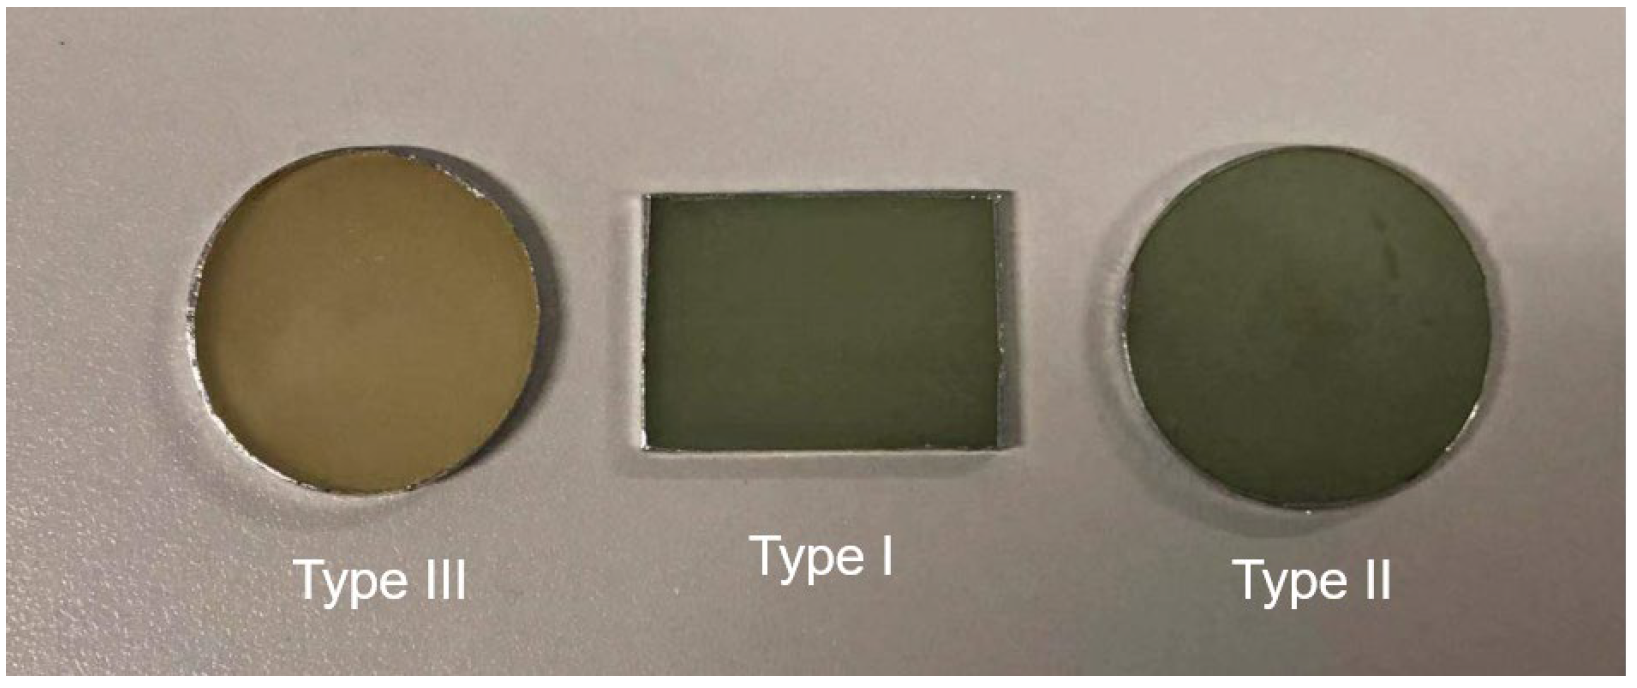
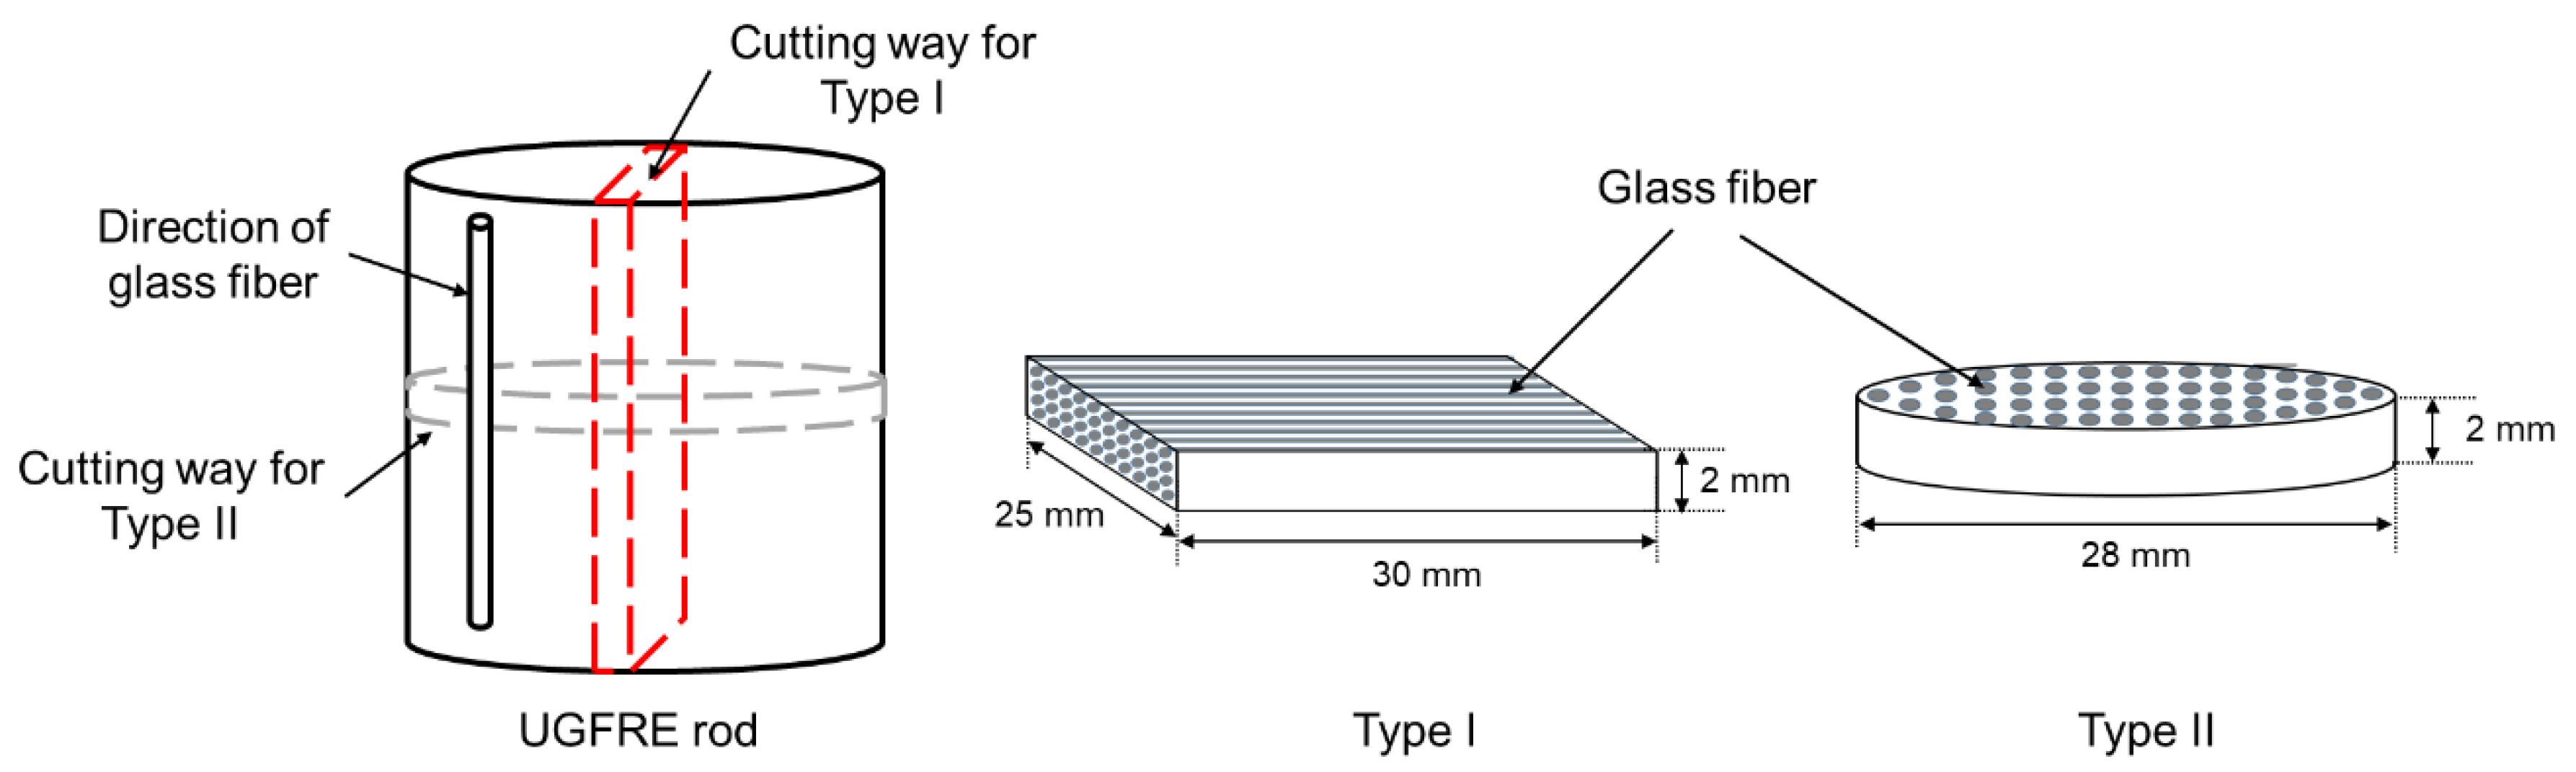
2.1. Samples
2.2. Experiment
3. Modified Langmuir Model Considering Composite Degradation
4. Results
5. Discussion
6. Conclusions
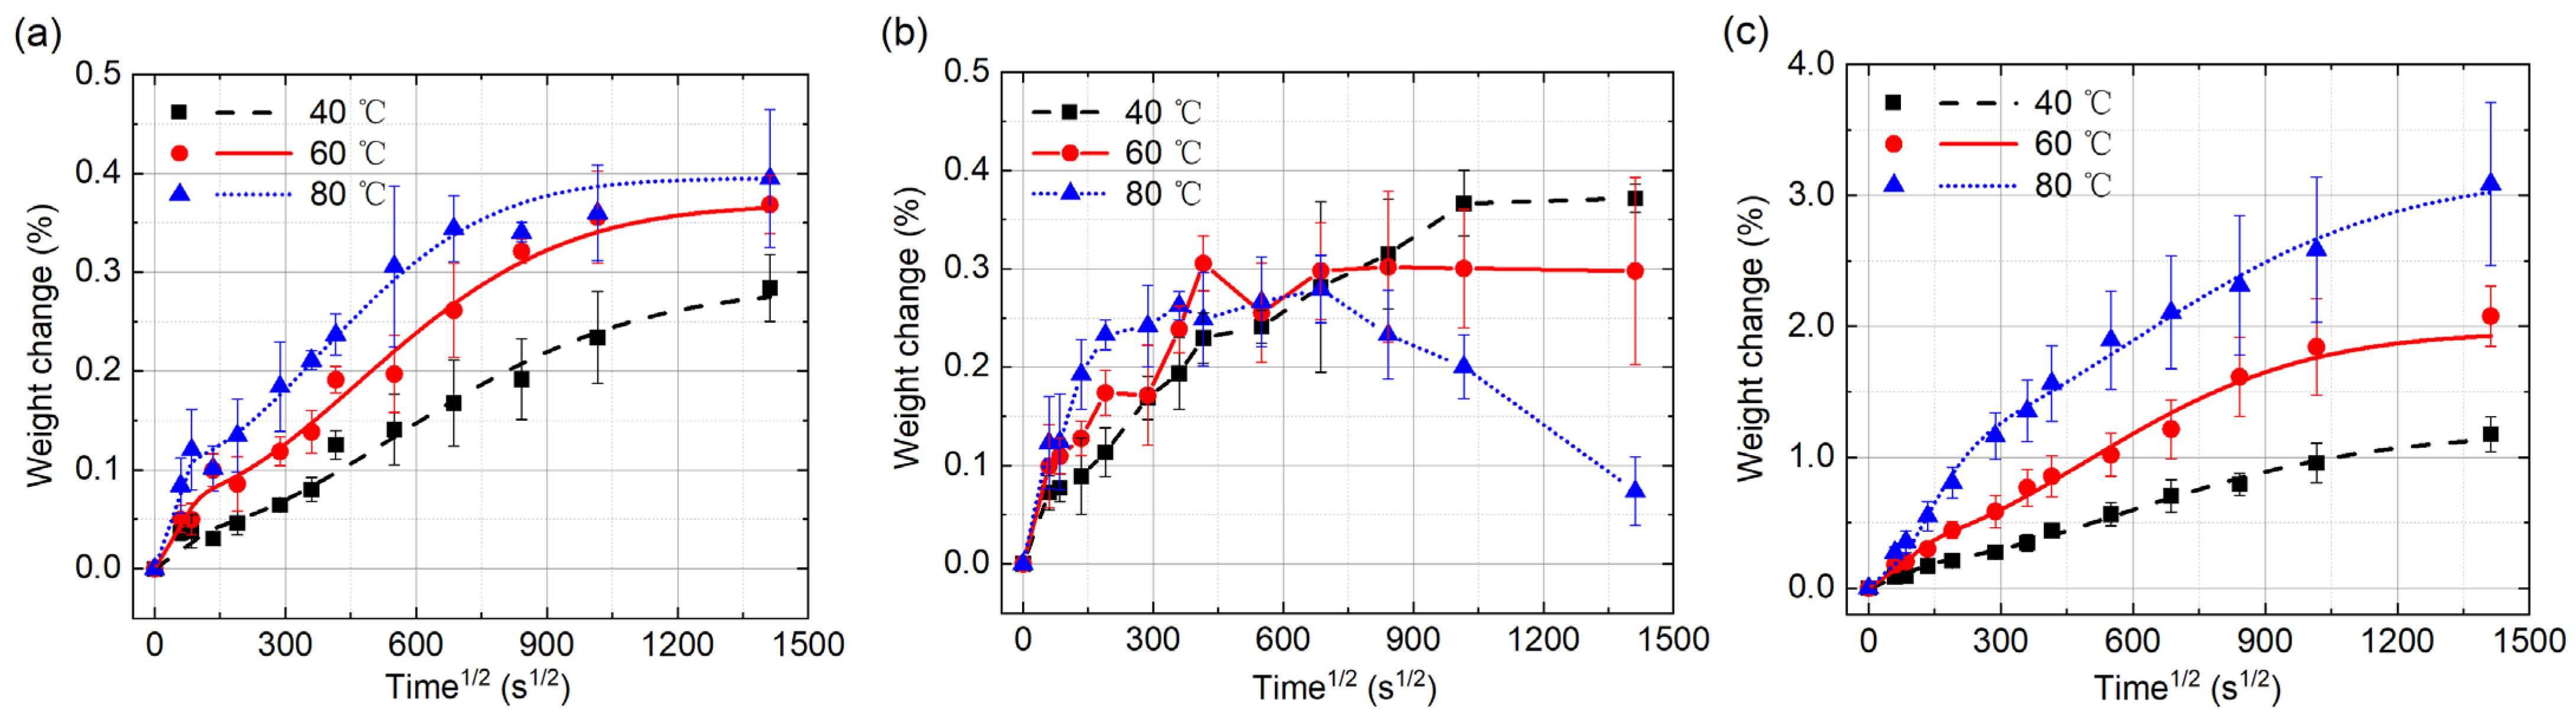
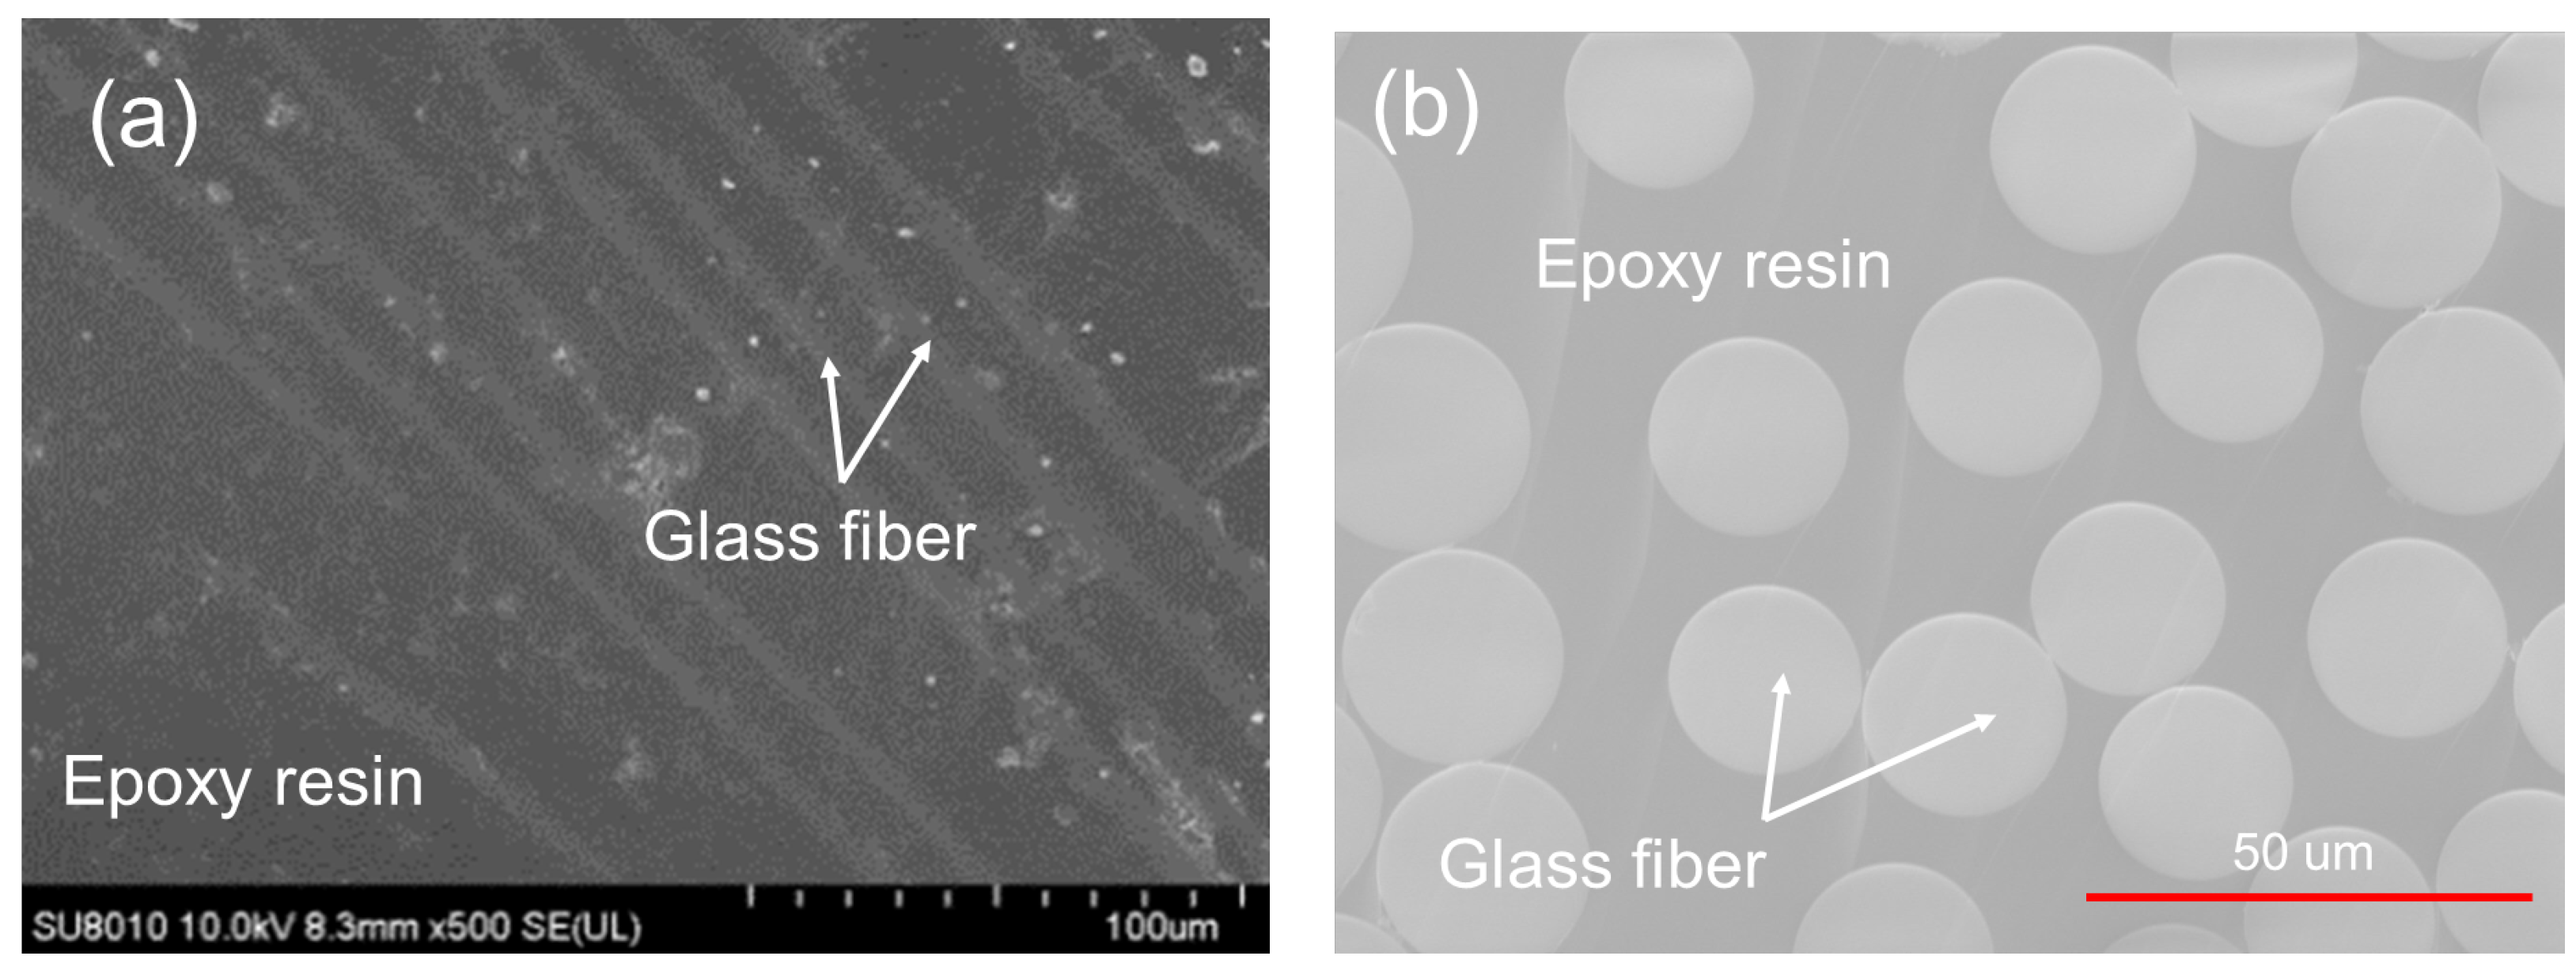
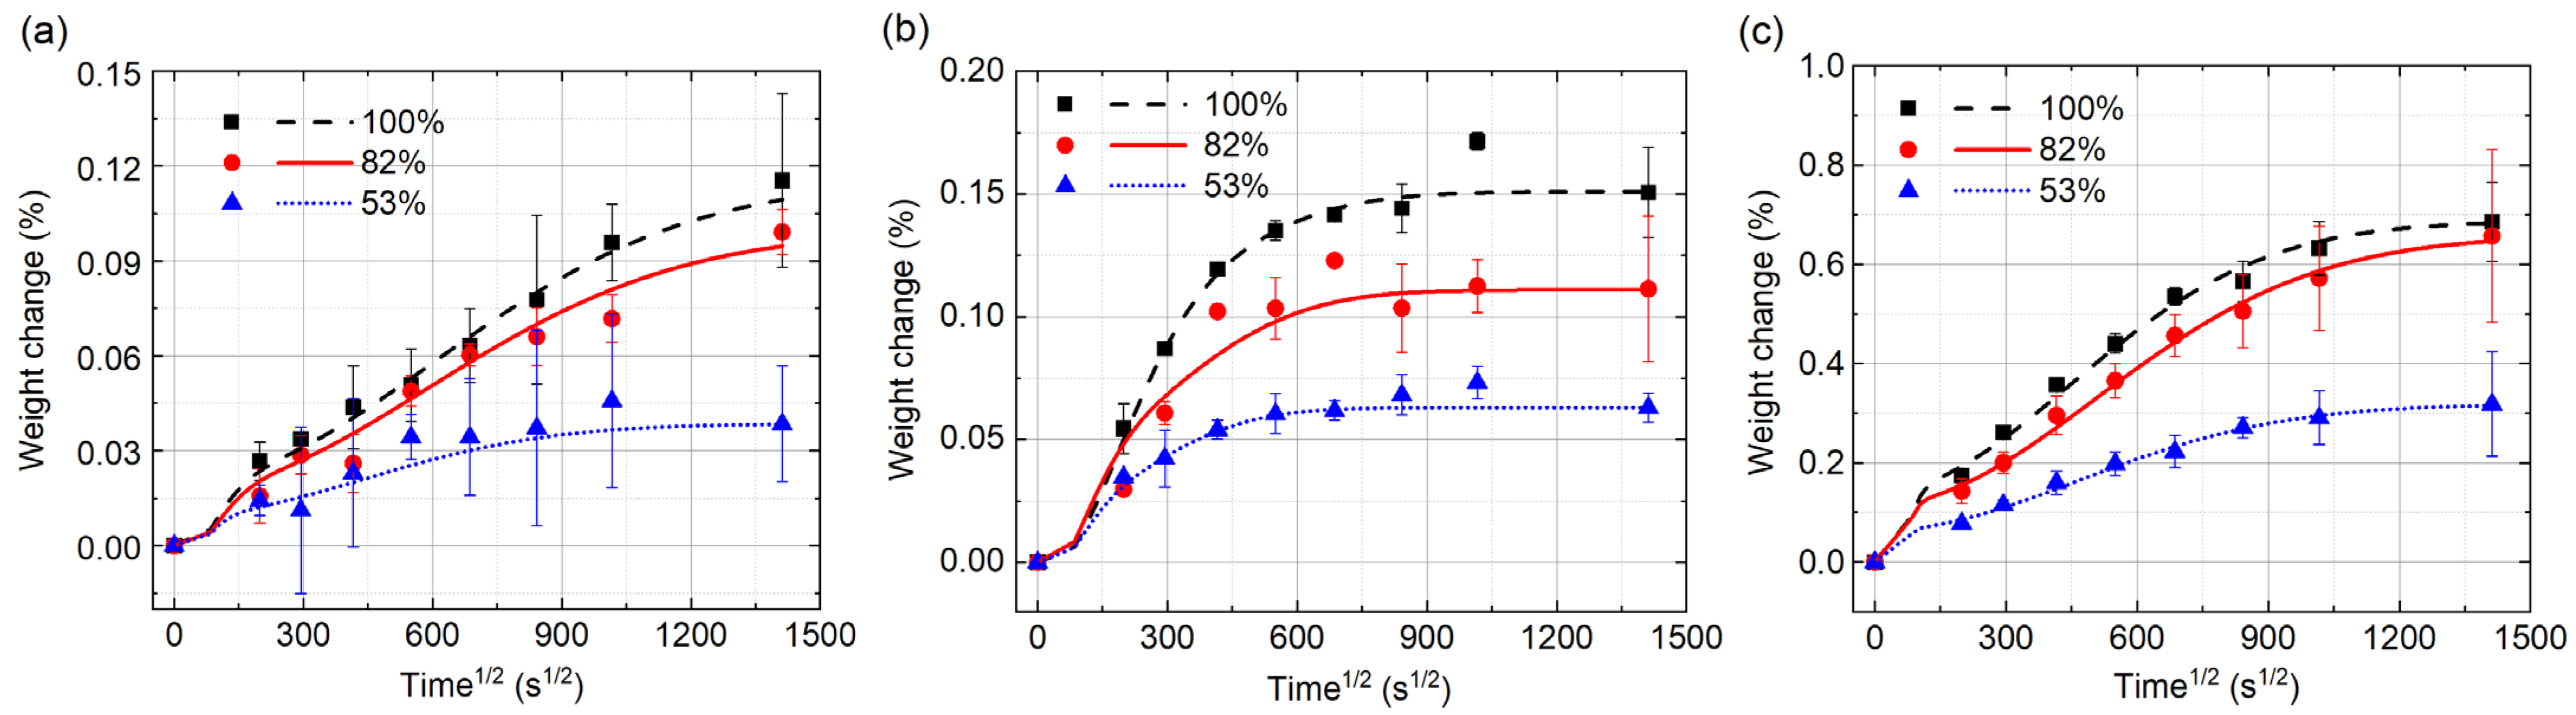
- The moisture diffusion of the UGFRE sample obeys the Langmuir diffusion law under the humidity conditions of 53%, 82% and 100% at 40 °C. With the increase of the humidity, the saturated moisture content and the time to reach the saturated state of UGFRE also increase. The glass fibers on the surface prevent the moisture from invading into the UGFRE sample by the direction which is vertical to the glass fiber. On the other hand, when the moisture invades the UGFRE sample parallelly with the glass fiber, the interfaces between the glass fibers and the epoxy resin will supply the new invading channels for moisture and accelerate the moisture absorption rate.
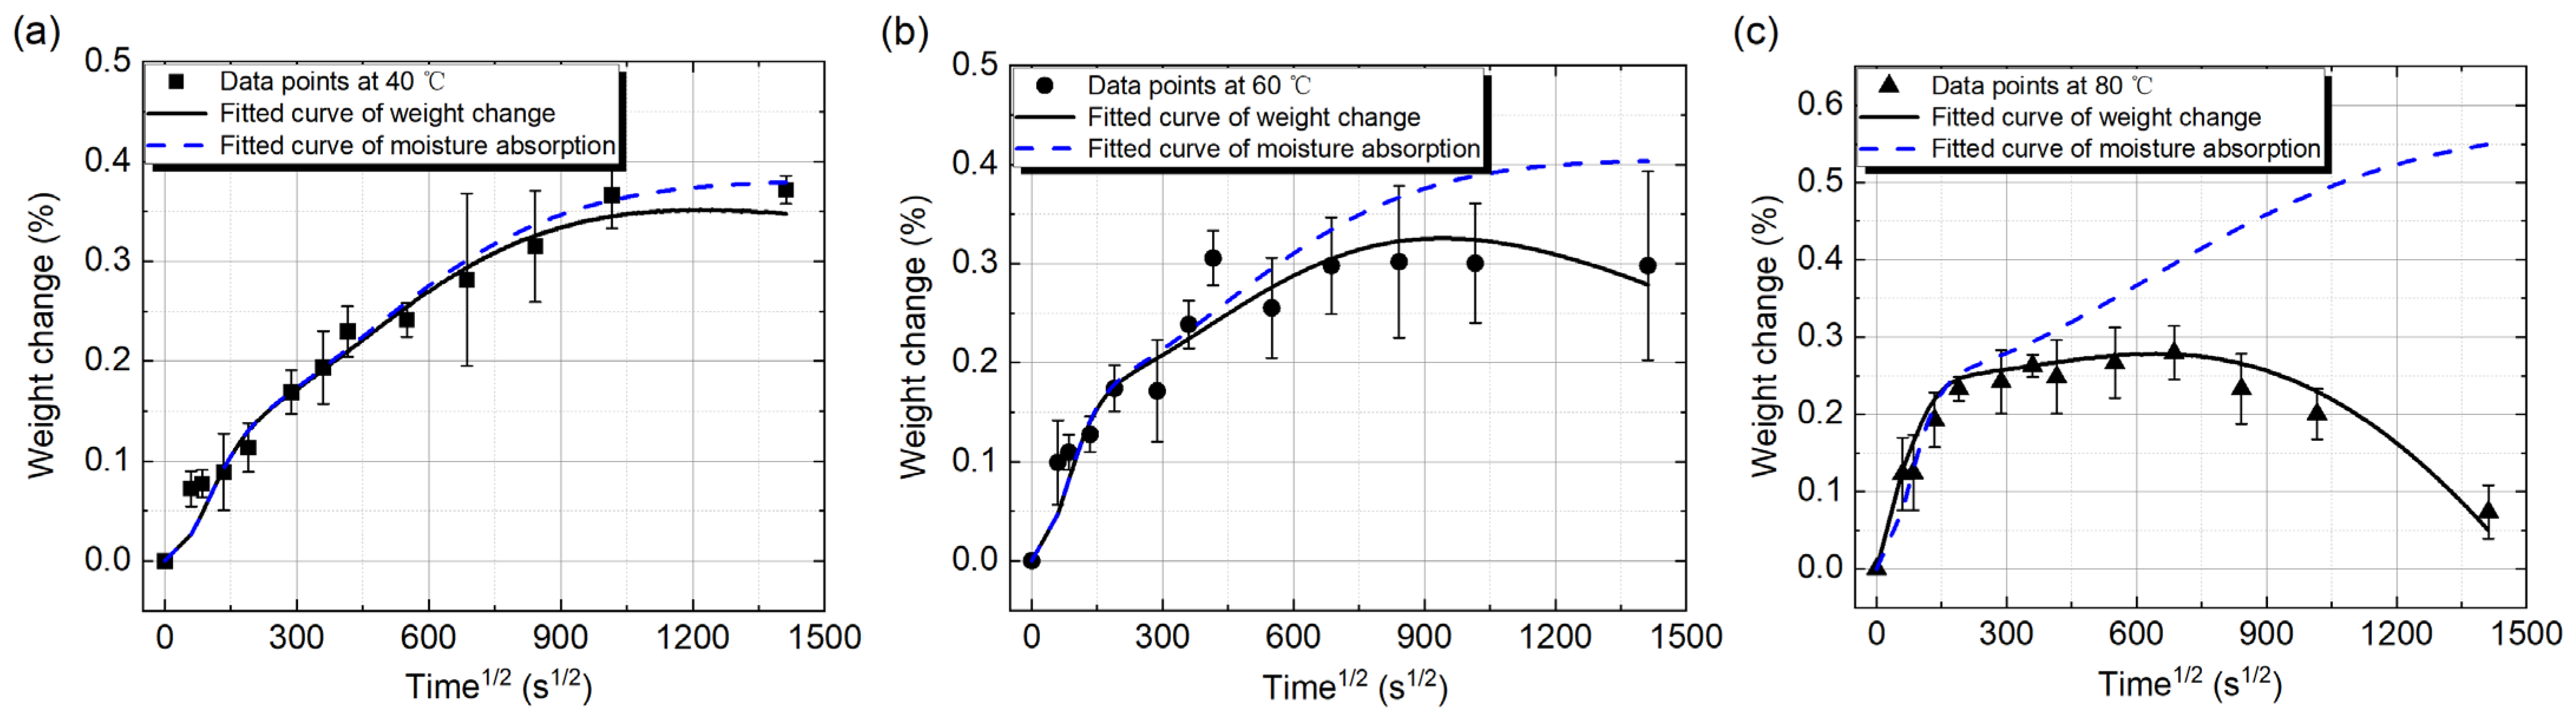
- In deionized water, the moisture diffusion of the UGFRE sample also obeys the Langmuir diffusion law when the invading direction is vertical to the glass fiber. However, when the water invades the UGFRE sample parallelly with the glass fiber, the weight loss caused by composite degradation should not be neglected. The modified Langmuir model, taking Arrhenius Theory and the nonlinear aging characteristic of the composite into consideration, is proposed and can successfully describe the water diffusion process.
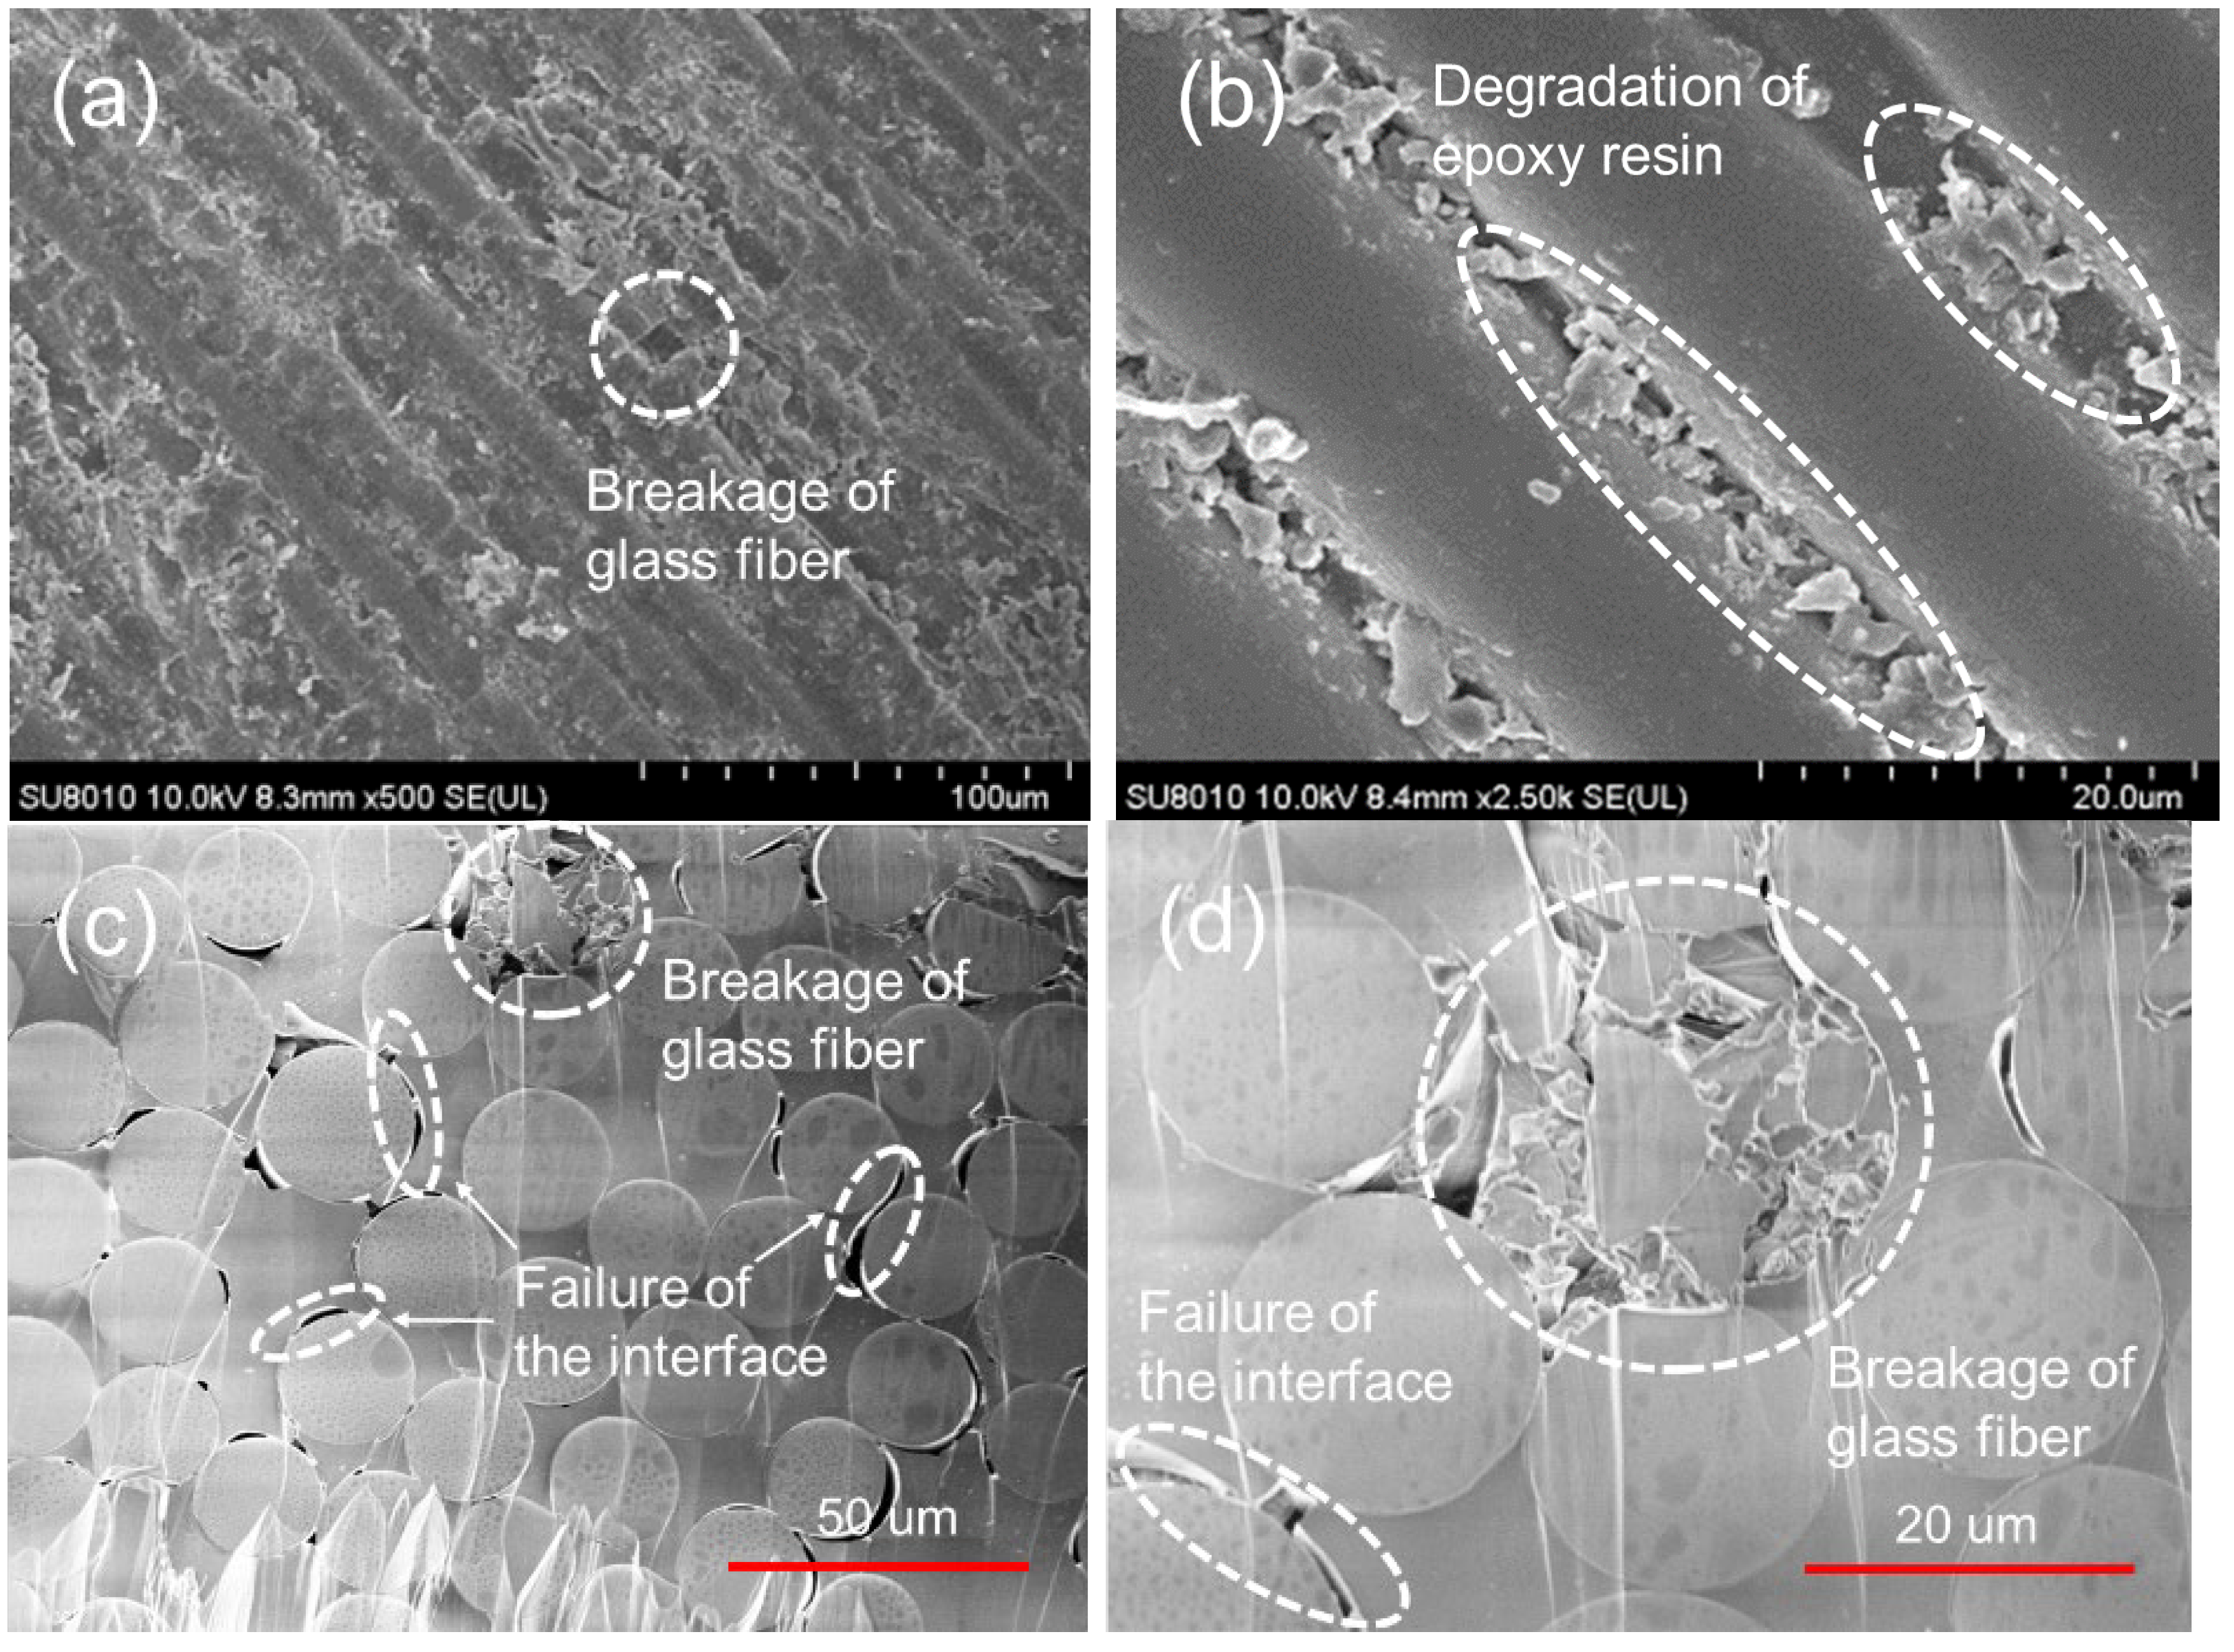
- Both the glass fibers and epoxy resin will degrade in the deionized water but the degradation degree differs. The glass fibers show better resistance to degradation than the epoxy resin. The epoxy resin degrades from the glass fiber/epoxy resin interface and become fragments. For composite insulators, it is noted that the water invasion through the ends should be avoided as far as possible, or the degradation of the UGFRE core will be inevitable, which will lead to abnormal temperature rise or even decay-like fracture.
Author Contributions
Funding
Conflicts of Interest
References
- He, H.; Chen, W.; Luo, B.; Bian, K.; Xiang, N.; Yin, Y.; Zhang, Z.; Dai, M.; He, T. On the electrical breakdown of GFRP wind turbine blades due to direct lightning strokes. Renew. Energy 2022, 186, 974–985. [Google Scholar] [CrossRef]
- Rocha, H.; Semprimoschnig, C.; Nunes, J. Sensors for process and structural health monitoring of aerospace composites: A review. Eng. Struct. 2021, 237, 112231. [Google Scholar] [CrossRef]
- Zheng, L.; Yue, X.; Yue, L.; Wang, Z.; Xie, Y.; Cui, Z. Electrical/thermal stability of GFRP under different intensities γ ray irradiation. Fusion Eng. Des. 2020, 158, 111856. [Google Scholar] [CrossRef]
- Li, S.; Guo, S.; Yao, Y.; Jin, Z.; Shi, C.; Zhu, D. The effects of aging in seawater and SWSSC and strain rate on the tensile performance of GFRP/BFRP composites: A critical review. Constr. Build. Mater. 2021, 282, 122534. [Google Scholar] [CrossRef]
- Liang, X.; Li, S.; Gao, Y.; Su, Z.; Zhou, J. Improving the outdoor insulation performance of Chinese EHV and UHV AC and DC overhead transmission lines. IEEE Electr. Insul. Mag. 2020, 36, 7–25. [Google Scholar] [CrossRef]
- Gao, Y.; Liang, X.; Lu, Y.; Wang, J.; Bao, W.; Li, S.; Wu, C.; Zuo, Z. Comparative investigation on fracture of suspension high voltage composite insulators: A review—Part I: Fracture morphology characteristics. IEEE Electr. Insul. Mag. 2021, 37, 7–17. [Google Scholar] [CrossRef]
- Gao, Y.; Liang, X.; Bao, W.; Wu, C.; Li, S. Degradation characteristics of epoxy resin of GFRP rod in the decay-like fracture of composite insulator. IEEE Trans. Dielect. Electr. Insul. 2019, 26, 107–114. [Google Scholar] [CrossRef]
- Xu, H.; Xie, C.; Gou, B.; Wang, R.; Li, Y.; Yang, H.; Li, L. Reappearance of typical characteristics of FRP core rods in the decay-like fracture insulator. IEEE Trans. Dielect. Electr. Insul. 2021, 28, 1449–1456. [Google Scholar] [CrossRef]
- Yuan, Z.; Tu, Y.; Zhao, Y.; Jiang, H.; Wang, C. Degradation behavior and aging mechanism of decay-like fractured GRP rod in composite insulator. IEEE Trans. Dielect. Electr. Insul. 2019, 26, 1027–1034. [Google Scholar] [CrossRef]
- Gao, Y.; Wang, J.; Liang, X.; Yan, Z.; Liu, Y.; Cai, Y. Investigation on permeation properties of liquids into HTV silicone rubber materials. IEEE Trans. Dielect. Electr. Insul. 2014, 21, 2428–2437. [Google Scholar] [CrossRef]
- Wang, Z.; Jia, Z.; Fang, M.; Li, S.; Guan, Z. Moisture absorption, desorption, and moisture-induced electrical performances of high-temperature vulcanized silicone rubber. IEEE Trans. Dielect. Electr. Insul. 2016, 23, 410–417. [Google Scholar] [CrossRef]
- Yuan, Z.; Tu, Y.; Li, R.; Zhang, F.; Gong, B.; Wang, C. Review on characteristics, heating sources and evolutionary processes of the operating composite insulators with abnormal temperature rise. CSEE J. Power Energy Syst. 2022, 8, 910–921. [Google Scholar]
- Liu, S.; Liang, X.; Liu, Y.; Wang, Q.; Liu, S.; Zuo, Z.; Bao, W.; Gao, Y.; Li, S. Influence of liquid type, filler and coupling agent on the interface resistivity between silicone rubber and fiber reinforced plastic. IEEE Trans. Dielect. Electr. Insul. 2021, 28, 1207–1215. [Google Scholar] [CrossRef]
- Wang, Z.; Zhao, L.; Jia, Z.; Guan, Z. Performances of FRP core rod-HTV SIR sheath interface in a water environment. IEEE Trans. Dielect. Electr. Insul. 2017, 24, 3024–3030. [Google Scholar] [CrossRef]
- Gao, Y.; Liang, X.; Bao, W.; Wu, C.; Li, S.; Liu, Y.; Cai, Y. Study on liquids diffusion into and relevant corrosion behaviour of glass fibre reinforced polymer used in high voltage composite insulator. High Volt. 2020, 5, 53–61. [Google Scholar] [CrossRef]
- Yuan, Z.; Tu, Y.; Wang, C.; Wang, C. Heating source of glass fiber reinforced polymer under AC and DC electric fields after hygrothermal aging. IET Sci. Meas. Technol. 2020, 14, 797–802. [Google Scholar] [CrossRef]
- Kumosa, L.; Benedikt, B.; Armentrout, D.; Kumosa, M. Moisture absorption properties of unidirectional glass/polymer composites used in composite (non-ceramic) insulators. Compos. Part A Appl. Sci. Manufact. 2004, 35, 1049–1063. [Google Scholar] [CrossRef]
- Joliff, Y.; Belec, L.; Chailan, J. Modified water diffusion kinetics in an unidirectional glass/fibre composite due to the interphase area: Experimental, analytical and numerical approach. Compos. Struct. 2013, 97, 296–303. [Google Scholar] [CrossRef]
- ISO 483; Plastics—Small enclosures for conditioning and testing using aqueous solutions to maintain the humidity at a constant value. ISO: Geneva, Switzerland, 2005.
- Siddika, A.; Mamun, M.; Ferdous, W.; Alyousef, R. Performances, challenges and opportunities in strengthening reinforced concrete structures by using FRPs—A state-of-the-art review. Eng. Fail. Anal. 2020, 111, 104480. [Google Scholar] [CrossRef]
- Carter, H.; Kibler, K. Langmuir-type model for anomalous moisture diffusion in composite resins. J. Compos. Mater. 1978, 12, 118–131. [Google Scholar] [CrossRef]
- Zhu, Y.; Zhao, T.; Jiao, J.; Chen, Z. The lifetime prediction of epoxy resin adhesive based on small-sample data. Eng. Fail. Anal. 2019, 102, 111–122. [Google Scholar] [CrossRef]
- Li, W.; Wen, F.; Zhou, M.; Liu, F.; Jiao, Y.; Wu, Q.; Liu, H. Assessment and prediction model of GFRP bars’ durability performance in seawater environment. Buildings 2022, 12, 127. [Google Scholar] [CrossRef]
- Wang, B.; Gong, W.; Liu, W.; Wang, Z.; Qi, N.; Li, X.; Liu, M.; Li, S. Influence of physical aging and side group on the free volume of epoxy resins probed by positron. Polymer 2003, 44, 4047–4052. [Google Scholar] [CrossRef]
- Bazli, M.; Abolfazli, M. Mechanical properties of fibre reinforced polymers under elevated temperatures: An overview. Polymers 2020, 12, 2600. [Google Scholar] [CrossRef]
- Yousef, S.; Eimontas, J.; Striūgas, N.; Praspaliauskas, M.; Abdelnaby, M. Pyrolysis kinetic behaviour of glass fibre-reinforced epoxy resin composites using linear and nonlinear isoconversional methods. Polymers 2021, 13, 1543. [Google Scholar] [CrossRef]
- Nguyen, D.; Bui, T.; Cho, Y.; Kim, Y. Highly hydrophobic polydimethylsiloxane-coated expanded vermiculite sorbents for selective oil removal from water. Nanomaterials 2021, 11, 367. [Google Scholar] [CrossRef]


| Temperature | Test Humidity | |||
|---|---|---|---|---|
| 53% | 82% | 100% | In Deionized Water | |
| 40 °C | √ | √ | √ | √ |
| 60 °C | √ | |||
| 80 °C | √ | |||
Publisher’s Note: MDPI stays neutral with regard to jurisdictional claims in published maps and institutional affiliations. |
© 2022 by the authors. Licensee MDPI, Basel, Switzerland. This article is an open access article distributed under the terms and conditions of the Creative Commons Attribution (CC BY) license (https://creativecommons.org/licenses/by/4.0/).
Share and Cite
Yuan, Z.; Wang, C.; Jin, L.; Tu, Y.; Zhang, Y.; An, Z.; Zhao, Y. A Modified Langmuir Model for Moisture Diffusion in UGFRE of Composite Insulator Considering the Composite Degradation. Polymers 2022, 14, 2922. https://doi.org/10.3390/polym14142922
Yuan Z, Wang C, Jin L, Tu Y, Zhang Y, An Z, Zhao Y. A Modified Langmuir Model for Moisture Diffusion in UGFRE of Composite Insulator Considering the Composite Degradation. Polymers. 2022; 14(14):2922. https://doi.org/10.3390/polym14142922
Chicago/Turabian StyleYuan, Zhikang, Cheng Wang, Lijun Jin, Youping Tu, Yingyao Zhang, Zhenlian An, and Yongfei Zhao. 2022. "A Modified Langmuir Model for Moisture Diffusion in UGFRE of Composite Insulator Considering the Composite Degradation" Polymers 14, no. 14: 2922. https://doi.org/10.3390/polym14142922
APA StyleYuan, Z., Wang, C., Jin, L., Tu, Y., Zhang, Y., An, Z., & Zhao, Y. (2022). A Modified Langmuir Model for Moisture Diffusion in UGFRE of Composite Insulator Considering the Composite Degradation. Polymers, 14(14), 2922. https://doi.org/10.3390/polym14142922