Article

Thermal and Sliding Wear Properties of Wood Waste-Filled Poly(Lactic Acid) Biocomposites

1
Savaria Institute of Technology, Faculty of Informatics, ELTE Eötvös Loránd University, 9700 Szombathely, Hungary
2
Department of Mechanical Engineering, Malaviya National Institute of Technology, Jaipur 302017, Rajasthan, India
3
Mechanical Engineering Department, Graphic Era (Deemed to be University), Dehradun 248002, Uttarakhand, India
4
Department of Materials Science and Engineering, Széchenyi István University, 9026 Győr, Hungary
*
Author to whom correspondence should be addressed.
Polymers 2022, 14(11), 2230; https://doi.org/10.3390/polym14112230
Submission received: 6 May 2022 / Revised: 25 May 2022 / Accepted: 27 May 2022 / Published: 30 May 2022
(This article belongs to the Topic Polymers from Renewable Resources)

Abstract

:
In our study, the effects of wood waste content (0, 2.5, 5, 7.5, and 10 wt.%) on thermal and dry sliding wear properties of poly(lactic acid) (PLA) biocomposites were investigated. The wear of developed composites was examined under dry contact conditions at different operating parameters, such as sliding velocity (1 m/s, 2 m/s, and 3 m/s) and normal load (10 N, 20 N, and 30 N) at a fixed sliding distance of 2000 m. Thermogravimetric analysis demonstrated that the inclusion of wood waste decreased the thermal stability of PLA biocomposites. The experimental results indicate that wear of biocomposites increased with a rise in load and sliding velocity. There was a 26–38% reduction in wear compared with pure PLA when 2.5 wt.% wood waste was added to composites. The Taguchi method with L25 orthogonal array was used to analyze the sliding wear behavior of the developed biocomposites. The results indicate that the wood waste content with 46.82% contribution emerged as the most crucial parameter affecting the wear of PLA biocomposites. The worn surfaces of the biocomposites were examined by scanning electron microscopy to study possible wear mechanisms and correlate them with the obtained wear results.

1. Introduction

Strict government regulations and increased environmental constraints on the burning and open-air dumping of agricultural, municipal, and industrial wastes have encouraged material scientists to develop innovative products such as biocomposites [1,2,3]. Several studies have highlighted that biocomposites hold the potential to be used in various applications, including automotive, infrastructure, aerospace, construction, consumer, and industrial fields [1,2,3,4,5]. According to reports, the forest industry was assumed to play a significant part in the economy of any country and generated a revenue of 270 billion USD worldwide in 2018 [6]. Solid wood waste is the main by-product of the forest industry, with more than 14 million tons of wood waste being generated every year, which is a significant problem when it comes to disposal [7,8]. Additionally, it was reported that more than 70 million tons of solid wood waste were generated annually during the manufacturing of wood products [9]. Furthermore, the annual production of synthetic plastics exceeds 320 million tons, which is unfortunately accumulated in productive agricultural parcels as landfills or incinerated in open-air [10]. Reducing wood waste and synthetic plastic can be achieved by replacing synthetic plastics with bioplastics to develop biocomposites. The global biocomposite market size was 16.46 billion USD in 2016, and it is estimated to reach 36.76 billion USD by 2022 with a compound annual growth rate of 14.44% [11].
Numerous scientists have examined how to improve the various properties of biocomposites, including thermal, thermomechanical, and mechanical features, by utilizing distinctive waste materials [12,13]. The potential of sugarcane bagasse and maize hull agro-wastes in thermoplastic starch-based biocomposites was studied by Dogossy and Czigany [14]. The influence of industrial wastes, namely copper slag and drill cuttings, on thermal, physical, mechanical, and antibacterial properties of poly(ε-caprolactone)-based biocomposites was investigated by Hejna et al. [15]. Kim et al. [16] studied the mechanical properties and biodegradability of rice husk and wood waste-filled poly(butylene succinate)-based biocomposites. Panaitescu et al. [17] evaluated the thermal and mechanical properties of wood waste-reinforced poly(3-hydroxybutyrate) biocomposites. Dhakal et al. [18] examined the influence of date palm fiber waste biomass on the mechanical properties of polycaprolactone-based biocomposites.
In recent years, there has been a remarkable interest in poly(lactic acid) (PLA) for many reasons, such as increasing environmental awareness, reducing product prices by capacity growth, and taking advantage of good processability [19,20]. PLA is a bio-based polymer, originating from the fermentation of corn, sugar beet, potatoes, and other agriculture-based substances. The major advantages of PLA are its biodegradability under certain temperature/pressure conditions and its non-toxic nature. It has good stiffness and strength compared with synthetic polymers, and it can be altered and adjusted for a wide range of applications, including packaging, textile, and biomedical purposes [21,22,23,24,25,26]. However, PLA has its drawbacks as well, including rapid physical aging, poor impact resistance, relatively high price, and low thermal stability. These drawbacks associated with PLA can be overcome by adopting, blending, copolymerization, or adding some materials such as filler/reinforcement [27,28,29,30].
Khan et al. [31] studied hemp hurd’s impact on the mechanical properties of PLA-based biocomposites. They concluded that the evaluated tensile and flexural strength of the manufactured biocomposites decreased, whereas crystallinity and the tensile and flexural modulus improved by increasing hemp hurd content. They also pointed out that with glycidyl methacrylate grafting, the biocomposites with ≥20 wt.% hemp hurd loading demonstrated mechanical properties nearly equal to bare PLA. Orue et al. [32] explored the potential of alkali-treated walnut shells waste as filler for the PLA matrix. They incorporated alkali-treated walnut shell powder (10, 20, and 30 wt.%) into the matrix for biocomposite fabrication. A relative improvement of 50% in tensile strength was reported for treated walnut shell waste-filled biocomposites compared with the untreated counterpart. However, the tensile modulus values of treated walnut shell waste-filled biocomposites remained almost similar to unfilled PLA, and they maintained a consistent behavior with increased filler content. Boubekeur et al. [33] investigated the influence of 1–3 mm sized wood waste (a mixture of eucalyptus and Aleppo pine wood) particles on the mechanical properties of PLA-based biocomposites. The authors concluded that Young’s modulus and crystallinity of the manufactured composites increased, while stress, impact strength, and elongation at break decreased with increasing wood waste percentage. Bajpai et al. [34] investigated the wear performance of natural fiber-reinforced PLA composites. Three categories of natural fibers (nettle, sisal, and Grewia optiva) were applied, and laminated composites were fabricated as per a hot compression process. The experimental results showed that incorporating natural fiber mats into the PLA matrix as a reinforcement remarkably enhanced the wear resistance of the neat polymer. There was a 10–44% decrease in friction coefficient and about 70% decrease in the specific wear rate of manufactured composites compared with neat PLA. Kanakannavar et al. [35] studied the effect of natural fiber 3D braided woven fabric as reinforcement in PLA composites for tribological performance. The research concluded that the fabric reinforcement decreased the specific wear rate of PLA, and about a 95% decrease was detected in the samples containing 35 wt.% reinforcement.
Although the literature is rich in research of the impacts of wood waste on the physical, mechanical, thermal, and thermo-mechanical properties of PLA-based biocomposites, the sliding wear behavior of wood waste-filled PLA-based biocomposites has not been studied so far. Moreover, the inclusion of some natural fibers and sustainable biocarbon was reported to enhance the wear resistance of PLA-based biocomposites [34,35,36]. Therefore, our research studied the production of PLA biocomposites using North Indian rosewood waste and investigating their thermal and dry sliding wear properties.

2. Experimental Details

2.1. Materials and Biocomposite Fabrication

PLA (Nature Works, USA, Ingeo 2003D grade) with a melt flow index of 6 g/10 min, a density of 1.24 g/cm3, and a melting temperature of 170 °C was used in this research. North Indian rosewood waste (60 mesh) was procured from the Krishna Timber Store in Dadhol, Himachal Pradesh, India. Before use, the wood waste was treated with 2% sodium hydroxide solution for 12 h at room temperature. After that, the treated wood waste was washed with distilled water and dried in an oven for 4 h. The SEM (scanning electron microscope) micrograph of the North Indian rosewood waste particles is presented in Figure 1a. Before biocomposite manufacturing, both the wood waste and PLA were dried for 6 h in a DEGA-2500 dehumidifier at 80 °C. The melt compounding/mixing of the PLA biocomposites containing 0, 2.5, 5, 7.5, and 10 wt.% of North Indian rosewood waste was performed using an LTE 20–44 twin-screw extruder (Labtech Engineering, Samut Prakarn Thailand; L/D ratio of 44; screw diameter of 20 mm) with a screw speed of 30 rpm and a temperature profile of 155–185 °C. After melt compounding, the composites were cooled and granulated. Subsequently, the granulated samples were injection molded into dumbbell-shaped samples (Figure 1b) using an Arburg Allrounder Advance 420C (Loßburg, Germany) injection molding machine with a nozzle temperature of 195 °C. The following parameters were used for the injection molding process: injection rate of 40 cm3/s, holding pressure at 75-65-25 MPa for 15 s, cooling time of 30 s, and mold temperature at 30 °C [37].

2.2. Thermogravimetric Analysis

The thermogravimetric tests were performed on a Shimadzu TGA-50 model scientific instrument, while the evaluation was performed using TA-60WS software. The powdered sample (~10 mg) of biocomposites was placed in a platinum pan. The thermal stability was recorded at a heating rate of 10 °C min−1 in a nitrogen atmosphere from 30 °C to 500 °C.

2.3. Sliding Wear Study

The sliding wear behavior of the produced biocomposites was investigated utilizing an ASTM G-99-compliant pin on disk machine (Model: TR-411, DUCOM, India). The schematic of the pin on disk machine and its detailed working principles were discussed elsewhere [38]. A 20 mm × 5 mm × 5 mm specimen was machined from the manufactured composites, and it was held stationary within the fixture, which was normal to the disk. For load-speed sensitivity, a series of trials were carried out by varying the normal load (10 N, 20 N, and 30 N) and the sliding velocity (1 m/s, 2 m/s, and 3 m/s) on the pin on disk machine for a fixed sliding distance of 2000 m. The biocomposite sample weight was measured prior to and after the wear test by utilizing an electronic weight balance (Wensar Weighing Scales Ltd., India) with an accuracy of 0.0001 g. For each sample, the wear experiment was repeated three times, and the volumetric wear in cm3 was computed by using the following equation [37]:
V o l u m e t r i c   w e a r   = ϖ ρ
where ϖ = sample weight loss (g) and ρ = sample density (g/cm3).
The density of the manufactured biocomposites was determined by using standard water displacement method, and it was found to be 1.24 g/cm3, 1.225 g/cm3, 1.211 g/cm3, 1.198 g/cm3, and 1.183 g/cm3 [39].

2.4. Experiment Design

In this study, the combination of control parameters for sliding wear minimization was determined using the Taguchi method. The Taguchi method is one of the most important statistical techniques used to demonstrate the influence of different control parameters with various levels. The sliding wear tests on the manufactured biocomposites were conducted under various working conditions, using four control parameters each with five levels: wood waste content (A: 0, 2.5, 5, 7.5, and 10 wt.%), normal load (B: 10, 20, 30, 40, and 50 N), sliding distance (C: 500, 100, 1500, 2000, and 2500 m) and sliding velocities (D: 0.6, 1.2, 1.8, 2.4, and 3 m/s) (as listed in Table 1).
In a full factorial design, nearly 625 (54) trials would be required to contemplate the impact of four control parameters, each having five levels. In contrast, the Taguchi method decreases the number of trials by utilizing orthogonal arrays, resulting in a lower number of trials with noticeable precision. Therefore, the impact of four control parameters with five levels (as presented in Table 1) was studied using L25 orthogonal design as presented in Table 2. Further on, to assess the test results, the signal-to-noise (SN) ratio was also investigated. The Taguchi method has three categories of the SN ratio, namely lower-the-better, nominal-the-better, and higher-the-better. In this work, a ‘lower-the-better’ characteristic was utilized, since the intention was to minimize the wear by using the following equation [38].
SN ratio = 10 log 1 n n y 2
where y = volumetric wear and n = number of trials.

2.5. Contribution Ratio Analysis

After the SN ratio analysis, each control parameter was analyzed for their contribution ratio ( ψ ) towards the volumetric wear by using the following steps [40].
Step I: Calculation of the overall SN ratio mean. In this step the overall SN ratio mean ( ) was computed for the 25 trials using the following equation:
= 1 25 n = 1 25 S N   r a t i o
Step II: Level mean of the SN ratio. In this step, the level mean of the SN ratio ( ħ i ) was calculated for each control parameter using the following equation.
ħ i = 1 5 j = 1 5 S N   r a t i o i j
where j is the level of the ith control parameter.
Step III: Sum of squares calculation. In this step, the sum of squares ( ƛ ) values were determined using the following equation:
ƛ = i ħ i 2
The ith control parameter can be determined using the following equation:
ƛ i = j = 1 5 ħ i 2
where j is the level of the ith control parameter.
Step IV: Contribution ratio calculation. In the final step, the contribution ratio ( ψ ) of the individual control parameter was calculated by using the following equation:
ψ i = ƛ i ƛ × 100

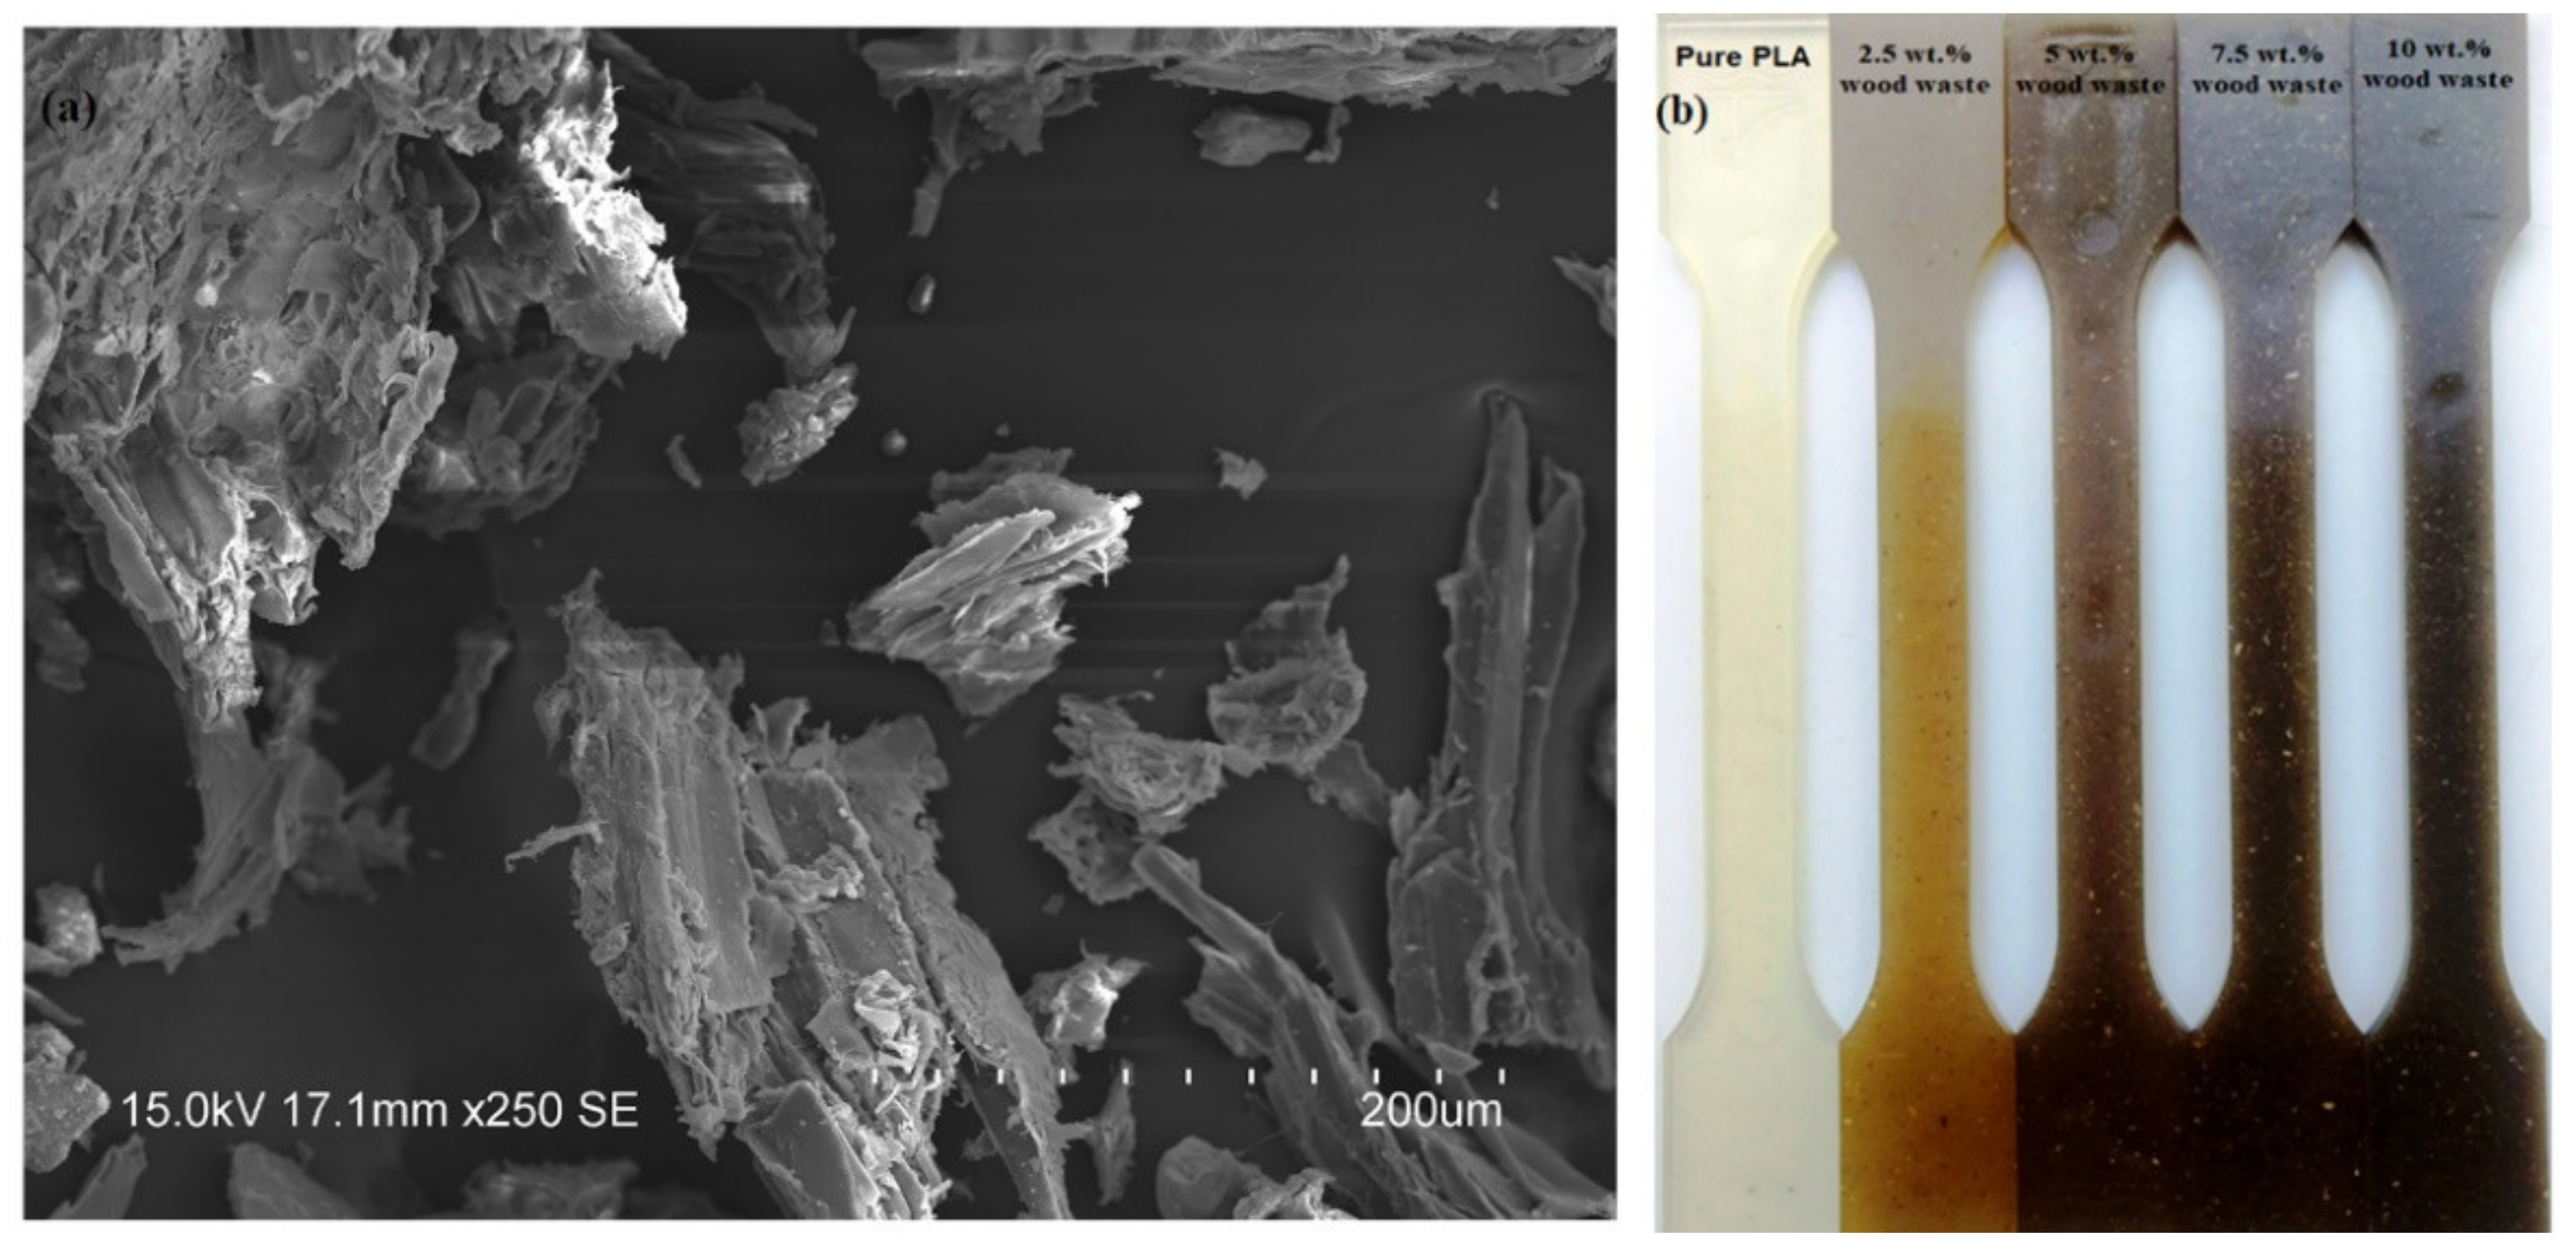
2.6. Scanning Electron Microscopy

The worn surfaces of pure PLA and wood waste-filled PLA biocomposites were further examined for possible wear mechanisms using a Hitachi S-3400N scanning electron microscope (SEM; Hitachi Ltd., Tokyo, Japan). Prior to the SEM inspection, the samples were sputter-coated with a gold–palladium alloy in order to prevent charging.

3. Results and Discussion

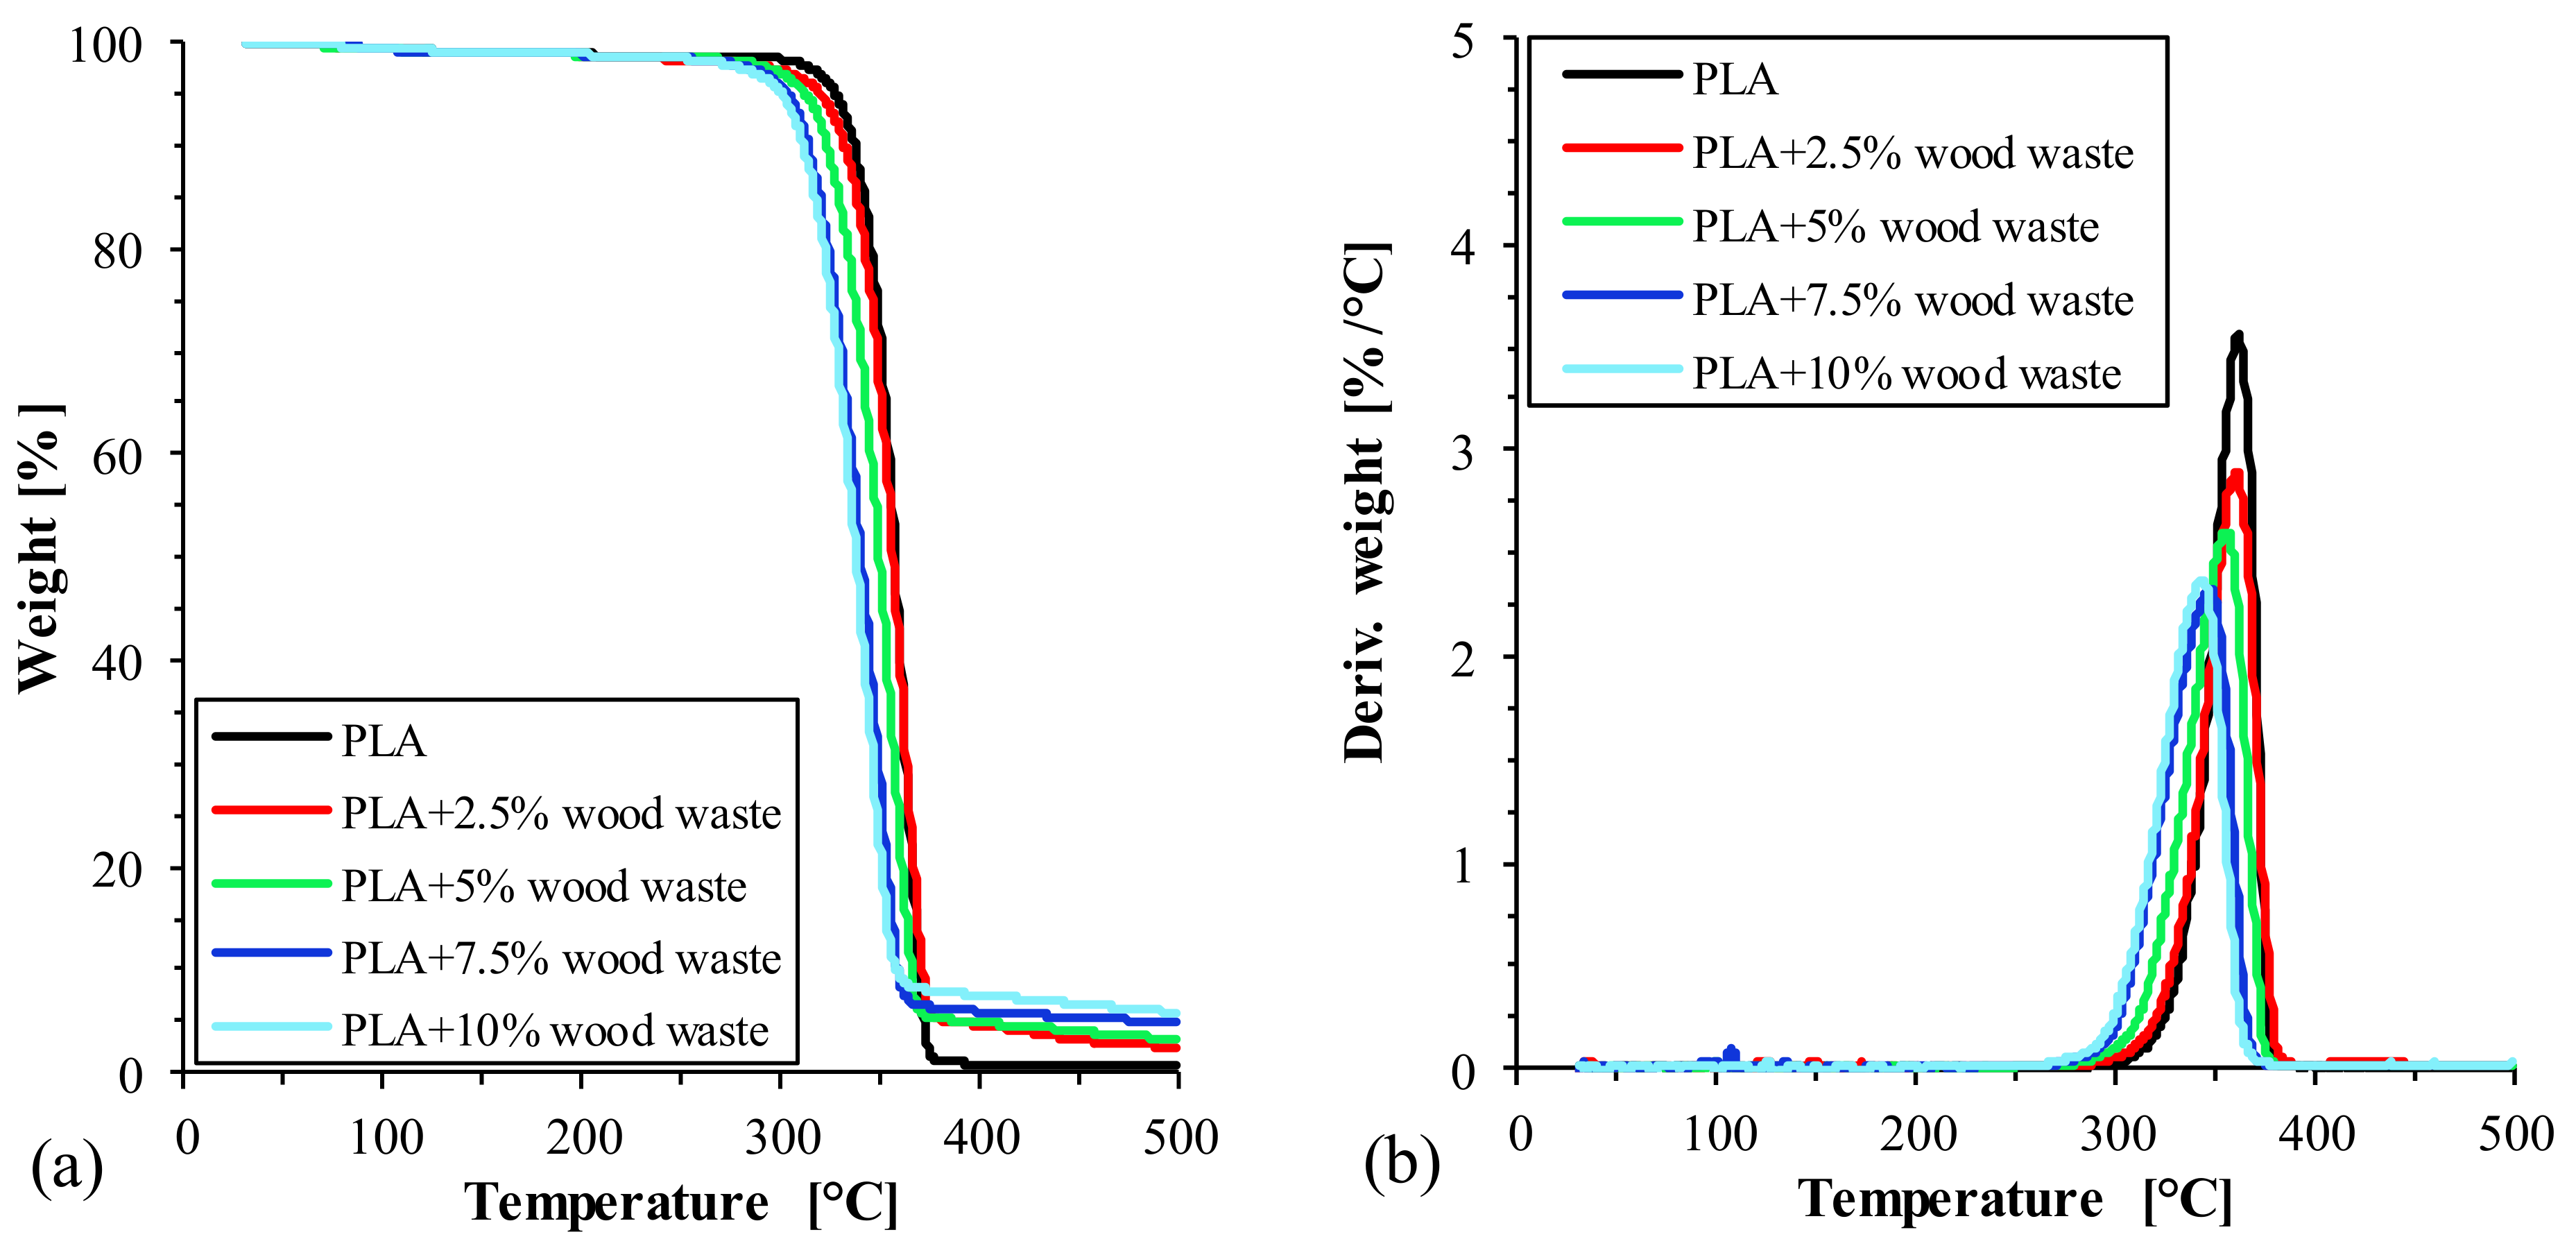
3.1. Thermal Stability Analysis

The temperature-dependent weight loss curves and the corresponding derivatives (DTG) for pure PLA and its wood waste-filled biocomposites are illustrated in Figure 2a,b, respectively. The thermal deterioration at temperatures ranging from 30 °C to 250 °C resulted in a minor weight loss of about 2 ± 0.5%. The elimination of moisture was the primary cause of the biocomposites’ weight loss at this point. A single-step decomposition process was observed both for the bare PLA and the wood waste-filled PLA biocomposites as well, in the range of (250–400 °C). The weight loss in this temperature range corresponded to the degradation of the PLA resin and the decomposition of hemicellulose, cellulose, and lignin that were present in the wood waste [41]. The temperature corresponding to the 5%, 25%, 50%, and 75% weight loss (i.e., T5, T25, T50, and T75) and the temperature of the maximum decomposition rate (Tpeak) are presented in Table 3. Based on the results, the thermal degradation of wood waste-filled PLA biocomposites occurred at a lower temperature than that of pure PLA. Biopolyesters such as PLA tend to degrade at elevated temperatures as a consequence of various depolymerization processes and thermal oxidation reactions [42]. The incorporation of the less thermally stable wood waste into the polymer matrix facilitated the thermal degradation of PLA, thereby leading to an earlier decomposition of the biocomposites during the heating.
Using 5% weight loss (T5) as the onset of the main degradation step, the temperature was 327 °C for the bare PLA but decreased to 320 °C when 2.5 wt.% wood waste was added. When the wood waste loading was increased even further (5, 7.5, and 10% wt.%), the composites’ onset degradation temperature decreased to 312 °C, 304 °C, and 300 °C, respectively. Similarly, with increased wood waste content, the temperatures for 25%, 50%, and 75% weight loss and the temperatures corresponding to the highest decomposition rate also decreased considerably. Previous studies reported similar trends with various natural fiber-filled PLA composites [42,43,44].

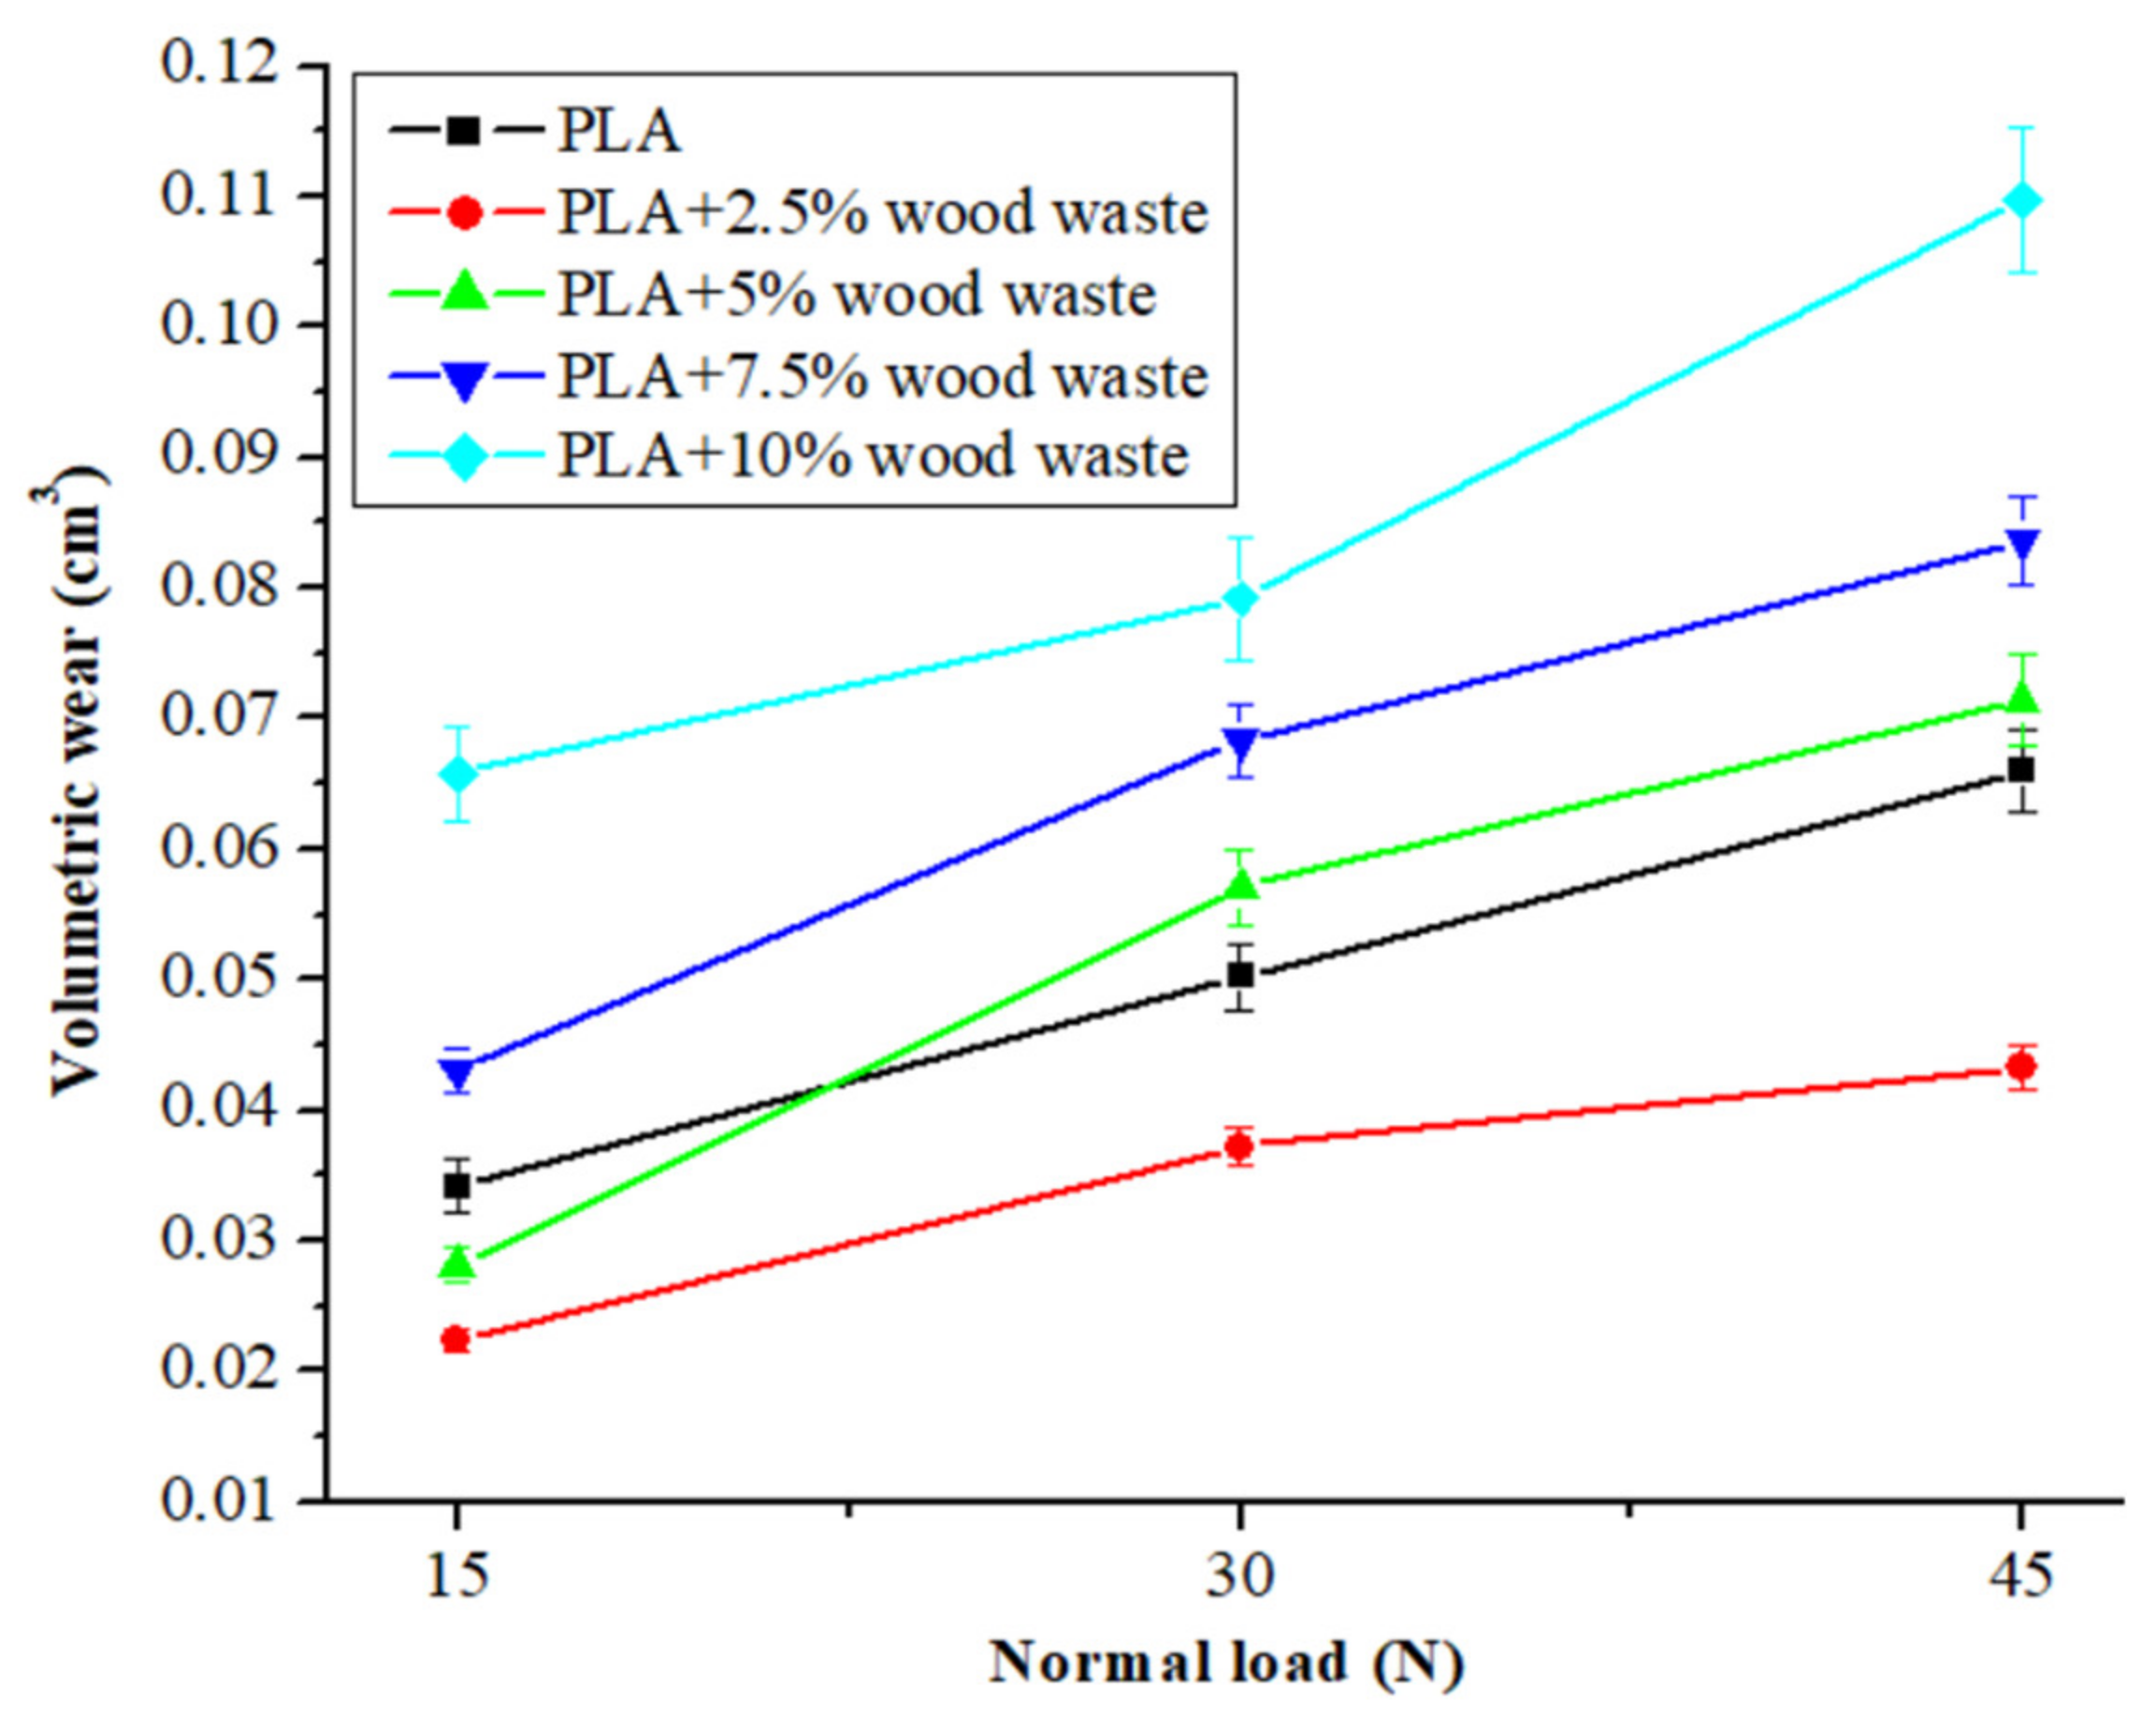
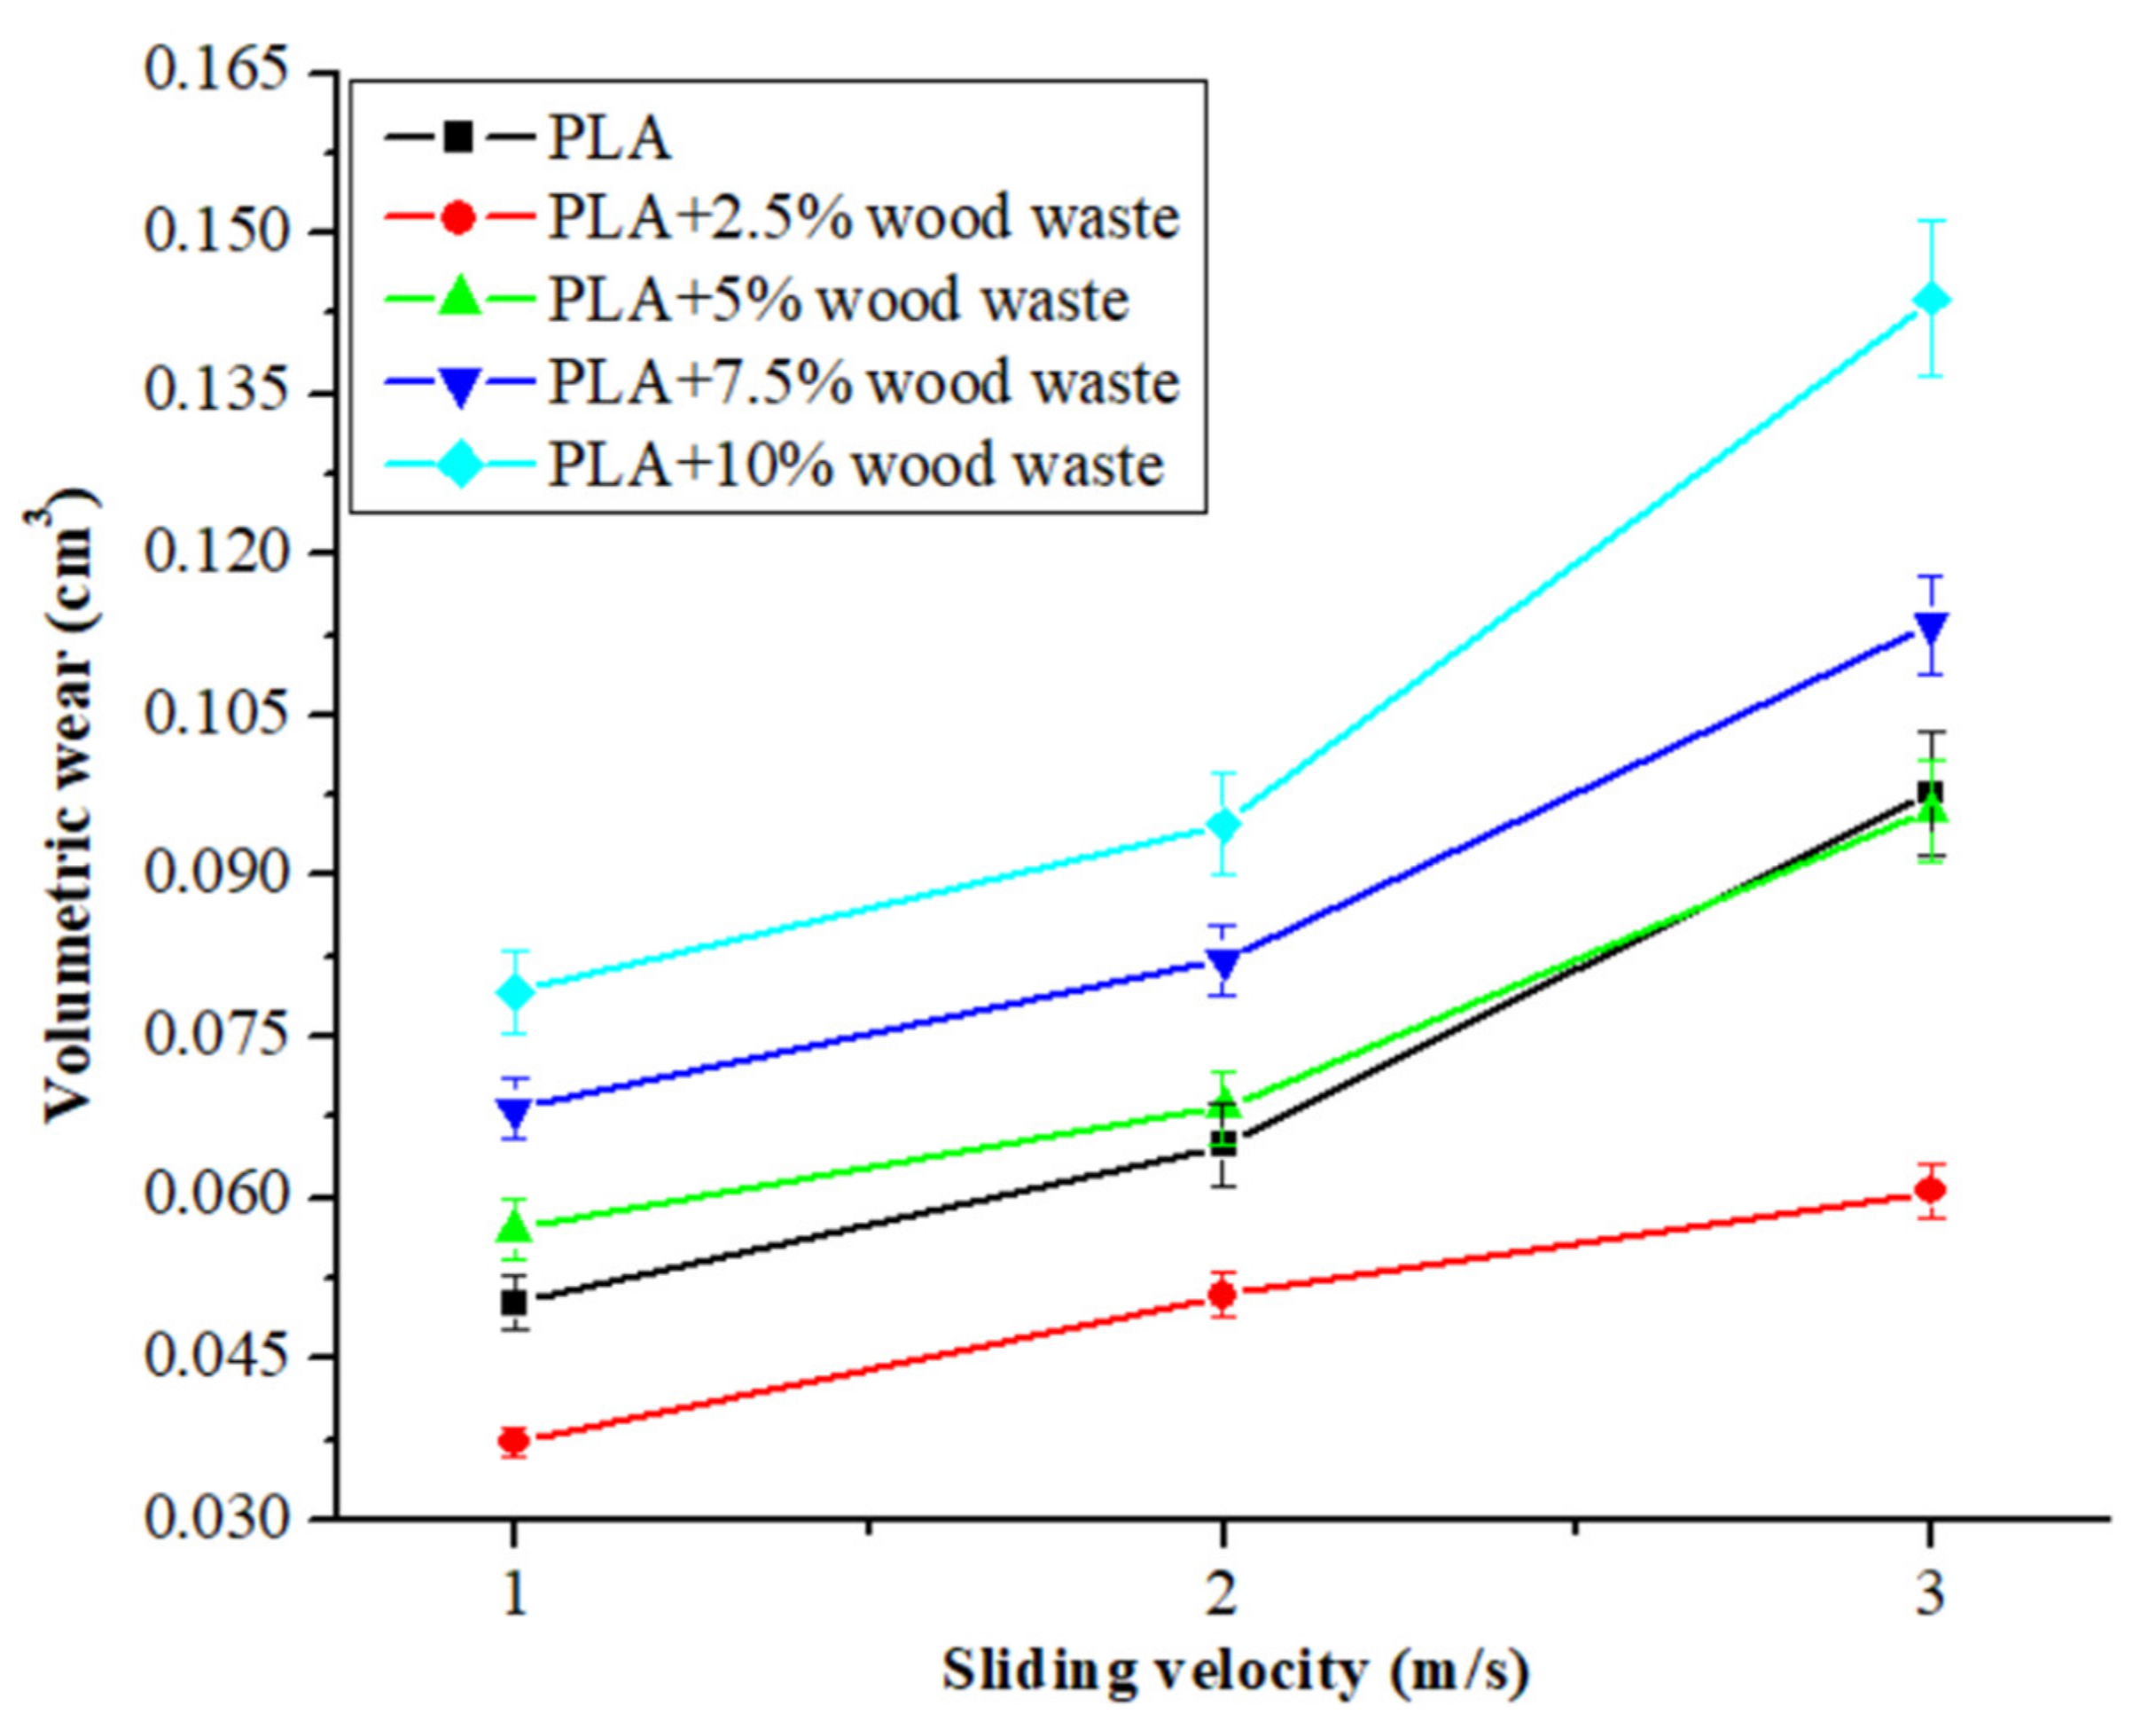
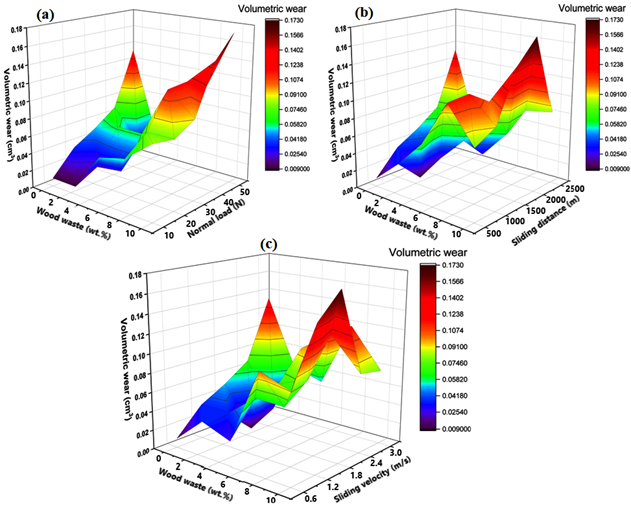
3.2. Influence of Normal Load and Sliding Velocity on Wear

Figure 3 shows the volumetric wear of composites as a function of normal load (10 N, 20 N, and 30 N) at a constant sliding velocity (1 m/s) and a 2000 m of fixed distance. Figure 3 shows that when the normal load increased, the volumetric wear of all composites increased dramatically. The volumetric wear fluctuated between 0.0342 cm3 and 0.0660 cm3 in pure PLA samples. Compared with pure PLA, the trend in volumetric wear for 2.5 wt.% wood waste-filled composite was modest, with an increased normal load. Adding 2.5 wt.% of wood waste reduced the volumetric wear of the PLA matrix by 26% to 34% under all loading situations. With the further addition of wood waste ≥ 5 wt.%, the wear of the composites increased, and it was the highest (0.0658–0.1097 cm3) when 10 wt.% wood waste was added to the composites. The possible mechanism for the increment in volumetric wear with increased wood waste content and normal load can be explained. The lower the wood waste particle concentration, the more that the structural homogeneities remained on the higher side due to ease in the dispersion of wood waste particles within the PLA matrix. The firm embedment of the wood waste particles helped to protect the matrix in the contact zone from heat and mechanical failure, resulting in minor wear.
After displaying a slight volumetric wear at 2.5 wt.% wood waste content, the volumetric wear was observed to rise when the wood waste loading was increased further. At higher concentrations, the possibilities of wood waste particles agglomerating expanded the composites and counter surface gap. As a result of the increasing distance, the adhesion between the sliding surfaces decreased, resulting in a more significant weight loss and volumetric wear. Additionally, with increased loading, the number of wood waste particles on the composite surface increased. As the normal load grew, more heat was generated during testing, and the interfacial contact temperature also increased. With this higher temperature, the bonding between the wood waste and the matrix weakened, and material removal became more accessible, increasing the wear. Similar results were reported by Bajpai et al. [34] for natural fiber-reinforced PLA composites and by Erdoğan et al. [45] for industrial waste-filled epoxy composites as well. Figure 4 shows the volumetric wear of composites as a function of sliding velocity (1 m/s, 2 m/s, and 3 m/s) at a constant normal load (30 N) and a 2000 m of fixed distance. The trend in volumetric wear for pure PLA was from 0.0502 cm3 to 0.0977 cm3; when wood waste was incorporated, the wear firstly decreased at 2.5 wt.% wood waste content and then increased with further wood waste loading. The volumetric wear remained at 0.0372–0.0606 cm3 for the 2.5 wt.% wood waste-filled composite, which was 26–38% lower than that of pure PLA. In comparison, the highest volumetric wear was registered for 10 wt.% wood waste-filled composites, which fluctuated between 0.0792–0.1439 cm3. The thermal softening of the PLA resin occurred as the sliding velocity rose due to increased heat production, resulting in increased wear with increased sliding velocity. The variation of volumetric wear with sliding velocity showed that the wear of the PLA composite increased when the sliding velocity rose higher. As the sliding velocity grew, the thermal softening of the PLA resin took place due to increased heat generation. The higher heat weakened the filler–resin bonding, and it became easier to detach the wood waste particles from the composite surface during sliding, which resulted in increased wear. Bajpai et al. [34] observed a similar mechanism for sliding wear in the case of natural fiber-reinforced PLA composites. For lower load-velocity sliding conditions, Megahed et al. [46] concluded that the generation of slight surface deformation resulted in lower wear. However, surface deformation increased at higher normal load and sliding velocity conditions, resulting in increased wear.

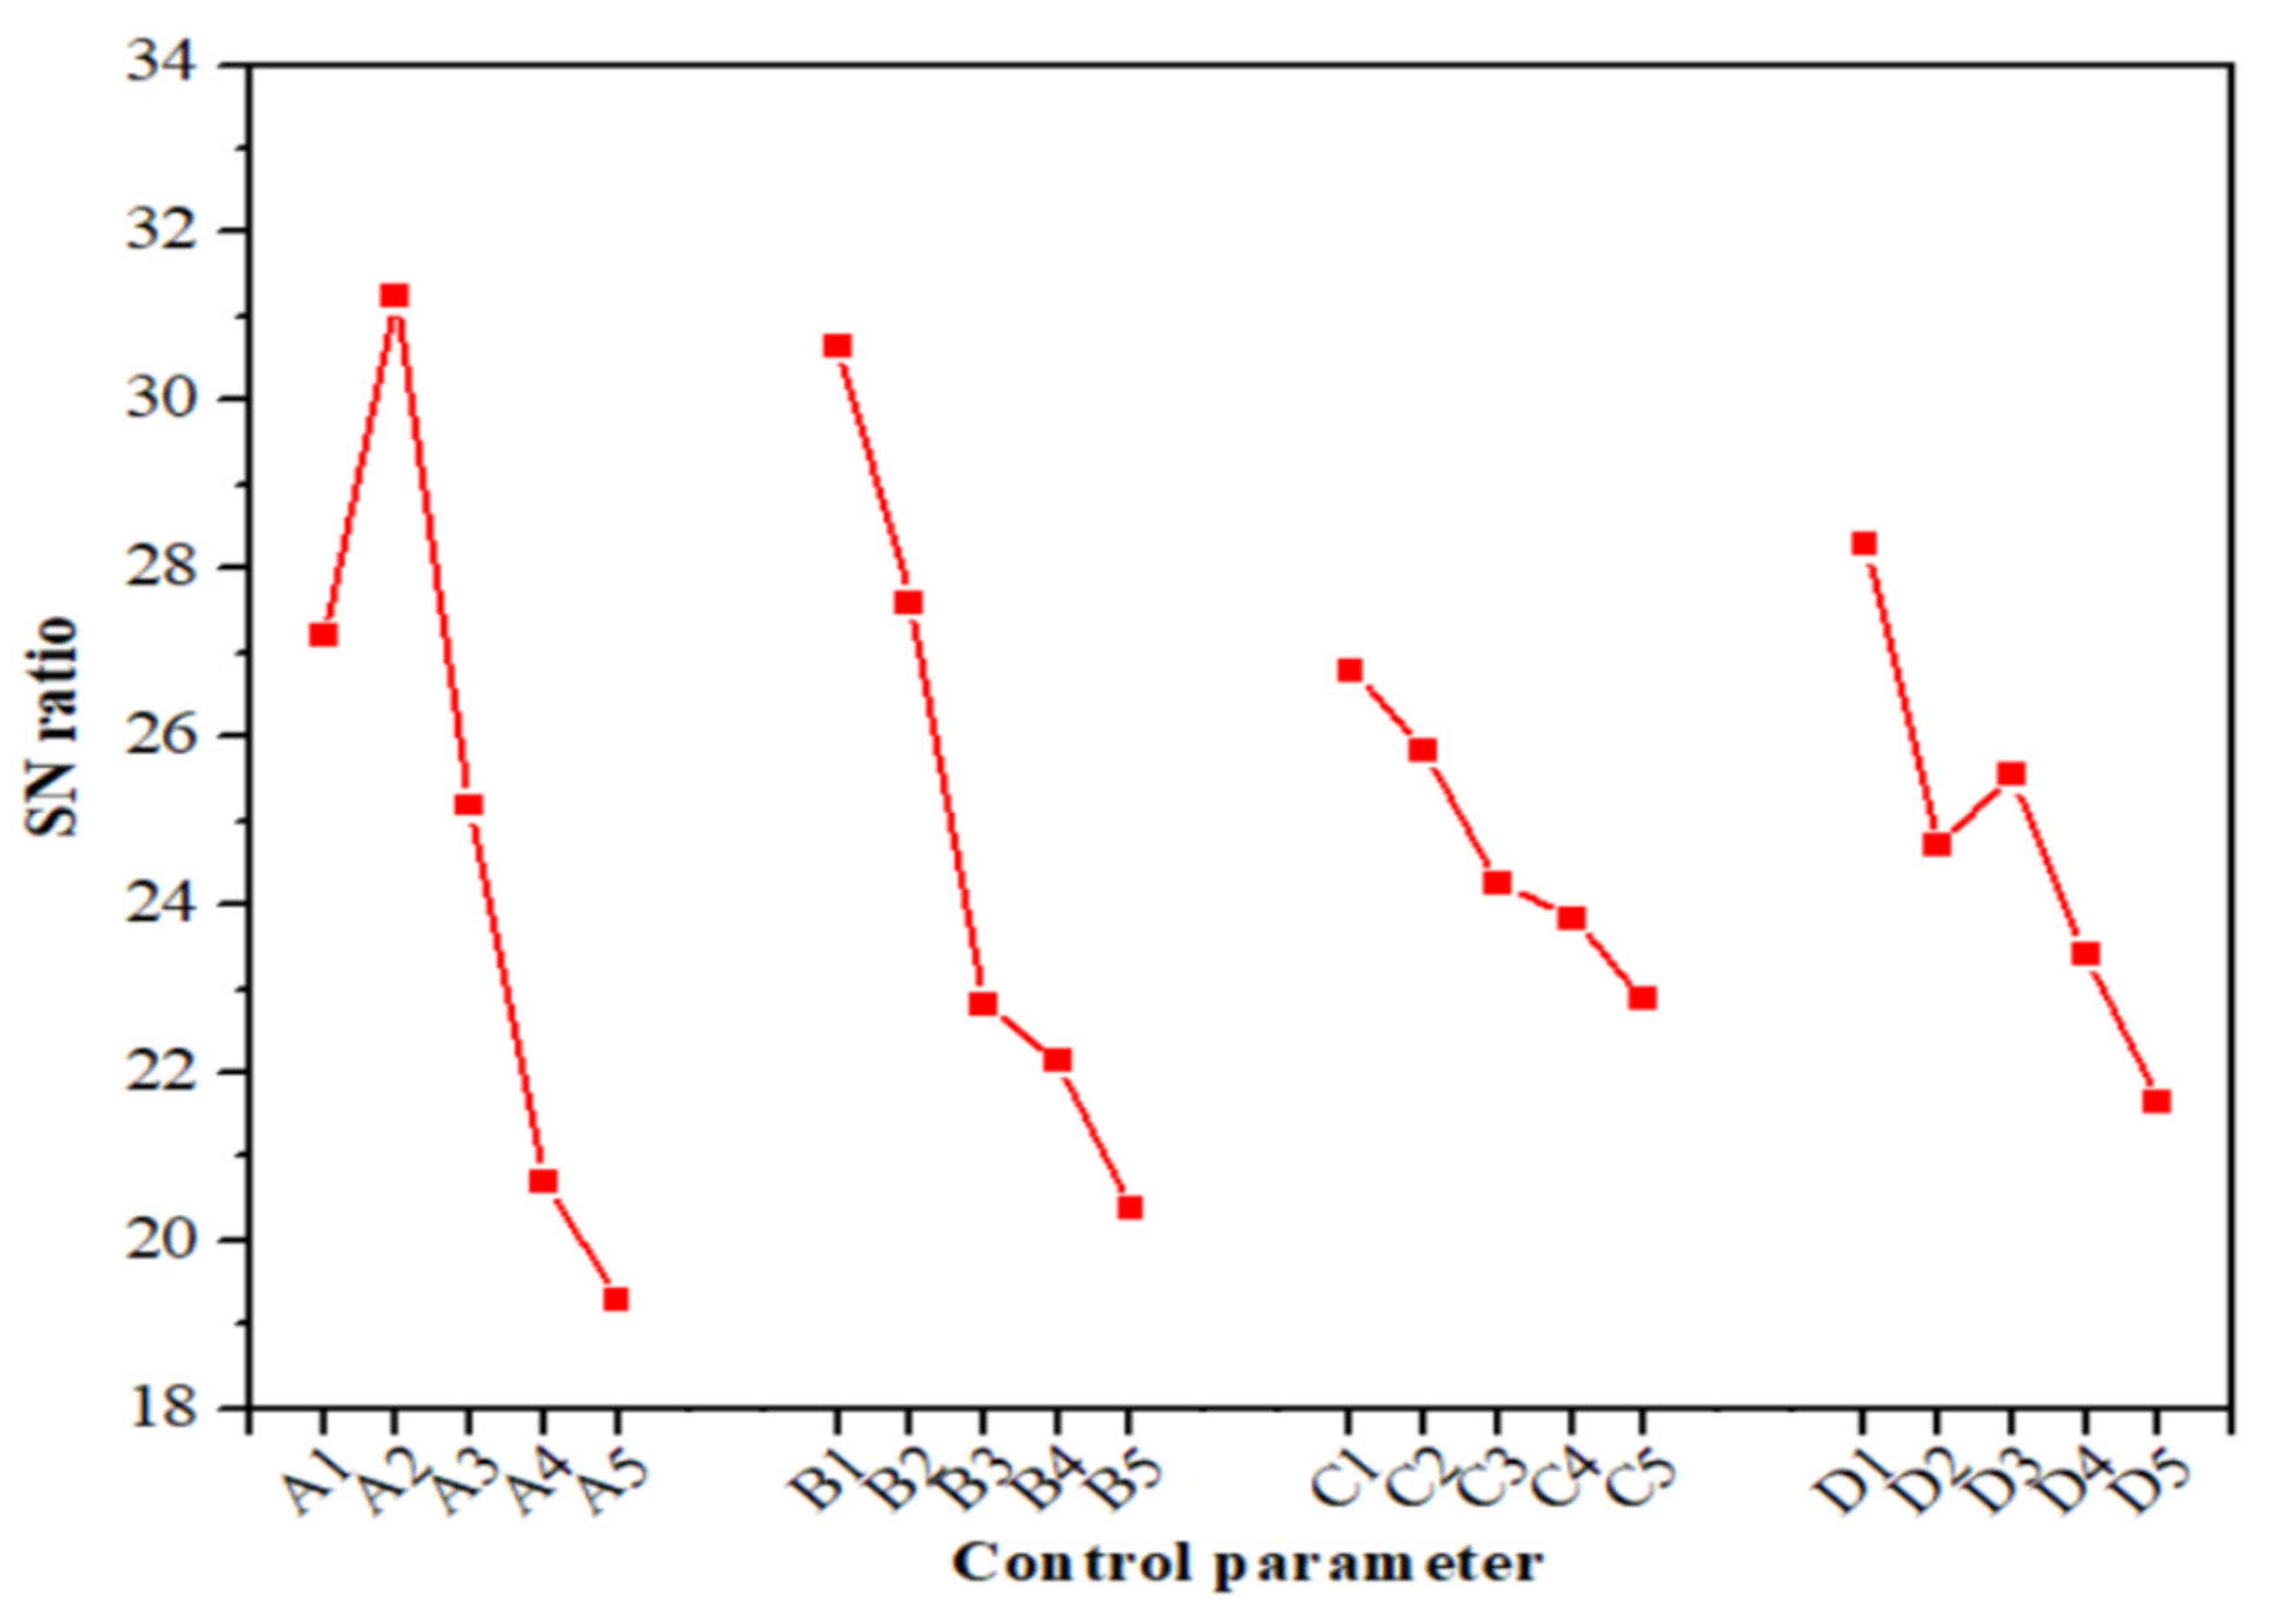
3.3. The Taguchi Analysis for Sliding Wear Performance

According to the literature, biocomposites can be used in various applications where wear is a critical issue. The wear performance of PLA biocomposites is significantly influenced by the type and amount of reinforcement and testing parameters [28,29,30]. Therefore, our investigation was designed to find the most significant control parameter and combination of parameters that yielded the slightest wear during sliding. The experiments were conducted as L25 orthogonal array design considering the impact of wood waste content, sliding distance, normal load, and sliding velocity on wear performance.
The Taguchi method suggests investigating the SN ratio by utilizing conceptual methodology that includes diagramming impacts and visually identifying the critical parameters. The results of the volumetric wear and their corresponding SN ratios are collected in Table 4. The investigation was conducted in Minitab 18. The volumetric wear obtained ranged from 0.0091 cm3 to 0.1727 cm3. The lowest and highest volumetric wear was obtained in test runs 6 and 25, respectively. Additionally, the influence of the selected four control parameters on the SN ratio of the volumetric wear is presented in Figure 5, while the SN ratio response is found in Table 5. As shown in Figure 5, there was a decrease in the volumetric wear of the composites upon increasing the amount of wood waste content from 0 to 2.5 wt.%; however, it started increasing above 2.5 wt.% wood waste content.
The minimum value of 0.0091 cm3 for volumetric wear was obtained for the 2.5 wt.% wood waste-filled composite. The situation changed when the wood waste content started increasing. The maximum value of 0.1727 cm3 was obtained for the biocomposite with 10 wt.% wood waste content. This significant behavior was potentially due to the agglomeration of the wood particles as a result of their poor interfacial bond with the PLA matrix. Due to the poor bonding, the wood waste particles were quickly drawn/peeled off from the PLA matrix during sliding, thus leading to the increased wear of the biocomposites. From the response displayed in Table 5, it can be assumed that among all the control parameters, wood waste content is an essential parameter, followed by normal load and sliding velocity, while sliding distance has a minimal impact on the volumetric wear of the tested biocomposite. Moreover, based on the results, it can be concluded that the combination of control parameters AII (2.5 wt.% wood waste), BI (10 N normal load), CI (500 m sliding distance), and DI (0.6 m/s sliding velocity) provided minimum volumetric wear. The result suggests that 2.5 wt.% wood waste-filled PLA biocomposite can be used for a low loading application of load and sliding velocity.
In addition, the influence of the most dominant control parameter (i.e., wood waste content) was analyzed on volumetric wear by drawing contour plots (Figure 6a–c) against (a) wood waste content and normal load, (b) wood waste content and sliding distance, and (c) wood waste content and sliding velocity. The contour plots demonstrate that the volumetric wear tended to increase when the wood waste content, normal load, sliding distance, and sliding velocity increased gradually. It was revealed that the lowest volumetric wear of 0.0091 cm3 was obtained at 2.5 wt.% wood waste content and the lower value (10 N) of the normal load. In contrast, the maximum volumetric wear of 0.1727 cm3 was obtained at 10 wt.% wood waste content and at a high level (50 N) of the normal load.

3.4. Contribution Ratio Results

The contribution ratio of each parameter for volumetric wear is listed in Table 6 and presented in Figure 7. The overall SN ratio mean value ( ) for the 25 trials was determined using Equation (3) and found to be 24.72 dB. The level mean of SN ratio values for each control parameter was computed using Equation (4). The sum of squares ( ƛ ) value was determined by Equation (5), and for the individual control parameter the ƛ i value was determined by Equation (6). Thereafter, the contribution ratio ( ψ ) for each control parameter was computed using Equation (7). The results show that wood waste, normal load, sliding distance, and sliding velocity contributed to the volumetric wear by 46.82%, 36.08%, 4.90%, and 12.20%, respectively. The contribution results indicate that the wood waste content was the most significant control parameter affecting the volumetric wear of the biocomposites, followed by the normal load.

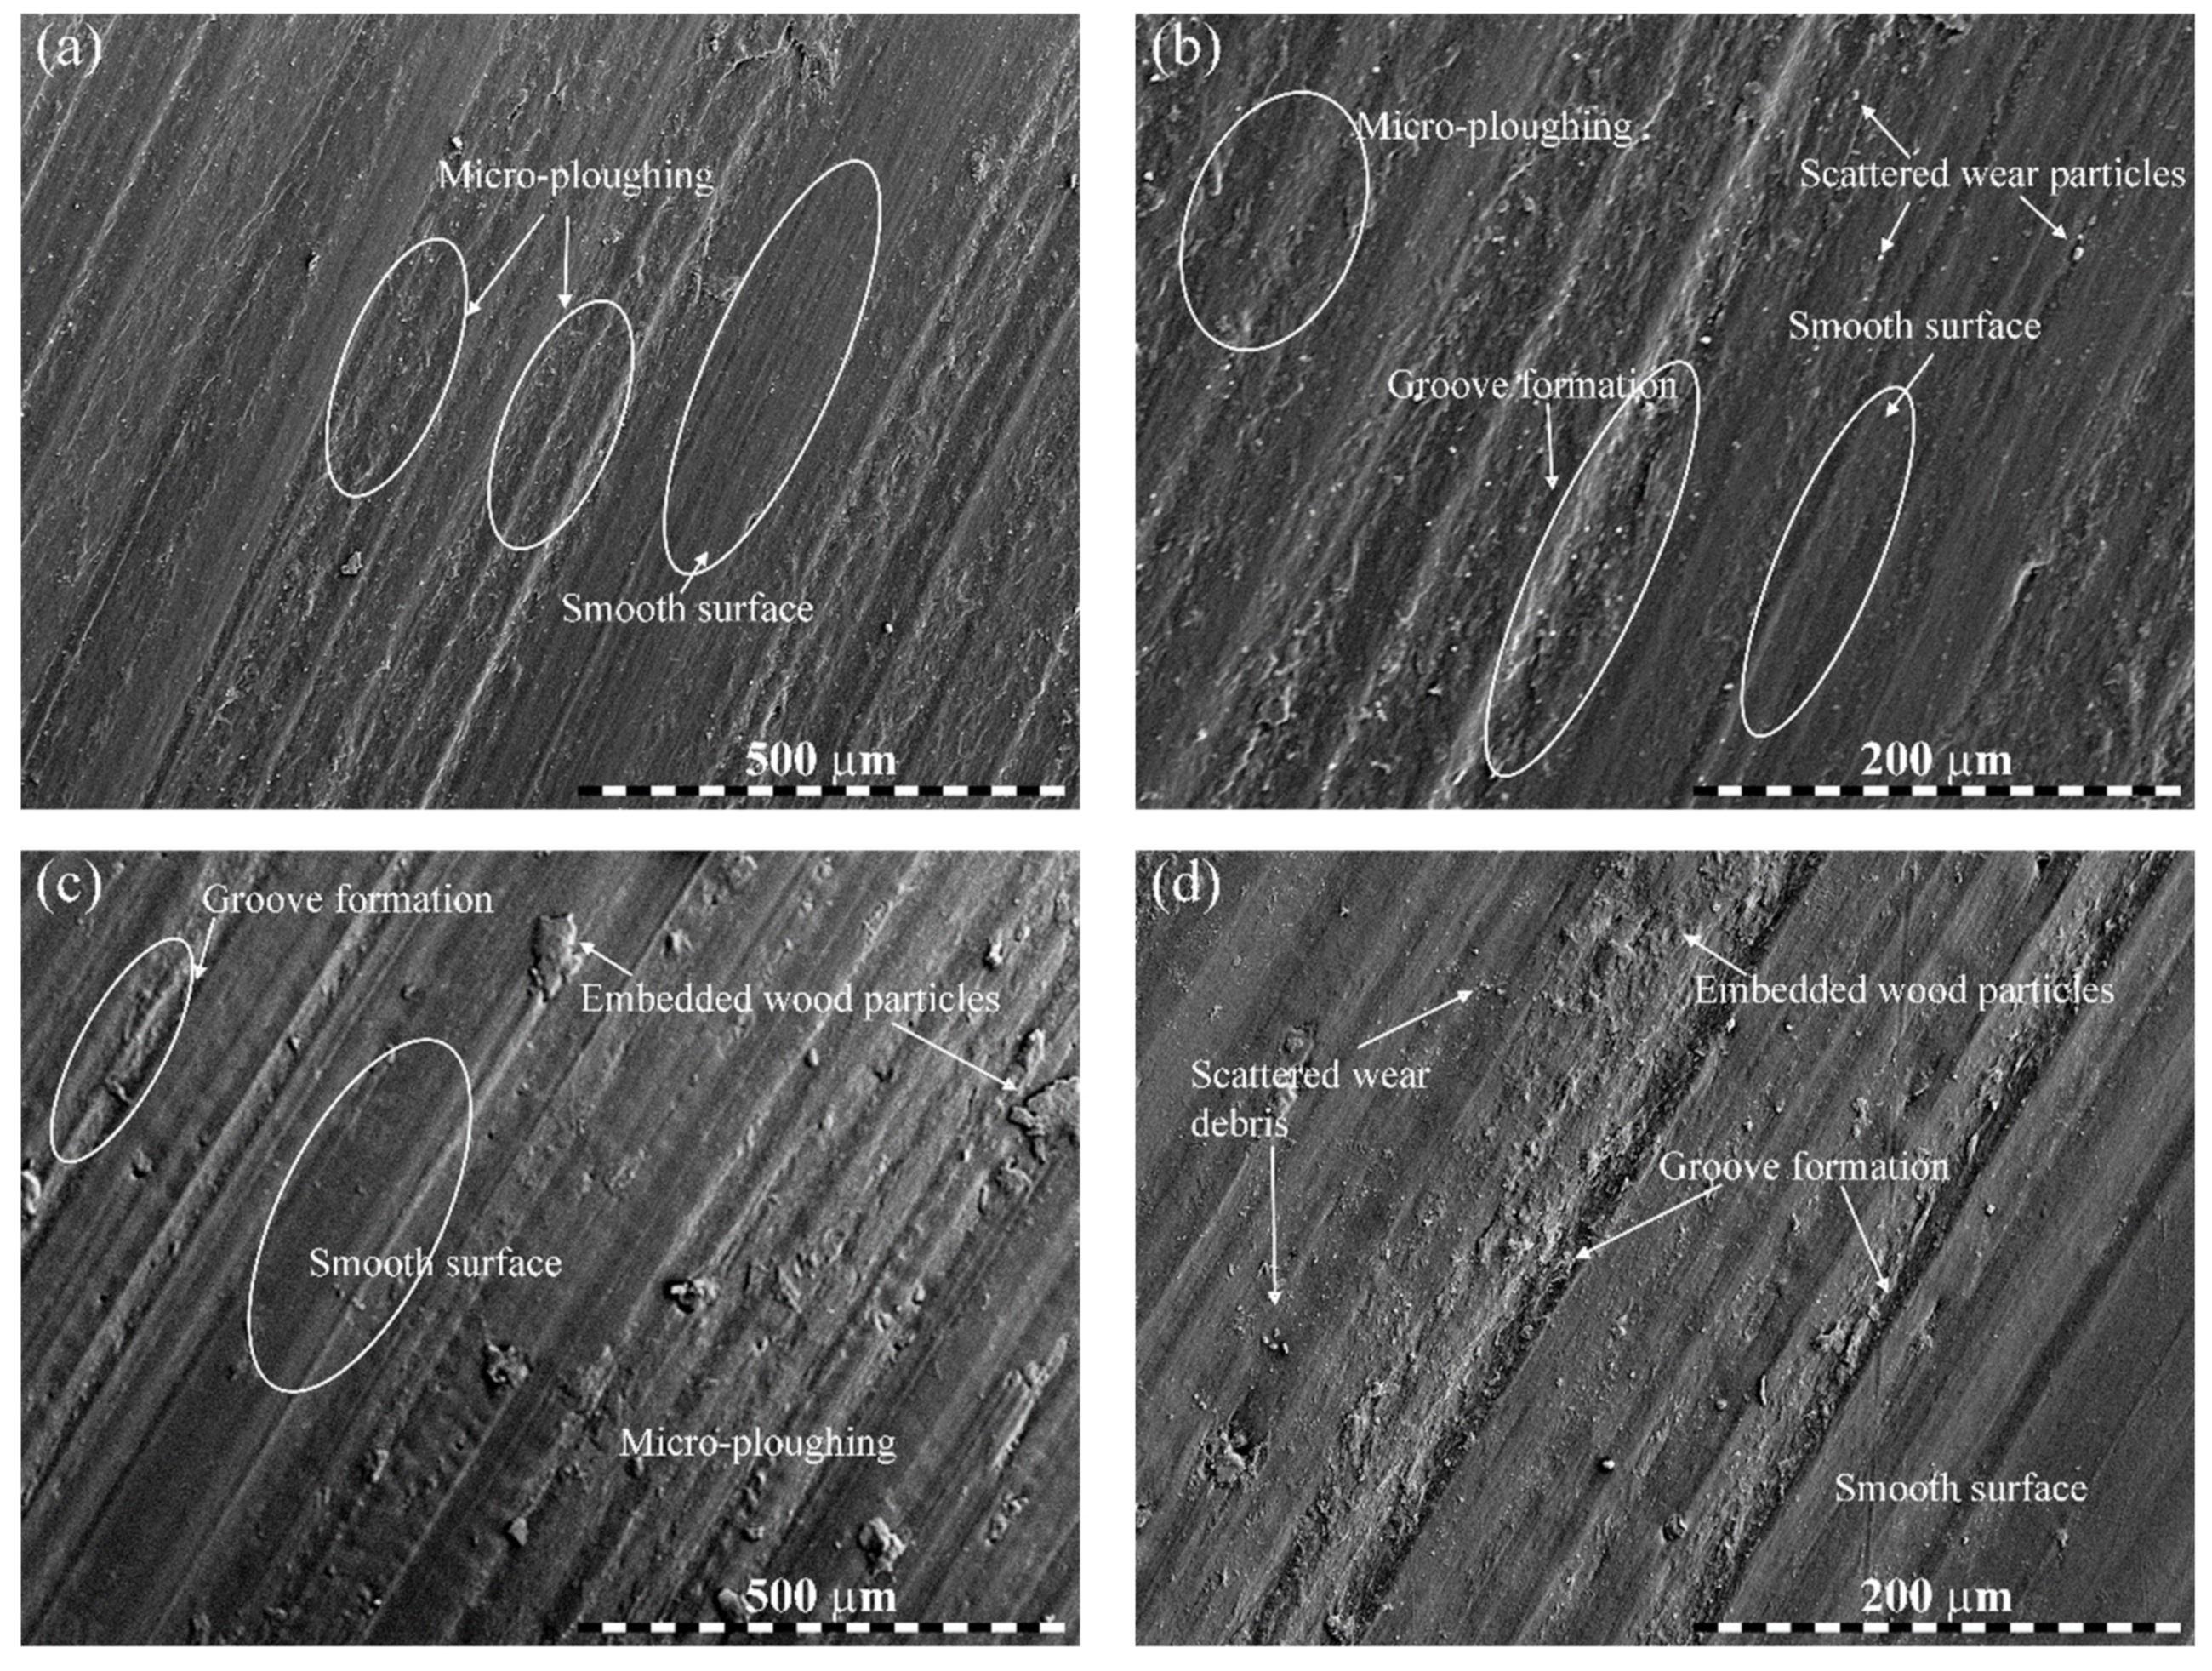
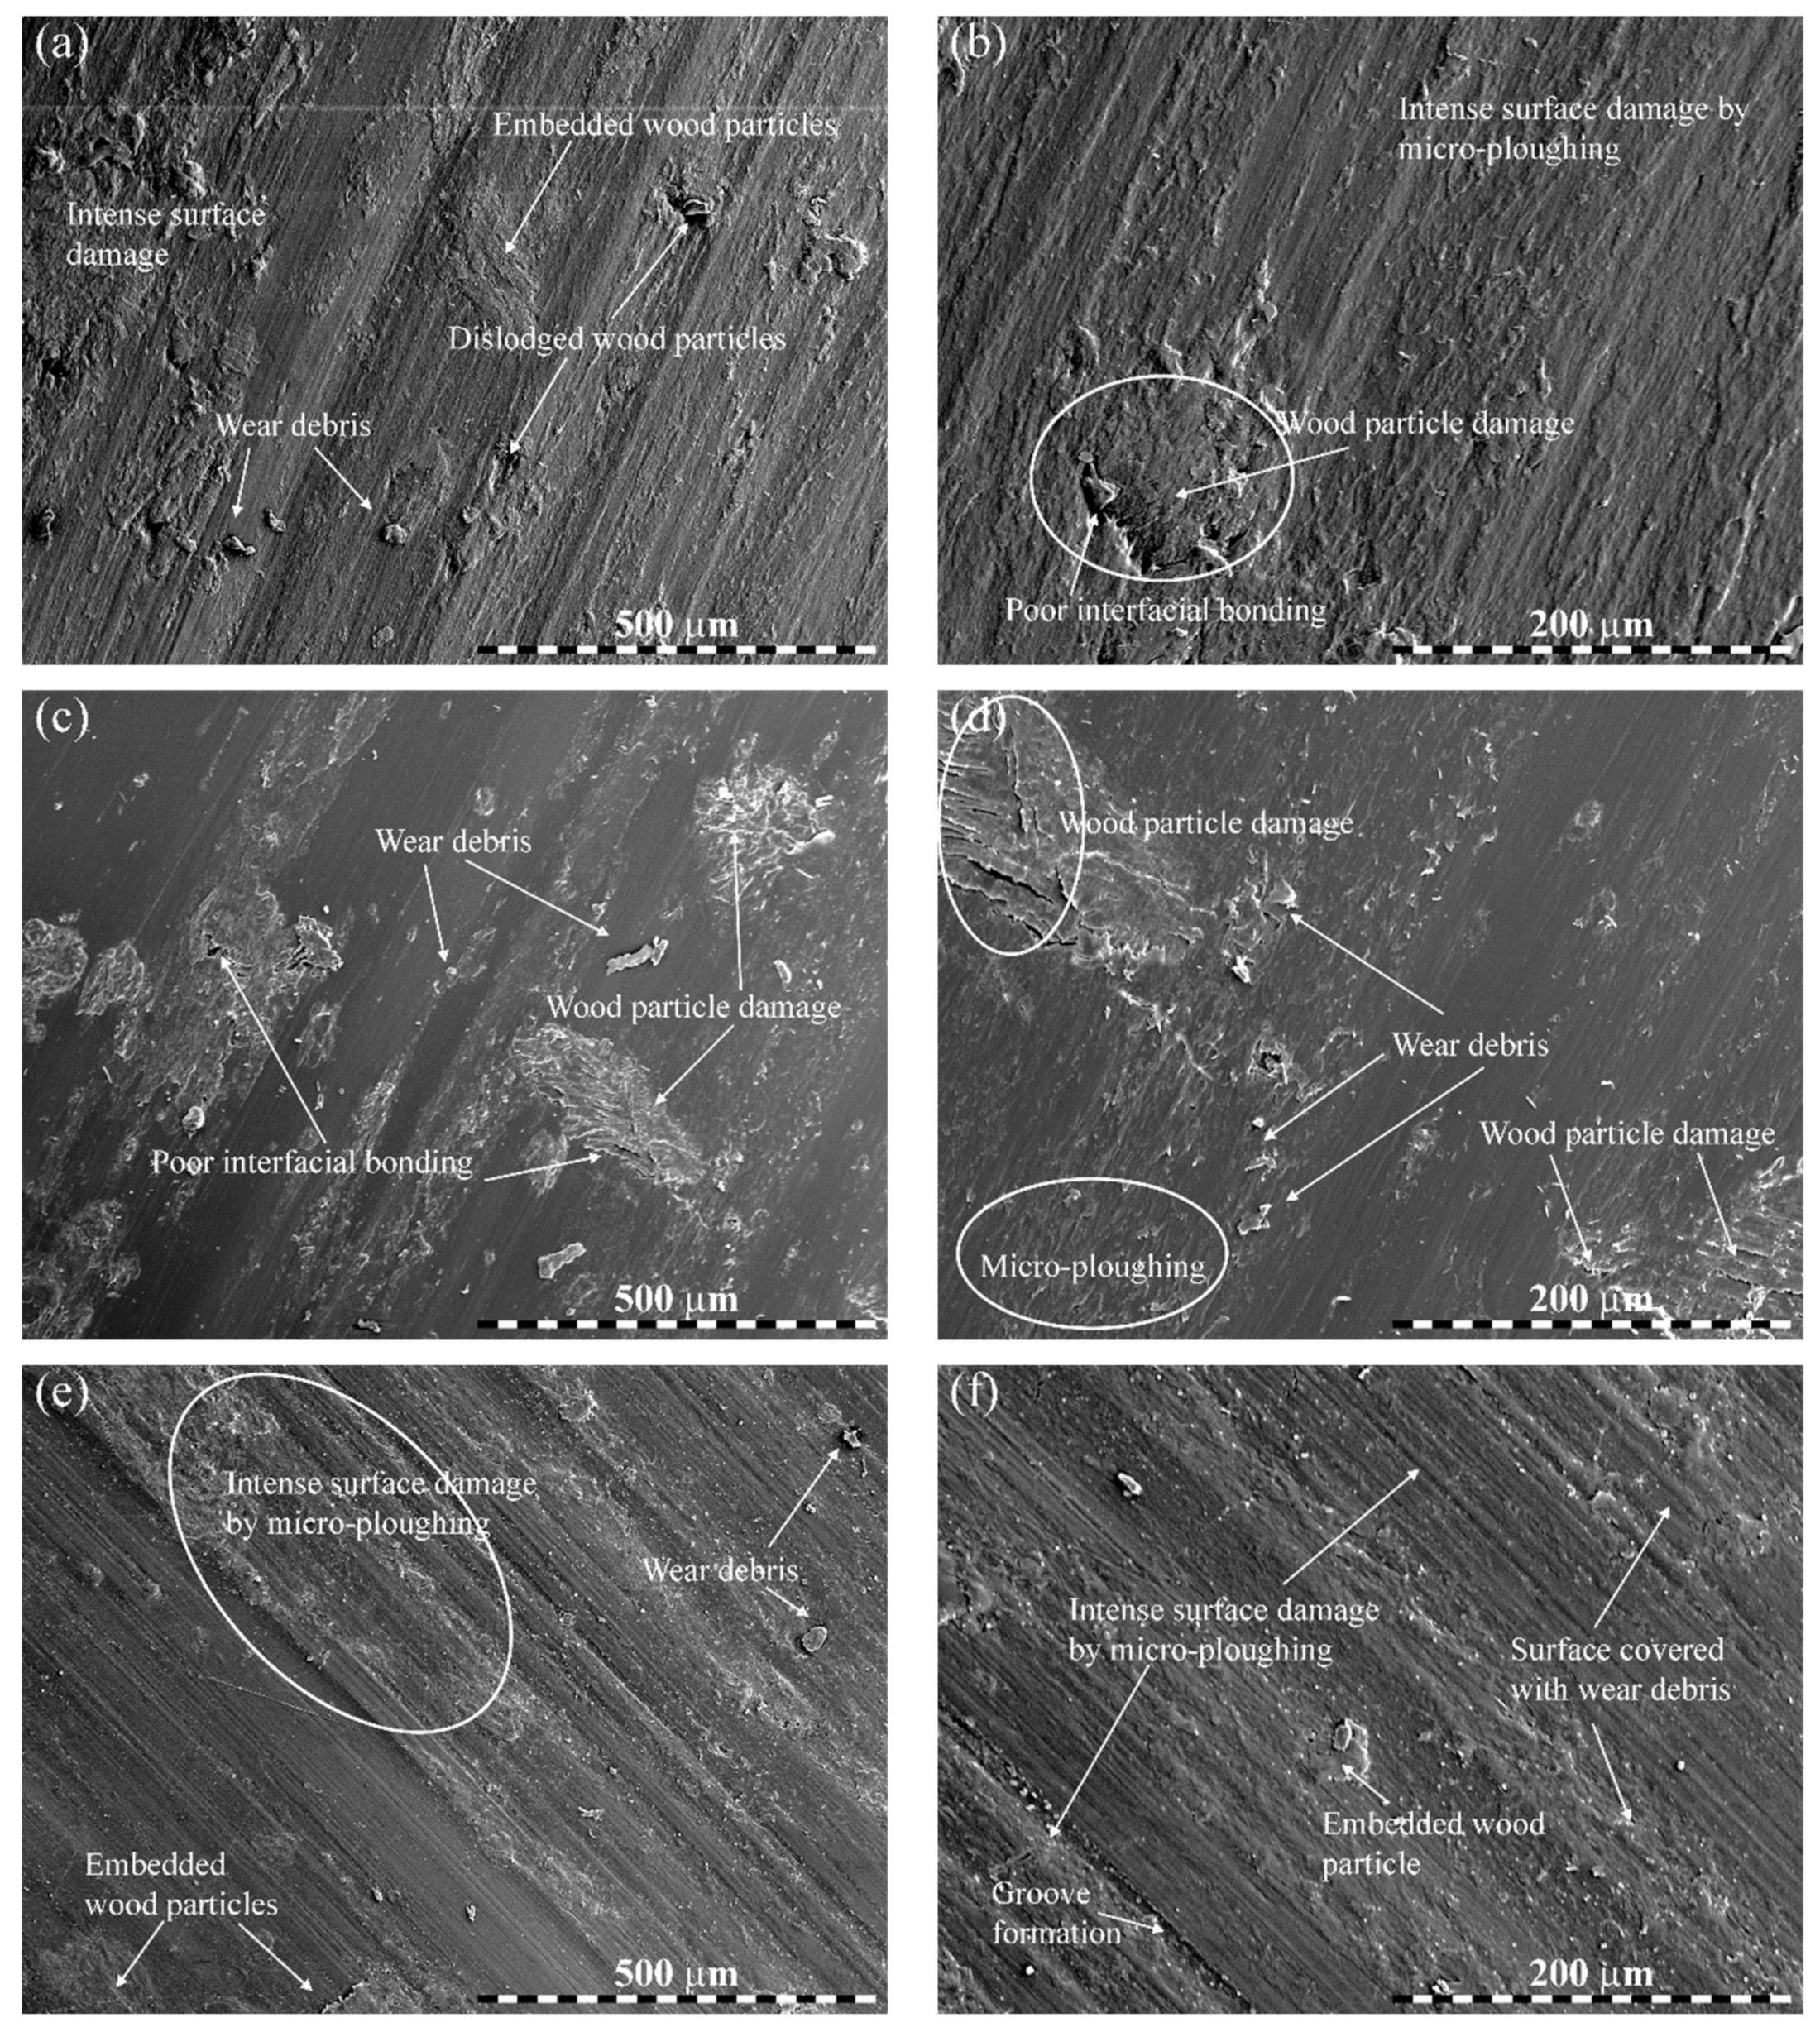
3.5. Worn Surface Morphology

The results of SEM inspections are presented in Figure 8 and Figure 9. Figure 8a,b show the worn surfaces of bare PLA tested under 50 N load, 2500 m distance, and 3 m/s sliding velocity. In the image of lower magnification (Figure 8a), the worn surface was moderately rough, revealing possible micro-ploughing in the matrix. At a higher magnification (Figure 8b), the worn surface showed more scratches/damage to the matrix, resulting in increased material removal. As a consequence of sliding, the contact temperature was uncommonly expanded, which caused an accelerative rupture of the matrix, particularly in the interfacial zone. Accordingly, the surface damage strikingly expanded with grooves left by the matrix removal, resulting in a higher weight loss (Figure 8b). Figure 8c,d present the worn surfaces of 2.5 wt.% wood waste-filled biocomposite tested under 40 N load, 2500 m distance, and 0.6 m/s sliding velocity. In contrast with Figure 8a,b for bare PLA, the worn surfaces for 2.5 wt.% wood waste-added biocomposite was much smoother, and the matrix detachment was enormously restricted with the inclusion of wood waste particles. Even at lower magnification, the worn surface remained uniform with a lesser extent of micro-ploughing and groove formation, resulting in a slight wear of the biocomposite.
Figure 9a–f show the SEM images of the worn surfaces of 5 wt.% (under 50 N load, 1000 m distance, and at 2.4 m/s sliding velocity), 7.5 wt.% (under 40 N load, 1000 m distance, and at 3 m/s sliding velocity) and 10 wt.% (under 50 N load, 2000 m distance, and at 1.8 m/s sliding velocity) wood waste-filled PLA biocomposites. In comparison to Figure 8, the worn surfaces presented in Figure 9 were rougher with severe damage. Therefore, the worn surfaces were characterized by intense sub-surface damage due to sliding, while micro-ploughing was responsible for the heavy eradication of the surface material. The increased scattered wear particles and grooves formed by micro-ploughing contributed to the decreased wear resistance of these biocomposites. Moreover, the wood waste particles appeared to be seriously damaged, suggesting a poor filler-matrix interfacial bonding, which also resulted in elevated wear.

4. Conclusions

The thermal and sliding wear properties of Indian rosewood waste-filled PLA-based biocomposites were investigated. The following conclusions can be drawn:
  • The thermal stability of the PLA biocomposites increased with an increase in wood waste loading.
  • The wear of the biocomposites increased with an increase in load and sliding velocity. Compared with pure PLA, the wear in 2.5 wt.% wood waste-added biocomposites was almost 26–38% lower.
  • The Taguchi analysis demonstrated that the combination of control parameters AII (wood waste of 2.5 wt.%), BI (normal load of 10 N), CI (sliding distance of 500 m), and DI (sliding velocity of 0.6 m/s) offers the lowest volumetric wear for the manufactured biocomposites.
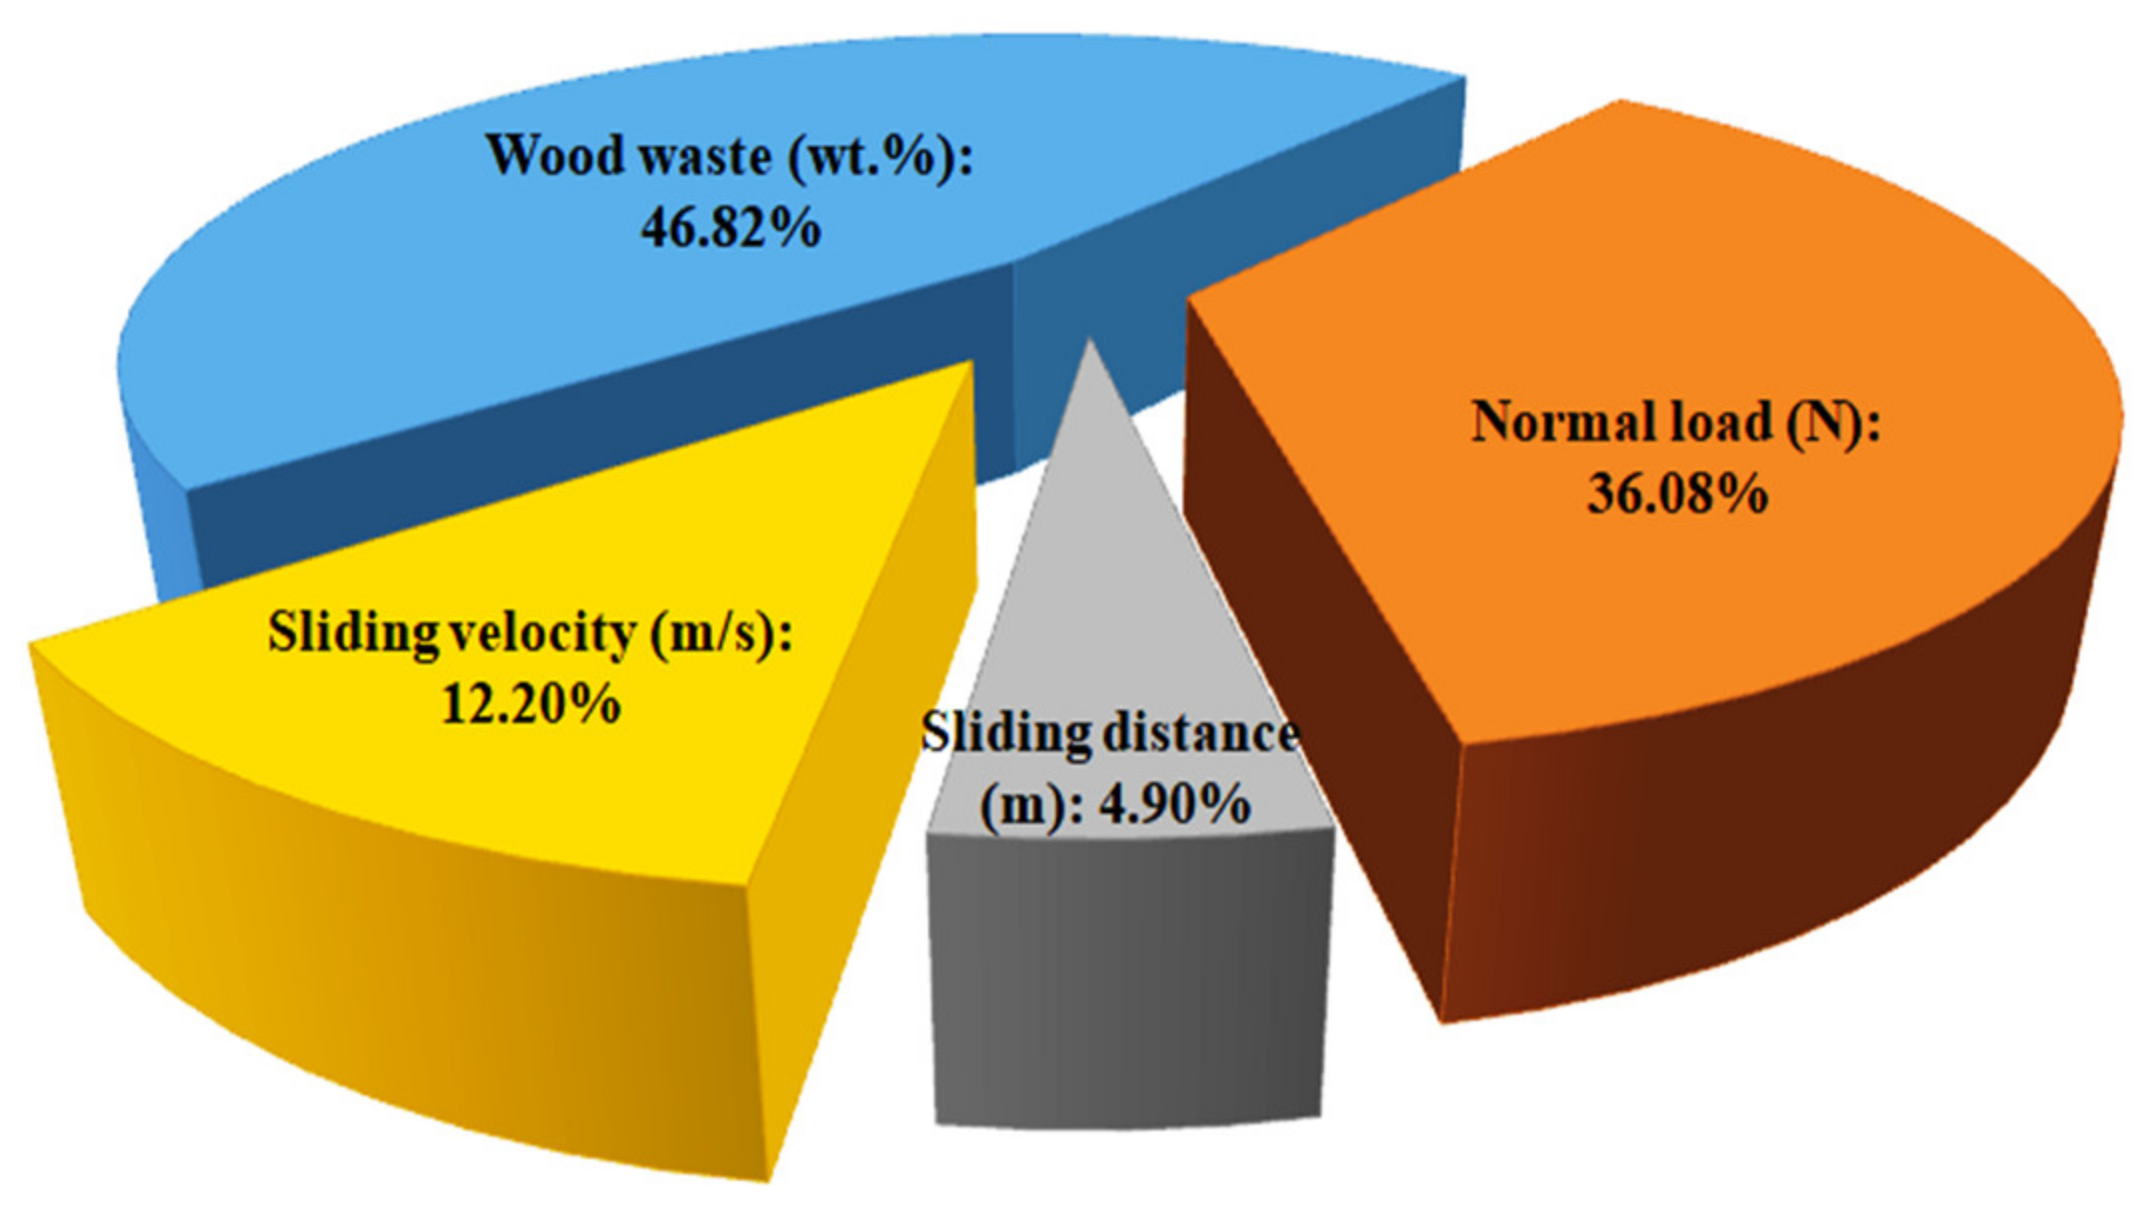
  • Wood waste content with 46.82% contribution was observed as the most dominant parameter for controlling the wear of the biocomposites, followed by the normal load, sliding velocity, and sliding distance with contributions of 36.08%, 12.20%, and 4.90%, respectively.
  • The worn surface study revealed that the micro-ploughing, grooves formation, and poor filler-matrix interfacial bonding were the possible cause of biocomposites wear.

Author Contributions

Conceptualization, T.S. and L.L.; methodology, T.S., A.P. and L.L.; software, T.S., A.P.; validation, T.S. and L.R.; formal analysis, T.S., L.L. and L.R.; investigation, T.S., L.L. and G.D.; resources, T.S., A.P. and L.L.; data curation, T.S., L.R. and L.L.; writing—original draft preparation, T.S. and L.L.; writing—review and editing, T.S., A.P. and L.L.; visualization, T.S.; supervision, A.P.; funding acquisition, L.L. All authors have read and agreed to the published version of the manuscript.

Funding

This research was funded by the Ministry of Innovation and Technology of Hungary from the National Research, Development, and Innovation Fund, financed under the TKP2021-NKTA funding scheme, grant number TKP2021-NKTA-48. L. Lendvai is grateful for the support of the János Bolyai Research Scholarship of the Hungarian Academy of Sciences.

Institutional Review Board Statement

Not applicable.

Informed Consent Statement

Not applicable.

Data Availability Statement

The data are available from the first author (T.S.) upon reasonable request.

Conflicts of Interest

The authors declare no conflict of interest.

References

  1. Carvalho, J.P.; Simonassi, N.T.; Lopes, F.P.D.; Monteiro, S.N.; Vieira, C.M.F. Novel Sustainable Castor Oil-Based Polyurethane Biocomposites Reinforced with Piassava Fiber Powder Waste for High-Performance Coating Floor. Sustainability 2022, 14, 5082. [Google Scholar] [CrossRef]
  2. Patti, A.; Acierno, S.; Cicala, G.; Zarrelli, M.; Acierno, D. Recovery of Waste Material from Biobags: 3D Printing Process and Thermo-Mechanical Characteristics in Comparison to Virgin and Composite Matrices. Polymers 2022, 14, 1943. [Google Scholar] [CrossRef] [PubMed]
  3. Boonsiriwit, A.; Itkor, P.; Sirieawphikul, C.; Lee, Y.S. Characterization of Natural Anthocyanin Indicator Based on Cellulose Bio-Composite Film for Monitoring the Freshness of Chicken Tenderloin. Molecules 2022, 27, 2752. [Google Scholar] [CrossRef]
  4. Ismail, I.; Aini, Q.; Jalil, Z.; Olaiya, N.G.; Mursal, M.; Abdullah, C.K.; Khalil Hps, A. Properties Enhancement Nano Coconut Shell Filled in Packaging Plastic Waste Bionanocomposite. Polymers 2022, 14, 772. [Google Scholar] [CrossRef] [PubMed]
  5. Shaik, S.A.; Schuster, J.; Shaik, Y.P.; Kazmi, M. Manufacturing of Biocomposites for Domestic Applications Using Bio-Based Filler Materials. J. Compos. Sci. 2022, 6, 78. [Google Scholar] [CrossRef]
  6. Food and Agriculture Organization of the United Nations. Forest Product Statistics. Available online: http://www.fao.org/forestry/statistics/80938/en/ (accessed on 28 June 2021).
  7. Silva, C.G.; Campini, P.A.L.; Rocha, D.B.; Rosa, D.S. The influence of treated eucalyptus microfibers on the properties of PLA biocomposites. Compos. Sci. Technol. 2019, 179, 54–62. [Google Scholar] [CrossRef]
  8. Etuk, S.E.; Ekpo, S.S.; Robert, U.W.; Agbasi, O.E.; Effiong, E.-A.A. Dielectric properties of Raphia Fiber from Epidermis of young Raphia Vinifera leaflet. Acta Tech. Jaurinensis 2022, 15, 91–98. [Google Scholar] [CrossRef]
  9. Falk, B.; McKeever, D. Generation and recovery of solid wood waste in the U.S. BioCycle 2012, 53, 30–32. [Google Scholar]
  10. Thomas, S.; Shumilova, A.; Kiselev, E.; Baranovsky, S.; Vasiliev, A.; Nemtsev, I.; Kuzmin, A.P.; Sukovatyi, A.; Avinash, R.P.; Volova, T. Thermal, mechanical and biodegradation studies of biofiller based poly-3-hydroxybutyrate biocomposites. Int. J. Biol. Macromol. 2019, 155, 1373–1384. [Google Scholar] [CrossRef]
  11. Biocomposites Market by Fiber (Wood Fiber and Non-Wood Fiber), Polymer (Synthetic and Natural), Product (Hybrid and Green), End-Use Industry (Transportation, Building & Construction and Consumer Goods), and Region—Global Forecast to 2022. Available online: https://www.marketsandmarkets.com/Market-Reports/biocomposite-market258097936.html (accessed on 25 August 2021).
  12. Shahavi, M.H.; Selakjani, P.P.; Abatari, M.N.; Antov, P.; Savov, V. Novel Biodegradable Poly (Lactic Acid)/Wood Leachate Composites: Investigation of Antibacterial, Mechanical, Morphological, and Thermal Properties. Polymers 2022, 14, 1227. [Google Scholar] [CrossRef]
  13. Augaitis, N.; Vaitkus, S.; Członka, S.; Kairytė, A. Research of Wood Waste as a Potential Filler for Loose-Fill Building Insulation: Appropriate Selection and Incorporation into Polyurethane Biocomposite Foams. Materials 2020, 13, 5336. [Google Scholar] [CrossRef]
  14. Dogossy, G.; Czigany, T. Thermoplastic starch composites reinforced by agricultural by-products: Properties, biodegradability, and application. J. Reinf. Plast. Compos. 2011, 30, 1819–1825. [Google Scholar] [CrossRef]
  15. Hejna, A.; Piszcz-Karaś, K.; Filipowicz, N.; Cieśliński, H.; Namieśnik, J.; Marć, M.; Klein, M.; Formela, K. Structure and performance properties of environmentally-friendly biocomposites based on poly(ɛ-caprolactone) modified with copper slag and shale drill cuttings wastes. Sci. Total Environ. 2018, 640–641, 1320–1331. [Google Scholar] [CrossRef]
  16. Kim, H.-S.; Yang, H.-S.; Kim, H.-J. Biodegradability and mechanical properties of agro-flour-filled polybutylene succinate biocomposites. J. Appl. Polym. Sci. 2005, 97, 1513–1521. [Google Scholar] [CrossRef]
  17. Panaitescu, D.M.; Nicolae, C.A.; Gabor, A.R.; Trusca, R. Thermal and mechanical properties of poly(3-hydroxybutyrate) reinforced with cellulose fibers from wood waste. Ind. Crop. Prod. 2020, 145, 112071. [Google Scholar] [CrossRef]
  18. Dhakal, H.; Bourmaud, A.; Berzin, F.; Almansour, F.; Zhang, Z.; Shah, D.; Beaugrand, J. Mechanical properties of leaf sheath date palm fibre waste biomass reinforced polycaprolactone (PCL) biocomposites. Ind. Crop. Prod. 2018, 126, 394–402. [Google Scholar] [CrossRef] [Green Version]
  19. Freeland, B.; McCarthy, E.; Balakrishnan, R.; Fahy, S.; Boland, A.; Rochfort, K.D.; Dabros, M.; Marti, R.; Kelleher, S.M.; Gaughran, J. A Review of Polylactic Acid as a Replacement Material for Single-Use Laboratory Components. Materials 2022, 15, 2989. [Google Scholar] [CrossRef]
  20. Marano, S.; Laudadio, E.; Minnelli, C.; Stipa, P. Tailoring the Barrier Properties of PLA: A State-of-the-Art Review for Food Packaging Applications. Polymers 2022, 14, 1626. [Google Scholar] [CrossRef]
  21. Maleki, H.; Azimi, B.; Ismaeilimoghadam, S.; Danti, S. Poly(lactic acid)-Based Electrospun Fibrous Structures for Biomedical Applications. Appl. Sci. 2022, 12, 3192. [Google Scholar] [CrossRef]
  22. Pérez-Fonseca, A.A.; Campo, A.S.M.D.; Robledo-Ortíz, J.R.; González-López, M.E. Compatibilization strategies for PLA biocomposites: A comparative study between extrusion-injection and dry blending-compression molding. Compos. Interfaces 2022, 29, 274–292. [Google Scholar] [CrossRef]
  23. Siakeng, R.; Jawaid, M.; Asim, M.; Fouad, H.; Awad, S.; Saba, N.; Siengchin, S. Flexural and Dynamic Mechanical Properties of Alkali-Treated Coir/Pineapple Leaf Fibres Reinforced Polylactic Acid Hybrid Biocomposites. J. Bionic Eng. 2021, 18, 1430–1438. [Google Scholar] [CrossRef]
  24. Zhao, X.; Li, K.; Wang, Y.; Tekinalp, H.; Larsen, G.; Rasmussen, D.; Ginder, R.S.; Wang, L.; Gardner, D.J.; Tajvidi, M.; et al. High-strength polylactic acid (PLA) biocomposites reinforced by epoxy-modified pine fibers. ACS Sustain. Chem. Eng. 2020, 8, 13236–13247. [Google Scholar] [CrossRef]
  25. Figueroa-Velarde, V.; Diaz-Vidal, T.; Cisneros-López, E.O.; Robledo-Ortiz, J.R.; López-Naranjo, E.J.; Ortega-Gudiño, P.; Rosales-Rivera, L.C. Mechanical and Physicochemical Properties of 3D-Printed Agave Fibers/Poly(lactic) Acid Biocomposites. Materials 2021, 14, 3111. [Google Scholar] [CrossRef] [PubMed]
  26. Kamarudin, S.H.; Abdullah, L.C.; Aung, M.M.; Ratnam, C.T. Thermal and Structural Analysis of Epoxidized Jatropha Oil and Alkaline Treated Kenaf Fiber Reinforced Poly(Lactic Acid) Biocomposites. Polymers 2020, 12, 2604. [Google Scholar] [CrossRef] [PubMed]
  27. Yu, W.; Li, M.; Lei, W.; Pu, Y.; Sun, K.; Ma, Y. Effects of Wood Flour (WF) Pretreatment and the Addition of a Toughening Agent on the Properties of FDM 3D-Printed WF/Poly(lactic acid) Biocomposites. Molecules 2022, 27, 2985. [Google Scholar] [CrossRef]
  28. Khammassi, S.; Tarfaoui, M.; Škrlová, K.; Měřínská, D.; Plachá, D.; Erchiqui, F. Poly(lactic acid) (PLA)-Based Nanocomposites: Impact of Vermiculite, Silver, and Graphene Oxide on Thermal Stability, Isothermal Crystallization, and Local Mechanical Behavior. J. Compos. Sci. 2022, 6, 112. [Google Scholar] [CrossRef]
  29. Lendvai, L.; Brenn, D. Mechanical, morphological and thermal characterization of compatibilized poly(lactic acid)/thermoplastic starch blends. Acta Technica Jaurinensis 2020, 13, 1–13. [Google Scholar] [CrossRef] [Green Version]
  30. Fekete, I.; Ronkay, F.; Lendvai, L. Highly toughened blends of poly(lactic acid) (PLA) and natural rubber (NR) for FDM-based 3D printing applications: The effect of composition and infill pattern. Polym. Test. 2021, 99, 107205. [Google Scholar] [CrossRef]
  31. Khan, B.A.; Na, H.; Chevali, V.; Warner, P.; Zhu, J.; Wang, H. Glycidyl methacrylate-compatibilized poly(lactic acid)/hemp hurd biocomposites: Processing, crystallization, and thermo-mechanical response. J. Mater. Sci. Technol. 2018, 34, 387–397. [Google Scholar] [CrossRef]
  32. Orue, A.; Eceiza, A.; Arbelaiz, A. The use of alkali treated walnut shells as filler in plasticized poly(lactic acid) matrix composites. Ind. Crop. Prod. 2019, 145, 111993. [Google Scholar] [CrossRef]
  33. Boubekeur, B.; Belhaneche-Bensemra, N.; Massardier, V. Low-density polyethylene/poly(lactic acid) blends reinforced by waste wood flour. J. Vinyl Addit. Technol. 2020, 26, 443–451. [Google Scholar] [CrossRef]
  34. Bajpai, P.K.; Singh, I.; Madaan, J. Tribological behavior of natural fiber reinforced PLA composites. Wear 2013, 297, 829–840. [Google Scholar] [CrossRef]
  35. Kanakannavar, S.; Pitchaimani, J.; Ramesh, M.R. Tribological behaviour of natural fibre 3D braided woven fabric reinforced PLA composites. Proc. Inst. Mech. Eng. Part J J. Eng. Tribol. 2020, 235, 1353–1364. [Google Scholar] [CrossRef]
  36. Snowdon, M.R.; Wu, F.; Mohanty, A.K.; Misra, M. Comparative study of the extrinsic properties of poly(lactic acid)-based biocomposites filled with talc versus sustainable biocarbon. RSC Adv. 2019, 9, 6752–6761. [Google Scholar] [CrossRef] [Green Version]
  37. Lendvai, L.; Singh, T.; Fekete, G.; Patnaik, A.; Dogossy, G. Utilization of Waste Marble Dust in Poly(Lactic Acid)-Based Biocomposites: Mechanical, Thermal and Wear Properties. J. Polym. Environ. 2021, 29, 2952–2963. [Google Scholar] [CrossRef]
  38. Singh, T.; Gangil, B.; Singh, B.; Verma, S.K.; Biswas, D.; Fekete, G. Natural-synthetic fiber reinforced homogeneous and functionally graded vinylester composites: Effect of bagasse-Kevlar hybridization on wear behavior. J. Mater. Res. Technol. 2019, 8, 5961–5971. [Google Scholar] [CrossRef]
  39. Singh, T.; Lendvai, L.; Dogossy, G.; Fekete, G. Physical, mechanical and thermal properties of Dalbergia sissoo wood waste filled poly(lactic acid) composites. Polym. Compos. 2021, 42, 4380–4389. [Google Scholar] [CrossRef]
  40. Chauhan, R.; Singh, T.; Kumar, N.; Patnaik, A.; Thakur, N. Experimental investigation and optimization of impinging jet solar thermal collector by Taguchi method. Appl. Therm. Eng. 2017, 116, 100–109. [Google Scholar] [CrossRef]
  41. Rajeshkumar, G.; Seshadri, S.A.; Devnani, G.; Sanjay, M.; Siengchin, S.; Maran, J.P.; Al-Dhabi, N.A.; Karuppiah, P.; Mariadhas, V.A.; Sivarajasekar, N.; et al. Environment friendly, renewable and sustainable poly lactic acid (PLA) based natural fiber reinforced composites—A comprehensive review. J. Clean. Prod. 2021, 310, 127483. [Google Scholar] [CrossRef]
  42. Nyambo, C.; Mohanty, A.K.; Misra, M. Effect of Maleated Compatibilizer on Performance of PLA/Wheat Straw-Based Green Composites. Macromol. Mater. Eng. 2011, 296, 710–718. [Google Scholar] [CrossRef]
  43. Huda, M.S.; Drzal, A.L.T.; Misra, M.; Mohanty, A.K.; Williams, K.; Mielewski, D.F. A Study on Biocomposites from Recycled Newspaper Fiber and Poly(lactic acid). Ind. Eng. Chem. Res. 2005, 44, 5593–5601. [Google Scholar] [CrossRef]
  44. Tao, Y.; Wang, H.; Li, Z.; Li, P.; Shi, S.Q. Development and Application of Wood Flour-Filled Polylactic Acid Composite Filament for 3D Printing. Materials 2017, 10, 339. [Google Scholar] [CrossRef] [PubMed] [Green Version]
  45. Erdoğan, A.; Gök, M.S.; Koç, V.; Günen, A. Friction and wear behavior of epoxy composite filled with industrial wastes. J. Clean. Prod. 2019, 237, 117588. [Google Scholar] [CrossRef]
  46. Megahed, A.A.; Agwa, M.; Megahed, M. Improvement of Hardness and Wear Resistance of Glass Fiber-Reinforced Epoxy Composites by the Incorporation of Silica/Carbon Hybrid Nanofillers. Polym. Technol. Eng. 2017, 57, 251–259. [Google Scholar] [CrossRef]
Figure 1. (a) SEM micrograph of North Indian rosewood waste, (b) fabricated biocomposites.
Polymers 14 02230 g001
Figure 2. TGA (a) and DTG (b) curves for PLA biocomposites, respectively.
Polymers 14 02230 g002
Figure 3. Volumetric wear of composite as a function of normal load.
Polymers 14 02230 g003
Figure 4. Volumetric wear of the composites as a function of sliding velocity.
Polymers 14 02230 g004
Figure 5. Main parameter effects for various SN ratio values of volumetric wear.
Polymers 14 02230 g005
Figure 6. Contour plots of volumetric wear for wood waste content with respect to (a) normal load, (b) sliding distance, and (c) sliding velocity.
Polymers 14 02230 g006
Figure 7. Contribution ratio of each control parameter to volumetric wear.
Polymers 14 02230 g007
Figure 8. Worn micrographs of biocomposites: (a,b) bare PLA and (c,d) 2.5 wt.% wood waste-filled biocomposites at lower and higher magnification.
Polymers 14 02230 g008
Figure 9. Worn micrographs of biocomposites: (a,b) 5 wt.%, (c,d) 7.5 wt.%, and (e,f) 10 wt.% wood waste-filled biocomposites at lower and higher magnification.
Polymers 14 02230 g009
Table 1. Levels of the control parameters used in the experiment.
Control ParametersLevelsUnits
IIIIIIIVV
A: Wood waste02.557.510wt.%
B: Normal load1020304050N
C: Sliding distance5001000150020002500m
D: Sliding velocity0.601.21.82.43m/s
Table 2. Experimental design.
Test RunControl ParametersTest RunControl Parameters
ABCDABCD
10.0105000.6145.0405001.8
20.02010001.2155.05010002.4
30.03015001.8167.51020001.2
40.04020002.4177.52025001.8
50.05025003.0187.5305002.4
62.51010001.8197.54010003.0
72.52015002.4207.55015000.6
82.53020003.021101025002.4
92.54025000.62210205003.0
102.5505001.223103010000.6
115.01015003.024104015001.2
125.02020000.625105020001.8
135.03025001.2
Table 3. TGA and DTG results of wood waste-filled PLA biocomposites.
BiocompositeTemperature at Different Weight Loss (°C)Tpeak (°C)
T5T25T50T75
PLA327348357365360
PLA+2.5 wt.% wood waste320346356365359
PLA+5 wt.% wood waste312337350359354
PLA+7.5 wt.% wood waste304327340351345
PLA+10 wt.% wood waste300325338348342
Table 4. Volumetric wear and corresponding SN ratio.
Test RunVolumetric Wear (cm3)SN RatioTest RunVolumetric Wear (cm3)SN Ratio
10.009440.5374140.066323.5697
20.036528.7541150.096020.3546
30.050825.8827160.059224.5536
40.068623.2735170.078022.1581
50.133217.5099180.116918.6437
60.009140.8192190.118918.4964
70.021833.2309200.103319.7180
80.060624.3505210.083021.6184
90.036828.6830220.078522.1026
100.035329.0445230.091620.7621
110.051525.7639240.147116.6477
120.025831.7676250.172715.2542
130.060024.4370
Table 5. SN ratio response table.
LevelABCD
I27.1930.6626.7828.29
II31.2327.6025.8424.69
III25.1822.8224.2525.54
IV20.7122.1323.8423.42
V19.2820.3822.8821.64
Delta11.9510.283.906.65
Rank1243
Table 6. Contribution ratio results.
Control Parameter ƛ i ƛ ψ
Wood waste24.7294.3663201.571546.82
Normal load72.731736.08
Sliding distance9.87894.90
Sliding velocity24.594612.20
Publisher’s Note: MDPI stays neutral with regard to jurisdictional claims in published maps and institutional affiliations.

