3.1. Synthesis and Characterization of PS-b-PLA Block Copolymers
The synthesis of the PS
n-
b-PLA
m copolymers was executed by copper-catalyzed azide-alkyne cycloaddition (CuAAC) of the azide and acetylene end-groups of the PS-N
3 and PLA-Ac, respectively. This synthetic approach roughly consisted of the 1,3-cycloaddition reaction of the two functional groups: azide and alkyne, these functionalities were located at the chain-ends of PS and PLA blocks, respectively. Hence, a CuAAC of azide and alkyne groups could obtain a triazole-based covalent union between PS and PLA blocks. The CuAAC strategy to build a covalent bond between blocks has been employed successfully to obtain block copolymers such as poly(styrene-
b-
N-isopropylacrylamide) [
30]. Note that both homopolymers were separately synthesized and purified. PS-N
3 was obtained via ARGET ATRP and followed by a substitution of the bromine end group using sodium azide. PLA-Ac was obtained from a ROP of the corresponding monomer. The experimental details of these polymerizations can be found in the
Supplementary Materials. A schematic representation of the synthesis of the block copolymers is displayed in
Scheme 1.
The isolated copolymers were characterized by
1H NMR and SEC.
Table 1 summarizes the molecular features of the isolated copolymers,
1A and
2A contain an aliphatic triazole derivative in their structure, while compounds
1B–
3B contain the aromatic triazole functional group.
Average number molar mass (
Mn) values were estimated from the analysis of
1H NMR spectra of each copolymer. After obtaining the values of
n and
m for each block, the volume fraction (
ƒA) was calculated from the
ƒPLA equation (
Table 1).
ƒA value of the minority block is a crucial parameter to control the morphology of the film surface for the self-assembling process of the block copolymers. Theoretically, by varying the
ƒPLA parameter in the range from 0.3 to 0.4, we could aim to obtain a cylindric morphology [
31]. As gathered from
Table 1, the obtained
ƒPLA value of copolymers
1A–
2B is within this range, whereas the
ƒPLA value of compound
3B is closer to 0.5, which could lead to a gyroid or a lamellar morphology. Thus, we decided to investigate the self-assembly behavior in thin films by using copolymer
1A, as described in following section of this manuscript.
Mn, and dispersity (Ɖ) values of the copolymers were estimated by SEC measurements as well. Most of the copolymers exhibited a narrow molar mass distribution (Ɖ = 1.12–1.24) suggesting that the controlled homopolymerization of each block in combination with the click coupling reaction between both end-functionalized PS and PLA homopolymers was successful.
By observing the
Mn values reported in
Table 1, it should be noted that, in most cases, these estimated values have minor variations as obtained from
1H NMR and SEC characterization techniques. This effect could be attributed to the size of the copolymer in solution as compared to the size of the PS standard calibration used to estimate
Mn values of the copolymer. Hence, variations in the
Mn values of the copolymers are expected when observing SEC results due to the chemical difference between the analyte and the standard reference [
32]. It is worth mentioning that higher molar masses (
Mn > 20 kg mol
−1) promote the phase segregation in block copolymers. At lower values, the incompatibility between the blocks is weaker, which inhibits microphase segregation [
33]. Thus, we aimed to obtain block copolymers with a
Mn value between 20 and 30 kg mol
−1 in order to promote phase segregation in the later stages of this investigation.
Further NMR analysis confirmed the successful outcome of the click reaction.
Figure 1 displays the
1H NMR spectrum of PS
77-
b-PLA
81,
1B, where the most representative signals have been assigned. Copolymer
1B, of a lower molar mass, was used to better observe the end group units of the copolymer. The broad signal within the chemical shift (δ) range from 7.24 to 6.25 ppm was assigned to the aromatic protons of the PS repetitive unit. Similarly, a broad signal at δ = 5.47–4.90 ppm was assigned to the –CH group of the PLA repetitive unit. To further confirm the presence of the triazole derivative, we proposed the following assignations to the phenyl-triazolyl junction group: δ = 8.21–8.05 ppm and 7.91–7.73 ppm corresponding to protons
F and
G as indicated in
Figure 1. The triazolyl –CH group (proton
E,
Figure 1) was ascribed to the signal at δ = 8.03 ppm that is slightly overlapped with the aromatic protons assigned to
F. The assigned proton signals are in good agreement with previous reports investigating similar systems. For instance, Terzic et al. reported the synthesis of poly(vinylidene fluorine) (PVDF) triblock copolymers via CuAAC [
30], where the triazole proton was assigned at δ = 8.09 ppm, which is consistent with our results considering the similarity of the chemical vicinity. In addition, a diffusion-ordered spectroscopy (DOSY) NMR measurement confirmed that the copolymer was obtained as evidenced by the presence of a single diffusion coefficient signal, as it is expected for block copolymers (see
Supplementary Materials, Figure S1).
Note that the synthesis of our block copolymers considered two derivatives to form the triazole groups, an aliphatic and an aromatic derivative, represented by compounds A and B in
Table 1, respectively. It is expected that the presence of an aromatic or aliphatic triazole derivative unit may not largely affect the phase segregation of the copolymer. However, the presence of an aromatic derivative may contribute to the complexation with a metallic center on the porous matrix due to an electronic delocalization of the aromatic rings [
34].
Overall, we conclude that click coupling reaction at the investigated conditions enables modulation of the PS:PLA ratio that is required to obtain specific morphologies. At this stage, we assume that the obtained copolymers are adequate candidates to undergo microphase segregation. Thus, the physicochemical properties of PS-PLA-based copolymers will mainly enable microphase segregation regardless of the functionalization present in their structure. Hence, we expect that the triazole functionality junction in the synthesized copolymers might not interfere with the phase segregation process and remain present on the surface of the final PS-porous matrix.
3.2. Solvent Vapor Annealing (SVA)
As reported before, PS-
b-PLA copolymers are eligible materials to pattern different morphologies at the mesoscale [
23]. Therefore, we investigated the self-assembly of these copolymers by monitoring the morphology of prepared thin films via scanning electron microscopy (SEM). The starting copolymer solution was prepared by dissolving copolymer
1A in THF (2.0%
w/
w). This solute-solvent system was chosen after comparing a first set of as-spun substrates using THF, toluene, CH
2Cl
2, and dioxane as solvents at the same copolymer concentration. SEM of the as-spun samples dissolved in THF exhibited a better periodicity of the formed domains on the surface as compared to the samples dissolved in toluene, CH
2Cl
2, or dioxane (see
Supplementary Materials, Figure S2). In addition, samples that were dissolved in THF also appeared to promote phase segregation by a simple spin-coating process on the silicon wafer. Hence, we decided to continue our analysis with THF-based copolymer solutions.
Regarding the annealing solvent, we selected
o-xylene due to the polar affinity with the PS phase, which could selectively contribute to the self-assembly process on the thin film surface. On that account, several pieces of wafers were spin coated and annealed as described in the
Section 2.4.2. After SVA, the substrates were air-dried inside a fume hood and analyzed by SEM.
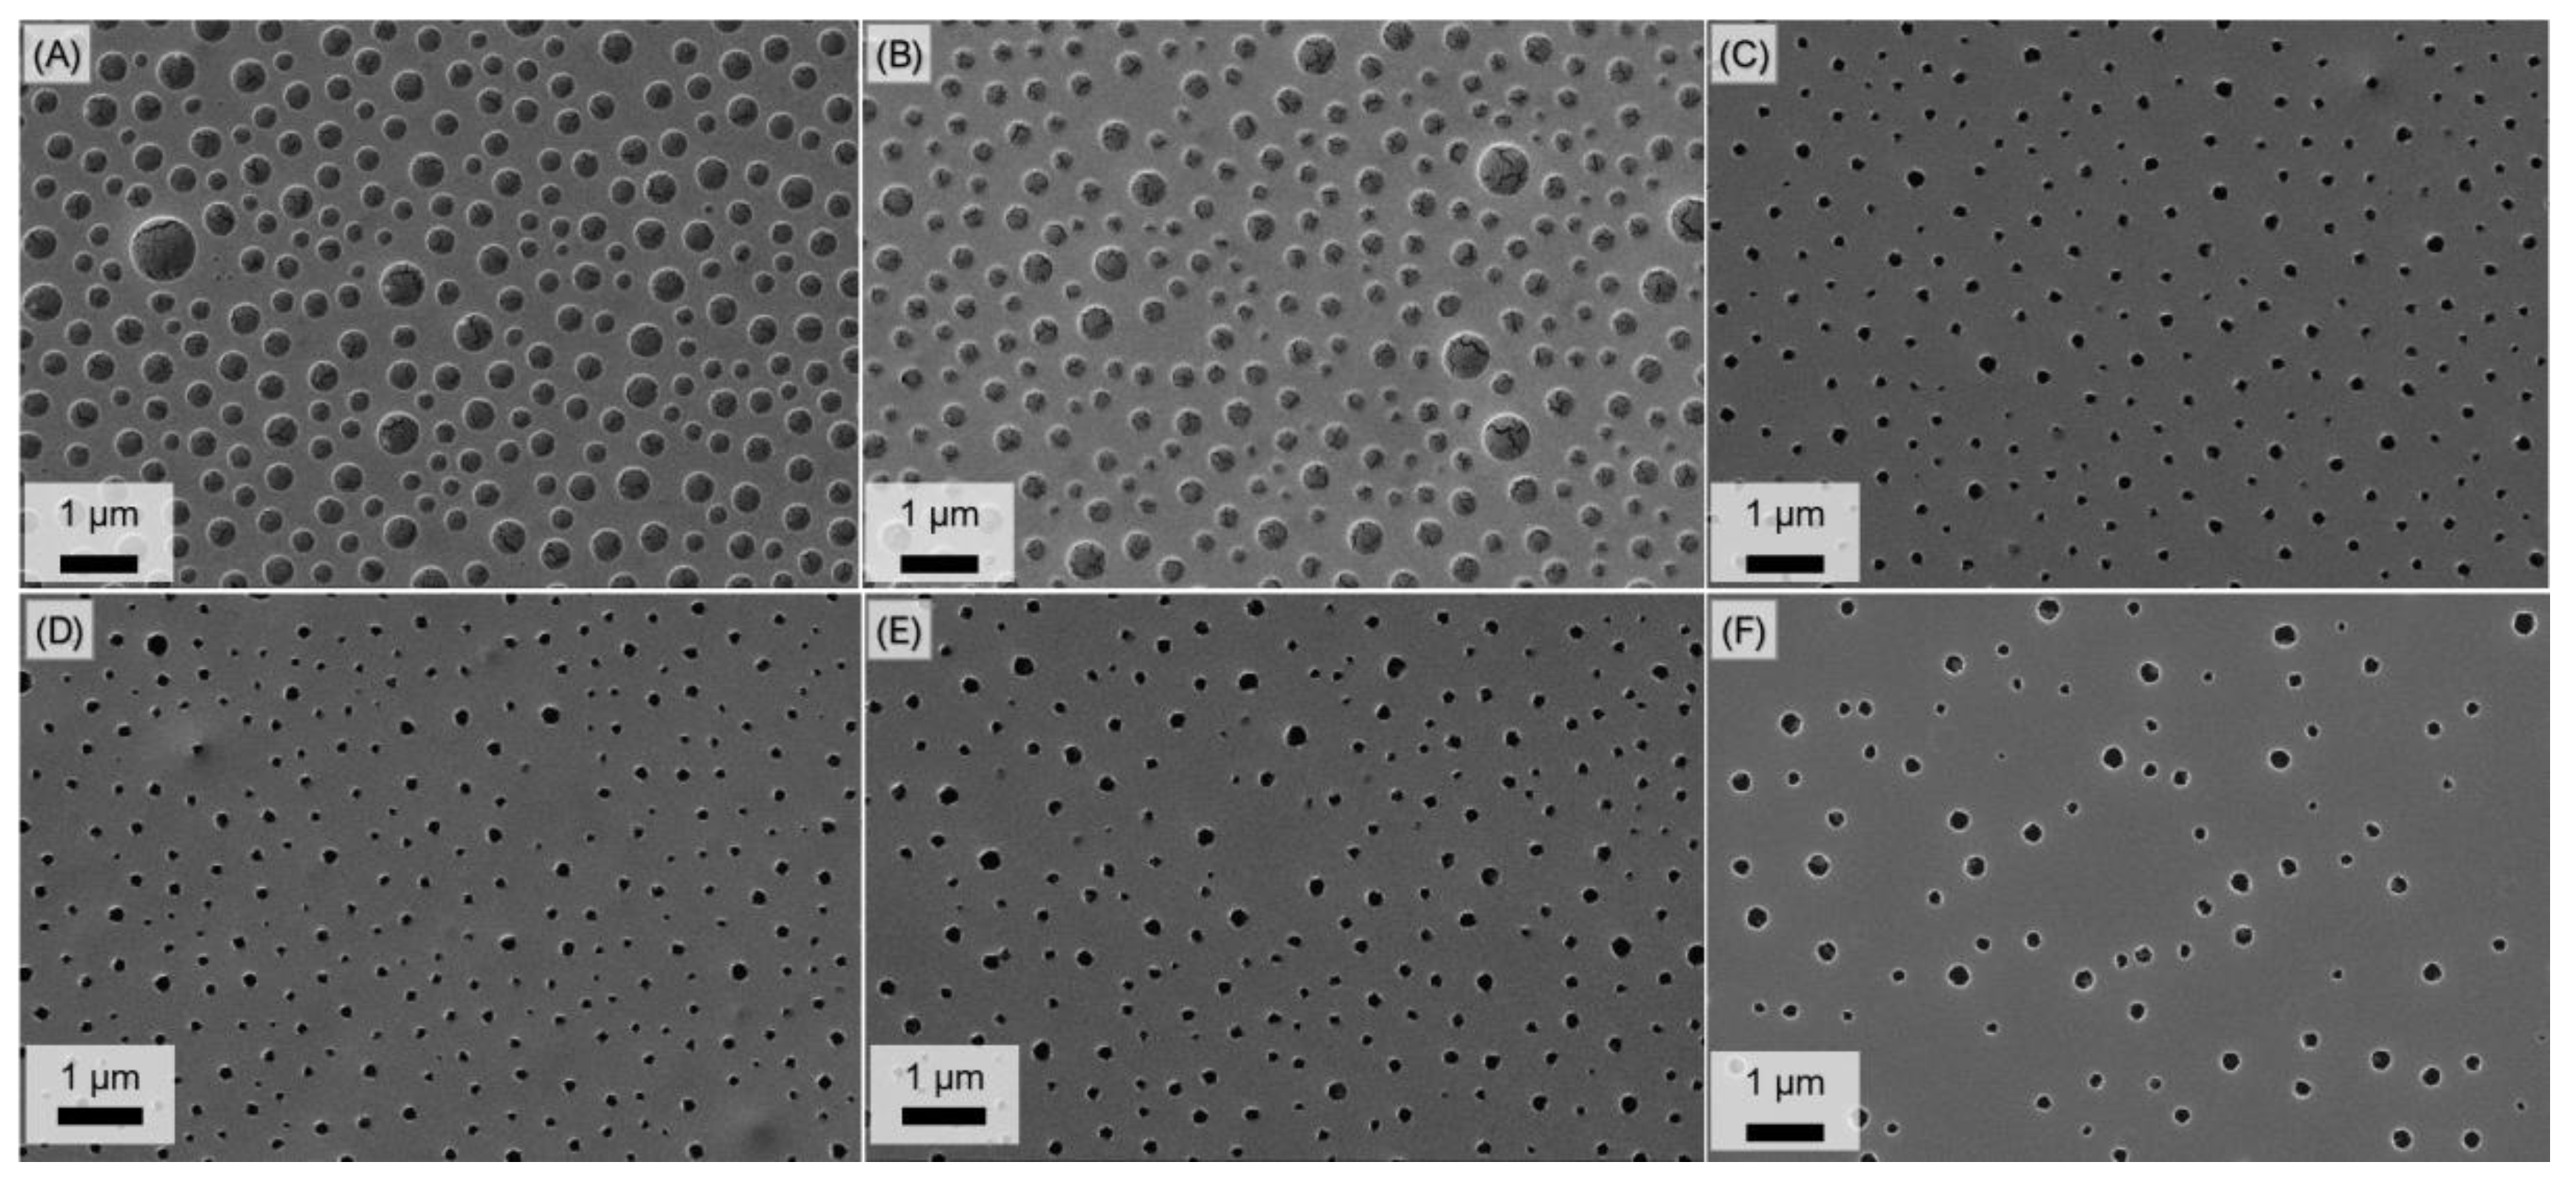
SEM images of the as-spun substrate, shown in
Figure 2A, exhibited a two-phased surface in which circle-like structures are homogeneously distributed across a continuous phase. As previously mentioned, we aimed to obtain a cylindrical morphology on the film, in which PLA domains were homogeneously distributed across the PS matrix. In this case, the obtained morphology resembles a ‘dotting’ pattern, similar to the one reported for analogous systems [
8] as evidenced by the circular shapes throughout the film. Therefore, we assumed that the circular structures (0.2–1 µm) correspond to a segregated phase of PLA, since it is the minority block of the block copolymer system. Hence, the continuous phase might correspond to a PS matrix. After 15 min of SVA (
Figure 2B), these structures did not exhibit a significant change compared to the morphology observed on the as-spun substrate. After 45 min of annealing with
o-xylene (
Figure 2C), the surface of the substrates exhibited a hollowed structure considering the contrast between the continuous phase and the circle-like structures. At this point, the PLA minority phase seems to be etched from the surface. Nonetheless, no attempts to remove the PLA phase were made at this stage. Thus, we hypothesize that the PLA domains formed an interphase between the PS and the silicon substrate, which may be attributed to the chemical affinity between the PLA and the silicon wafer surface. This effect was further investigated via AFM on the same substrate and subsequent image correction and analysis with Gwyddion v2.47 software. The hard tapping conditions under which the measurement was carried out allowed for the penetration of the tip into the softer phase of the block copolymer film, as revealed by the observed topography contrast between the respective domains. In this additional characterization, the holes (PLA domains)—formed after 45 min of SVA—appeared to interact with the substrate at approximately 100 nm below the continuous phase (PS) (
Figure S3).
The software ImageJ was used to measure and analyze the pore-like structures of the SEM images. The mean sizes were determined with a minimum of 20 measurements on different areas of the image. According to this size analysis of the pore-like structures on the SEM image of
Figure 2C, the diameter of the formed cylinders has a mean size of 125 ± 22 nm after 45 min of SVA with
o-xylene.
Longer annealing times were performed on the rest of the spun substrates and the corresponding SEM images are shown in
Figure 2D–F. In these images, a similar pattern to that of
Figure 2C (45 min of SVA) can be observed. Although, after 6 h (
Figure 2F), the pore homogeneity on surface of the film starts vanishing as compared to shorter annealing times. This suggests that, for longer SVA times, the solvent may begin to dissolve the film. The size analysis of the pore diameter for
Figure 2D–F yielded similar values within a range of 121 to 139 nm.
After the annealing step, it is desirable to selectively remove the PLA minority phase to obtain a hollowed PS-matrix. In this regard, we attempted to remove PLA by immersing the substrates in an alkaline solution (NaOH 0.5 M). However, we observed delamination of the entire film after a couple of minutes of immersion in the alkaline medium. This effect has also been observed for analogous systems where the substrate surface is not compatible enough with the continuous phase, which leads to delamination of the film [
27,
35].
Consequently, we carried out a pretreatment of the substrates to avoid delamination of the film. The pretreatment of the substrates consisted in the formation of an interlayer between the block copolymer and the wafer surface. It was hypothesized that this interlayer might promote compatibility between the substrate surface and the copolymer film. As described in the materials and methods section, the surface of the silicon wafer was etched with a
piranha solution followed by a silylation of the surface. As a result, a hydrophobic interlayer is formed between polymer film and substrate [
36]. Thereafter, substrates were pretreated as indicated above and, subsequently, spin coated using the same conditions to those applied to the untreated substrates. Previous results suggested that 45 min of SVA with
o-xylene might form cylindrical-like cavities; therefore, we attempted to replicate this procedure on pretreated substrates.
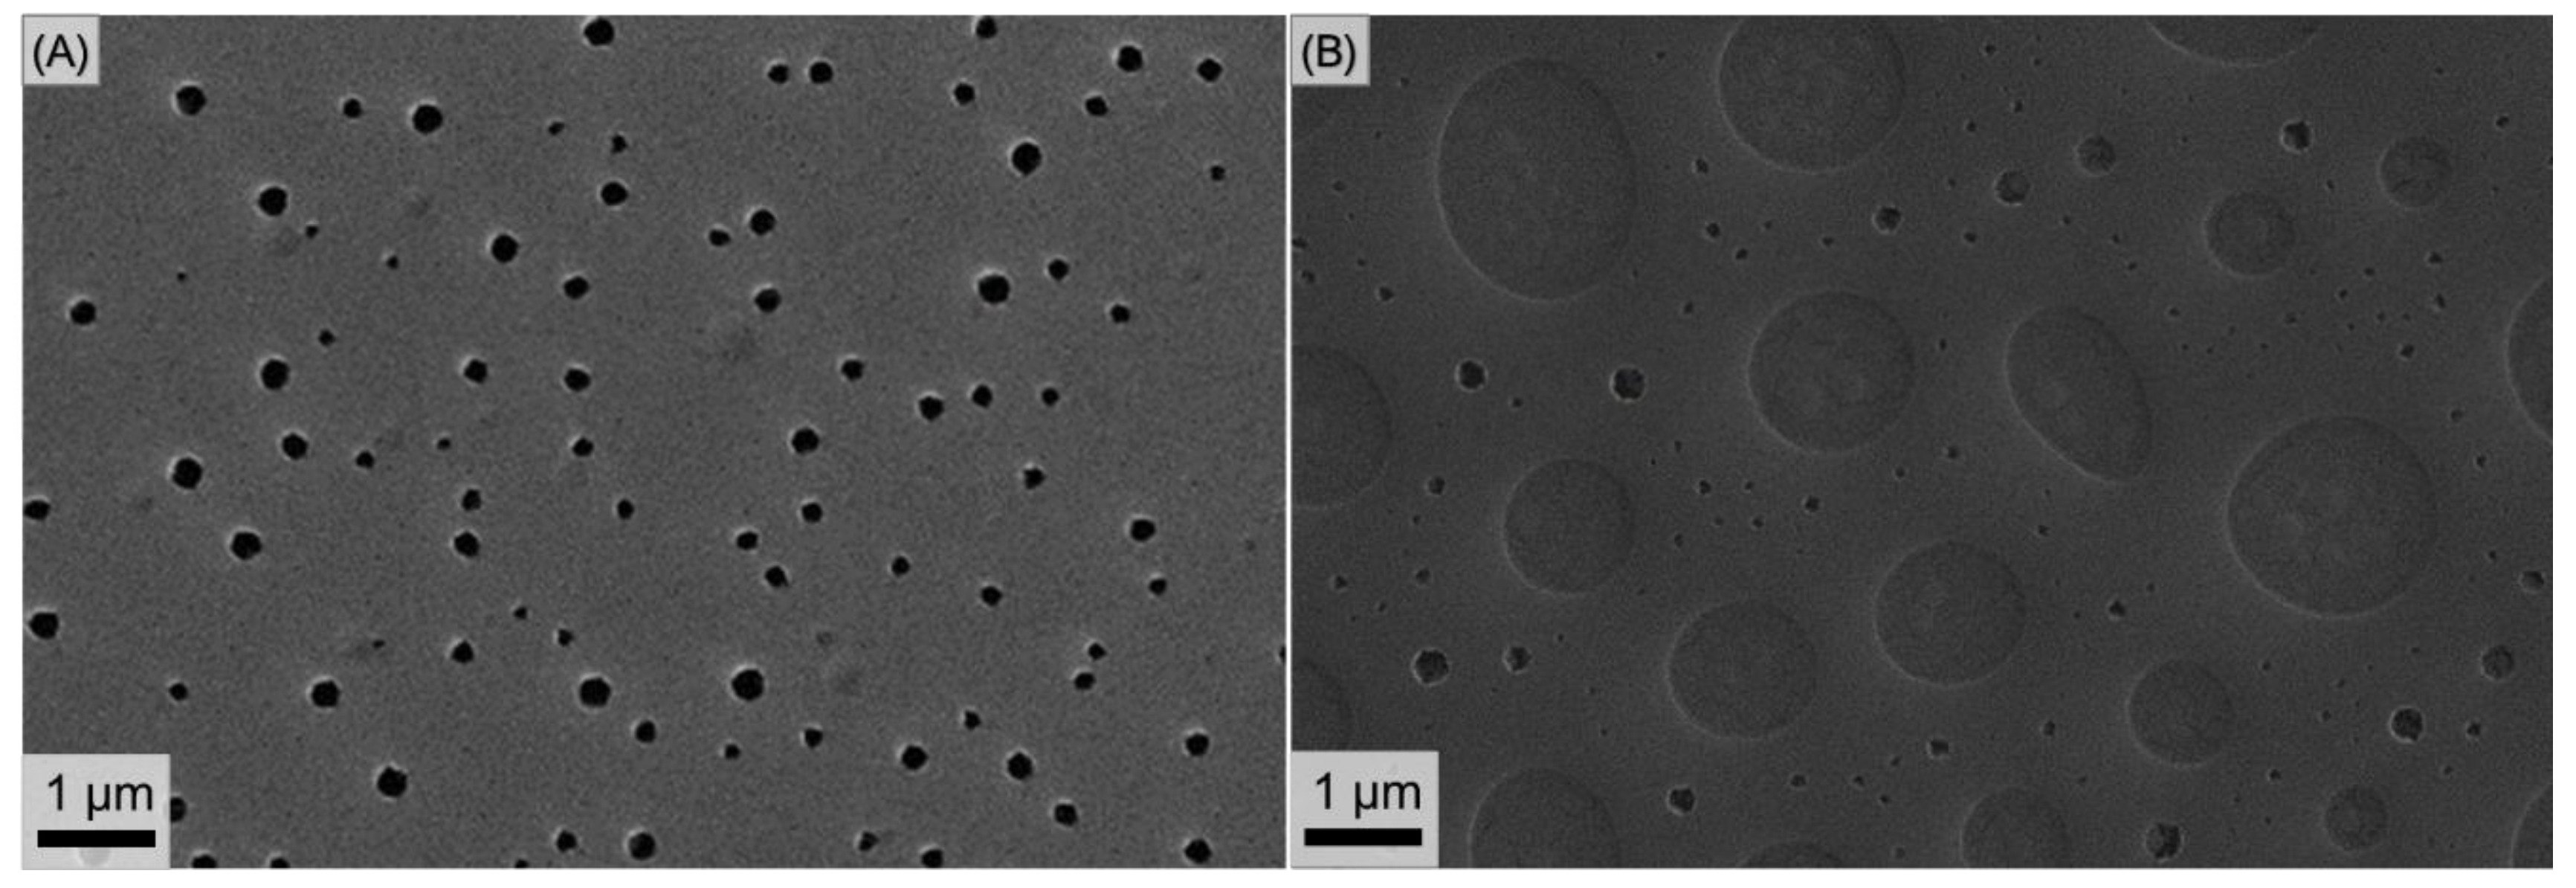
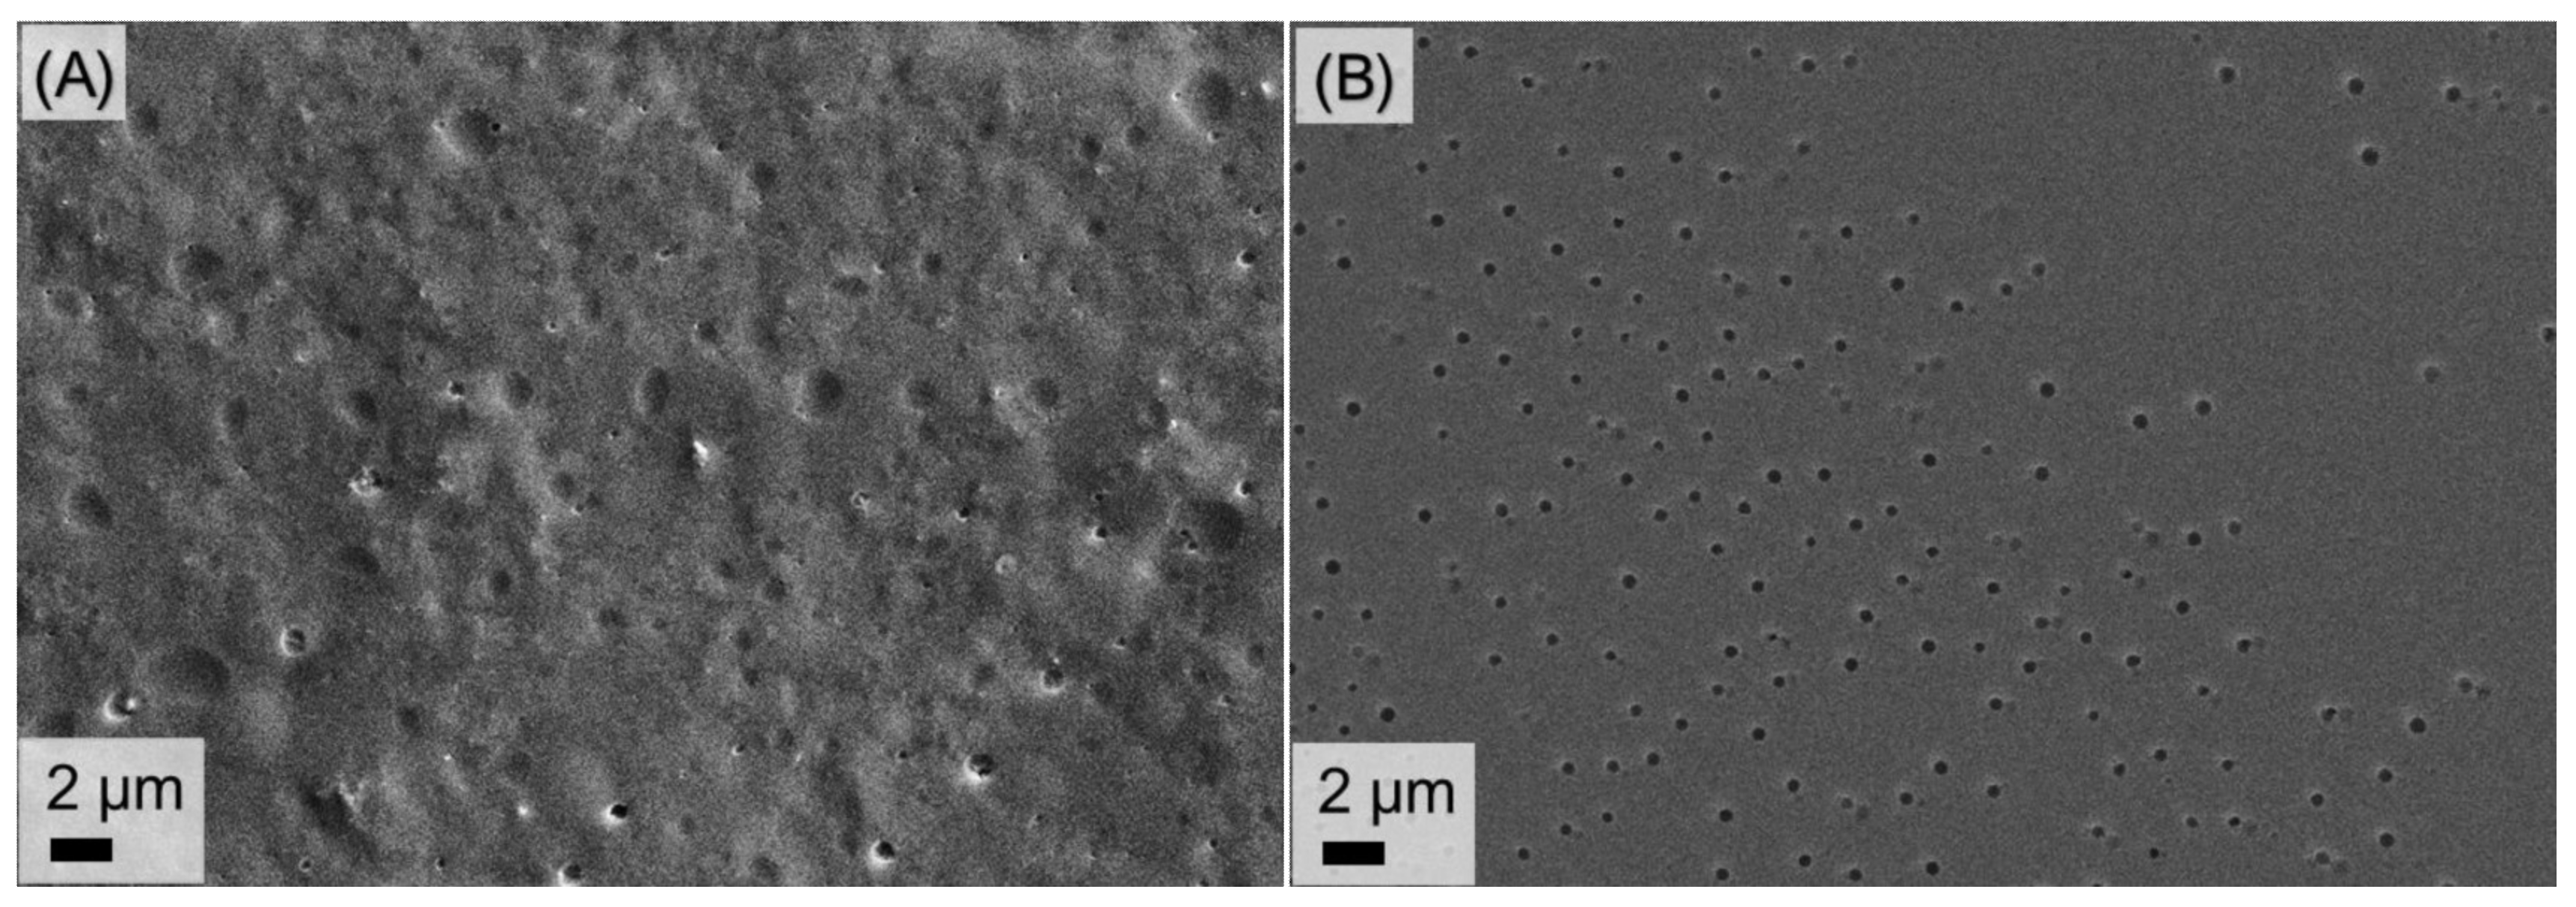
Figure 3 shows a comparison between a spin-coated sample on an untreated surface (
Figure 3A) and a spin-coated sample on a pretreated surface (
Figure 3B) after 45 min of SVA. The previously tested annealing conditions were not reproducible for the HMDS-treated surfaces. A noticeable difference can be observed on the pretreated surface where large hollows (1–3 µm) were formed across the surface of the film as well as some smaller pore-like structures surrounding those larger structures. Thereafter, the pores and the pattern regularity on the film were lost after annealing. Thus, we hypothesized that longer SVA times would allow the phases to reach an equilibrium into a more ordered state.
Considering this, an additional SVA experiment was performed at considerably longer annealing times: 2, 4, 8, and 16 h. Unexpectedly, longer SVA times did not promote phase segregation and the formation of morphology on the film. Based on the SEM analysis of the samples, we theorized that at longer annealing times (t > 45 min) the films seem to be prone to dewetting of the surface leading to their damage (see
Figure S4 for more details). The interlayer formation derived from the HMDS pretreatment had a significant influence on the self-assembly process of the investigated block copolymer system on the surface. Thus, in this case, the utilized annealing solvent and conditions did not promote the cylindrical morphology observed on the untreated substrates.
Despite the aforementioned, it should not be discarded that as-spun substrates on untreated substrates exhibited a homogeneous pattern. In this regard, we considered that the morphology of as-spun films is comparable to those observed in previous reports with analogous systems [
29]. Therefore, we decided to further investigate and exploit the characteristics of as-spun films on untreated substrates and without SVA, which is discussed later on in
Section 3.4. Considering these results, we explored other alternative methods to obtain ordered-porous structures, as discussed next.
3.3. Thermal Annealing
Thermal transitions of block copolymers have also been used to anneal microphases to access certain morphologies. To further investigate the microphase segregation behavior of copolymer
1A, thermal annealing (TA) experiments of thin films were additionally performed. In this regard, the thermal transitions of the synthesized block copolymers were previously evaluated using differential scanning calorimetry (DSC) and thermogravimetric analysis (TGA) (
Table S1).
Regarding DSC investigations, the glass transition temperature (T
g) of each block allowed us to determine a range of values where the copolymer is in a disordered state. Furthermore, based on TGA measurements, we can determine at which temperature the copolymer begins to decompose (T
D). By analyzing these two parameters we proposed a range of temperature values in which the copolymer transitions may drive the system from a fluid disordered state into an ordered state. Hence, the order–disorder transition (T
ODT) can be found above the values of the T
g’s of both individual blocks and below the T
D. According to the DSC and TGA measurements of the synthesized block copolymers, the proposed temperature range is 110–210 °C. Previous investigations with analogue systems report a T
ODT = 138 °C [
33].
As discussed for previous annealing experiments, we observed delamination of the films deposited on the untreated substrates. In an attempt to prevent this effect, we also performed the silylation treatment on the wafers for the thermal annealing experiments. Considering the thermal profile of the investigated block copolymer system, we performed a thermal annealing experiment using the same procedure for the preparation of thin films as described above for the SVA experiments.
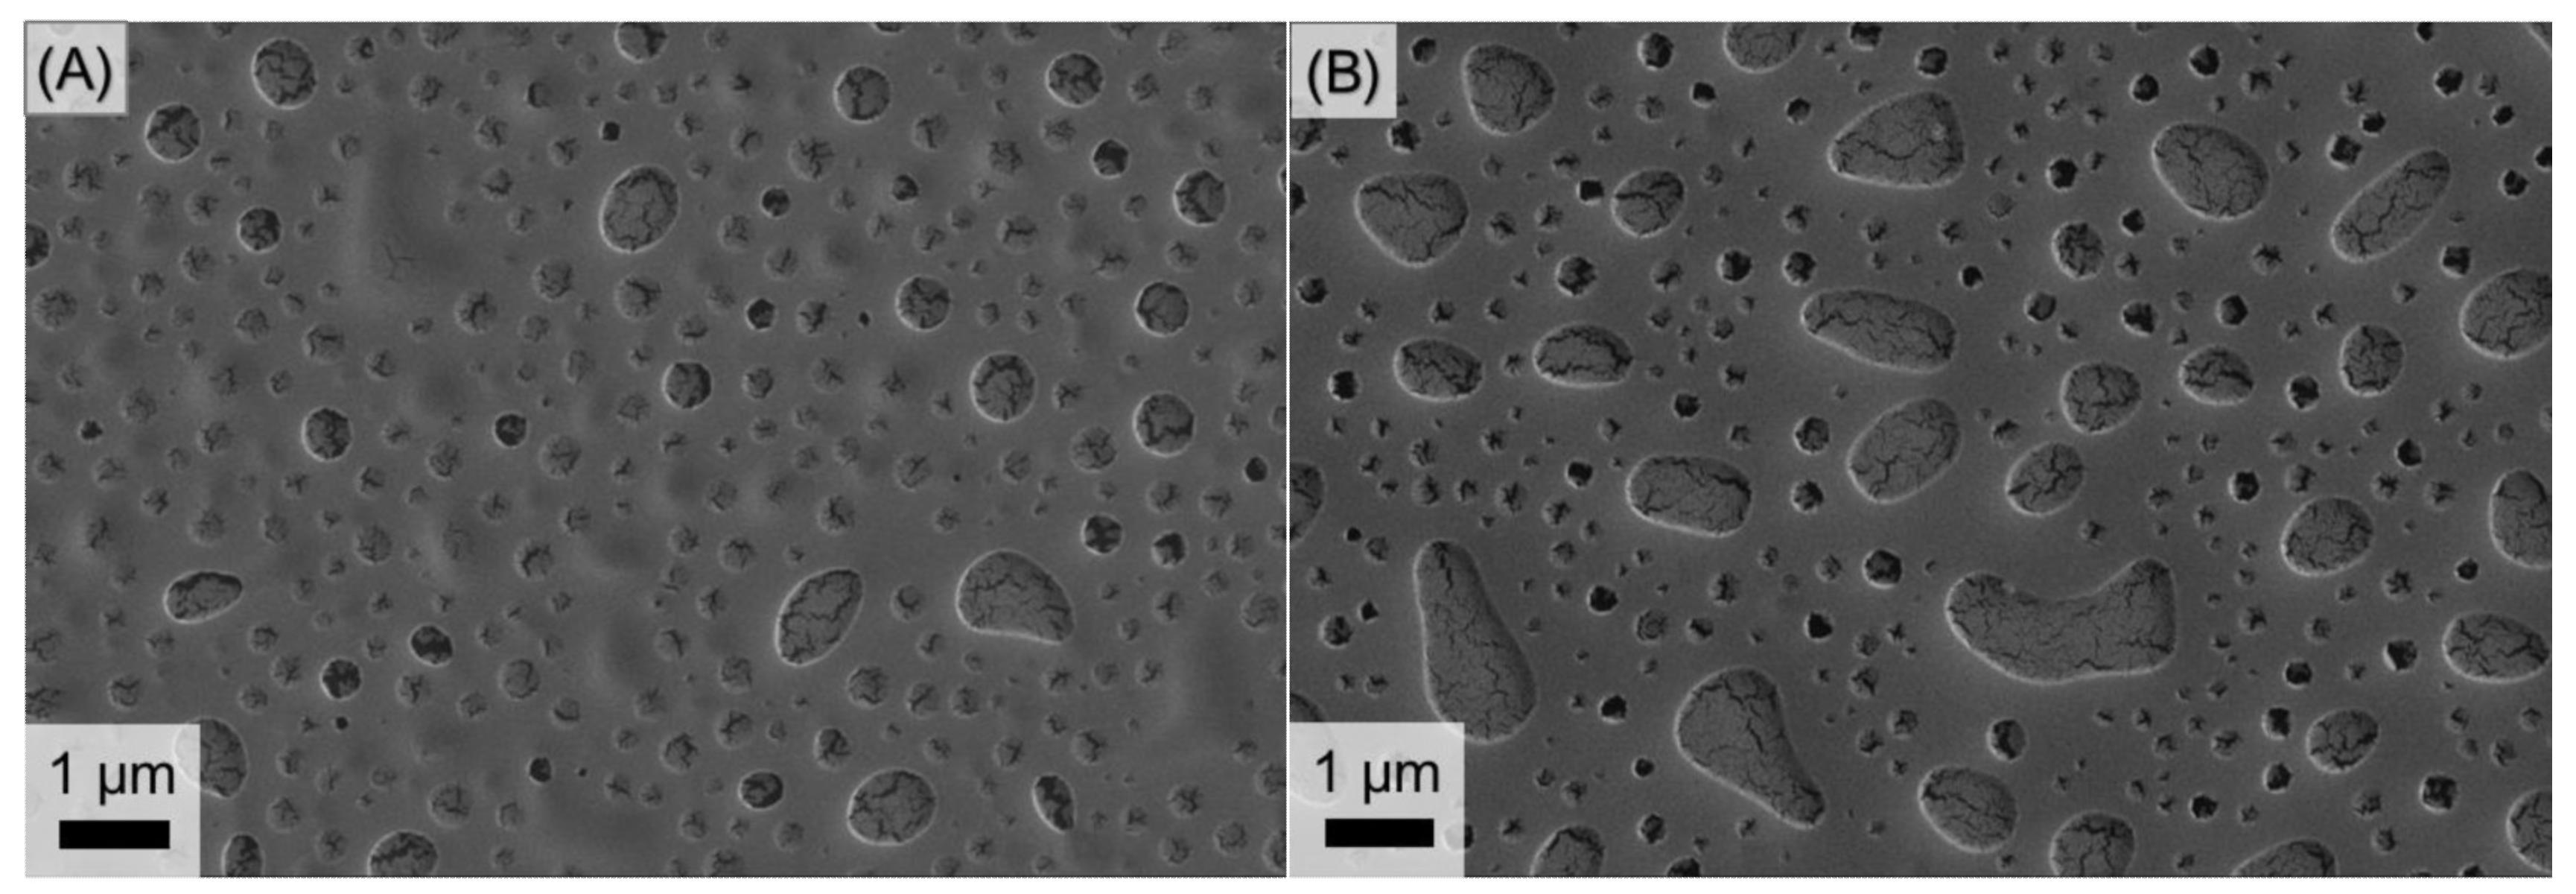
Figure 4 shows SEM images of thin films thermally annealed at 120 and 150 °C for 10 min. At 120 °C (
Figure 4A) the film shows an irregular distribution of PLA domains suggesting that the system did not reach an equilibrium leading to a cylindrical phase segregation at the investigated conditions. Two size populations of the pore-like structures are visible in this image, where the smaller pores seem to merge with each other to form larger structures with an irregular shape. Although, at this point, this latter statement is only a hypothesis of what may be occurring.
At 150 °C (
Figure 4B) the film presents a noticeable difference between the size populations of PLA domains. It has been reported that higher temperatures promote the formation of more uniform patterns in PS-PLA based thin films [
36]. However, this was not the case for the observed films, as there is a greater gap between the size populations of the formed structure and, somewhat, a more irregular pattern after increasing the temperature to 150 °C.
The thermally annealed films exhibited a different morphology pattern compared to that obtained with the SVA method on treated substrates. At a first glance, TA might seem to promote a more regular arrangement of the domains regarding the size of the pore-like structures as opposed to the observed with SVA pretreated sample, where the difference between the size of larger and smaller pores was more notable (
Figure 3B). However, the pore-like structures in the thermally annealed films yielded two size populations, which might lead to irregularities in the resulting film once the PLA phase is selectively removed.
Thermal annealing of the thin films may represent an alternative to promote orientation of the PS-PLA domains by varying some parameters. In other reports [
36], the use of a vacuum oven, instead of a conventional oven, at a higher temperature can provide thin films with fewer irregularities as the probability of PLA decomposition is reduced due to the presence of less oxygen and/or humidity.
3.4. Hydrolysis
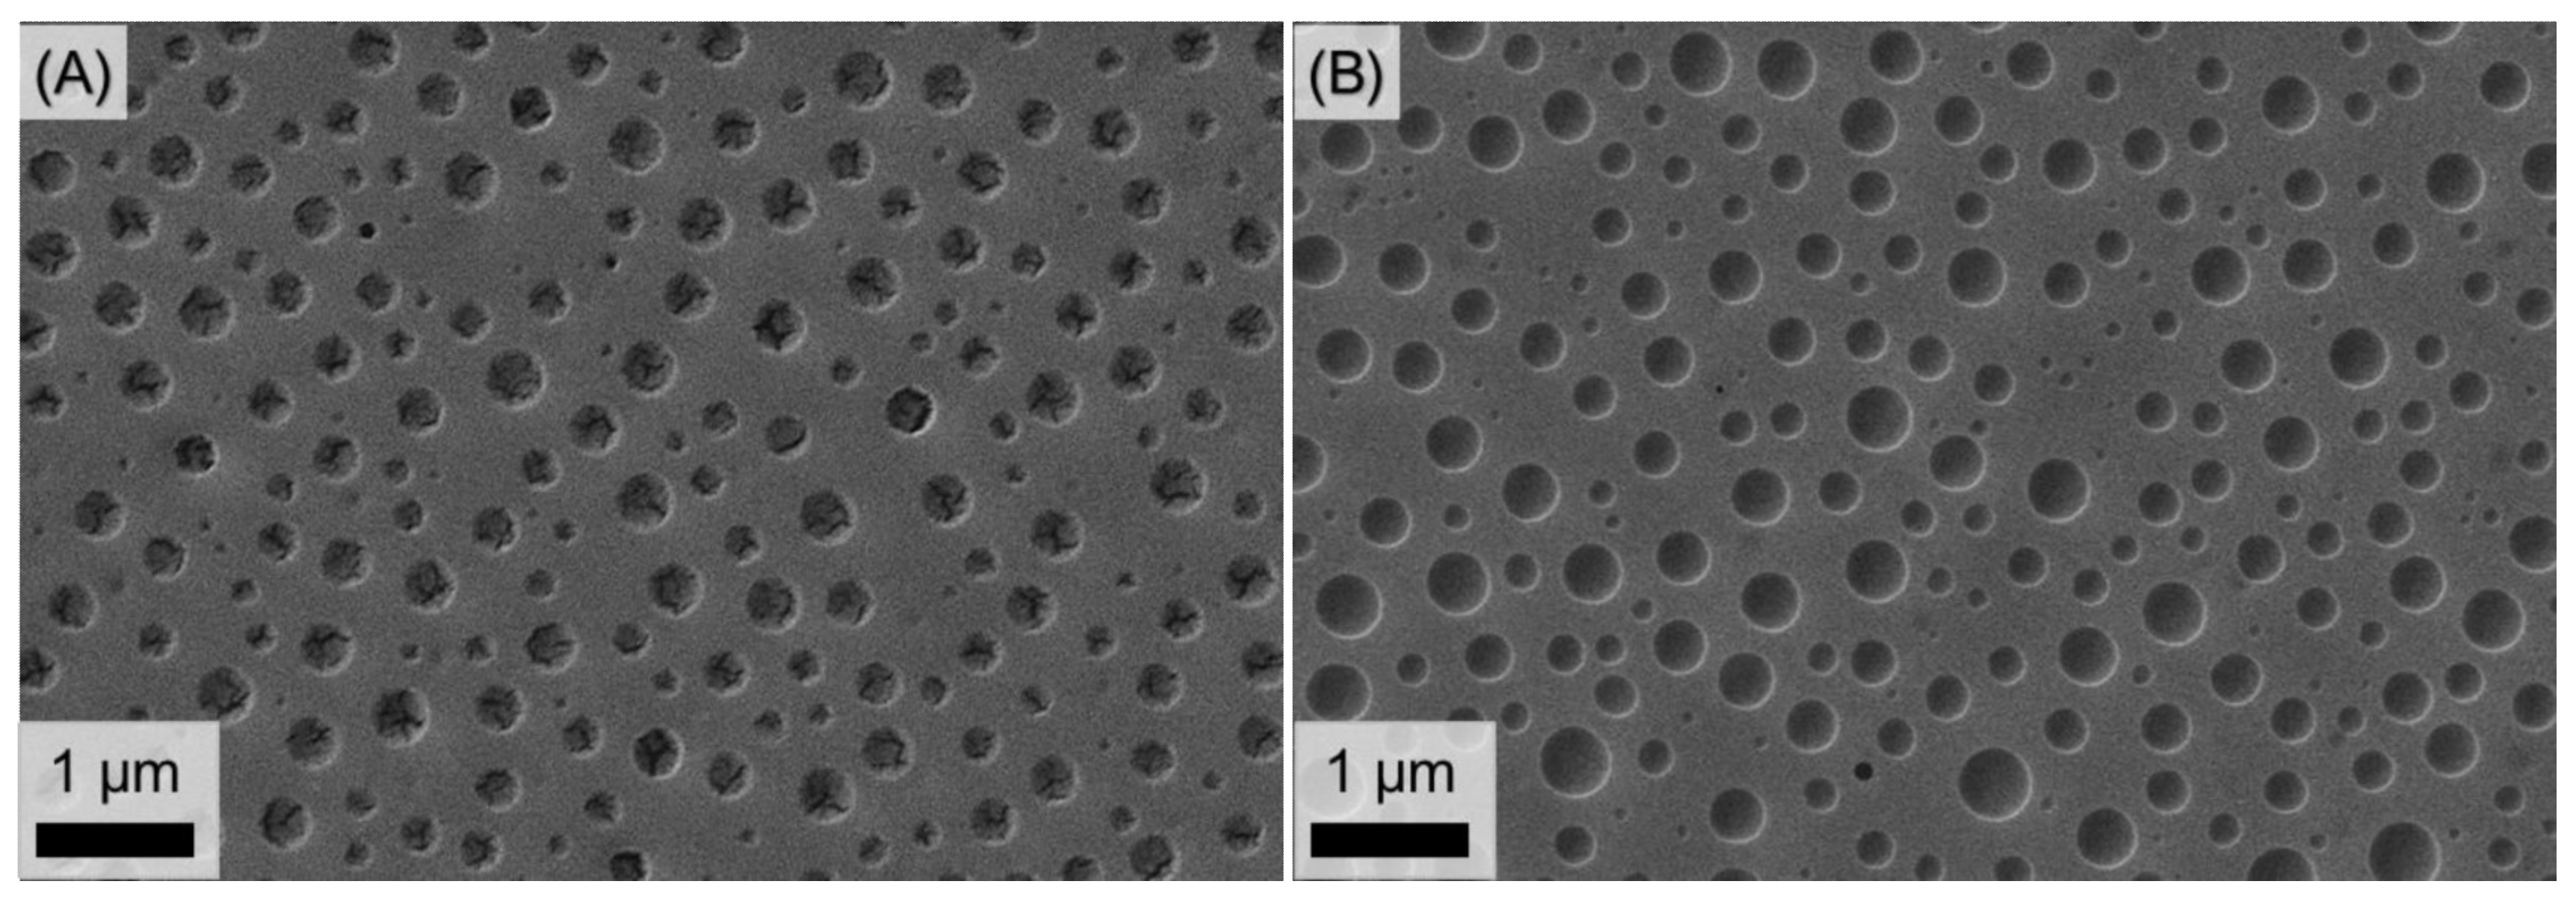
At this stage, we would like to outline some of the findings: (a) SVA of untreated surfaces yielded an acceptable homogeneity on the film surface; however, it led to delamination when attempting to selectively remove the PLA domains; (b) SVA of the pretreated substrates did not exhibit the same homogeneity and regularity on the morphology of the film as it did for untreated substrates; (c) TA of the pretreated substrates under the experimental conditions did not promote the formation of the desired morphology of the film; (d) spin coating of the substrates seemed to promote the segregation of the phases towards a cylindric-like morphology (
Figure 5A). Henceforth, this section addresses this last premise and explores the possibility of hydrolyzing the PLA of as-spun films, meaning that no annealing was performed for these substrates prior to the hydrolysis.
Following the same spin-coating process used for prior samples, an as-spun film was dipped into an alkaline solution to selectively remove the PLA domains and obtain a PS-porous film matrix.
Figure 5B shows an SEM image of the hydrolyzed as-spun pretreated substrate where a difference in contrast between the formed pores and the PS continuous phase can be distinguished. By comparing the as-spun film (
Figure 5A) and the corresponding hydrolyzed film (
Figure 5B), we can conclude that the PLA was removed according to the difference in the density of the pores between images. The regularity and the condition of the film seem to be unaffected by the hydrolysis procedure, suggesting that the silylation pretreatment on the substrates contributed to the stability of the supported film.
As mentioned before, in this case, the as-spun films were not subjected to any further treatment. Nevertheless, we observe that the morphology on this film suggests a suitable phase segregation. At this point, we hypothesize that THF may have contributed to this effect due to the polar affinity between this solvent and the PLA phase [
24].
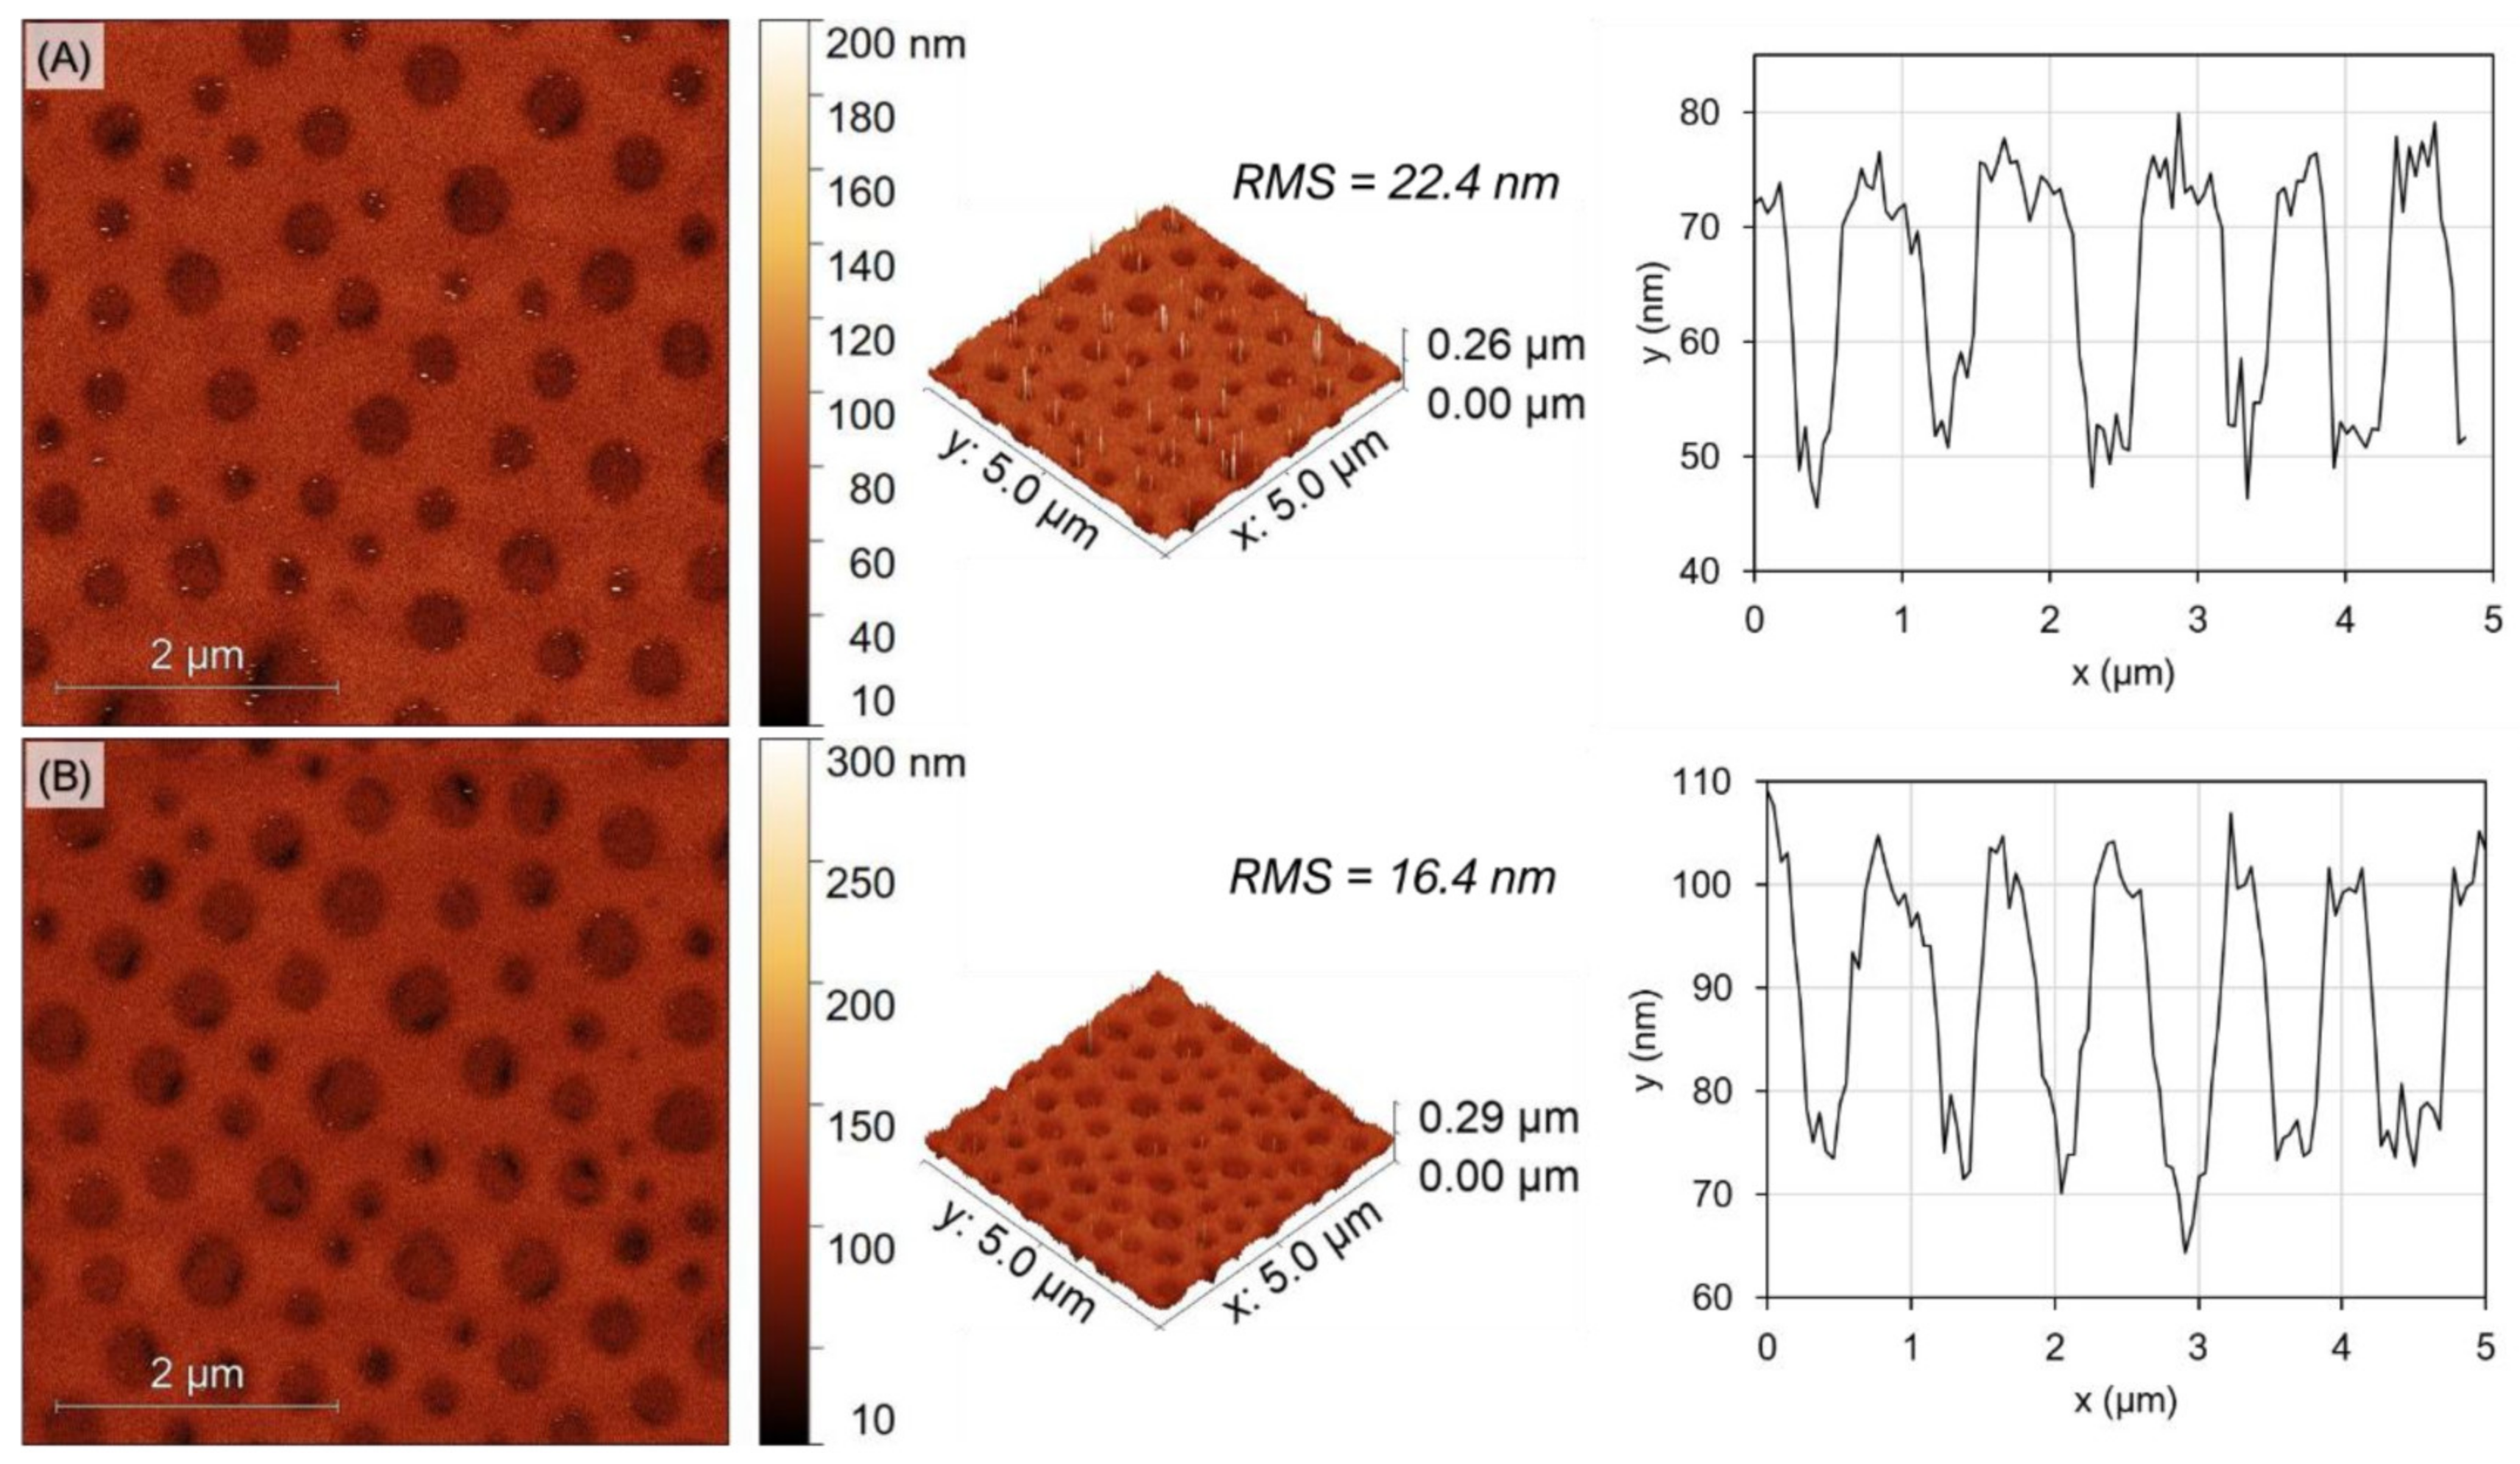
To further confirm the change in the topography of the film, AFM measurements of both films were performed.
Figure 6A displays an AFM image of the as-spun film, a 3D image, and a topographic profile of the film; the corresponding is also observed for the hydrolyzed film in
Figure 6B. A change in the root mean square values (RMS) from 22.4 to 16.7 nm is indicative that the roughness of the film was smoother after the hydrolysis process. The 3D images of the films revealed a difference in the density of the pores. This was validated by 3D projection of the extracted morphology profile. Hence, after hydrolysis, the valleys of the pores become more defined (
Figure 6B), whereas prior to hydrolysis, the valleys appear to be broader, suggesting that PLA domains are present at the interphase.
All in all, the hydrolysis of the as-spun films based on the synthesized PS-b-PLA copolymers may represent an attractive alternative to obtain porous films considering the rather simple preparation steps.
3.5. Binding Tests of Metal Salts Using Hydrolyzed Films
After PLA hydrolysis of the as-spun substrates, we decided to analyze the metal caption capacity of the obtained films. At this stage, we speculate that the generated porous thin films bear in their structure triazole groups available at the surface of the pores. These functional groups are capable of binding to metal cations through a coordination bond [
37]. Hence, we proceeded to test the affinity of metallic moieties towards the porous PS film that could be interacting with the embedded triazole groups. The experiments were conducted by dipping the hydrolyzed film in a CuCl
2 solution. We explored the metal caption with Cu
2+ due to its affinity to imidazole and triazole derivatives [
38].
After thoroughly rinsing and drying the used substrates were analyzed via SEM–energy dispersive X-ray spectroscopy (SEM-EDX), to survey the presence of Cu2+ moieties that may have remained attached to the porous matrix.
For this experiment, we used block copolymer
1A (
Table 1) subjected to the described spin coating and subsequent PLA hydrolysis procedures (
Figure 5B). The utilized substrate for this experiment was pretreated with the silylation process to avoid delamination of the film as discussed above.
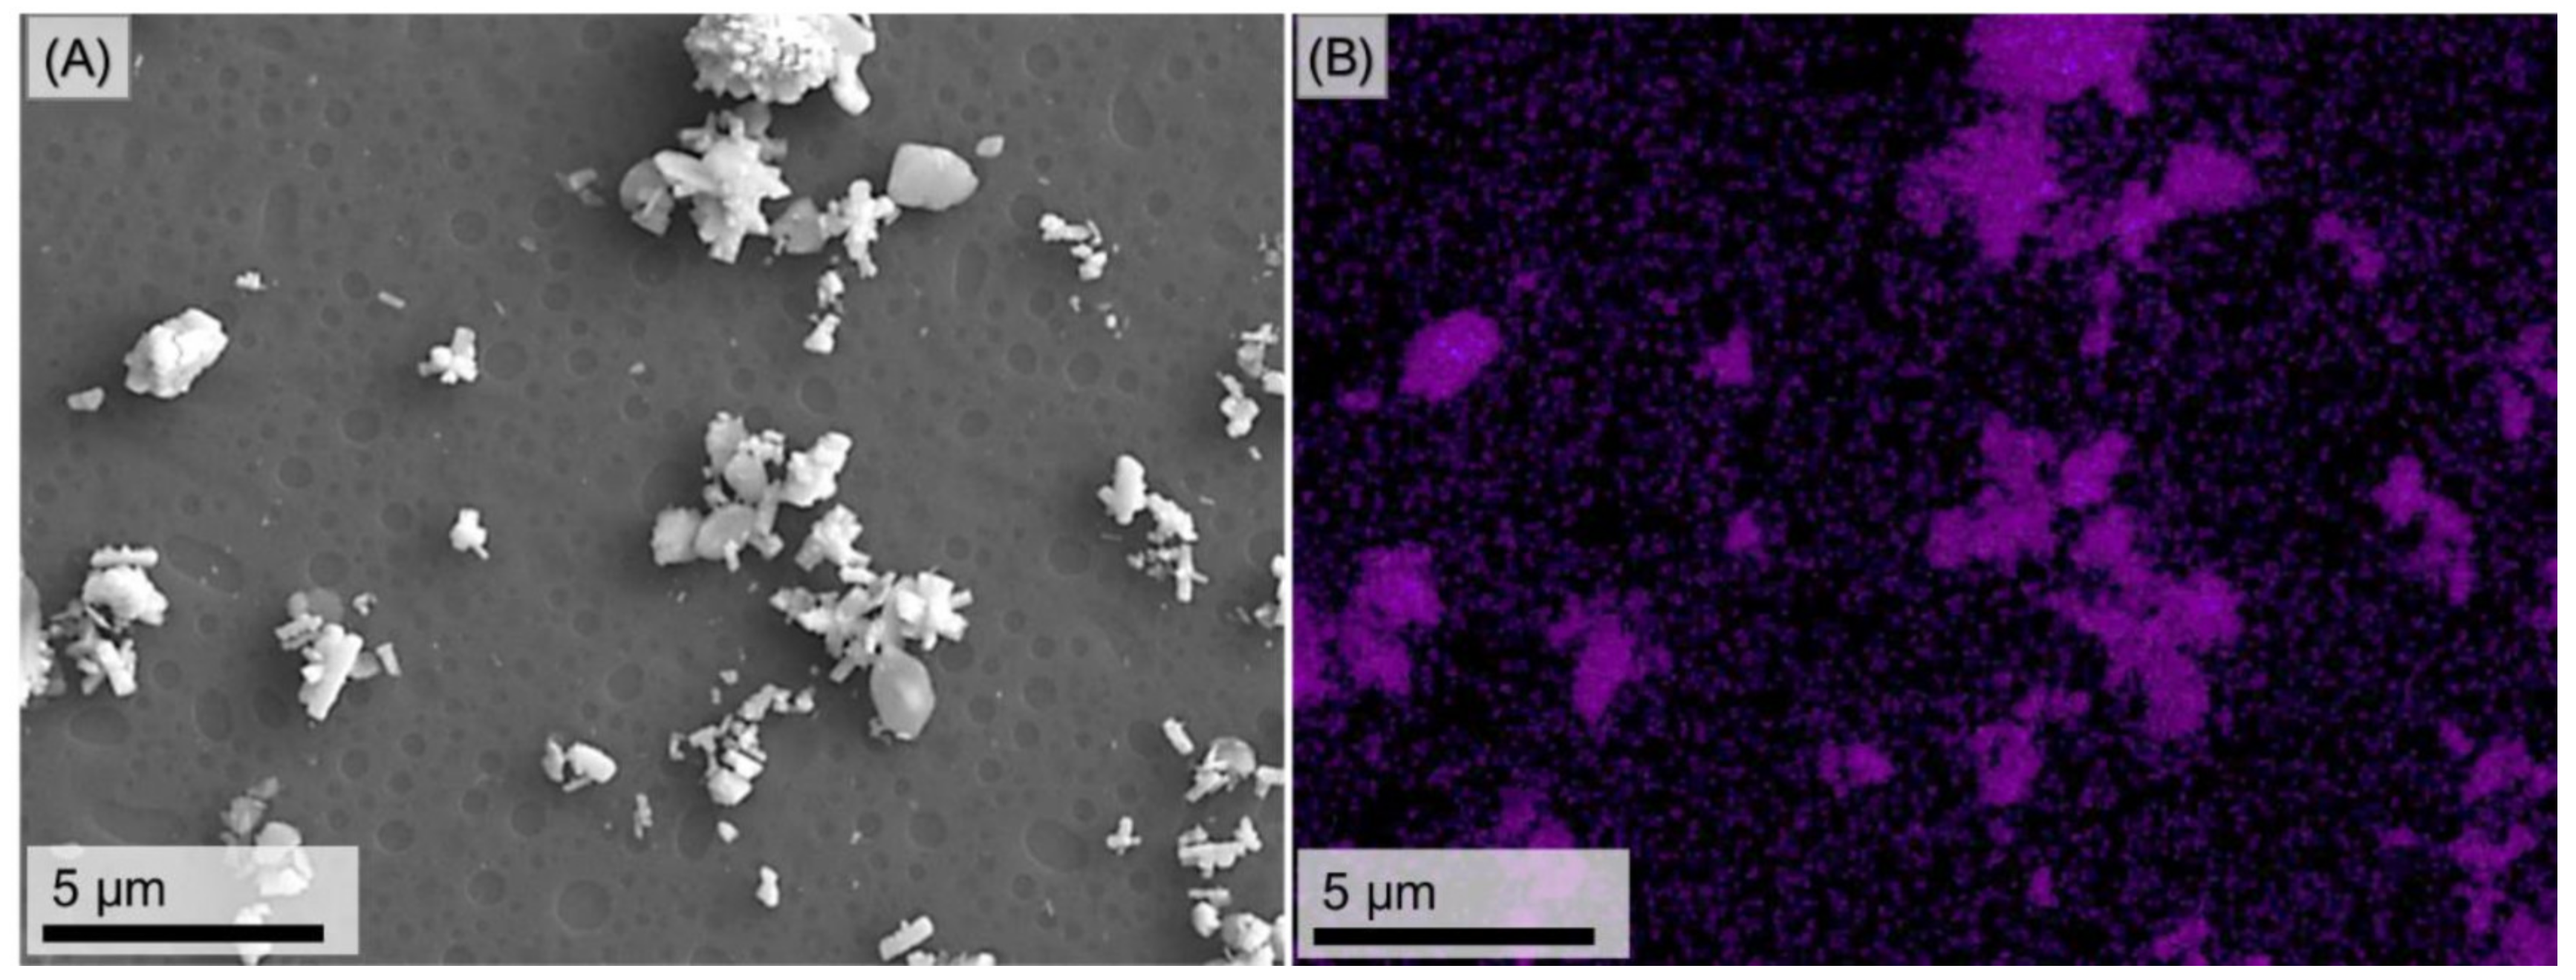
Figure 7A shows an SEM image of the film after being in contact with a CuCl
2 solution. It is evident that, after a through rinsing, some large pieces of the metallic salt remain attached onto the surface of the film.
Figure 7B displays the Cu mapping of the same substrate, Cu moieties on the film are clearly observed. However, a minimum portion of Cu salt is distributed on the film as it can be observed from the purple dotting pattern (
Figure 7B). At this point, it is unclear whether these micro-moieties are coordinated to the triazole groups on the PS-film or whether the Cu salt is physically attached onto the surface.
Nevertheless, we could hypothesize that the PS-film possesses certain affinity towards the Cu salts as can be observed from the EDX images. A minimum quantity of the Cu salt is attached onto the film, possibly by the interaction between the triazole groups and the metallic center [
10]. Future investigations will consider analyzing the effect of using an aromatic triazole junction instead of an aliphatic one (copolymer
1A). This feature might improve the affinity of the porous film towards metallic centers.
3.6. PS-b-PLA Semi-Bulk and Bulk Samples as Templates for Porous Membranes
Self-assembly and phase segregation of block copolymers in thin films are governed by different variables to those applied to the preparation of bulk or semi-bulk samples. Complementary to the previous analysis, we carried out several experiments to prepare monoliths by using the synthesized PSn-b-PLAm copolymers as starting materials. Following Method 1 described in the materials and methods section, a concentrated solution (C = 10.0% w/w) of copolymer 2A in toluene was employed to execute these experiments. After complete dissolution of the copolymer, a highly viscous solution was obtained; afterwards, the solution was poured into an as-made Teflon mold (~60 mm2) at 50 °C. A slight increase in the temperature of the solution allowed the material to become more fluid when casting it into the mold. Once the solvent evaporated, the sample was annealed at 110 °C for 1 h and a thin copolymer film was recovered from the Teflon mold.
According to an SEM image of the material (
Figure 8A), the exhibited morphology on the surface evidences the formation of some pores. The distribution of these pores is less homogenous than that observed on the wafer-supported thin films. This may suggest that it is possible to modulate experimental conditions to obtain more homogeneous patterns on the samples prepared in semi-bulk aiming to replicate the behavior observed on supported thin films. However, the thickness (0.11 mm) and brittleness of the isolated film made it difficult to handle and to characterize by SEM. The stability and mechanical properties are also important to avoid disintegration of the film during the subsequent hydrolysis step. Therefore, we re-attempted the experiment to increase the thickness of the final monolith. This was achieved by pouring the copolymer solution into a Teflon mold of smaller dimensions (~20 mm
2). In addition, a higher temperature (160 °C) was employed in this experiment to further promote phase segregation. As a result, a thicker and more stable film was recovered from the mold (1.20 mm).
Figure 8B shows a micrograph of the monolith surface with a more defined pore formation as compared to that in
Figure 8A. Although the distribution of these pores may not be very homogeneous, this result suggests that a self-assembly process may occur as a result from the thermal annealing at semi-bulk conditions.
To continue with the established experimental scheme, a hydrolysis of the annealed sample (
Figure 8A) was carried out as described in the
Supplementary Materials to form a PS-based porous matrix. Hydrolysis selectively removed PLA from the as-made monoliths by immersing the material in an excess of an alkaline solution to form a heterogeneous mixture. This reaction was monitored via
1H NMR, specifically, by observing the change in the integral value of the signal of –CH proton corresponding to the repetitive unit of PLA (‘E’ signal in
Figure S5) in relation to the PS aromatic signal. Following the analysis of the
1H NMR spectra at different times, we determined that after 56 h, 97% of PLA had been removed from the thin film derived from copolymer
2A (see
Figure S6 for details). A similar experiment was performed for the thicker sample shown in
Figure 8B. In this case, a longer hydrolysis time was considered, after 77 h, only 74% of PLA was removed. Hence, a lower amount of PLA was removed when the bulk sample was thicker. This effect may be attributed to diffusional effects related to the fact that a larger amount of mass was confined into a smaller volume during the preparation of the thicker sample. Thus, PLA domains are more densely packed within the monolith. Nevertheless, it was possible to selectively remove and quantify the PLA phase from the bulk sample to form a PS porous matrix.
Furthermore, we decided to employ a second method that could enhance phase segregation in the bulk material and reveal the equilibrium morphology of the sample. Hence, by following Method 2 copolymer
2B (
Table 1) was placed inside a PEEK mold to trigger self-assembly of the phases in bulk. After annealing at 160 °C for 2 h, a monolith was recovered from the mold and characterized by SEM. The morphology of this sample did not exhibit the formation of pores as compared to previous examples. In this case, we observed that only a few circle-like structures were unevenly distributed on the surface and, as compared to previous examples, the size, shape, and distribution of these items were not similar to the expected morphology (see
Figure S7 for more details).
Although Method 1 exhibited better results for accessing the desired morphology, it is not conclusive that these conditions are suitable to ensure the self-assembly of the copolymer. It is important to further investigate the variables that rule dynamics of block copolymers in bulk to promote the formation of ordered structures at the mesoscale. In this manner, an improvement may be achieved by specifically evaluating the effects of such variables to obtain a functional porous matrix.


