
Design of Kinematic Connectors for Microstructured Materials Produced by Additive Manufacturing

 , ,
, ,  ,
,  , and
, and
Abstract
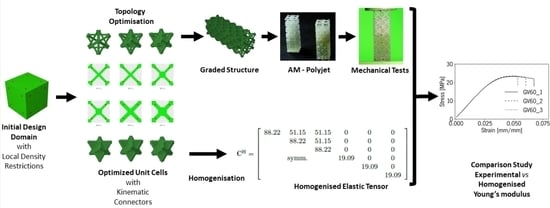
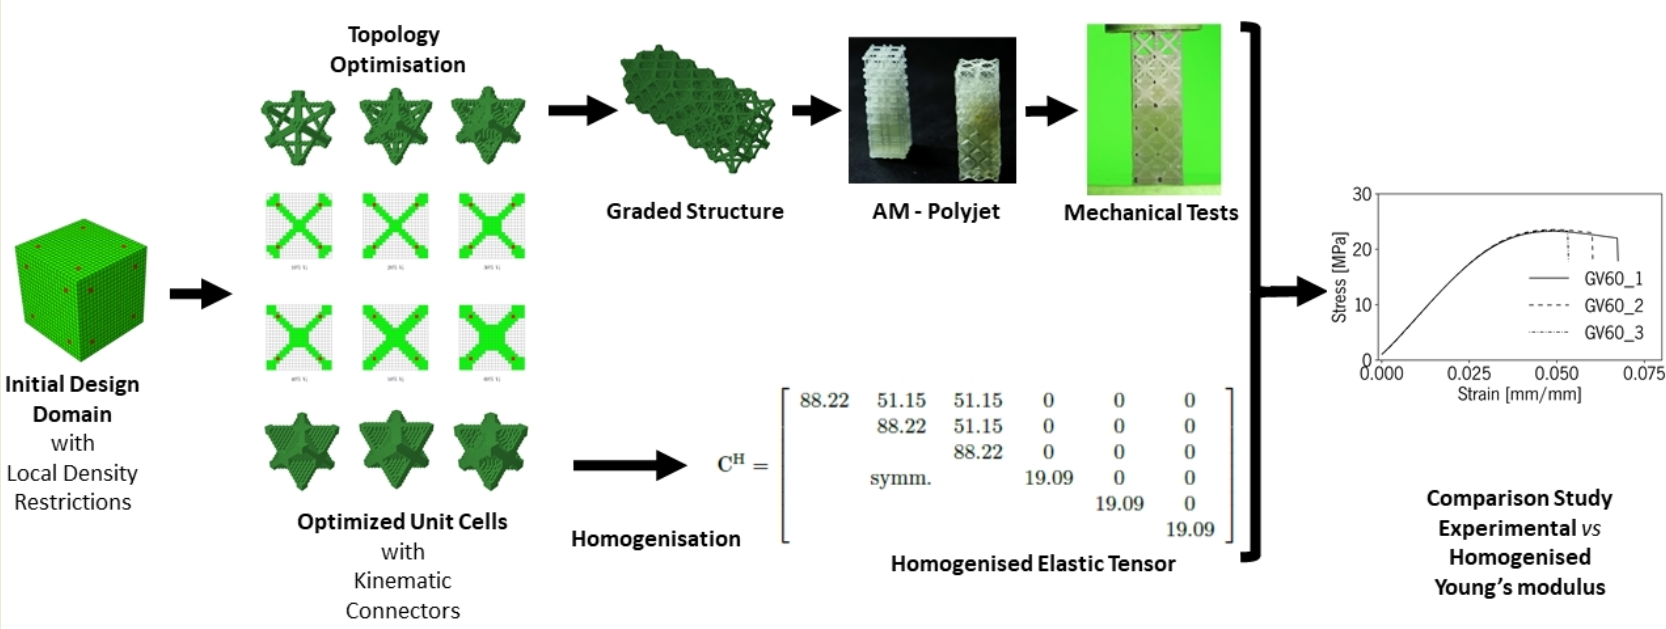
1. Introduction
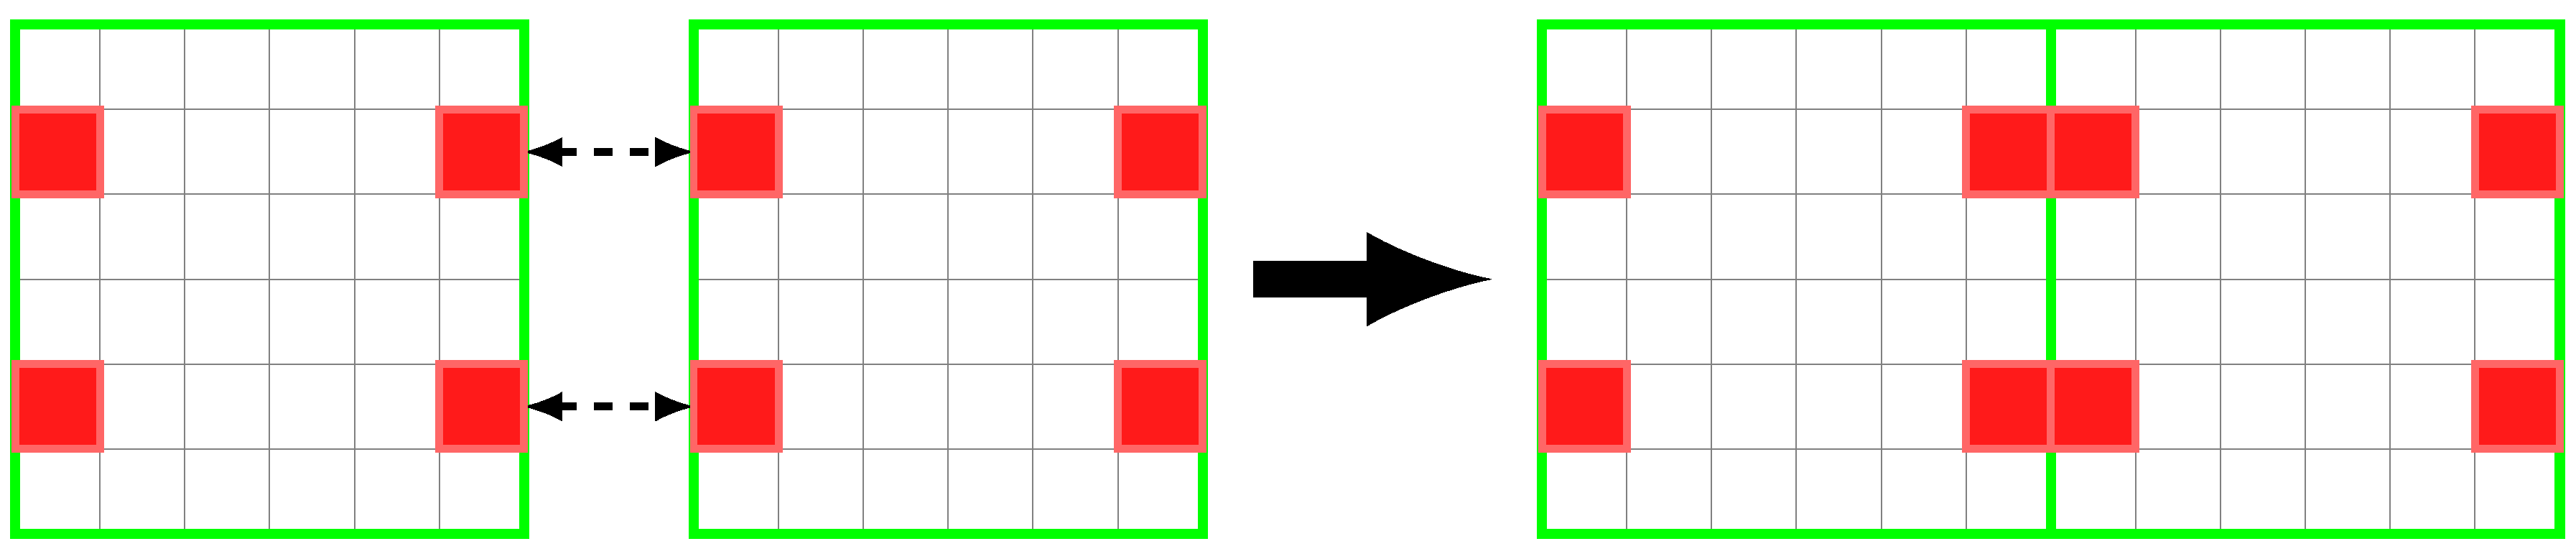
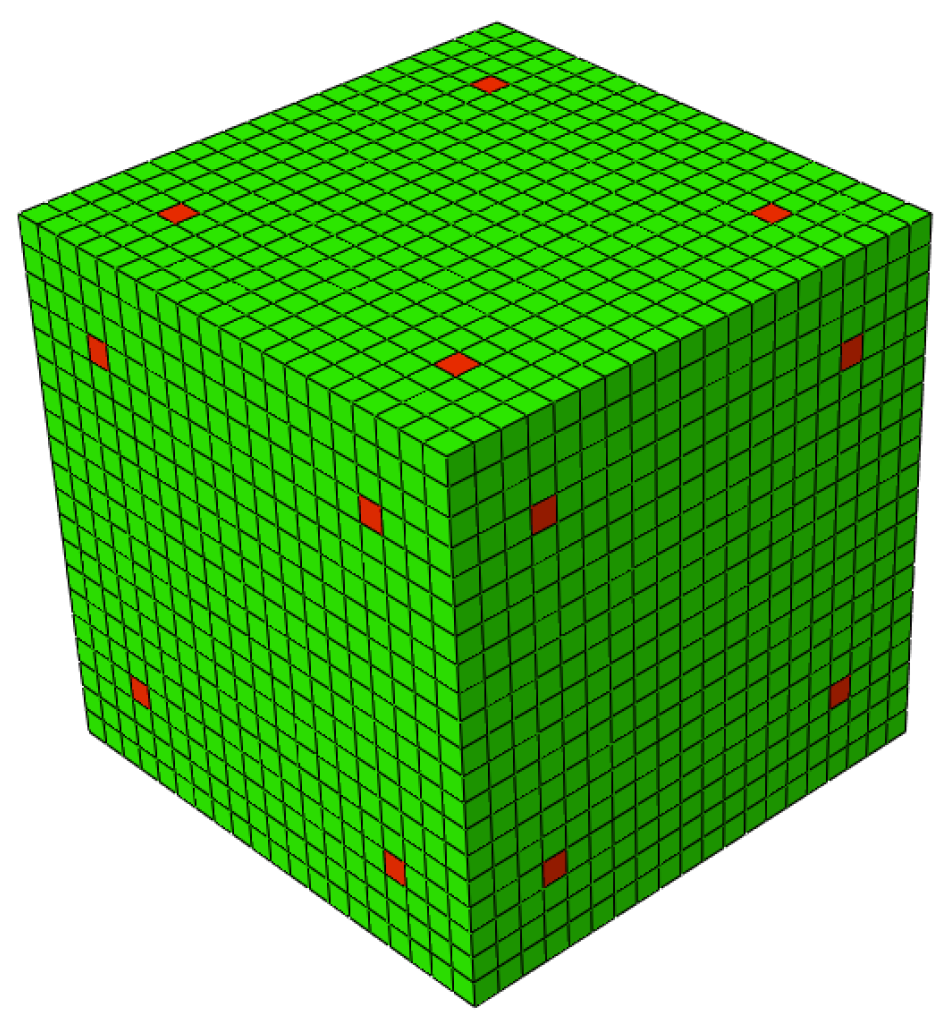
2. Materials and Methods
2.1. Direct Computational Homogenization
2.2. AM and Mechanical Characterization
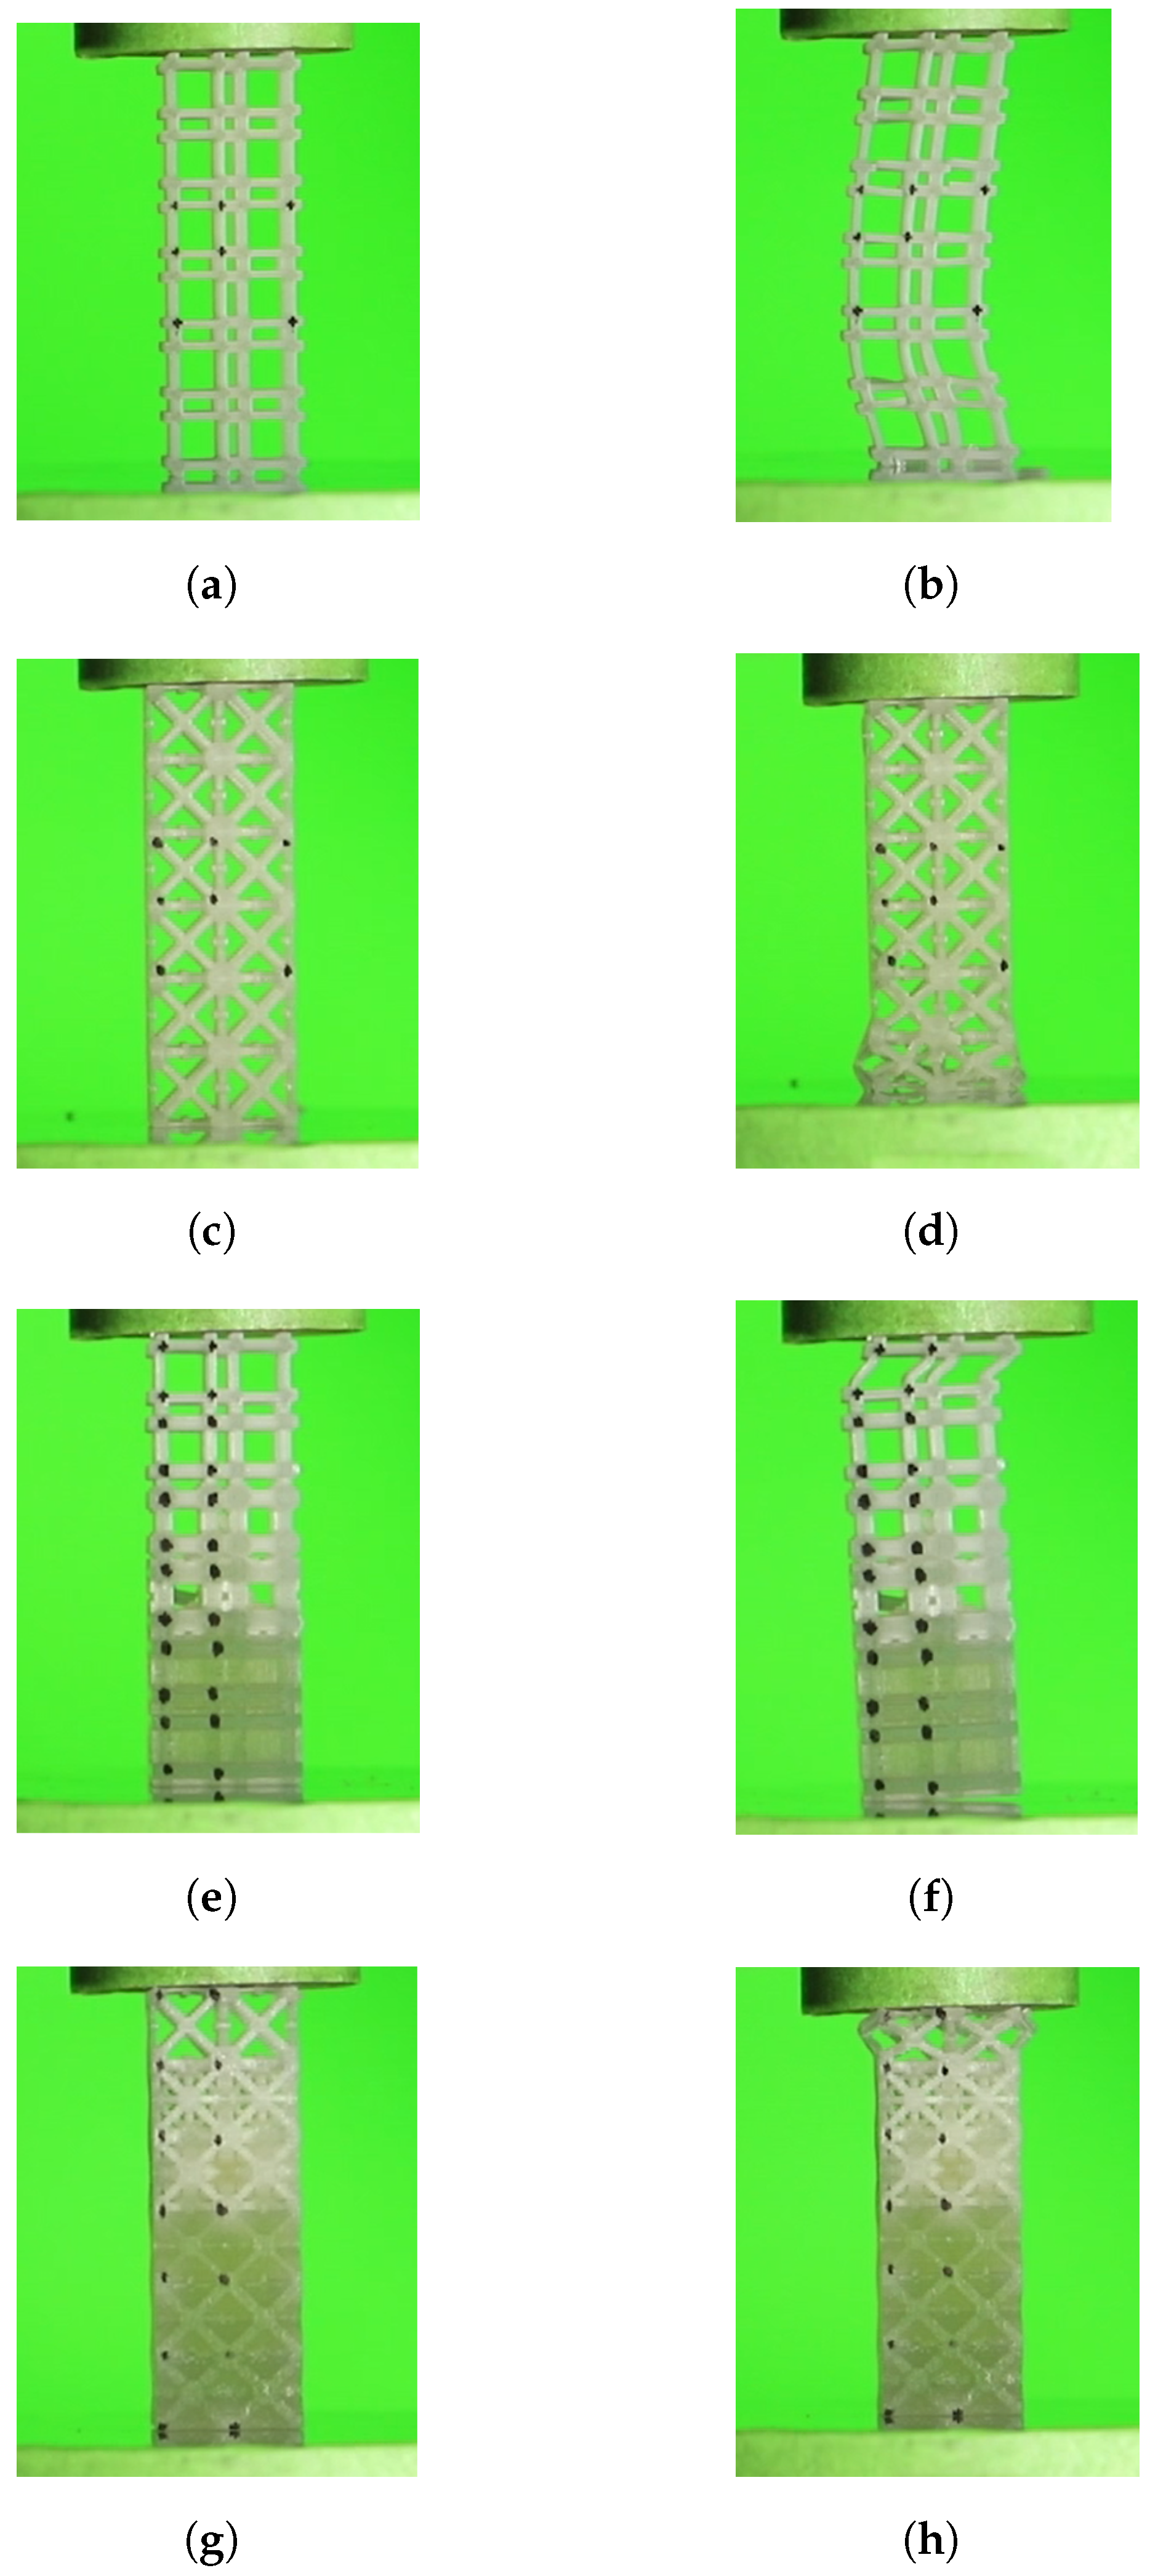
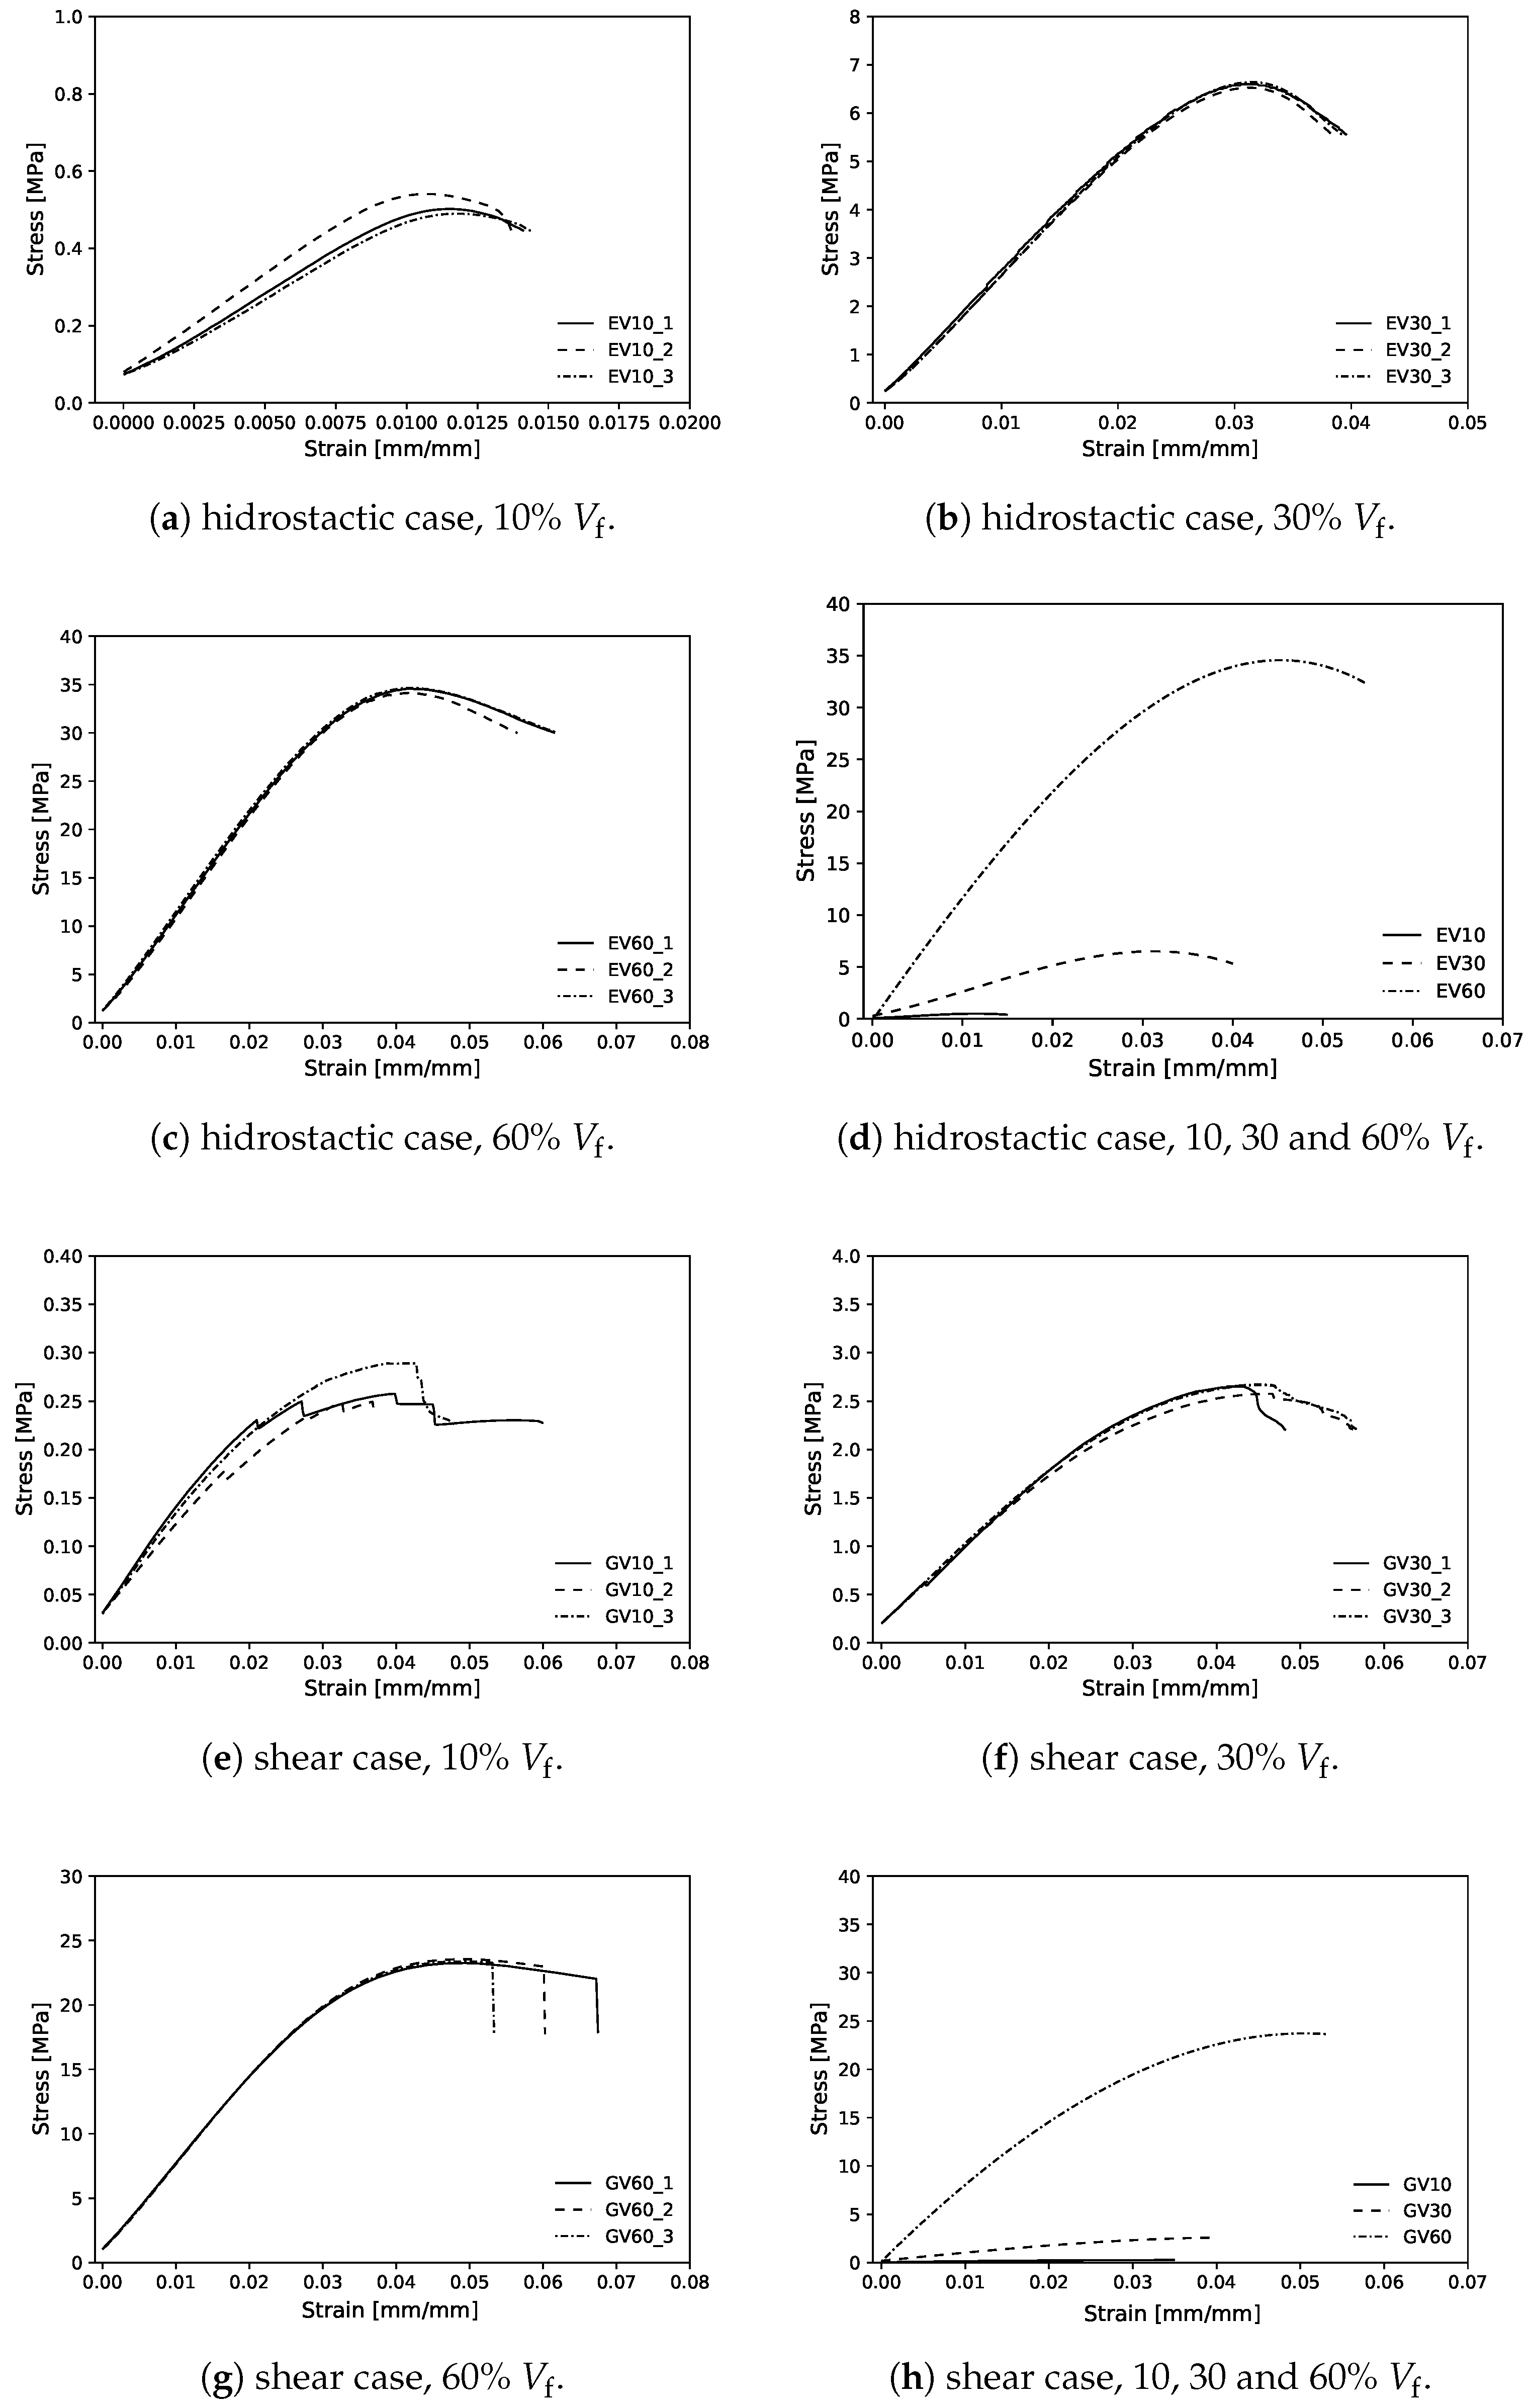
Mechanical Tests
3. Results and Discussion
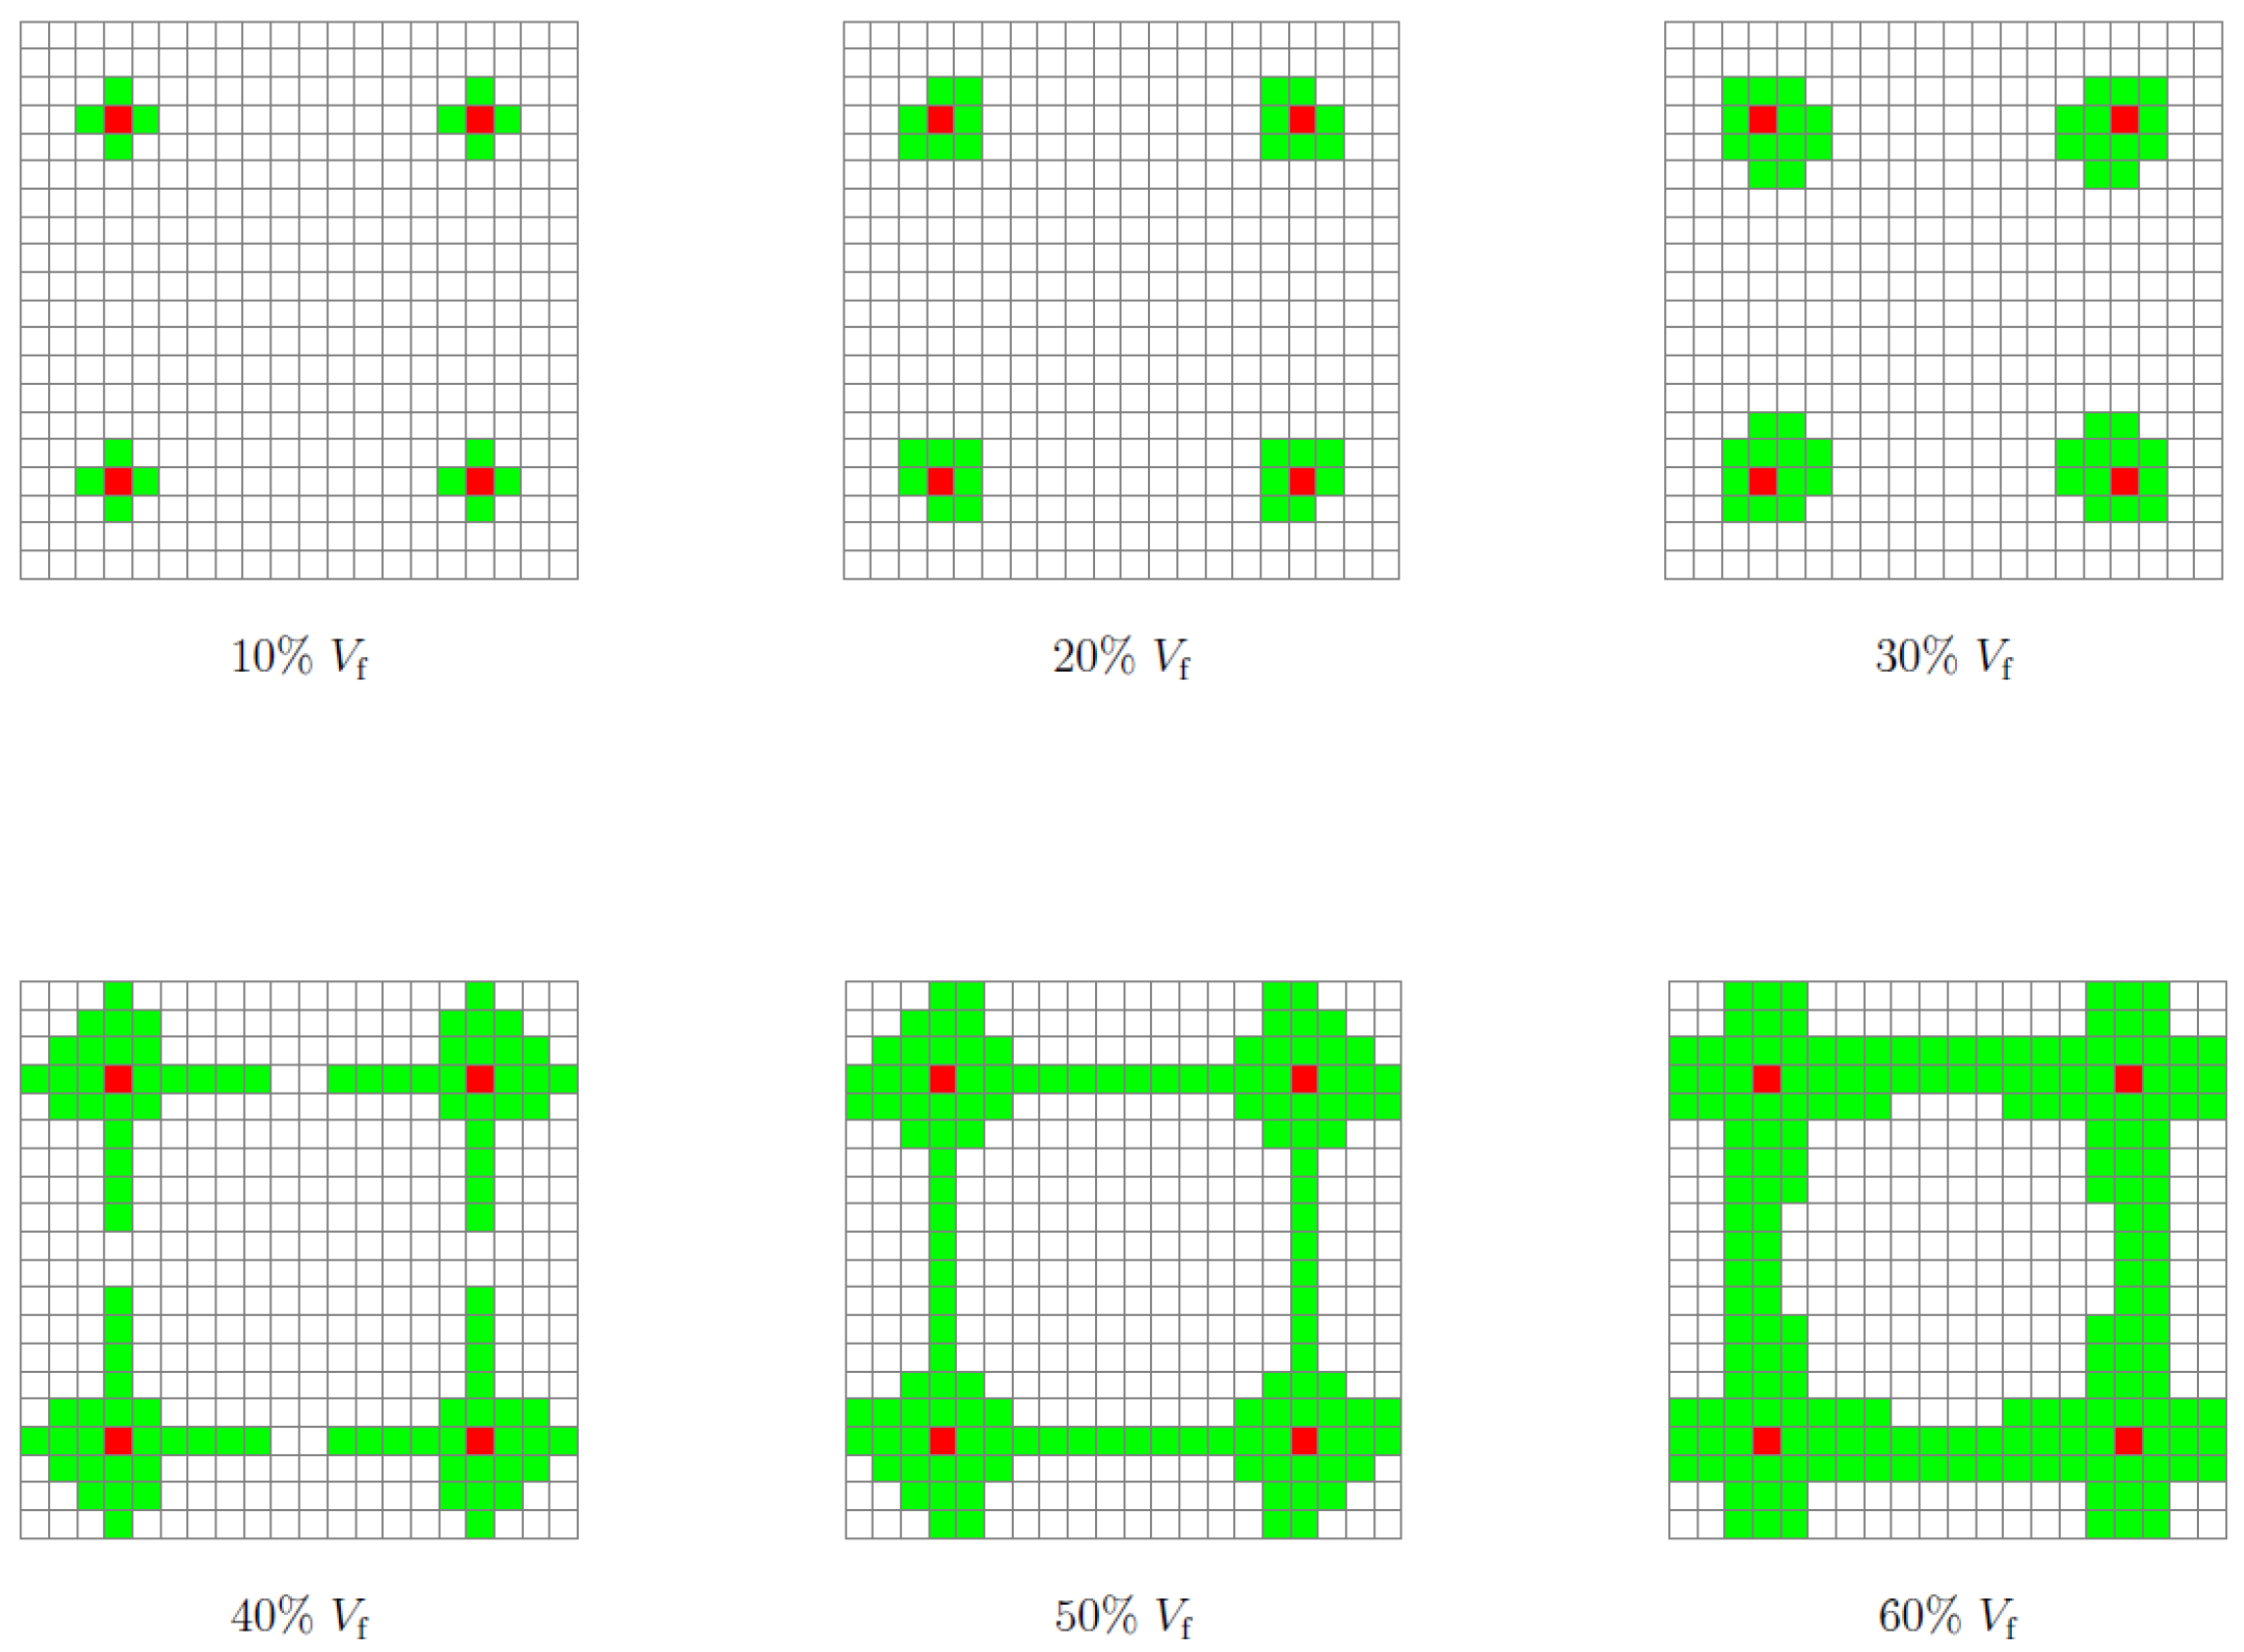
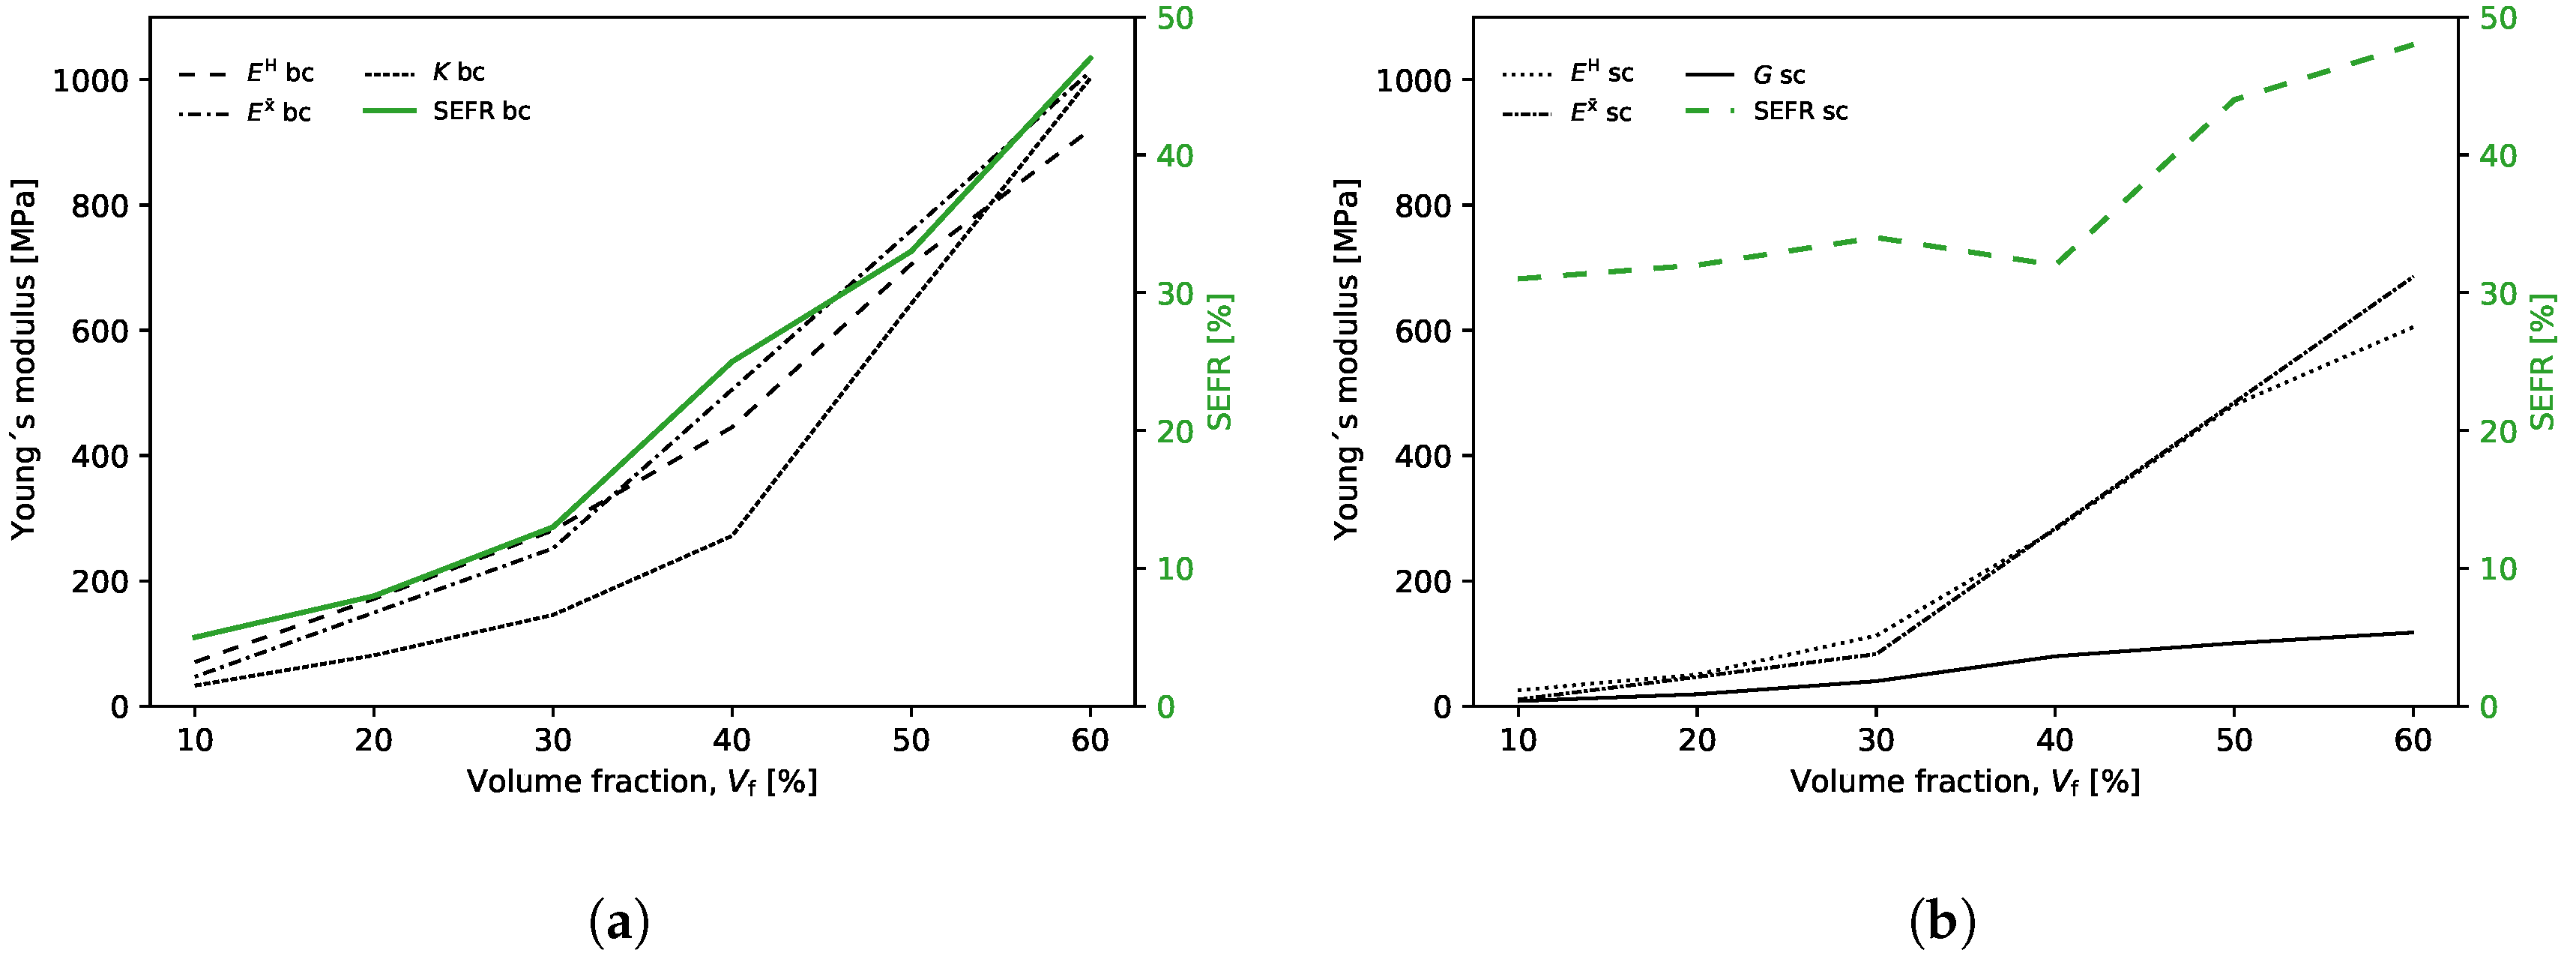
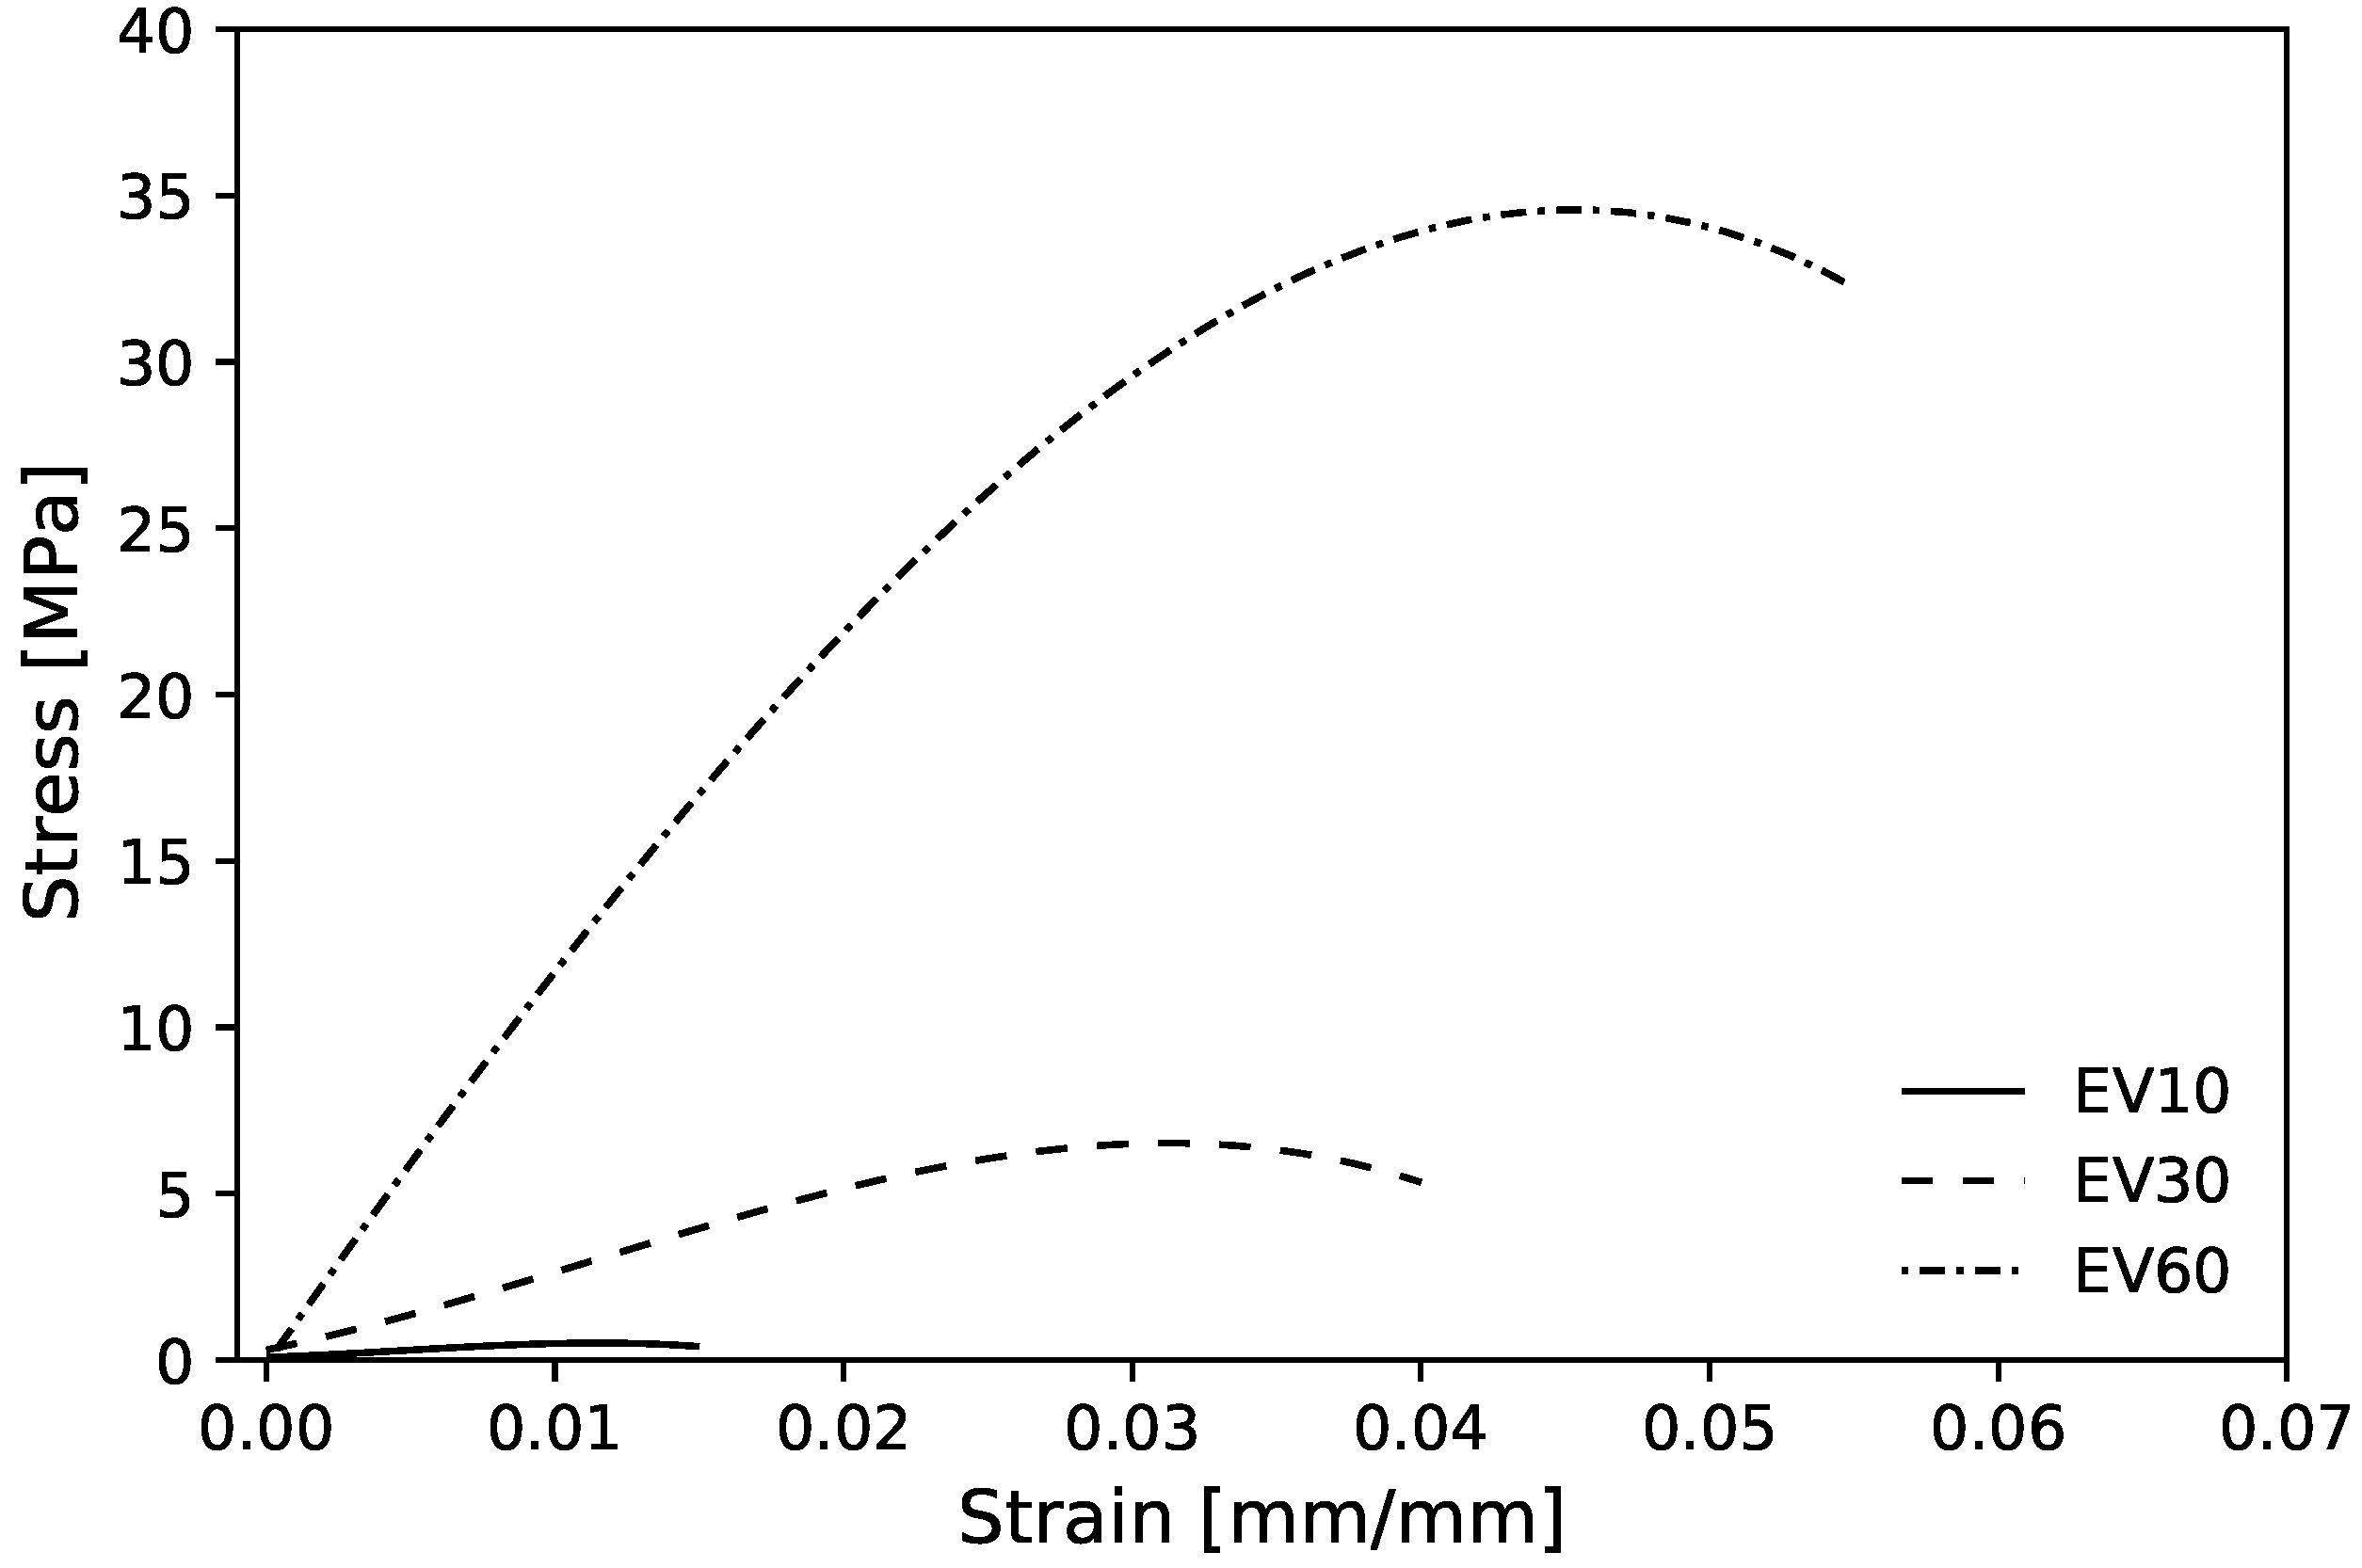
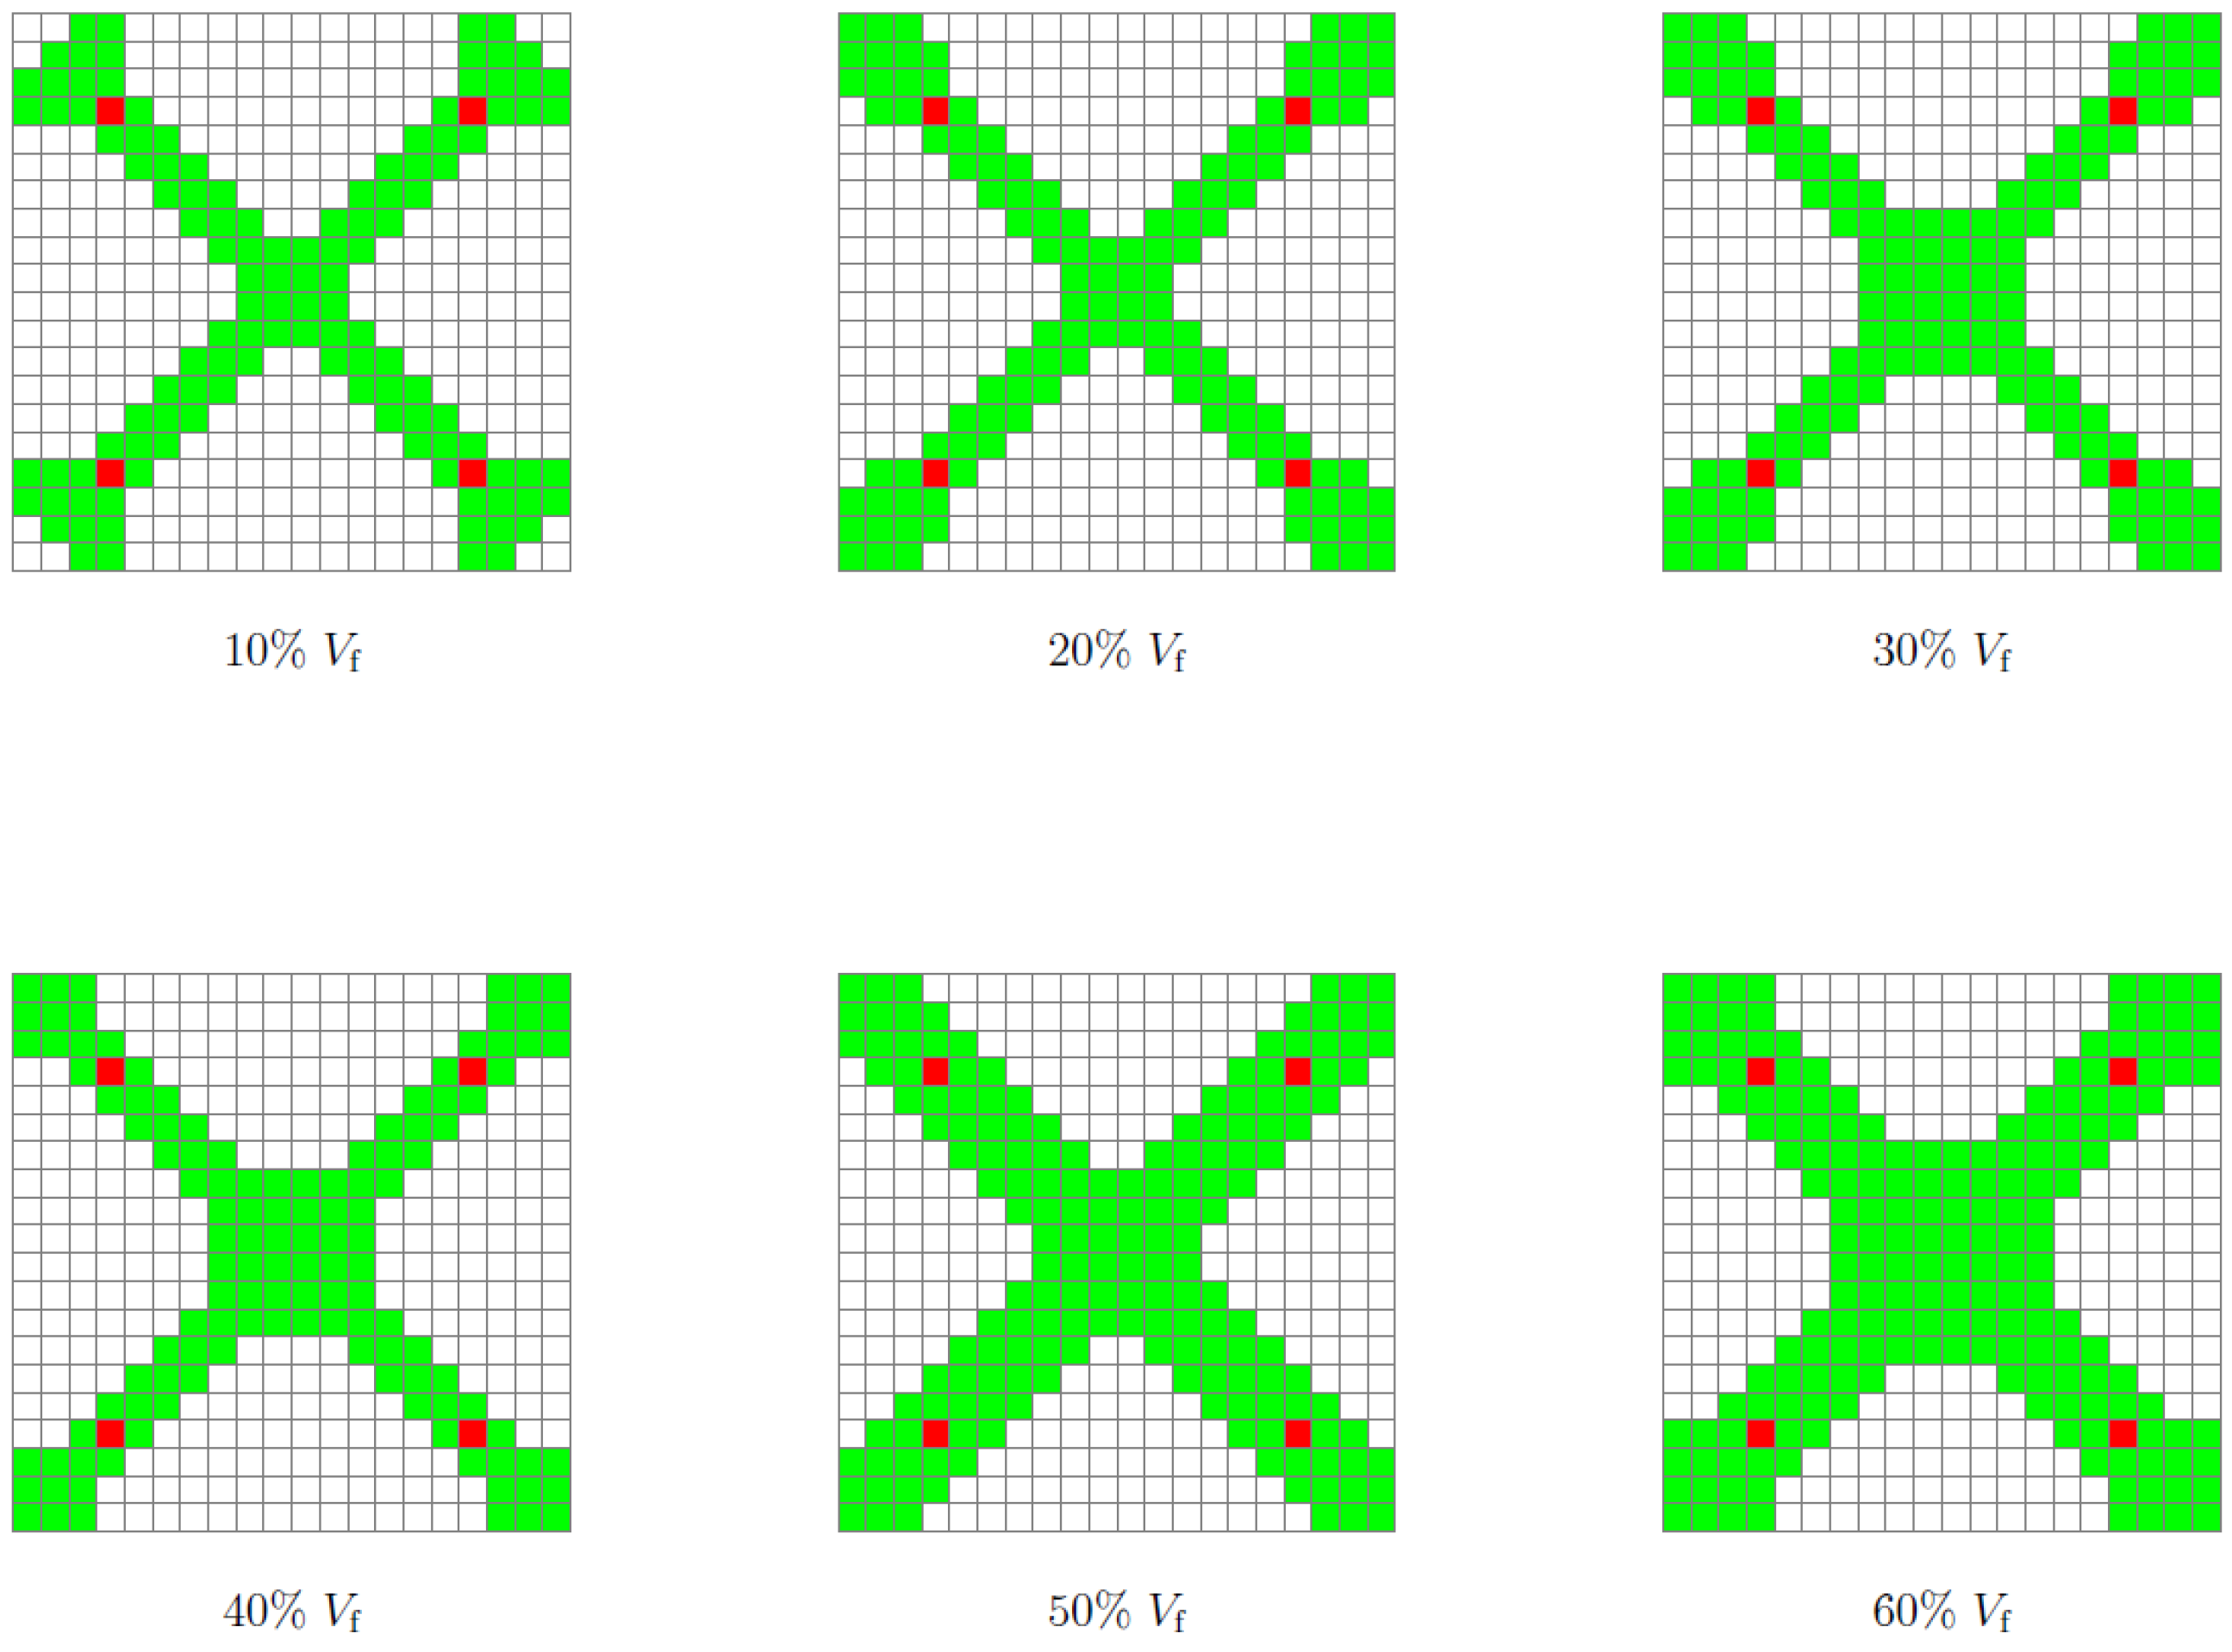
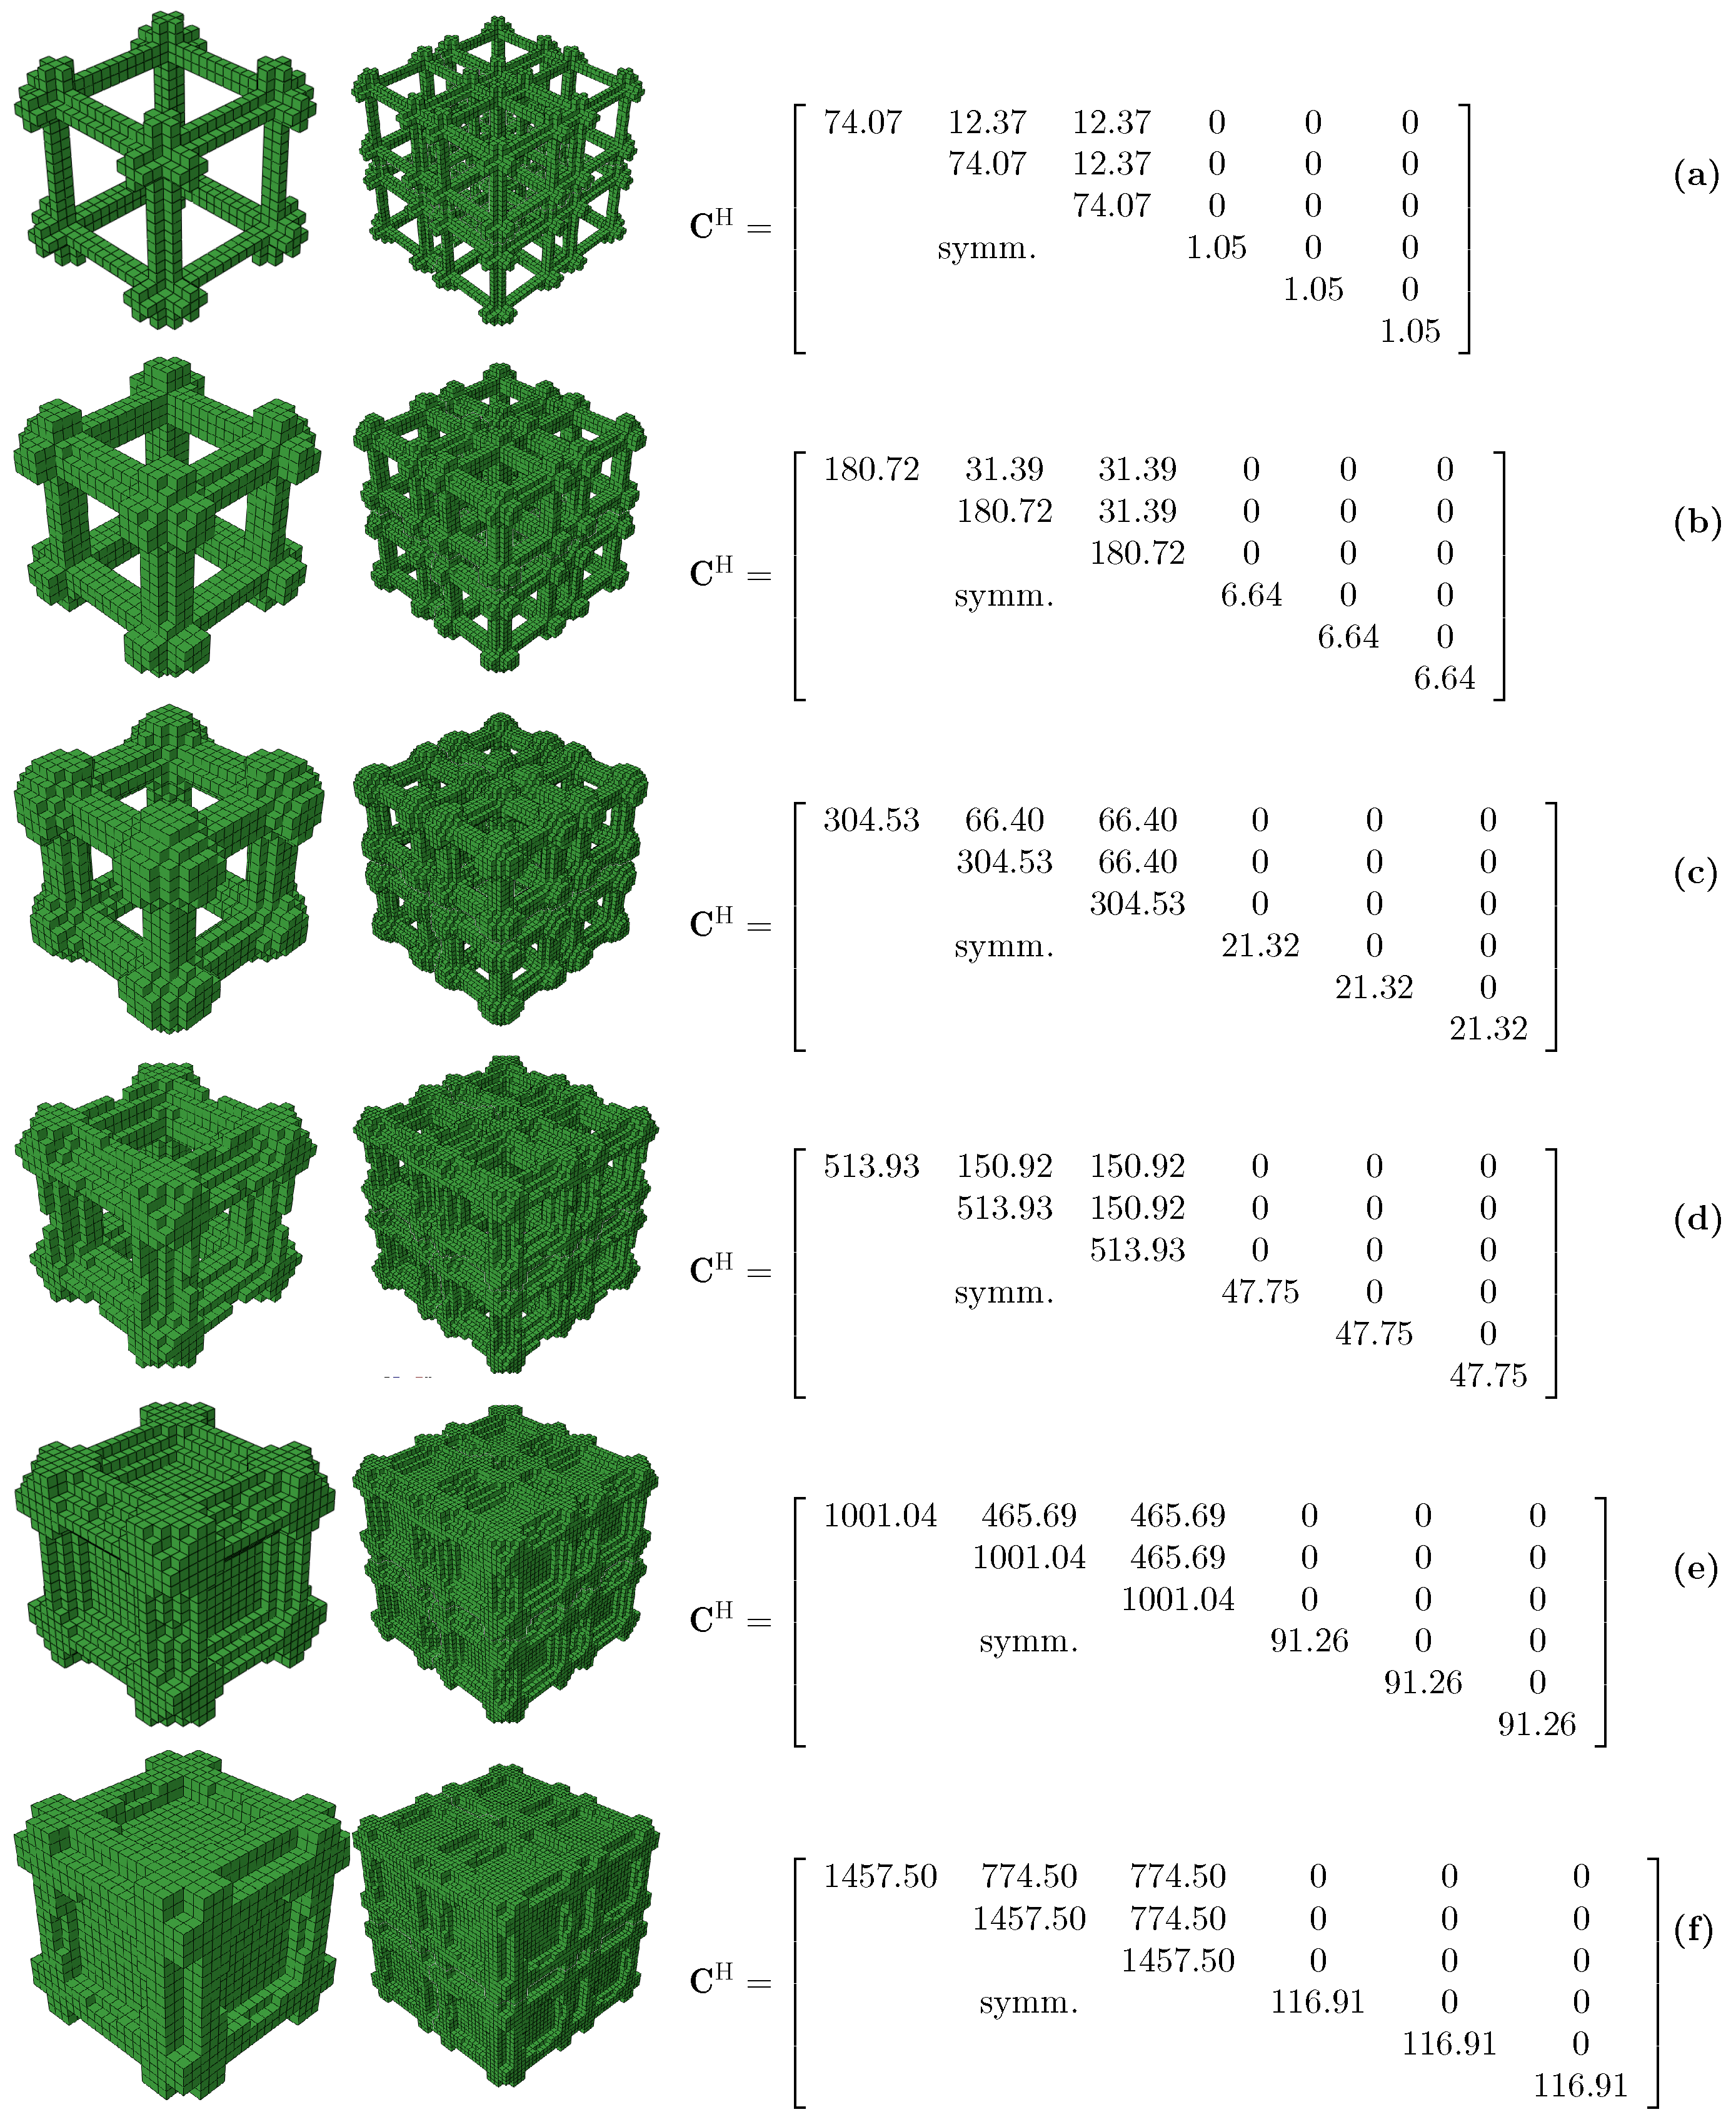
3.1. Single Maximum Bulk RUCs
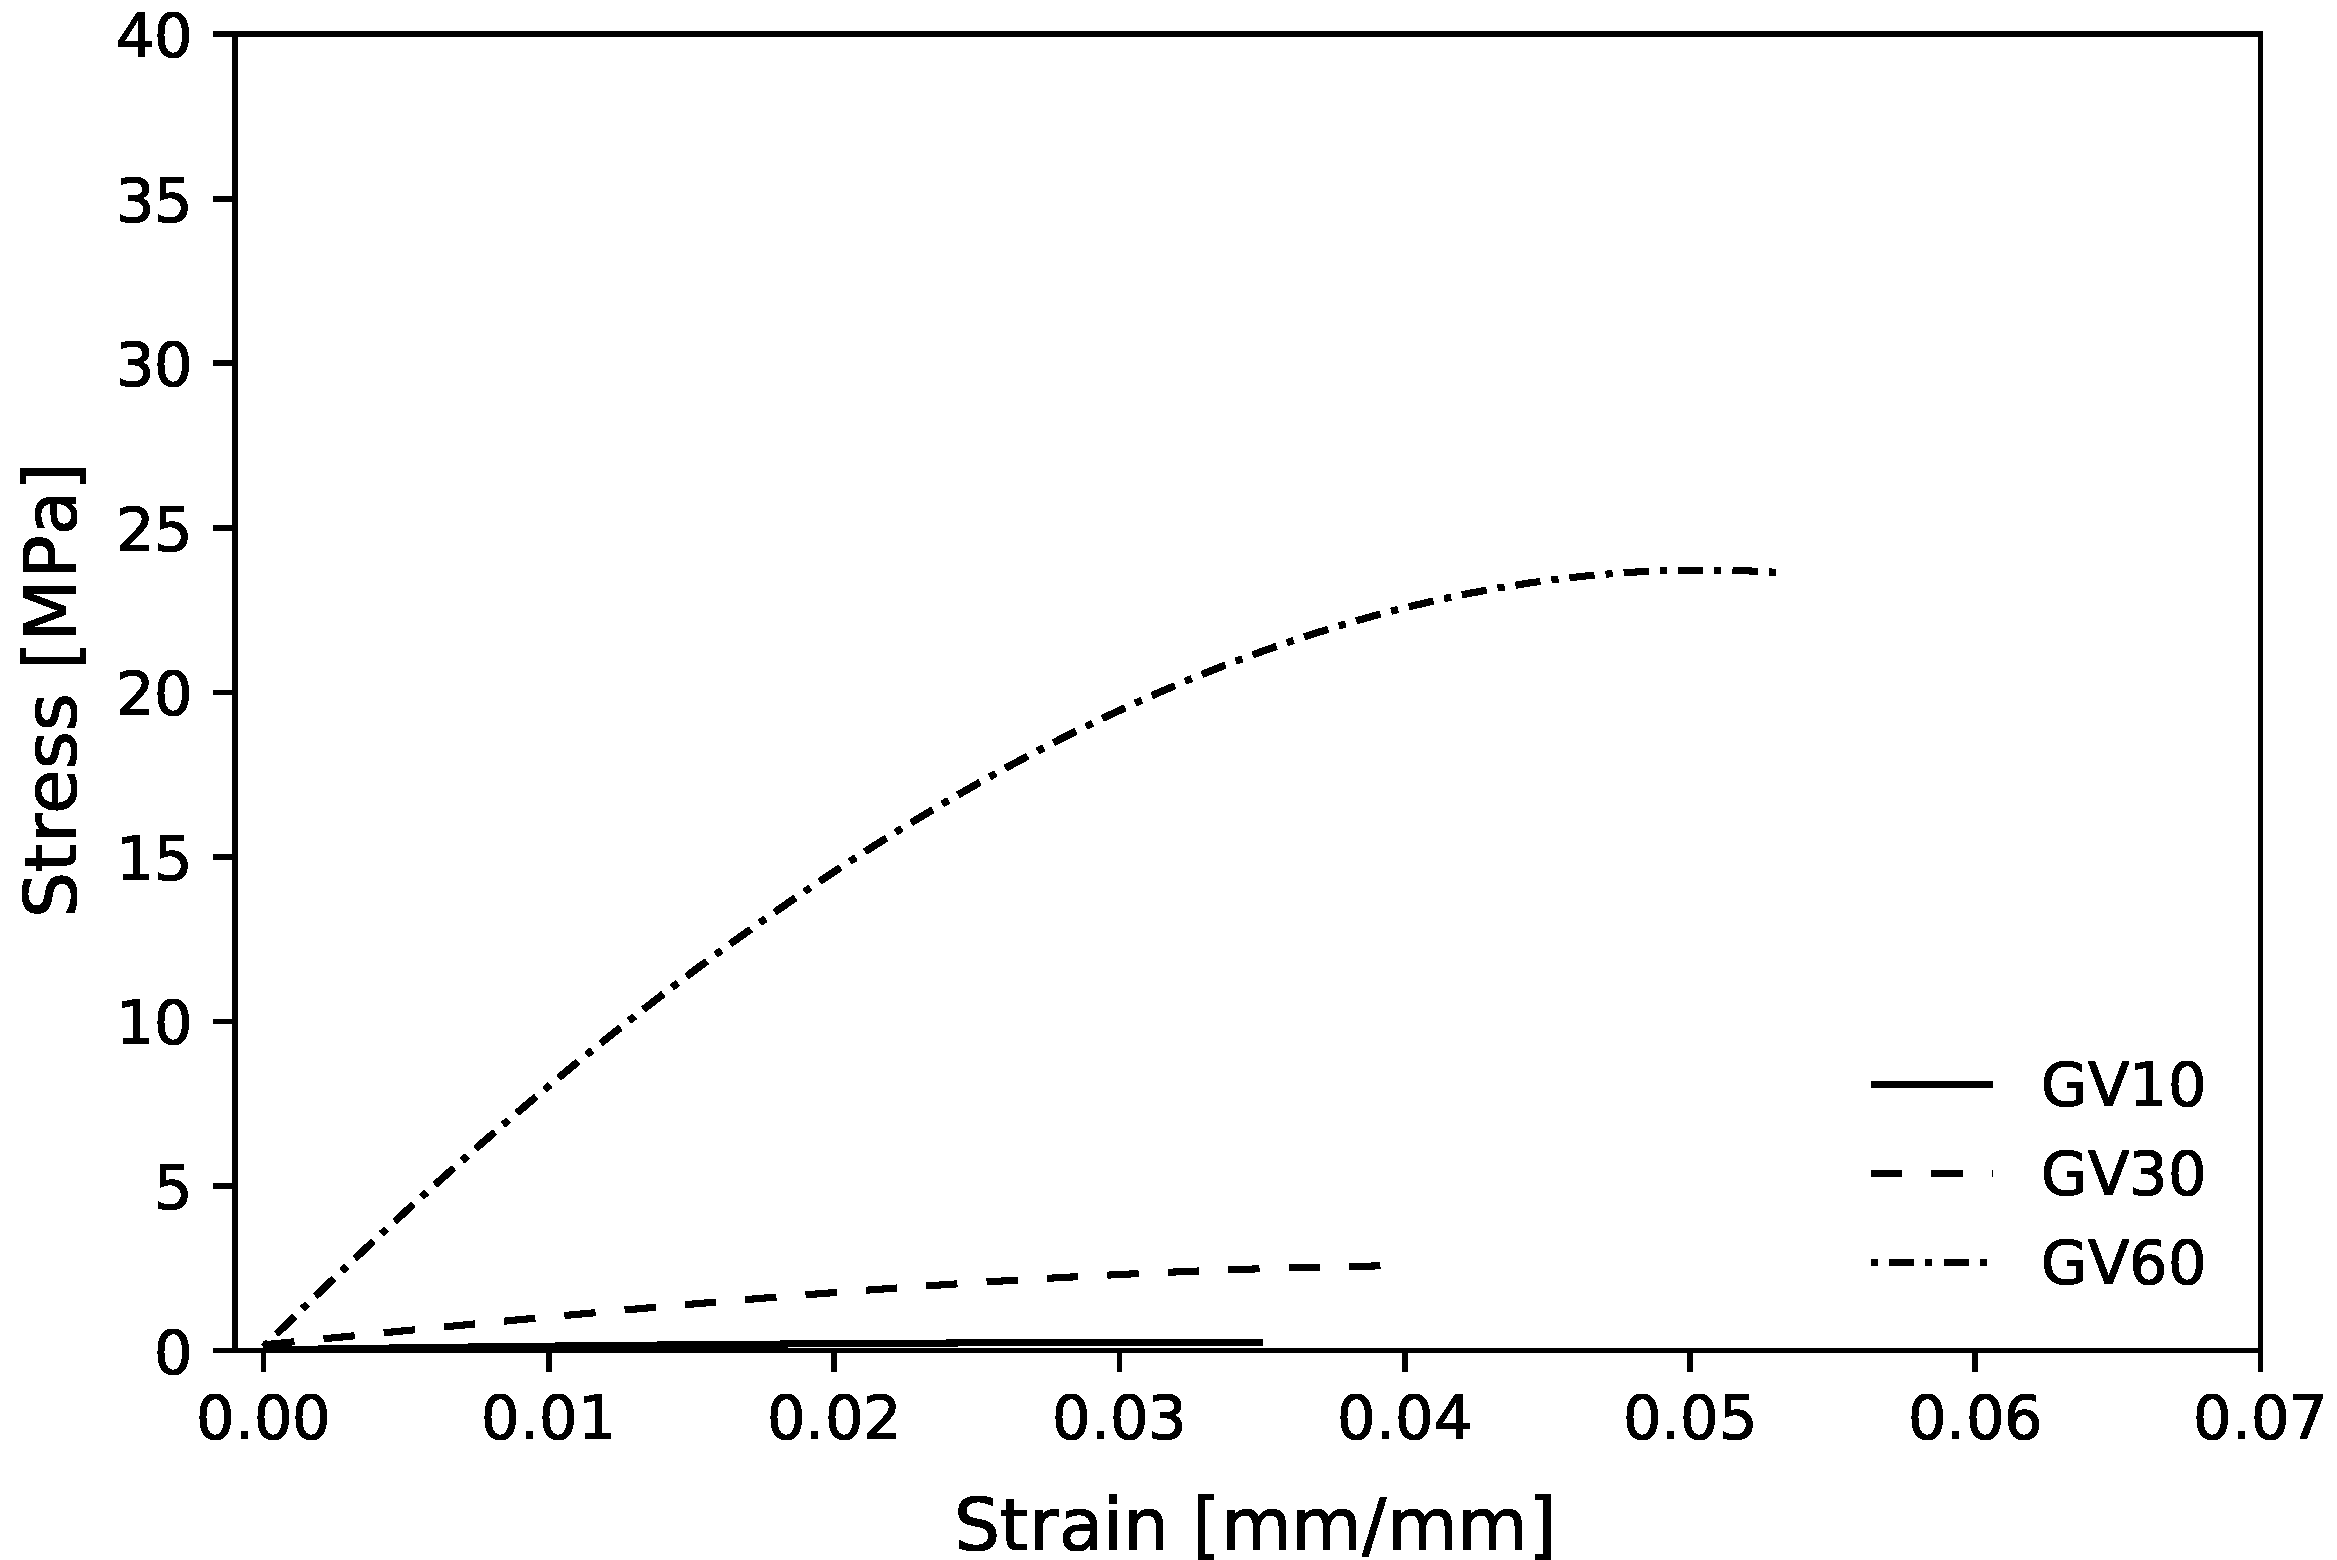
3.2. Single Maximum Shear RUCs
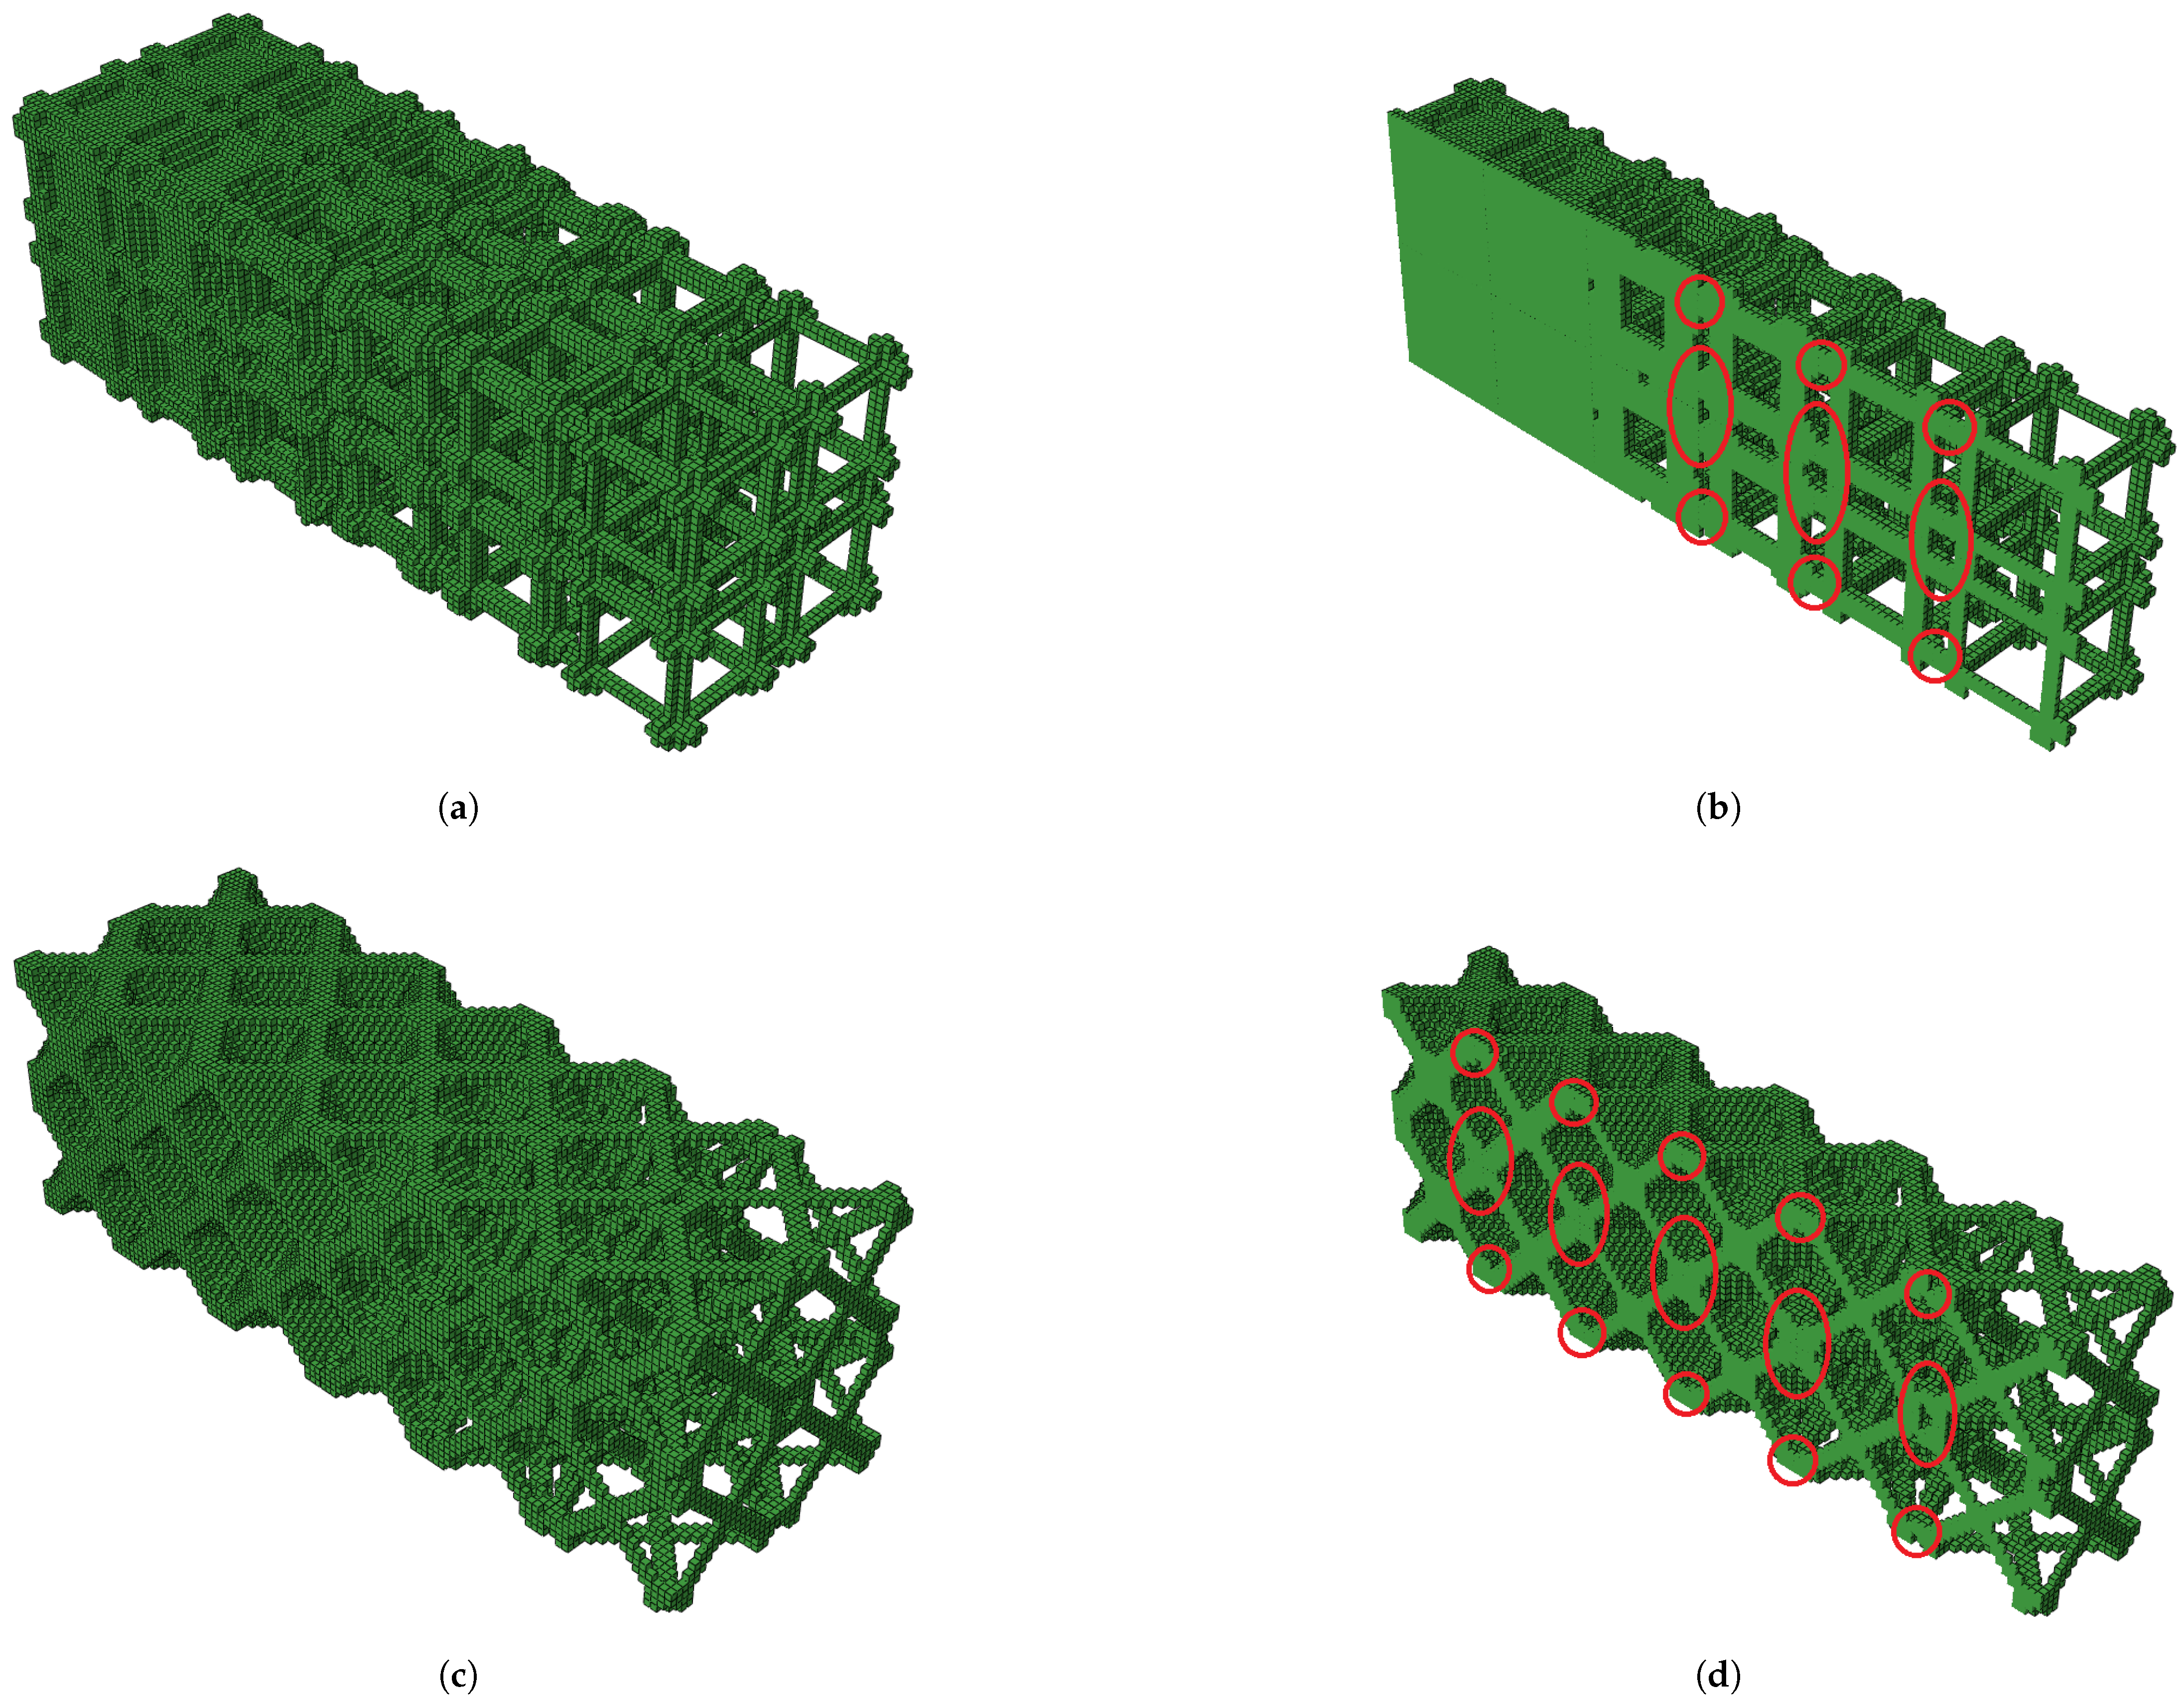
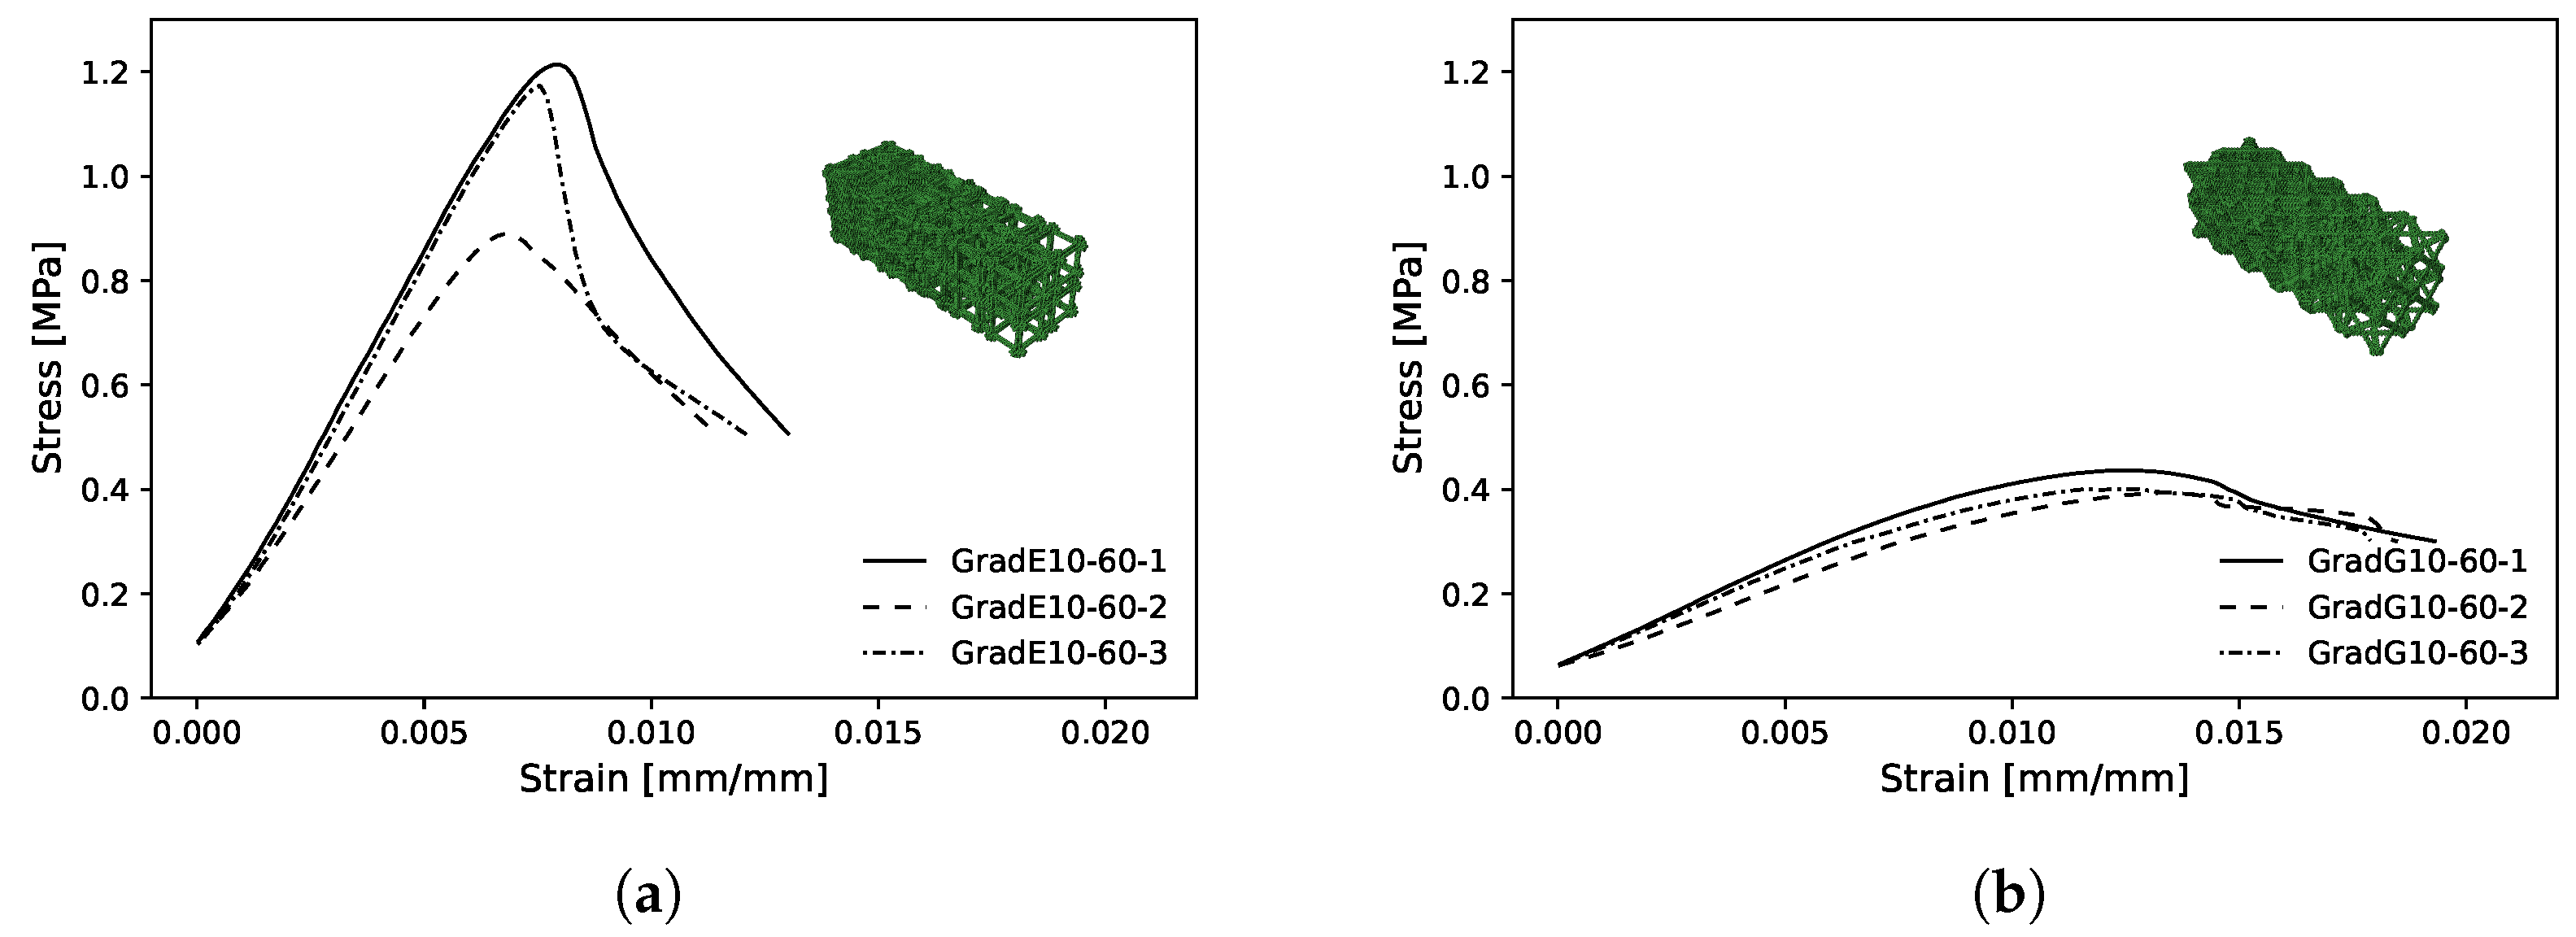
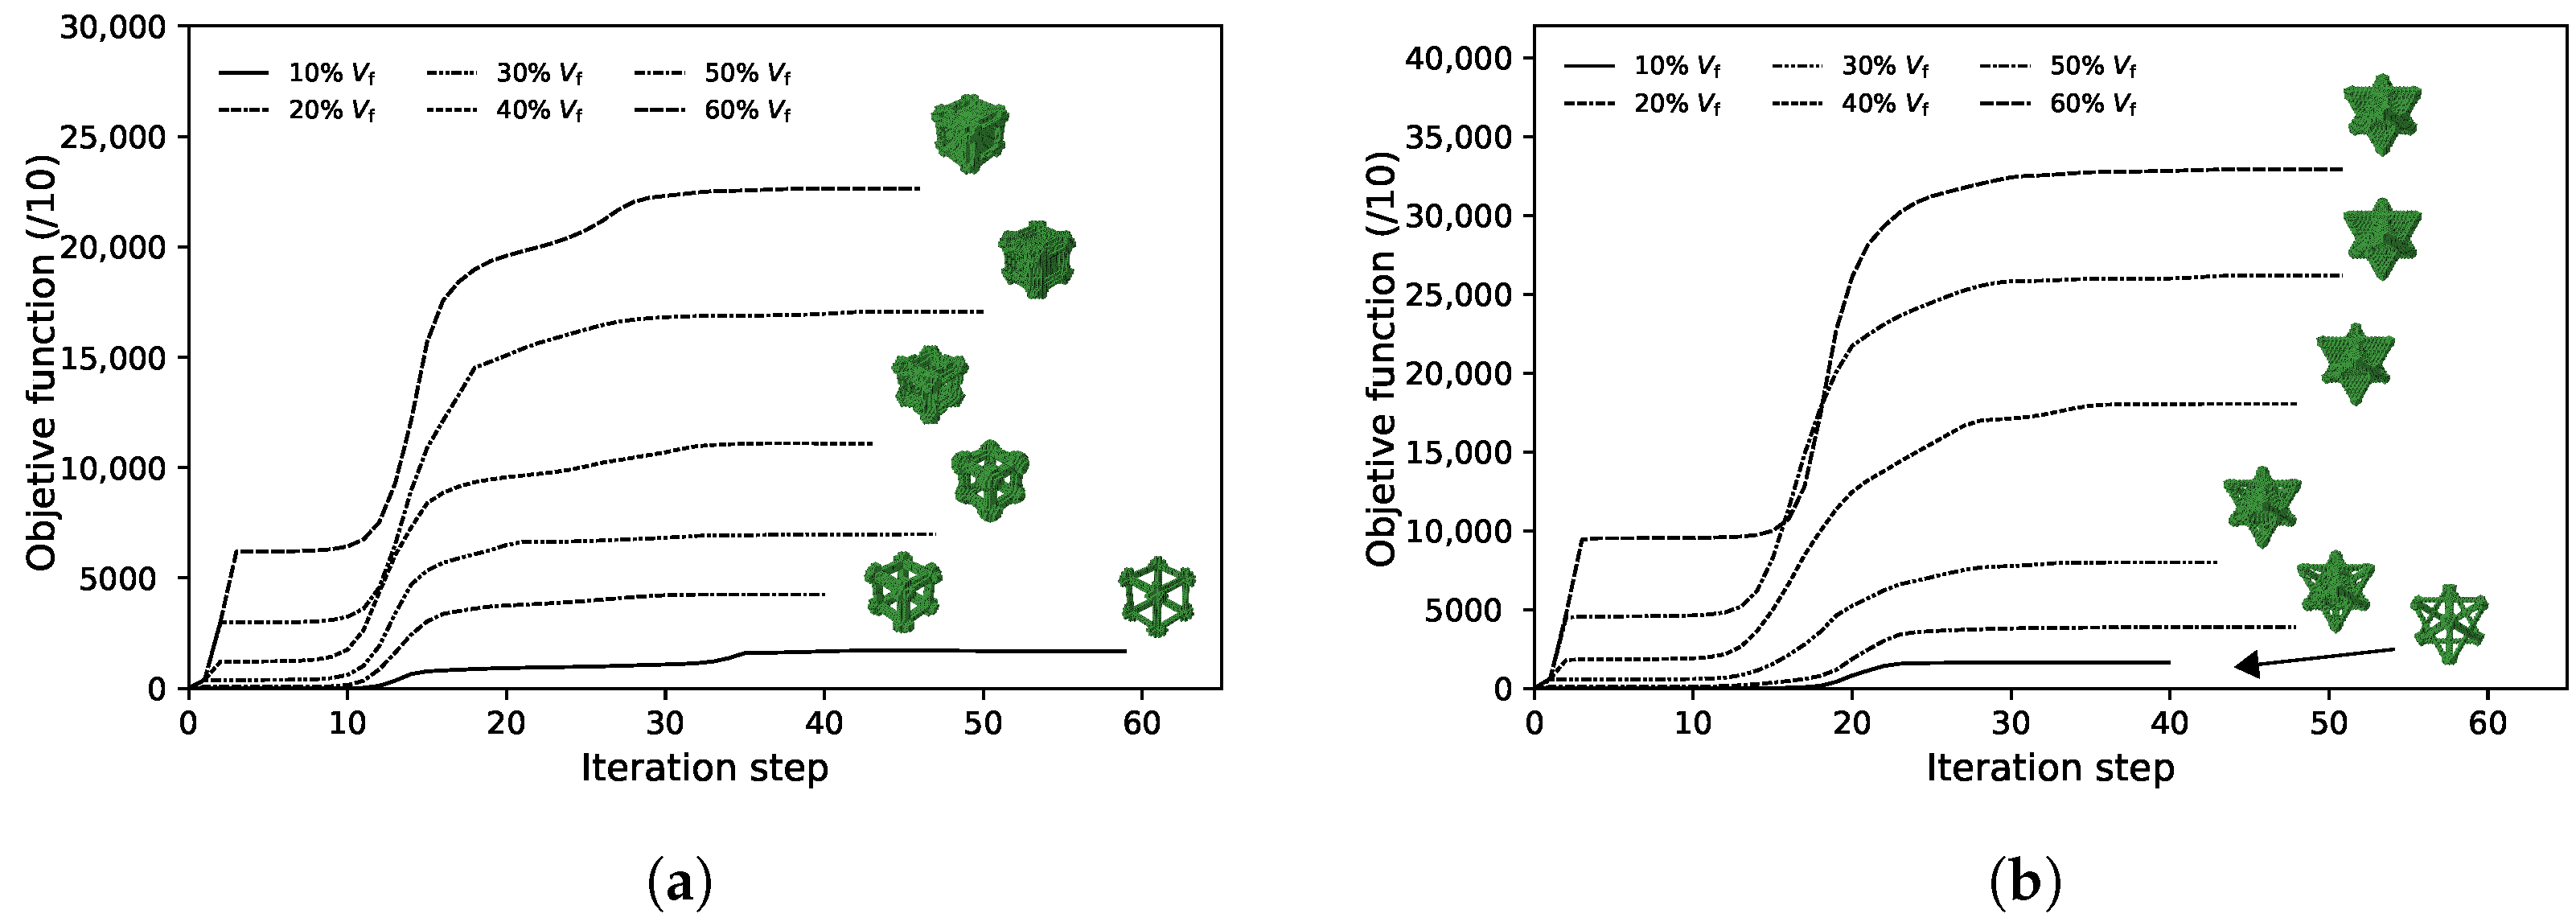
3.3. Graded Structures
4. Conclusions
Author Contributions
Funding
Institutional Review Board Statement
Informed Consent Statement
Data Availability Statement
Conflicts of Interest
Appendix A
Appendix A.1

Appendix A.2

Appendix B
Appendix B.1

Appendix B.2

References
- Zheng, X.; Lee, H.; Weisgraber, T.H.; Shusteff, M.; DeOtte, J.; Duoss, E.B.; Kuntz, J.D.; Biener, M.M.; Ge, Q.; Jackson, J.A.; et al. Ultralight, ultrastiff mechanical metamaterials. Science 2014, 344, 1373–1377. [Google Scholar] [CrossRef]
- Almutairi, M.D.; Aria, A.I.; Thakur, V.K.; Khan, M.A. Self-Healing Mechanisms for 3D-Printed Polymeric Structures: From Lab to Reality. Polymers 2020, 12, 1534. [Google Scholar] [CrossRef] [PubMed]
- Park, G.; Kang, S.; Lee, H.; Choi, W. Tunable Multifunctional Thermal Metamaterials: Manipulation of Local Heat Flux via Assembly of Unit-Cell Thermal Shifters. Sci. Rep. 2017, 7, 41000. [Google Scholar] [CrossRef]
- Narayana, K.J.; Burela, R.G. A review of recent research on multifunctional composite materials and structures with their applications. Mater. Today Proc. 2018, 5, 5580–5590. [Google Scholar] [CrossRef]
- Smith, D.R.; Pendry, J.B.; Wiltshire, M.C.K. Metamaterials and Negative Refractive Index. Science 2004, 305, 788–792. [Google Scholar] [CrossRef]
- Cadman, J.E.; Zhou, S.; Chen, Y.; Li, Q. On design of multi-functional microstructural materials. J. Mater. Sci. 2012, 48, 51–66. [Google Scholar] [CrossRef]
- Radman, A.; Huang, X.; Xie, Y.M. Topology optimization of functionally graded cellular materials. J. Mater. Sci. 2012, 48, 1503–1510. [Google Scholar] [CrossRef]
- Radman, A.; Huang, X.; Xie, Y.M. Topological optimization for the design of microstructures of isotropic cellular materials. Eng. Optim. 2012, 45, 1331–1348. [Google Scholar] [CrossRef]
- Clausen, A.; Wang, F.; Jensen, J.S.; Sigmund, O.; Lewis, J.A. Topology Optimized Architectures with Programmable Poisson’s Ratio over Large Deformations. Adv. Mater. 2015, 27, 5523–5527. [Google Scholar] [CrossRef] [PubMed]
- Rashed, M.G.; Ashraf, M.; Mines, R.A.W.; Hazell, P.J. Metallic microlattice materials: A current state of the art on manufacturing, mechanical properties and applications. Mater. Des. 2016, 95, 518–533. [Google Scholar] [CrossRef]
- Yang, S.; Zhao, Y.F. Additive manufacturing-enabled design theory and methodology: A critical review. Int. J. Adv. Manuf. Technol. 2015, 80, 327–342. [Google Scholar] [CrossRef]
- Gibson, L.J.; Ashby, M.F. Cellular Solids: Structure and Properties, 2nd ed.; Cambridge Solid State Science Series; Cambridge University Press: Cambridge, UK, 1997. [Google Scholar] [CrossRef]
- Christensen, R.M. Mechanics of cellular and other low-density materials. Int. J. Solids Struct. 2000, 37, 93–104. [Google Scholar] [CrossRef]
- Guedes, J.; Kikuchi, N. Preprocessing and postprocessing for materials based on the homogenization method with adaptive finite element methods. Comput. Methods Appl. Mech. Eng. 1990, 83, 143–198. [Google Scholar] [CrossRef]
- Sigmund, O. Materials with prescribed constitutive parameters: An inverse homogenization problem. Int. J. Solids Struct. 1994, 31, 2313–2329. [Google Scholar] [CrossRef]
- Bendsøe, M.P.; Kikuchi, N. Generating optimal topologies in structural design using a homogenization method. Comput. Methods Appl. Mech. Eng. 1988, 71, 197–224. [Google Scholar] [CrossRef]
- Allaire, G.; Kohn, R.V. Topology Optimization and Optimal Shape Design Using Homogenization. In Topology Design of Structures; Springer: Dordrecht, The Netherlands, 1993; pp. 207–218. [Google Scholar] [CrossRef]
- Allaire, G. Homogenization. In Applied Mathematical Sciences; Springer: New York, NY, USA, 2002; pp. 1–89. [Google Scholar] [CrossRef]
- Xie, Y.M.; Steven, G.P. A simple evolutionary procedure for structural optimization. Comput. Struct. 1993, 49, 885–896. [Google Scholar] [CrossRef]
- Xie, Y.M.; Steven, G.P. Basic Evolutionary Structural Optimization. In Evolutionary Structural Optimization; Springer: London, UK, 1997; pp. 12–29. [Google Scholar] [CrossRef]
- Huang, X.; Xie, Y.M. Convergent and mesh-independent solutions for the bi-directional evolutionary structural optimization method. Finite Elem. Anal. Des. 2007, 43, 1039–1049. [Google Scholar] [CrossRef]
- Huang, X.; Xie, Y.M. Bi-directional evolutionary topology optimization of continuum structures with one or multiple materials. Comput. Mech. 2008, 43, 393–401. [Google Scholar] [CrossRef]
- Hussein, M.I.; Hamza, K.; Hulbert, G.M.; Scott, R.A.; Saitou, K. Multiobjective evolutionary optimization of periodic layered materials for desired wave dispersion characteristics. Struct. Multidiscip. Optim. 2005, 31, 60–75. [Google Scholar] [CrossRef]
- Zohdi, T.I. On the tailoring of microstructures for prescribed effective properties. Int. J. Fract. 2002, 118, 89–94. [Google Scholar] [CrossRef]
- Bruck, H.A.; Gilat, R.; Aboudi, J.; Gershon, A.L. A new approach for optimizing the mechanical behavior of porous microstructures for porous materials by design. Model. Simul. Mater. Sci. Eng. 2007, 15, 653–674. [Google Scholar] [CrossRef]
- Osher, S.; Sethian, J.A. Fronts propagating with curvature-dependent speed: Algorithms based on Hamilton-Jacobi formulations. J. Comput. Phys. 1988, 79, 12–49. [Google Scholar] [CrossRef]
- Sethian, J.A.; Wiegmann, A. Structural Boundary Design via Level Set and Immersed Interface Methods. J. Comput. Phys. 2000, 163, 489–528. [Google Scholar] [CrossRef]
- Allaire, G.; Jouve, F.; Toader, A.M. Structural optimization using sensitivity analysis and a level-set method. J. Comput. Phys. 2004, 194, 363–393. [Google Scholar] [CrossRef]
- Zhou, M.; Rozvany, G.I.N. The COC algorithm, Part II: Topological, geometrical and generalized shape optimization. Comput. Methods Appl. Mech. Eng. 1991, 89, 309–336. [Google Scholar] [CrossRef]
- Rozvany, G.I.N.; Bendsoe, M.P.; Kirsch, U. Layout Optimization of Structures. Appl. Mech. Rev. 1995, 48, 41–119. [Google Scholar] [CrossRef]
- Bendsøe, M.P.; Sigmund, O. Material interpolation schemes in topology optimization. Arch. Appl. Mech. 1999, 69, 635–654. [Google Scholar] [CrossRef]
- Sigmund, O.; Maute, K. Topology optimization approaches. Struct. Multidiscip. Optim. 2013, 48, 1031–1055. [Google Scholar] [CrossRef]
- Lianos, A.K.; Bikas, H.; Stavropoulos, P. A Shape Optimization Method for Part Design Derived from the Buildability Restrictions of the Directed Energy Deposition Additive Manufacturing Process. Designs 2020, 4, 19. [Google Scholar] [CrossRef]
- Sigmund, O.; Petersson, J. Numerical instabilities in topology optimization: A survey on procedures dealing with checkerboards, mesh-dependencies and local minima. Struct. Optim. 1998, 16, 68–75. [Google Scholar] [CrossRef]
- Oliveira, J.A. Metodologias de Otimização Topológica em Cálculo Estrutural. Ph.D. Thesis, Universidade de Aveiro, Aveiro, Portugal, 2013. [Google Scholar]
- Otero, F.; Oller, S.; Martinez, X. Multiscale Computational Homogenization: Review and Proposal of a New Enhanced-First-Order Method. Arch. Comput. Methods Eng. 2016, 25, 479–505. [Google Scholar] [CrossRef]
- Voigt, W. Theoretische Studien über die Elasticitätsverhältnisse der Krystalle; Königliche Gesellschaft der Wissenschaften zu Göttingen: Göttingen, Germany, 1887. [Google Scholar]
- Reuss, A. Berechnung der Fließgrenze von Mischkristallen auf Grund der Plastizitätsbedingung für Einkristalle. ZAMM J. Appl. Math. Mech. 1929, 9, 49–58. [Google Scholar] [CrossRef]
- Hill, R. The Elastic Behaviour of a Crystalline Aggregate. Proc. Phys. Soc. Sect. A 1952, 65, 349–354. [Google Scholar] [CrossRef]
- Tomé, C.N. Tensor properties of textured polycrystals. In Texture and Anisotropy: Preferred Orientations in Polycrystals and Their Effect on Materials Properties; Cambridge Univeristy Press: Cambridge, UK, 1998; pp. 282–324. [Google Scholar]
- Beaupre, G.S.; Hayes, W.C. Finite Element Analysis of a Three-Dimensional Open-Celled Model for Trabecular Bone. J. Biomech. Eng. 1985, 107, 249–256. [Google Scholar] [CrossRef]
- Christensen, R.M. Mechanics of low density materials. J. Mech. Phys. Solids 1986, 34, 563–578. [Google Scholar] [CrossRef]
- Gibson, L.J.; Ashby, M.F. The Mechanics of Three-Dimensional Cellular Materials. Proc. R. Soc. A Math. Phys. Eng. Sci. 1982, 382, 43–59. [Google Scholar] [CrossRef]
- Huber, A.; Gibson, L. Anisotropy of foams. J. Mater. Sci. 1988, 23, 3031–3040. [Google Scholar] [CrossRef]
- Lederman, J.M. The prediction of the tensile properties of flexible foams. J. Appl. Polym. Sci. 1971, 15, 693–703. [Google Scholar] [CrossRef]
- Patel, M.; Finnie, I. Structural features and mechanical properties of rigid cellular plastics. J. Mater. 1970, 5, 909–932. [Google Scholar]
- Hassani, B.; Hinton, E. A review of homogenization and topology optimization I—Homogenization theory for media with periodic structure. Comput. Struct. 1998, 69, 707–717. [Google Scholar] [CrossRef]
- Yan, J.; Cheng, G.; Liu, S.; Liu, L. Comparison of prediction on effective elastic property and shape optimization of truss material with periodic microstructure. Int. J. Mech. Sci. 2006, 48, 400–413. [Google Scholar] [CrossRef]
- Ranganathan, S.; Ostojastarzewski, M. Scaling function, anisotropy and the size of RVE in elastic random polycrystals. J. Mech. Phys. Solids 2008, 56, 2773–2791. [Google Scholar] [CrossRef]
- Rosen, D.W. What are Principles for Design for Additive Manufacturing? In Proceedings of the 1st International Conference on Progress in Additive Manufacturing, Research Publishing Services, Singapore, 26–28 May 2014. [Google Scholar] [CrossRef]
- Stansbury, J.W.; Idacavage, M.J. 3D printing with polymers: Challenges among expanding options and opportunities. Dent. Mater. 2016, 32, 54–64. [Google Scholar] [CrossRef] [PubMed]
- Biyikli, E.; To, A.C. Proportional Topology Optimization: A New Non-Sensitivity Method for Solving Stress Constrained and Minimum Compliance Problems and Its Implementation in MATLAB. PLoS ONE 2015, 10, e0145041. [Google Scholar] [CrossRef]
- Zhou, S.; Cadman, J.; Chen, Y.; Li, W.; Xie, Y.M.; Huang, X.; Appleyard, R.; Sun, G.; Li, Q. Design and fabrication of biphasic cellular materials with transport properties—A modified bidirectional evolutionary structural optimization procedure and MATLAB program. Int. J. Heat Mass Transf. 2012, 55, 8149–8162. [Google Scholar] [CrossRef]
- Li, H.; Luo, Z.; Gao, L.; Walker, P. Topology optimization for functionally graded cellular composites with metamaterials by level sets. Comput. Methods Appl. Mech. Eng. 2018, 328, 340–364. [Google Scholar] [CrossRef]
- Miyamoto, Y.; Kaysser, W.A.; Rabin, B.H.; Kawasaki, A.; Ford, R.G. Lessons from Nature. In Functionally Graded Materials; Springer: New York, NY, USA, 1999; pp. 7–27. [Google Scholar] [CrossRef]
- Silva, E.C.N.; Walters, M.C.; Paulino, G.H. Modeling bamboo as a functionally graded material: Lessons for the analysis of affordable materials. J. Mater. Sci. 2006, 41, 6991–7004. [Google Scholar] [CrossRef]
- Coelho, P.G.; Fernandes, P.R.; Rodrigues, H.C.; Cardoso, J.B.; Guedes, J.M. Numerical modeling of bone tissue adaptation—A hierarchical approach for bone apparent density and trabecular structure. J. Biomech. 2009, 42, 830–837. [Google Scholar] [CrossRef]
- Miyamoto, Y.; Kaysser, W.A.; Rabin, B.H.; Kawasaki, A.; Ford, R.G. Applications. In Functionally Graded Materials; Springer: New York, NY, USA, 1999; pp. 247–313. [Google Scholar] [CrossRef]
- Paulino, G.H.; Silva, E.C.N.; Le, C.H. Optimal design of periodic functionally graded composites with prescribed properties. Struct. Multidiscip. Optim. 2009, 38, 469–489. [Google Scholar] [CrossRef]
- Conlan-Smith, C.; Bhattacharyya, A.; James, K.A. Optimal design of compliant mechanisms using functionally graded materials. Struct. Multidiscip. Optim. 2017, 57, 197–212. [Google Scholar] [CrossRef]
- Zhang, C.; Chen, F.; Huang, Z.; Jia, M.; Chen, G.; Ye, Y.; Lin, Y.; Liu, W.; Chen, B.; Shen, Q.; et al. Additive manufacturing of functionally graded materials: A review. Mater. Sci. Eng. A 2019, 764, 138209. [Google Scholar] [CrossRef]
- Shanmugam, V.; Rajendran, D.J.J.; Babu, K.; Rajendran, S.; Veerasimman, A.; Marimuthu, U.; Singh, S.; Das, O.; Neisiany, R.E.; Hedenqvist, M.S.; et al. The mechanical testing and performance analysis of polymer-fibre composites prepared through the additive manufacturing. Polym. Test. 2021, 93, 106925. [Google Scholar] [CrossRef]
- Lianos, A.K.; Koutsoukos, S.; Bikas, H.; Stavropoulos, P. Manufacturability Assessment and Design for AM. Procedia CIRP 2020, 91, 290–294. [Google Scholar] [CrossRef]
- Zhou, S.; Li, Q. Design of graded two-phase microstructures for tailored elasticity gradients. J. Mater. Sci. 2008, 43, 5157–5167. [Google Scholar] [CrossRef]
- Zhou, S.; Li, Q. Microstructural design of connective base cells for functionally graded materials. Mater. Lett. 2008, 62, 4022–4024. [Google Scholar] [CrossRef]
- Wang, M.Y.; Zhou, S.; Ding, H. Nonlinear diffusions in topology optimization. Struct. Multidiscip. Optim. 2004, 28, 262–276. [Google Scholar] [CrossRef]
- Bendsøe, M.P.; Sigmund, O. Topology Optimization: Theory, Methods, and Applications; Springer: Berlin/Heidelberg, Germany, 2004. [Google Scholar] [CrossRef]
- Bruyneel, M.; Duysinx, P. Note on topology optimization of continuum structures including self-weight. Struct. Multidiscip. Optim. 2004, 29, 245–256. [Google Scholar] [CrossRef]
- Saunders, M.; Lewis, P.; Thornhill, A. Research Methods for Business Students; Always Learning; Prentice Hall: Upper Saddle River, NJ, USA, 2009. [Google Scholar]
- Aboudi, J. Micromechanical prediction of initial and subsequent yield surfaces of metal matrix composites. Int. J. Plast. 1990, 6, 471–484. [Google Scholar] [CrossRef]
- Brockenbrough, J.R.; Suresh, S.; Wienecke, H.A. Deformation of metal-matrix composites with continuous fibers: Geometrical effects of fiber distribution and shape. Acta Metall. Mater. 1991, 39, 735–752. [Google Scholar] [CrossRef]
- Needleman, A.; Tvergaard, V. Comparison of Crystal Plasticity and Isotropic Hardening Predictions for Metal-Matrix Composites. J. Appl. Mech. 1993, 60, 70–76. [Google Scholar] [CrossRef]
- Sun, C.T.; Vaidya, R.S. Prediction of composite properties from a representative volume element. Compos. Sci. Technol. 1996, 56, 171–179. [Google Scholar] [CrossRef]
- Suquet, P. Elements of Homogenization Theory for Inelastic Solid Mechanics. In Homogenization Techniques for Composite Media; Springer: Berlin/Heidelberg, Germany, 1987. [Google Scholar]
- Xia, Z.; Zhang, Y.; Ellyin, F. A unified periodical boundary conditions for representative volume elements of composites and applications. Int. J. Solids Struct. 2003, 40, 1907–1921. [Google Scholar] [CrossRef]
- Bonora, N.; Ruggiero, A. Micromechanical modeling of composites with mechanical interface–Part II: Damage mechanics assessment. Compos. Sci. Technol. 2006, 66, 323–332. [Google Scholar] [CrossRef]
- Wu, W.; Owino, J.; Al-Ostaz, A.; Cai, L. Applying periodic boundary conditions in finite element analysis. In Proceedings of the SIMULIA Community Conference, Providence, RI, USA, 20–22 May 2014; pp. 707–719. [Google Scholar]
- Ye, F.; Wang, H. A simple Python code for computing effective properties of 2D and 3D representative volume element under periodic boundary conditions. arXiv 2017, arXiv:1703.03930. [Google Scholar]
- Omairey, S.L.; Dunning, P.D.; Sriramula, S. Development of an ABAQUS plugin tool for periodic RVE homogenisation. Eng. Comput. 2018, 35, 567–577. [Google Scholar] [CrossRef]
- International Organization for Standardization (ISO). Rigid Cellular Plastics—Determination of Compression Properties; ISO 844:2014 Standard; International Organization for Standardization (ISO): Geneva, Switzerland, 2014. [Google Scholar]
- Cazón, A.; Morer, P.; Matey, L. PolyJet technology for product prototyping: Tensile strength and surface roughness properties. Proc. Inst. Mech. Eng. Part B J. Eng. Manuf. 2014, 228, 1664–1675. [Google Scholar] [CrossRef]
- Dizon, J.R.C.; Espera, A.H.; Chen, Q.; Advincula, R.C. Mechanical characterization of 3D-printed polymers. Addit. Manuf. 2018, 20, 44–67. [Google Scholar] [CrossRef]


| Volume Fraction, Vf | 10–60% |
| Penalty, p | 4.0 |
| Filter radius, | 2.0 |
| Gray-scale filter, | 3.0 |
| Material 1 (rigid) | E = 1850 MPa, = 0.49 |
| Material 2 (support) | E = 0.3 MPa, = 0.49 |
| Sample | [MPa] | [MPa] | SD [MPa] | [MPa] | [MPa] | Err [%] |
|---|---|---|---|---|---|---|
| EV10-1 | 45.57 | |||||
| EV10-2 | 52.49 | 47.09 | 3.94 | 70.53 | — | −49.77 |
| EV10-3 | 43.20 | |||||
| EV30-1 | 256.61 | |||||
| EV30-2 | 249.56 | 251.95 | 3.29 | 280.76 | — | −11.43 |
| EV30-3 | 251.95 | |||||
| EV60-1 | 1015.55 | |||||
| EV60-2 | 976.67 | 1012.69 | 28.32 | 919.99 | — | 9.15 |
| EV60-3 | 1045.86 | |||||
| GV10-1 | 11.48 | |||||
| GV10-2 | 9.42 | 10.54 | 0.85 | 25.55 | — | −142.41 |
| GV10-3 | 10.72 | |||||
| GV30-1 | 84.79 | |||||
| GV30-2 | 80.39 | 83.11 | 1.94 | 112.56 | — | −35.43 |
| GV30-3 | 84.15 | |||||
| GV60-1 | 680.61 | |||||
| GV60-2 | 686.89 | 685.60 | 3.66 | 605.14 | — | 11.73 |
| GV60-3 | 689.31 | |||||
| GE1060-1 | 161.38 | |||||
| GE1060-2 | 136.59 | 151.80 | 10.88 | — | 141.24 | 6.96 |
| GE1060-3 | 157.43 | |||||
| GG1060-1 | 41.78 | |||||
| GG1060-2 | 33.30 | 37.70 | 3.47 | — | 53.13 | −40.90 |
| GG1060-3 | 38.02 |
| Sample | No. Iter | SEFR [%] | K [MPa] | G [MPa] |
|---|---|---|---|---|
| EV10 | 59 | 5 | 32.93 | — |
| EV20 | 40 | 8 | 81.17 | — |
| EV30 | 47 | 13 | 145.77 | — |
| EV40 | 43 | 25 | 271.93 | — |
| EV50 | 50 | 33 | 642.38 | — |
| EV60 | 46 | 47 | 1002.17 | — |
| GV10 | 40 | 31 | — | 8.18 |
| GV20 | 51 | 32 | — | 19.09 |
| GV30 | 43 | 34 | — | 39.96 |
| GV40 | 48 | 32 | — | 79.69 |
| GV50 | 51 | 44 | — | 100.50 |
| GV60 | 51 | 48 | — | 117.59 |
Publisher’s Note: MDPI stays neutral with regard to jurisdictional claims in published maps and institutional affiliations. |
© 2021 by the authors. Licensee MDPI, Basel, Switzerland. This article is an open access article distributed under the terms and conditions of the Creative Commons Attribution (CC BY) license (https://creativecommons.org/licenses/by/4.0/).
Share and Cite
Silva, M.R.; Dias-de-Oliveira, J.A.; Pereira, A.M.; Alves, N.M.; Sampaio, Á.M.; Pontes, A.J. Design of Kinematic Connectors for Microstructured Materials Produced by Additive Manufacturing. Polymers 2021, 13, 1500. https://doi.org/10.3390/polym13091500
Silva MR, Dias-de-Oliveira JA, Pereira AM, Alves NM, Sampaio ÁM, Pontes AJ. Design of Kinematic Connectors for Microstructured Materials Produced by Additive Manufacturing. Polymers. 2021; 13(9):1500. https://doi.org/10.3390/polym13091500
Chicago/Turabian StyleSilva, Miguel R., João A. Dias-de-Oliveira, António M. Pereira, Nuno M. Alves, Álvaro M. Sampaio, and António J. Pontes. 2021. "Design of Kinematic Connectors for Microstructured Materials Produced by Additive Manufacturing" Polymers 13, no. 9: 1500. https://doi.org/10.3390/polym13091500
APA StyleSilva, M. R., Dias-de-Oliveira, J. A., Pereira, A. M., Alves, N. M., Sampaio, Á. M., & Pontes, A. J. (2021). Design of Kinematic Connectors for Microstructured Materials Produced by Additive Manufacturing. Polymers, 13(9), 1500. https://doi.org/10.3390/polym13091500