Article

Ion-Imprinted Polymer Modified with Carbon Quantum Dots as a Highly Sensitive Copper(II) Ion Probe

College of Chemical Engineering, Qinghai University, Xining 810016, China
*
Author to whom correspondence should be addressed.
Polymers 2021, 13(9), 1376; https://doi.org/10.3390/polym13091376
Submission received: 28 February 2021 / Revised: 13 April 2021 / Accepted: 21 April 2021 / Published: 23 April 2021

Abstract

:
Fluorescence analysis technology and ion imprinting technology are combined to prepare a copper ion fluorescence sensor. Carbon quantum dots (CQDs), with a quantum yield of 79%, were synthesized by a hydrothermal process using citric acid as the carbon source. The prepared CQDs, acting as the fluorophore, were grafted onto the surface of an SBA-15 mesoporous molecular sieve by an amidation reaction. Then, the fluorescent sensor CQDs@Cu-IIP was prepared using a surface imprinting technique with the modified SBA-15 as the substrate, copper ions as a template, tetraethoxysilane as the crosslinker, and 3-aminopropyl-3-ethoxysilane as the functional monomers. The sensor showed strong fluorescence from CQDs and high selectivity due to the presence of Cu(II)-IIP. After the detection conditions were optimized, the fluorescence intensity of the sensor had good linearity with Cu(II) concentration in a linear range of 0.25–2 mg/L and 3–10 mg/L. This CQDs@Cu-IIP was applied to the determination of traces Cu(II) in real water samples and good recoveries of 99.29–105.42% were obtained. The present study provides a general strategy for fabricating materials based on CQDs for selective fluorescence detection of heavy metals.

Graphical Abstract

1. Introduction

Higher energy demand and increased use of heavy metals in industrial processes have increased human exposure to these toxic substances in drinking water [1]. Different heavy metals bring different harm to the environment and the human body. For example, copper sulfate has a stimulating effect on the gastrointestinal tract and may cause nausea, vomiting, and heartburn. In severe cases, abdominal cramps, hematemesis, and black stools occur [2,3]. Copper ions combine with many organic substances and may destroy the normal environment and physiological processes [4]. Therefore, the determination of trace-level heavy metal ions in complex solutions is of great significance [5].
Until now, many traditional detection methods, such as ICP-MS, ICP-OES, AAS and electrochemistry, have been used to detect Cu(II) levels in environmental water [6,7,8,9,10]. However, these instrumentation techniques are often complex, expensive, time-consuming, and require tedious sample pretreatment [11]. Compared with these traditional detection methods, fluorescence detection has great potential owing to its excellent properties such as high sensitivity and quick process [12]. Carbon quantum dots (CQDs), as a new type of carbon nanomaterial, have aroused extensive interest due to their unique properties, such as low cost, ease of manufacture, non-toxicity, stability. It has potential applications in many areas such as biosensing, electrocatalyst, photoscience, and so on, especially in the field of fluorescence recognition [13,14,15,16]. A large number of researches on metal ion detection based on CQD have been reported [17,18,19]. However, fluorescent recognition based on CQDs often has interferences from coexisting ions, leading to low selectivity. Therefore, a feasible method for improving the selectivity of fluorescent detection based on CQDs is the use of ion imprinting polymers (IIPs) with specific recognition sites for target ions. IIPs have been widely used in recognition for metal ions owing to their high selectivity [20]. Chen et al. reported a glass fiber paper-based analytical instrument based on QDs and copper ion-imprinted polymers. A new type of highly selective fluorescence sensor was fabricated, and on this basis, a miniature (3D) origami ion-imprinted polymer microfluidic paper-based chip device was proposed for specificity to Cu2+ and Hg2+, sensitive and multiple detections. In this device, the surface of the paper is activated by amino treatment and grafting of CdTe QDs complex, resulting in QD fluorescence quenching. This method can simultaneously detect Cu2+ and Hg2+ ions, with good selectivity and sensitivity. This simple, fast, and reliable sensing strategy opens up attractive prospects for ion monitoring in aqueous samples [11,21]. The integration of the fluorescence of CQDs and selectivity of IIPs are expected to provide a synergistic effect in sensor construction. So far, there are limited reports on the combination of ion-imprinted polymers and carbon quantum dots [22].
In this work, CQDs were fabricated by a hydrothermal treatment using citric acid as a carbon source. The prepared CQDs, acting as the fluorophore, was grafted onto the surface of an SBA-15 mesoporous molecular sieve by an amidation reaction. Then, the fluorescent sensor CQDs@Cu-IIP was prepared by a surface imprinting technique. The sensor was used to detect Cu(II) in real water samples and shows high selectivity and sensitivity.

2. Experimental Section

2.1. Materials

Triblock copolymer Pluronic P123 ((EO)20(PO)70(EO)20), 1-(3-dimethylaminopropyl)-3-ethylcarbodiimide hydrochloride (EDC) and 3-aminopropyl-3-ethoxysilane (APTES) were purchased from Aladdin Reagent Co., Ltd. (Shanghai, China). Tetraethoxysilane (TEOS), citric acid, ethylenediamine (EDA), hydrochloric acid, ammonia solution, N-hydroxysuccinimide (NHS), Cu2SO4, Na2HPO4, and NaH2PO4 were purchased from Sinopharm Chemical Reagent Co., Ltd.(Shanghai, China). All chemicals were of at least analytical grade. Ultrapure water was used during the entire experimental process. River water was collected from the Beichuan river in Xining.

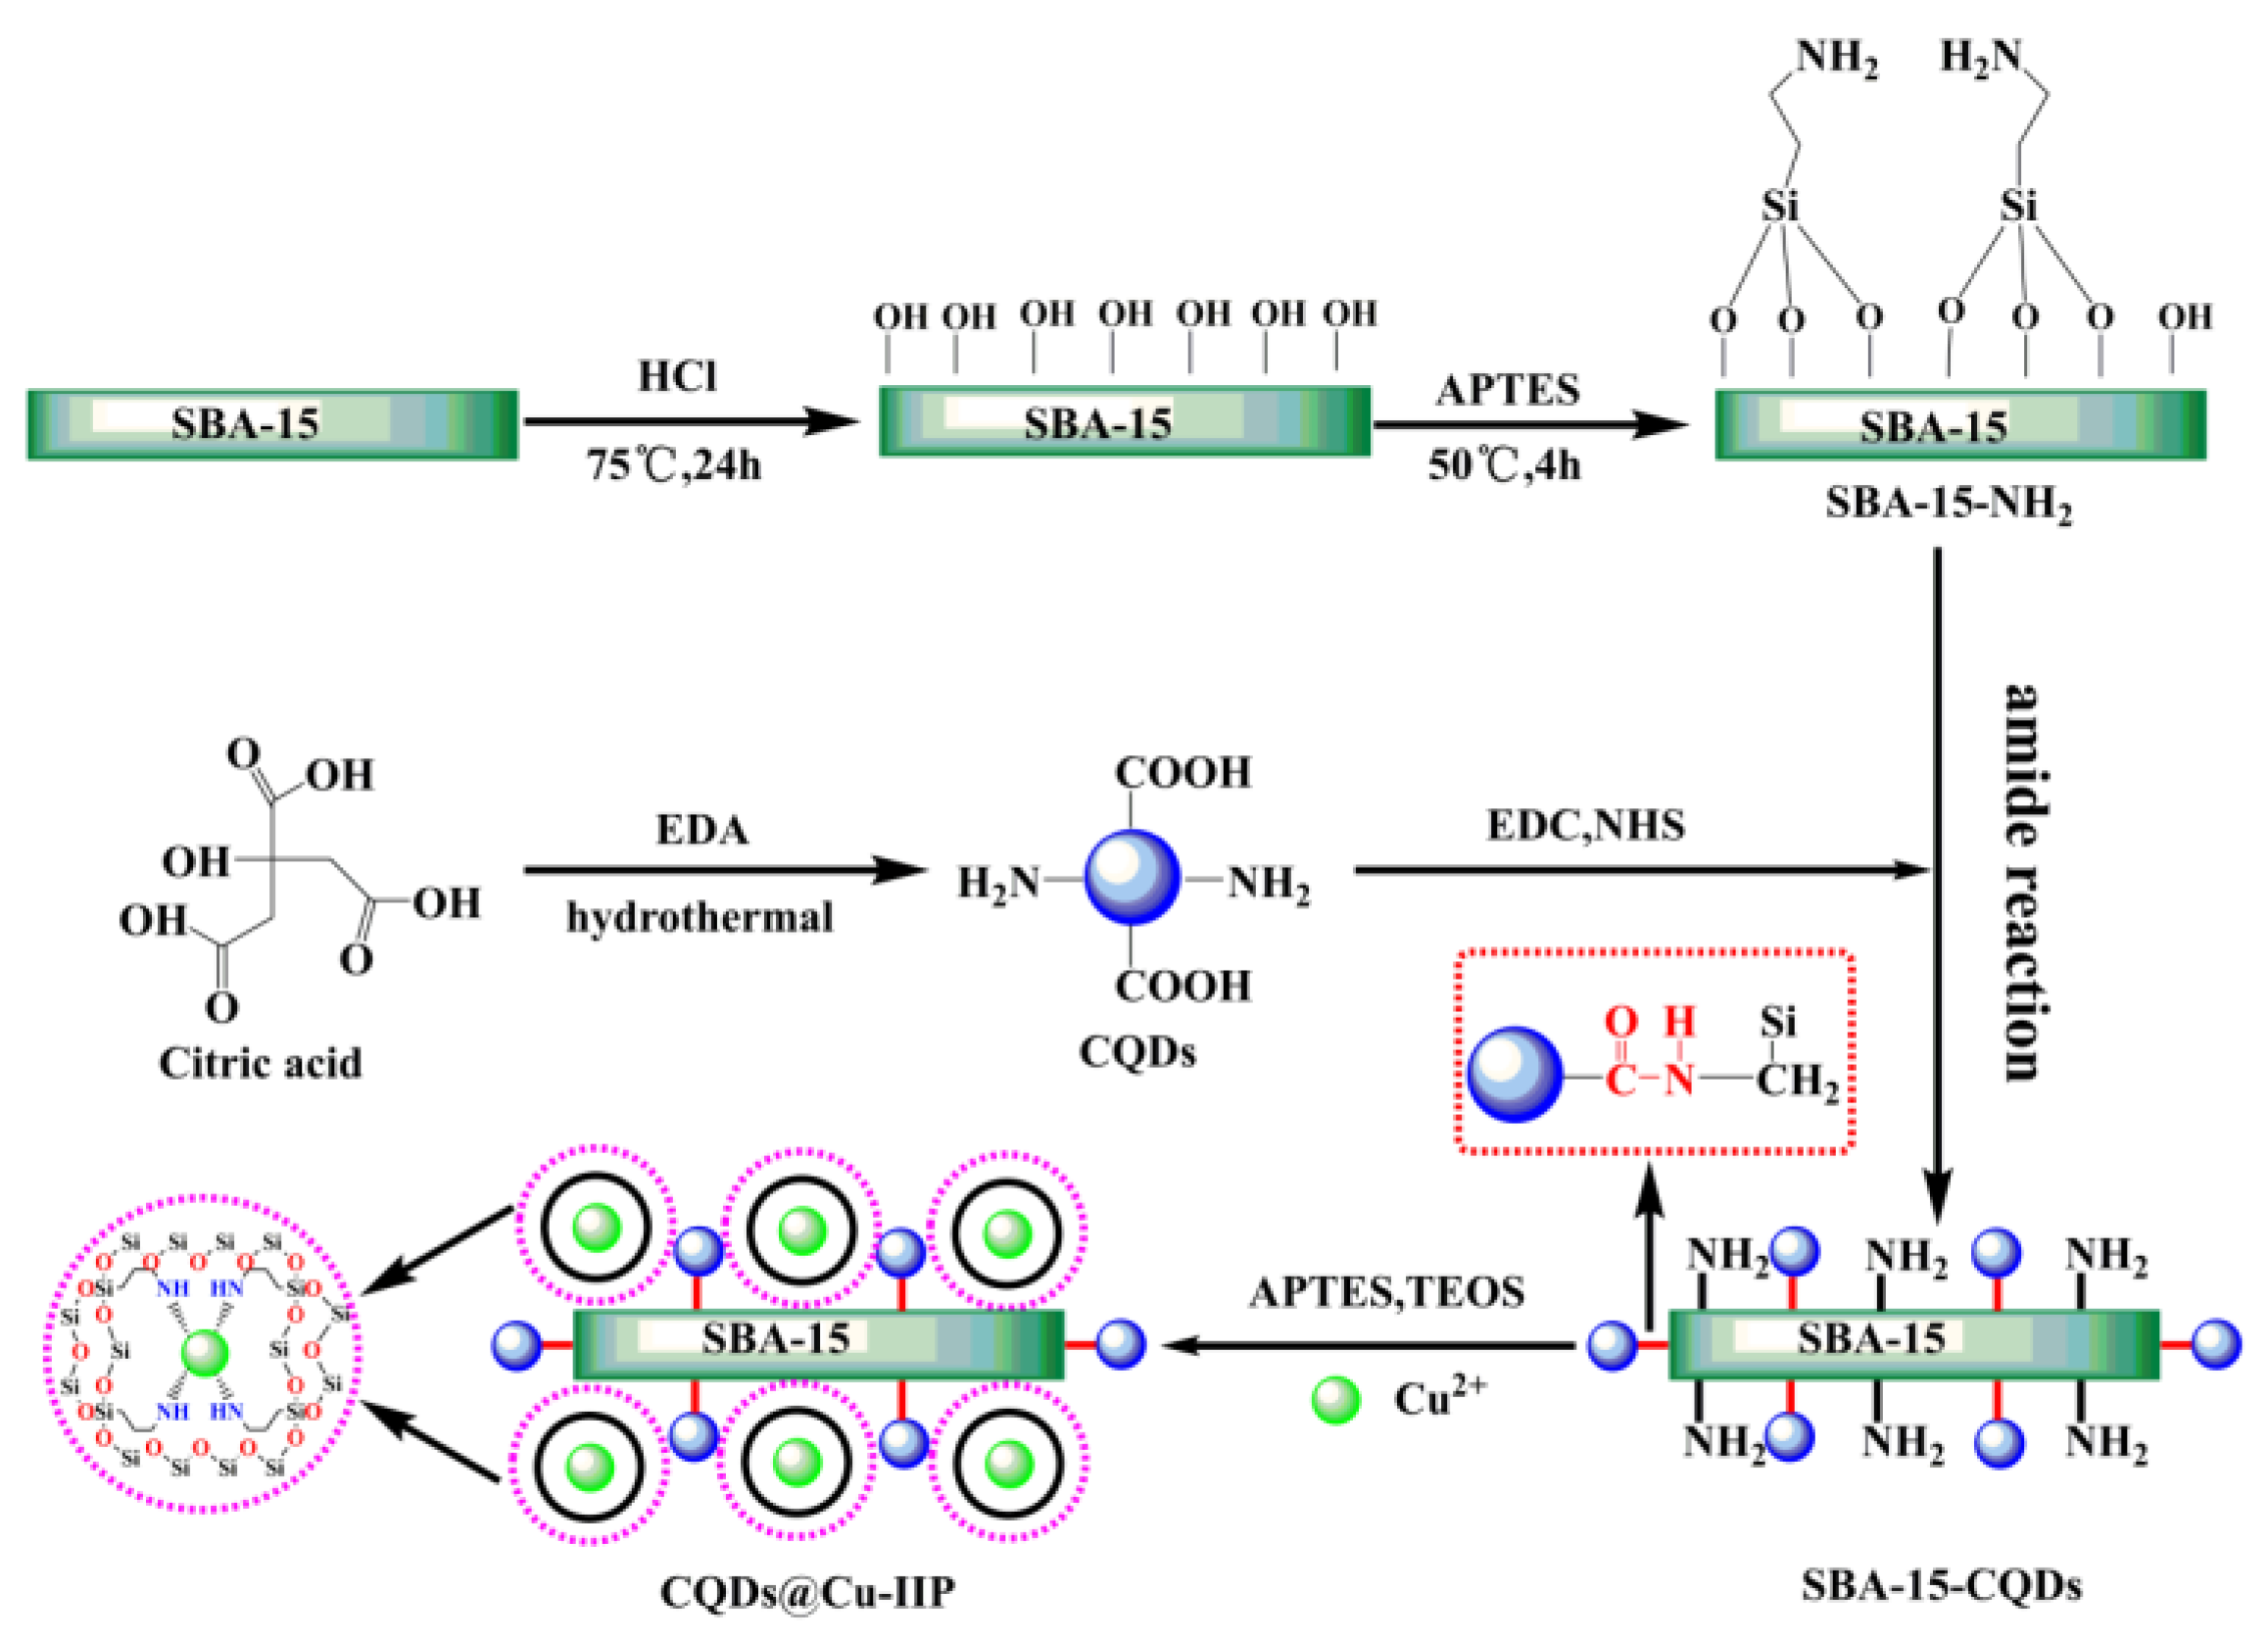
2.2. Synthesis of CQDs

The CQDs were synthesized in one step by the classical hydrothermal method using citric acid as the carbon source. First, 1.0 g of citric acid and 335 μL of EDA were dissolved in 10 mL of ultrapure water. The mixed solution was sealed in a 25 mL Teflon-lined stainless steel vessel and heated at a rate of 2 °C/min to a holding temperature of 150 °C for 5 h. The CQDs solution was first filtered through a 0.22 μm membrane to remove macromolecular impurities. The resulting solution was dialyzed for 24 h to remove any unreacted precursors. After completion of the dialysis, the solution was placed in a Petri dish to freeze-dry, and finally, a dark-yellow powder solid was obtained.

2.3. Preparation of Amino-Functionalized SBA-15

The SBA-15 molecular sieves were synthesized using a classical preparation method [23], not described here. 1.0 g of SBA-15 and 100 mL of 3 mol/L hydrochloric acids were added into a 250 mL flask and refluxed at 75 °C for 24 h. The solid was washed until the filtration was neutral. The filtered solid was dried at 60 °C for 6 h to obtain activated SBA-15. Then, 1.0 g of activated SBA-15 and 20 mL of APTES were added into 80 mL of water and stirred at 50 °C for 4 h under a nitrogen atmosphere. The solid was separated, washed with water, and dried at 60 °C for 6 h to obtain amino-functionalized SBA-15 (SBA-15-NH2).

2.4. Synthesis of SBA-15-CQDs

SBA-15-CQDs were synthesized using an amide condensation reaction between the -NH2 groups on the surface of SBA-15 and the −COOH groups on the CQDs. Specifically, 0.10 g of CQDs powder was dissolved in 10 mL of water. Then, 10 mL of 20 mg/mL EDC solution and 10 mg/mL of NHS solution were added and sonicated for 10 min. Then, 1.0 g of SBA-15-NH2 was added to the mixed solution, and magnetically stirred at room temperature for 18 h. After that, a pale-yellow solid powder of SBA-15-CQDs was obtained.

2.5. Synthesis of CQDs@Cu-IIP

First, 0.500 g of SBA-15-CQDs and 0.005 g of copper sulfate were mixed in 20 mL of water for 5 min. Then, 76 μL of APTES was added, and it was stirred for 30 min. Next, 100 μL of TEOS and 250 μL of concentrated ammonia water were sequentially added to the mixed solution, followed by stirring for 4 h at room temperature. The product was collected by centrifugation. The Cu(II) templates in the IIP were extracted with 0.1 mol/L of hydrochloric acid until no Cu(II) could be detected by FAAS in the eluent. Finally, the CQDs@Cu-IIP were dried at 40 °C under vacuum for 12 h. A non-imprinted polymer sensor (CQDs@NIP) was prepared as a blank, without the addition of copper sulfate.

2.6. Material Characterization

X-ray powder diffraction (XRD) patterns were obtained on an X-ray diffractometer (D8 FOCUS, Bruker, Karlsruhe, Germany) with Cu Kα radiation. The chemical composition of materials was acquired with an X-ray photoelectron spectrometer (ESCALAB Xi+, Thermo Fisher Scientific, Waltham, MA, USA) using a monochromatic Al Kα source (1486.6 eV). The infrared spectra in KBr were obtained using an FT-IR BXII spectrometer (Perkin-Elmer, Waltham, MA, USA). The surface charge of CQDs was measured using a Zeta potential analyzer (Zetasizernano, Malvern Instruments, Shanghai, China). The morphologies were observed by scanning electron microscope (JSM-6610LV, JEOL., Ltd., Akishima City, Tokyo, Japan) and transmission electron microscope (JEM-2100F JEOL., Ltd., Akishima City, Tokyo, Japan). The fluorescence experiment was performed using an FL-7000 spectrofluorometer (FL-7000, Hitachi, Tokyo, Japan). Perform liquid and solid absorption studies of UV-Vis samples on a spectrophotometer (T6, general analysis, China and Cary Series UV-Vis-NIR, Agilent Technologies, Beijing, China). Detection of metal ions using flame atomic absorption spectrophotometer (AAS, A-6300C, Shimadzu, Kyoto, Japan). The sample was dried using a vacuum freeze dryer (SCIENTZ-12N, Ningbo Xinzhi Biological Technology Co., Ltd., Shanghai, China).

2.7. Determination of the Fluorescence Quantum Yield

Fluorescence measurements were performed under the following conditions: the slit widths of the emission and excitation gap widths were 2.5 and 5 nm, respectively, and the excitation wavelength was set at 366 nm. A scan rate of 240 nm/min, and a photomultiplier tube voltage of 400 V were used. The change in fluorescence intensity of the corresponding emission wavelength was used to determine the optimal excitation wavelength.
The CQDs quantum yield (QY) was determined via a comparative method using quinine sulfate (QY = 54.8%) as the reference solution with an excitation wavelength at 366 nm [24]. The absorption value at 366 nm excitation wavelength was maintained below 0.1 to minimize self-absorption. Quinine sulfate was dissolved in 0.1 mol/L H2SO4, and the CQDs were dissolved in distilled water. The QY of CQDs was calculated using the following equation:
φ S = φ R F S F R A R A S η S 2 η R 2
where φ stands for the fluorescence quantum yield, F refers to the integrated fluorescence intensity, η is the refractive index, and A is the absorption value which is measured on a UV-Vis spectrophotometer. The subscripts “R” and “S” correspond to the reference and the sample, respectively.

3. Results and Discussion

3.1. Synthesis of CQDs and CQDs@Cu-IIP

The synthetic route of CQDs@Cu-IIP is shown in Figure 1. First, the prepared SBA-15 was activated and aminated to obtain SBA-15-OH and SBA-15-NH2. Second, the CQDs were prepared by citric acid (CA) and ethylene-diamine (EDA) through an improved hydrothermal method. The CQDs were grafted onto the surface of SBA-15-NH2 through an amide reaction. The remaining amino groups in SBA-15-NH2 were used to synthesize ion-imprinted polymers by surface imprinting technology. In this study, the surface imprint strategy was used because it controls the imprint location to be near the surface or on the surface of the material, thereby improving accessibility and reducing response time [25].

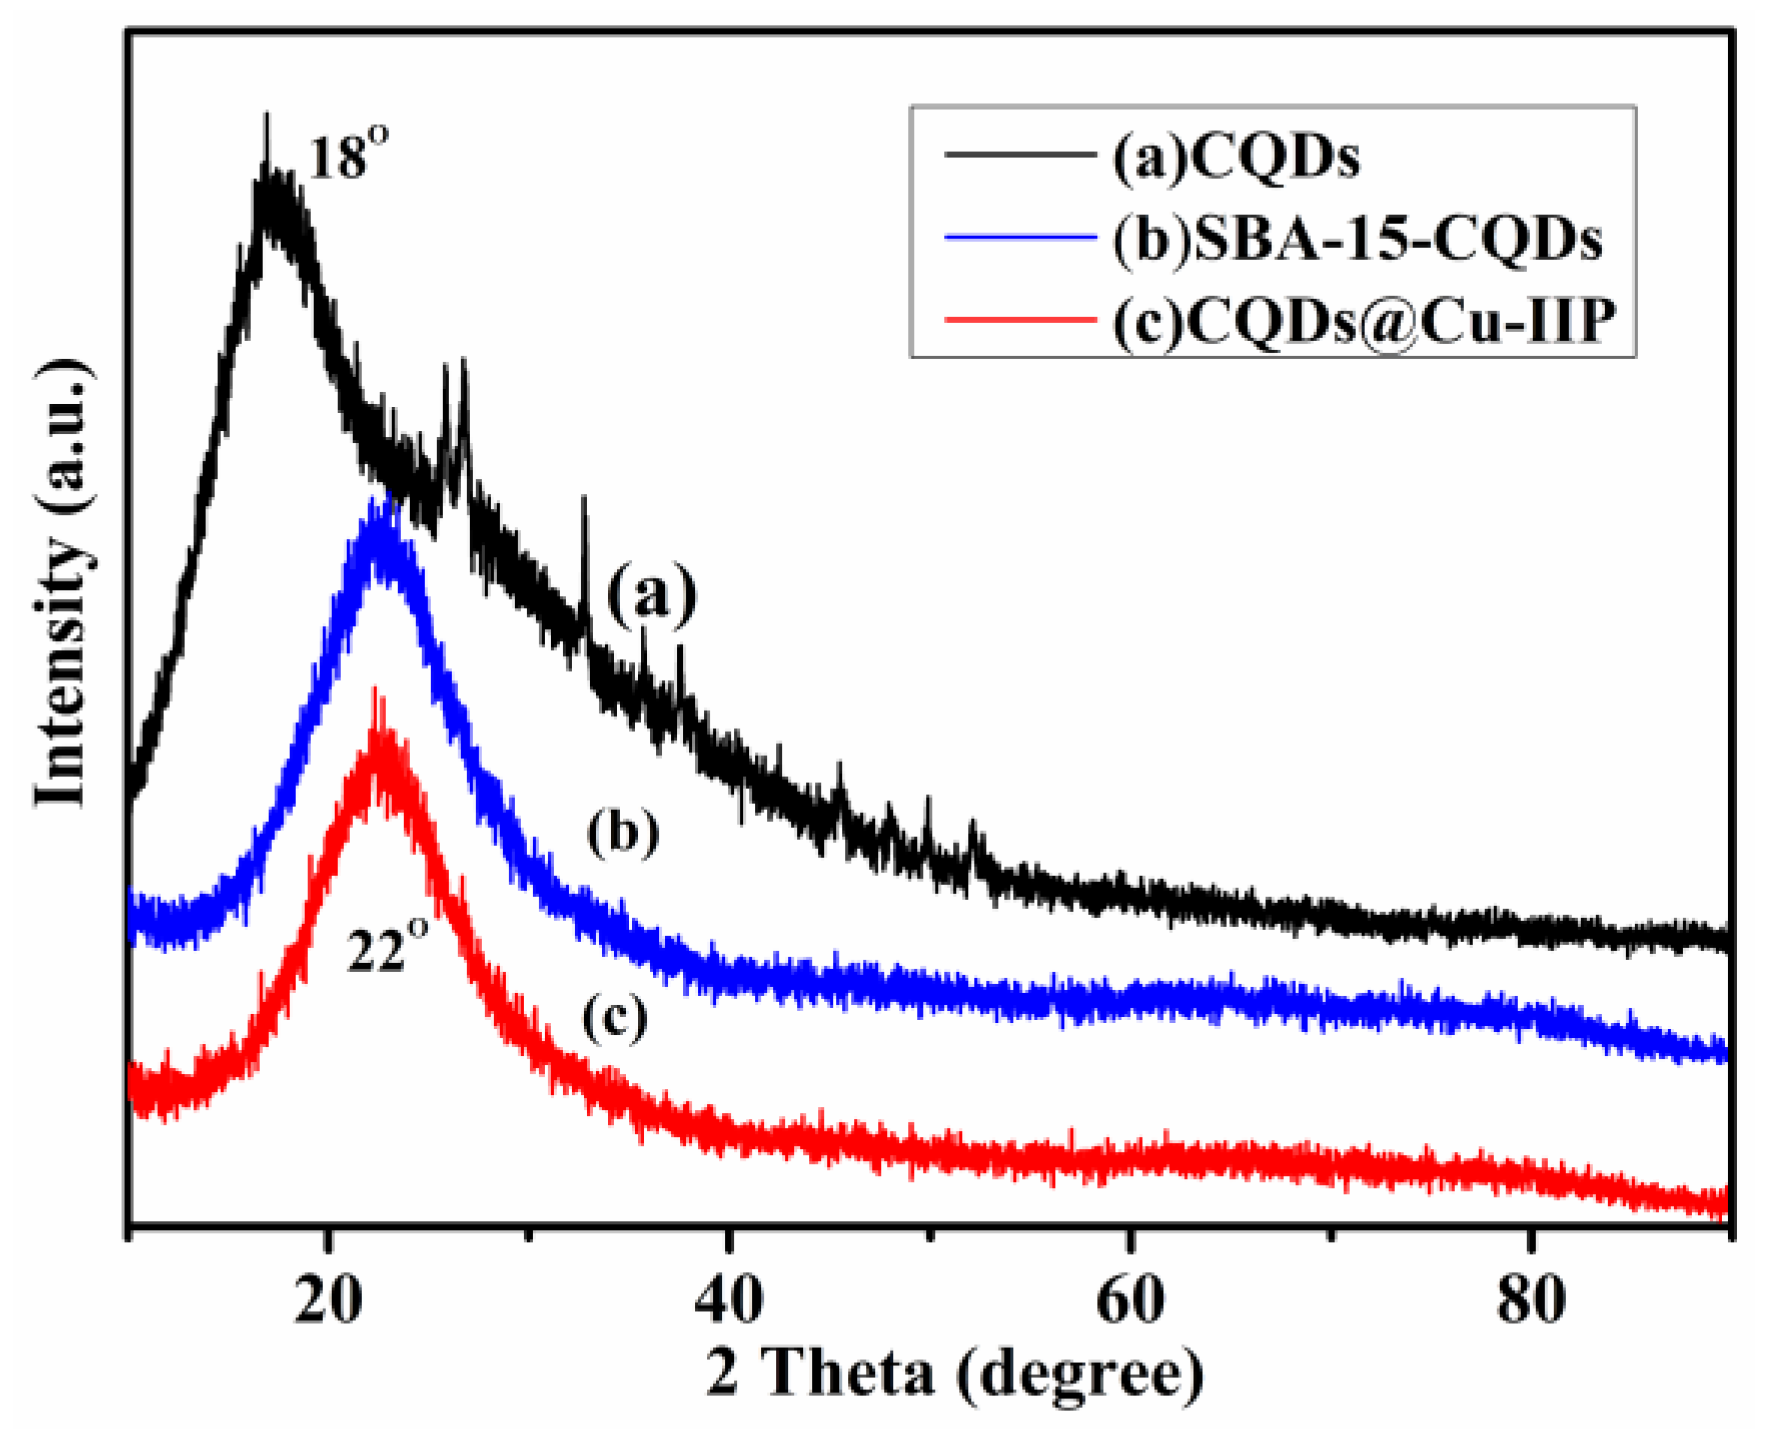
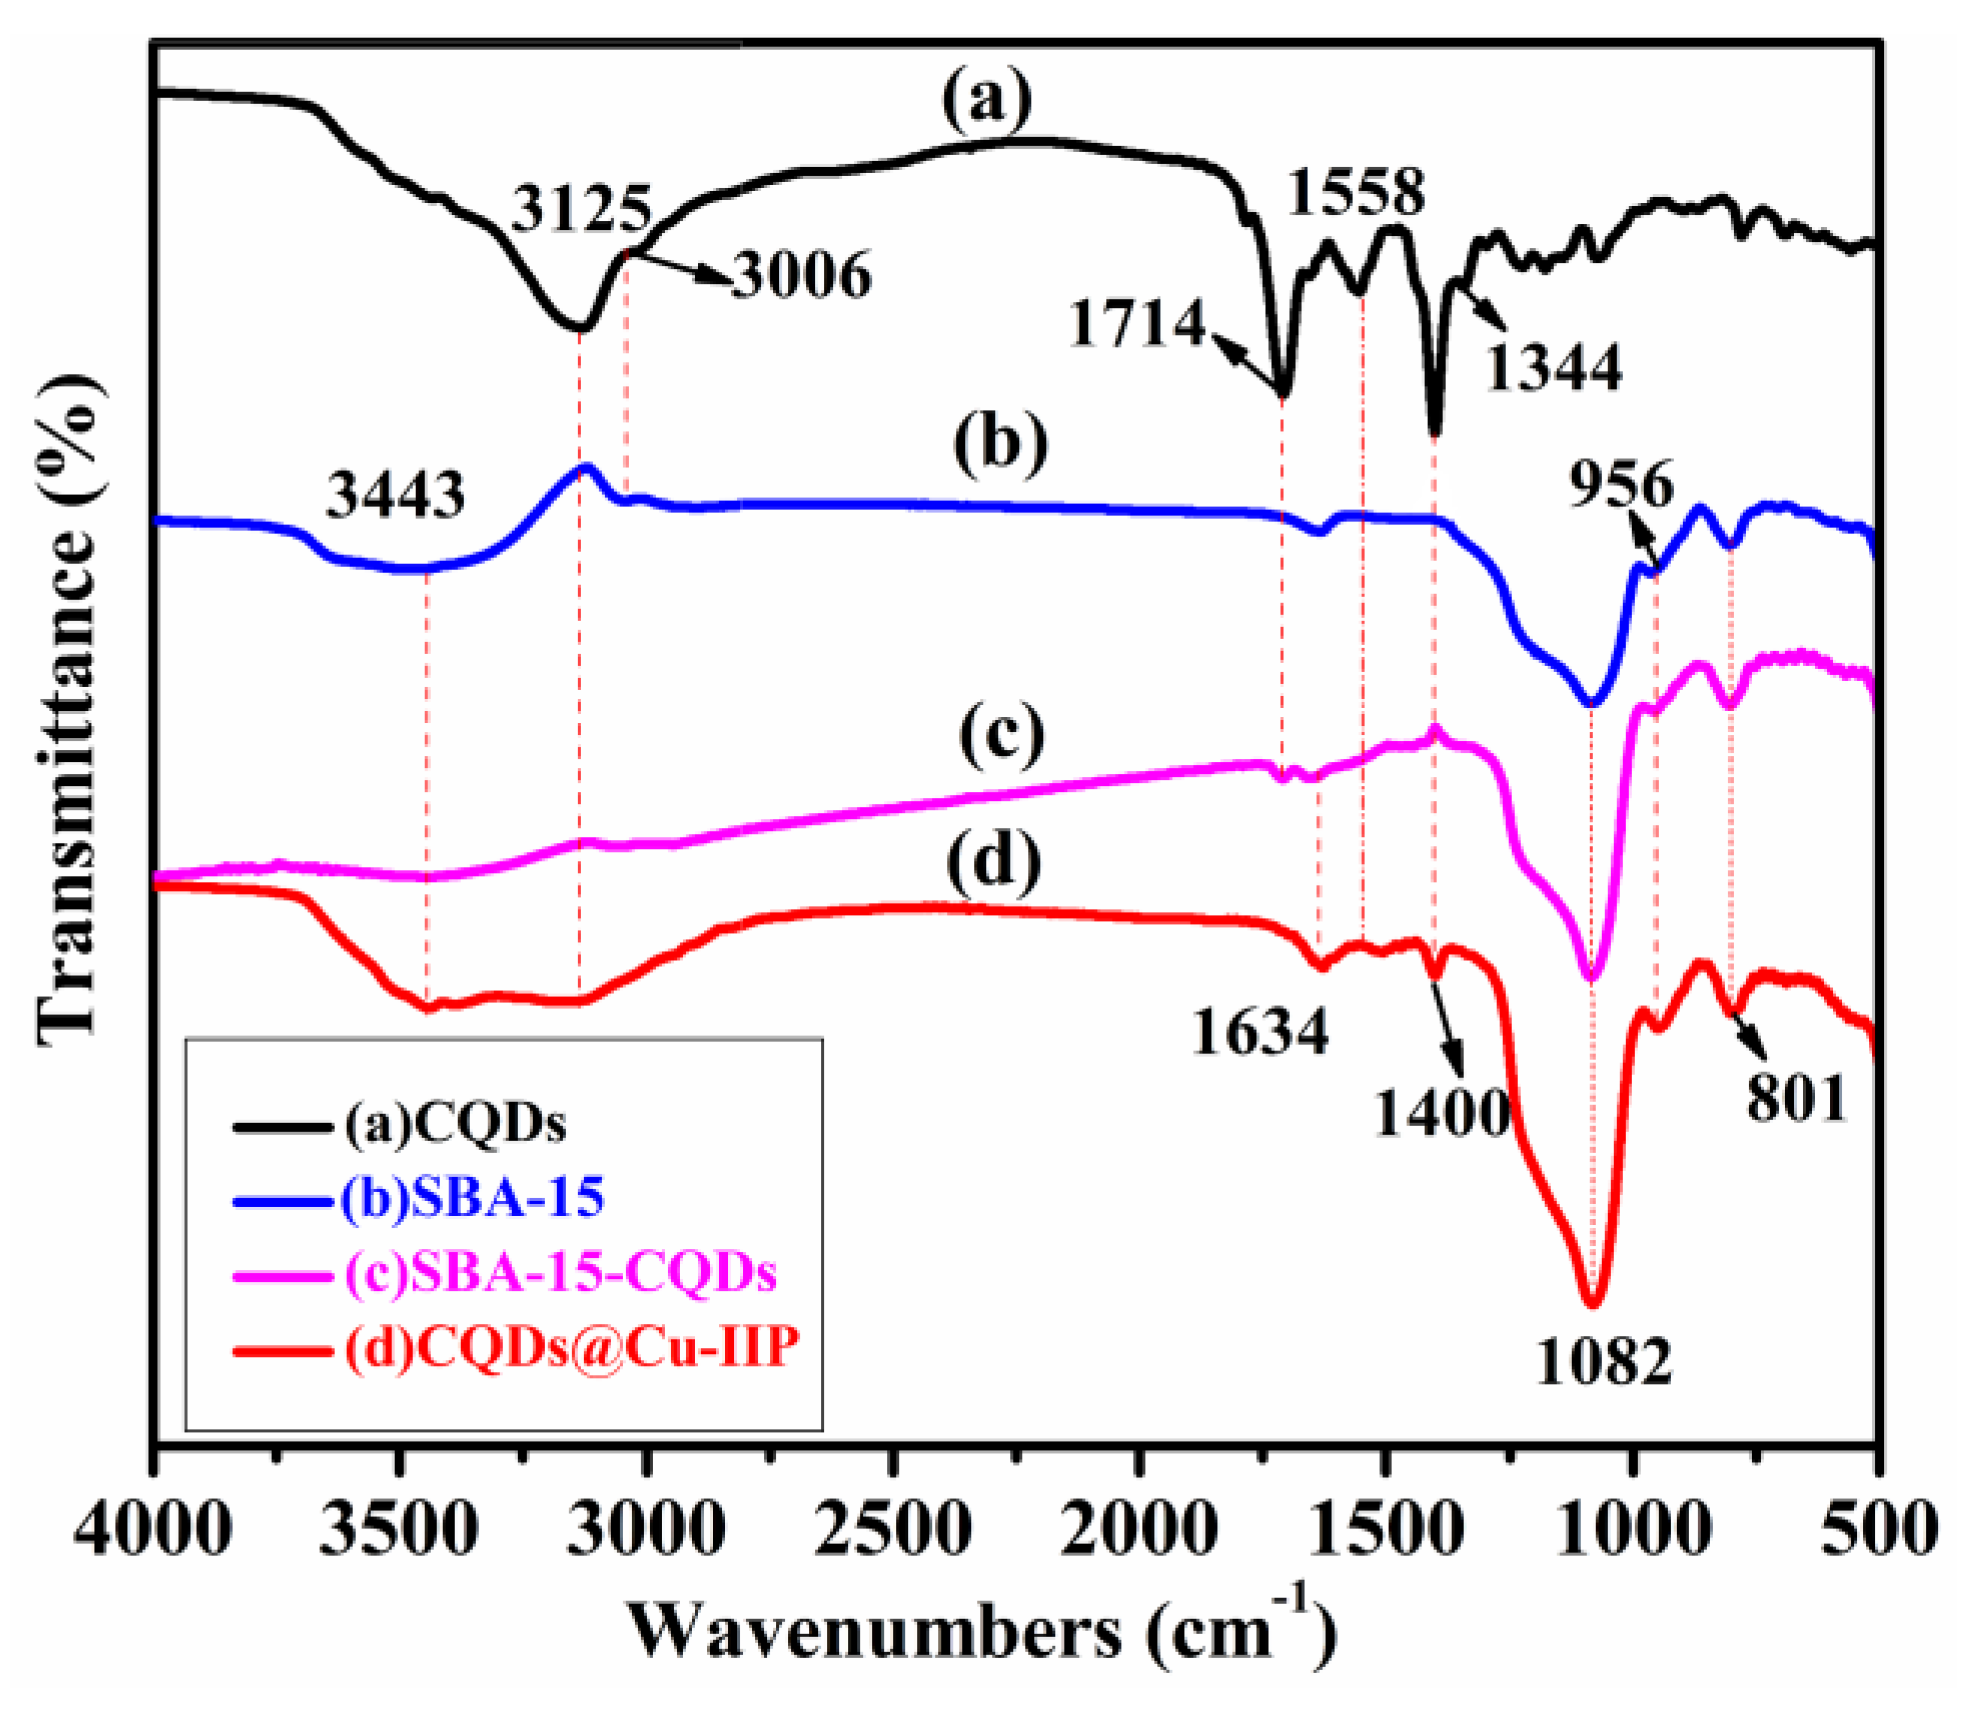
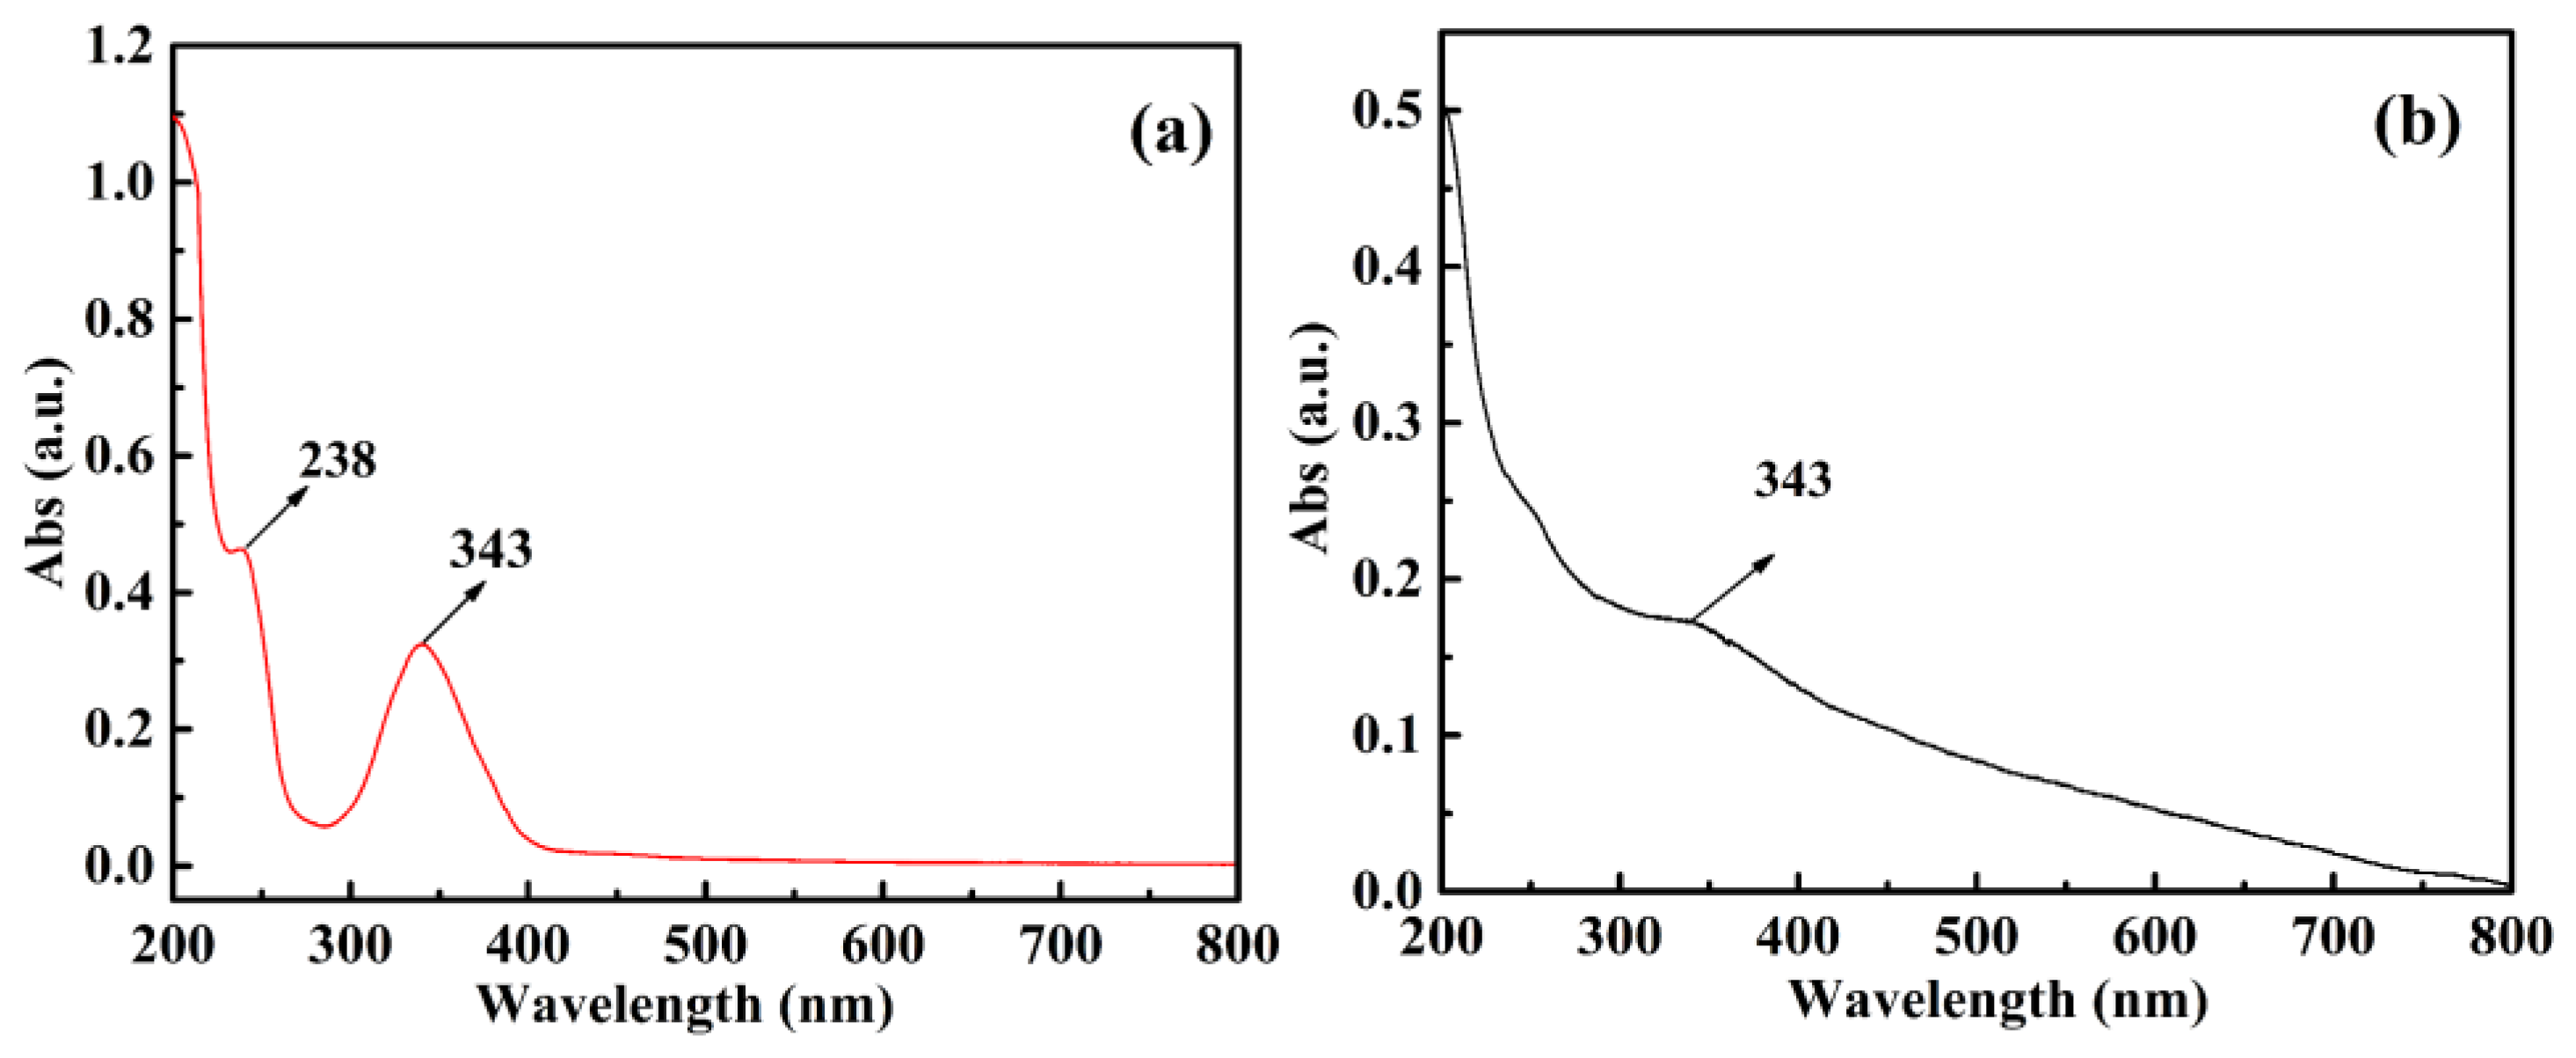
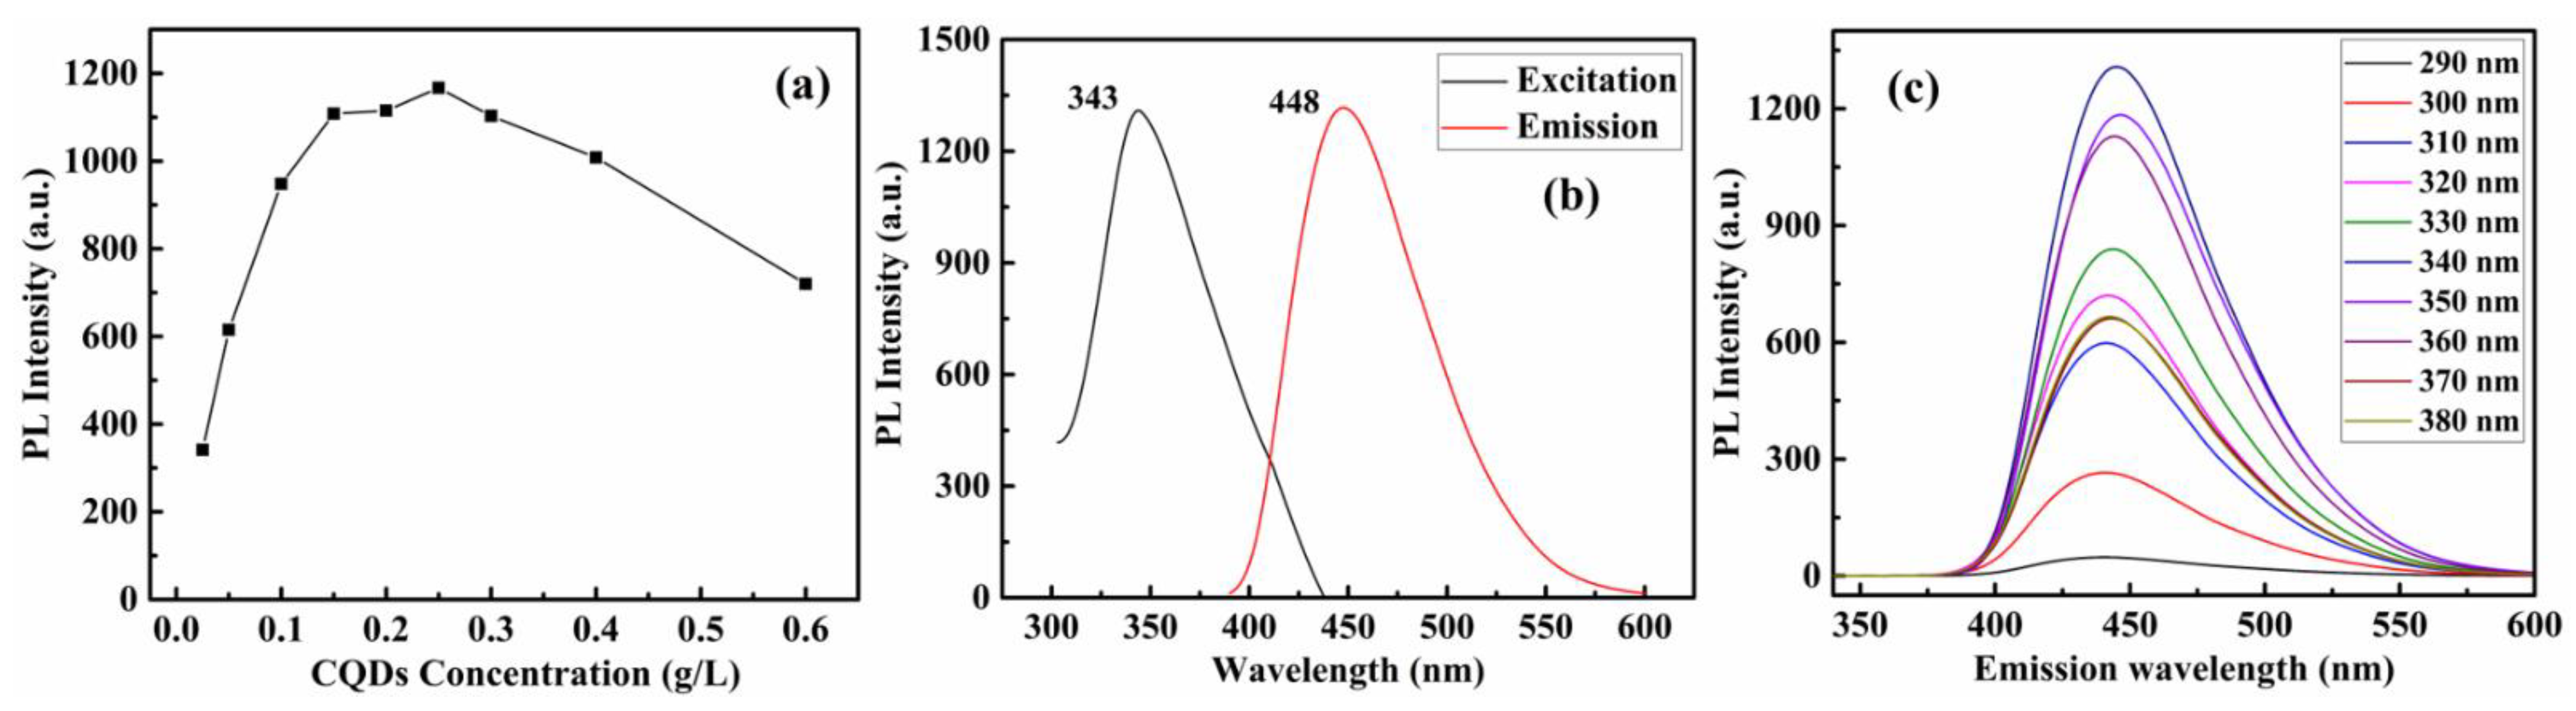
3.2. Physical and Optical Properties of CQDs and CQDs@Cu-IIP

Figure 2 shows the X-ray diffraction patterns of the CQDs, SBA-15-CQDs and CQDs@Cu-IIP. For the CQDs, when the 2θ angle is about 18° and 22°, a distinct broad peak appears, which is related to highly disordered carbon atoms [26]. The peaks correspond to the interlayer spacing d is 0.49 nm, which is slightly longer than the spacing between the (002) planes in bulk graphite (0.34 nm). The increase of the d value indicates the increase of the amorphous nature, attributed to the introduction of more defect sites into the product by increasing the N doping of the crystal lattice [27,28].
FT-IR spectra of the materials are shown in Figure 3. For CQDs (Figure 3a), the absorption peak at 3125 cm−1 represents the stretching vibration of O–H bonds. The peaks at 1714 cm−1 are ascribed to the stretching vibration of C=O [29]. The characteristic absorption bands of C–N and N–H were also observed at 1400 cm−1 and 3006 cm−1, respectively. The absorption peaks at 1558 cm−1 and 1344 cm−1 are due to C=C stretching vibration and C–H in-plane bending vibration, respectively [30]. It can be concluded that the as-synthesized CQDs have numerous hydrophilic groups, such as hydroxyl, carboxylic, and amino moieties [31]. These groups are helpful in enhancing the aqueous solubility of CQDs for further modification. In the spectrum of the synthesized SBA-15 (Figure 3b), asymmetric stretching and symmetrical stretching of Si–O–Si is observed at 1082 cm−1 and 801 cm−1, respectively, and bending vibration of Si–OH and a symmetrical tensile vibration of Si–O–Si are observed at 956 cm−1 and 801 cm−1, respectively [32]. The absorption peak of 1634 cm−1 for SBA-15-CQDs and CQDs@IIP (Figure 3c,d) is caused by the asymmetric C=O vibrations of the amide groups [33].
XPS was used to ascertain the element analysis and functional groups present on the surface. The chemical compositions of the surface of the product of all steps are shown in Table 1. Among them, SBA-15-NH2 contains 4.18% nitrogen, indicating that SBA-15 was successfully aminated. The XPS survey spectrum further illustrates the surface chemical composition of CQDs (Figure 4a). CQDs displayed three predominant strong peaks at 284.6, 399.9, and 532.4 eV, which were ascribed to C1s, N1s and O1s peak, respectively. The contents of carbon, nitrogen and oxygen were calculated to be 67.77%, 11.94% and 20.29%, respectively. As shown in Figure 4b, the C1s spectrum shows five peaks at 284.6, 285.7, 286.8 and 288.1eV, which were assigned to C–C/C=C, C–N, C–O and C=O groups, respectively [34]. The high-resolution spectrum of N1s shows four peaks at 399.3, 400.2 and 401.3 eV (Figure 4c), which were attributed to C–N–C, C–N and N–H groups, respectively [35]. From the O1s spectrum shown in Figure 4d, the two fitted peaks at 531.7 and 533.6 eV were ascribed to C=O and C–OH groups, severally [36,37]. The same analysis was performed on SBA-15-NH2, SBA-15-CQDs, and CQDs@IIP. The surface functional groups and elemental analysis results were shown in Figure 5, Figure 6 and Figure 7. FT-IR and XPS results confirmed that the surface of SBA-15 was successfully modified with APTES, and the imprinted polymer was successfully synthesized.
The morphology of the materials was examined by SEM and TEM. Figure 8a,b shows that the CQDs were highly dispersive and microspherical particles in the range of 4–8 nm in size. As seen in Figure 8c image, transmission electron micrographs of SBA-15 molecular sieves can clearly observe the long-range ordered structure of mesoporous substrates. The diameter of the pores is about 9 nm, which is consistent with the literature [38,39]. Figure 8d shows SBA-15-CQD of SEM image, the material has a rod-like morphology and a certain degree of agglomeration, which may be caused by the amidation reaction of carbon quantum dots with two or more SBA-15 surface groups. The SEM image of CQDs@Cu-IIP is shown in Figure 8e, and the rod-like morphology of the SBA-15 is maintained, indicating that the modification and imprinting processes occur on the surface of the base material without causing deformation of the base structure. The pore structure of SBA-15 is difficult to observe in Figure 8f, indicating that the pores have been covered or are occupied by the CQDs. From the TEM image of the CQDs@Cu−IIP, the IIP shell (the lighter edge region) is clearly visible, and the approximate thickness of the IIP coating is calculated to be 50 nm.
To explore the optical properties of the materials, UV-Vis absorption and FL spectra were studied at room temperature. The UV–Vis absorption spectrum of CQDs and CQDs@Cu−IIP were shown in Figure 9. For CQDs, the sharp absorption peak at 238 nm is assigned to the π–π* transition of C=C bonds in the aromatic ring, and the peak at 343 nm is assigned to the n–π* transition of C=O bonds [29]. Compared with the bare CQDs, the absorbance of CQDs@Cu-IIP at 343 nm is lower that may be due to the reduction of carboxyl groups on the surface of CQDs after the polymerization process.
The fluorescence intensity of CQDs with different concentrations is shown in Figure 10a. It is found that when the concentration of CQDs is greater than 0.25 g/L, the fluorescence of CQDs will be decline which is caused by the inner filter effect. The 0.25 g/L CQDs is used in the subsequent fluorescence detection, where the fluorescence intensity is close to the maximum. Figure 10b shows the fluorescence excitation and emission spectra of CQDs aqueous solution. From the excitation spectrum, it can be seen that the maximum fluorescence excitation wavelength of CQDs is 343 nm which is consistent with the result of UV–vis absorption spectrum. When excited at 343 nm, the maximum fluorescence emission wavelength of CQD is 448 nm. Thus, an excitation wavelength at 343 nm was used in further experiments. To further investigate the optical properties, FL emission spectra of the CQDs were recorded at various excitation wavelengths. As shown in Figure 10c, the FL spectra presented a representative excitation wavelength-independent characteristic. The emission wavelength of CQDs does not red shift or blue shift with the change of excitation wavelength. This may be related to the uniform size of the prepared CQDs. Under the irradiation of 365 nm ultraviolet light, the CQDs solution turned bright blue, and the quantum yield (QY) of CQDs was calculated to be about 79%.

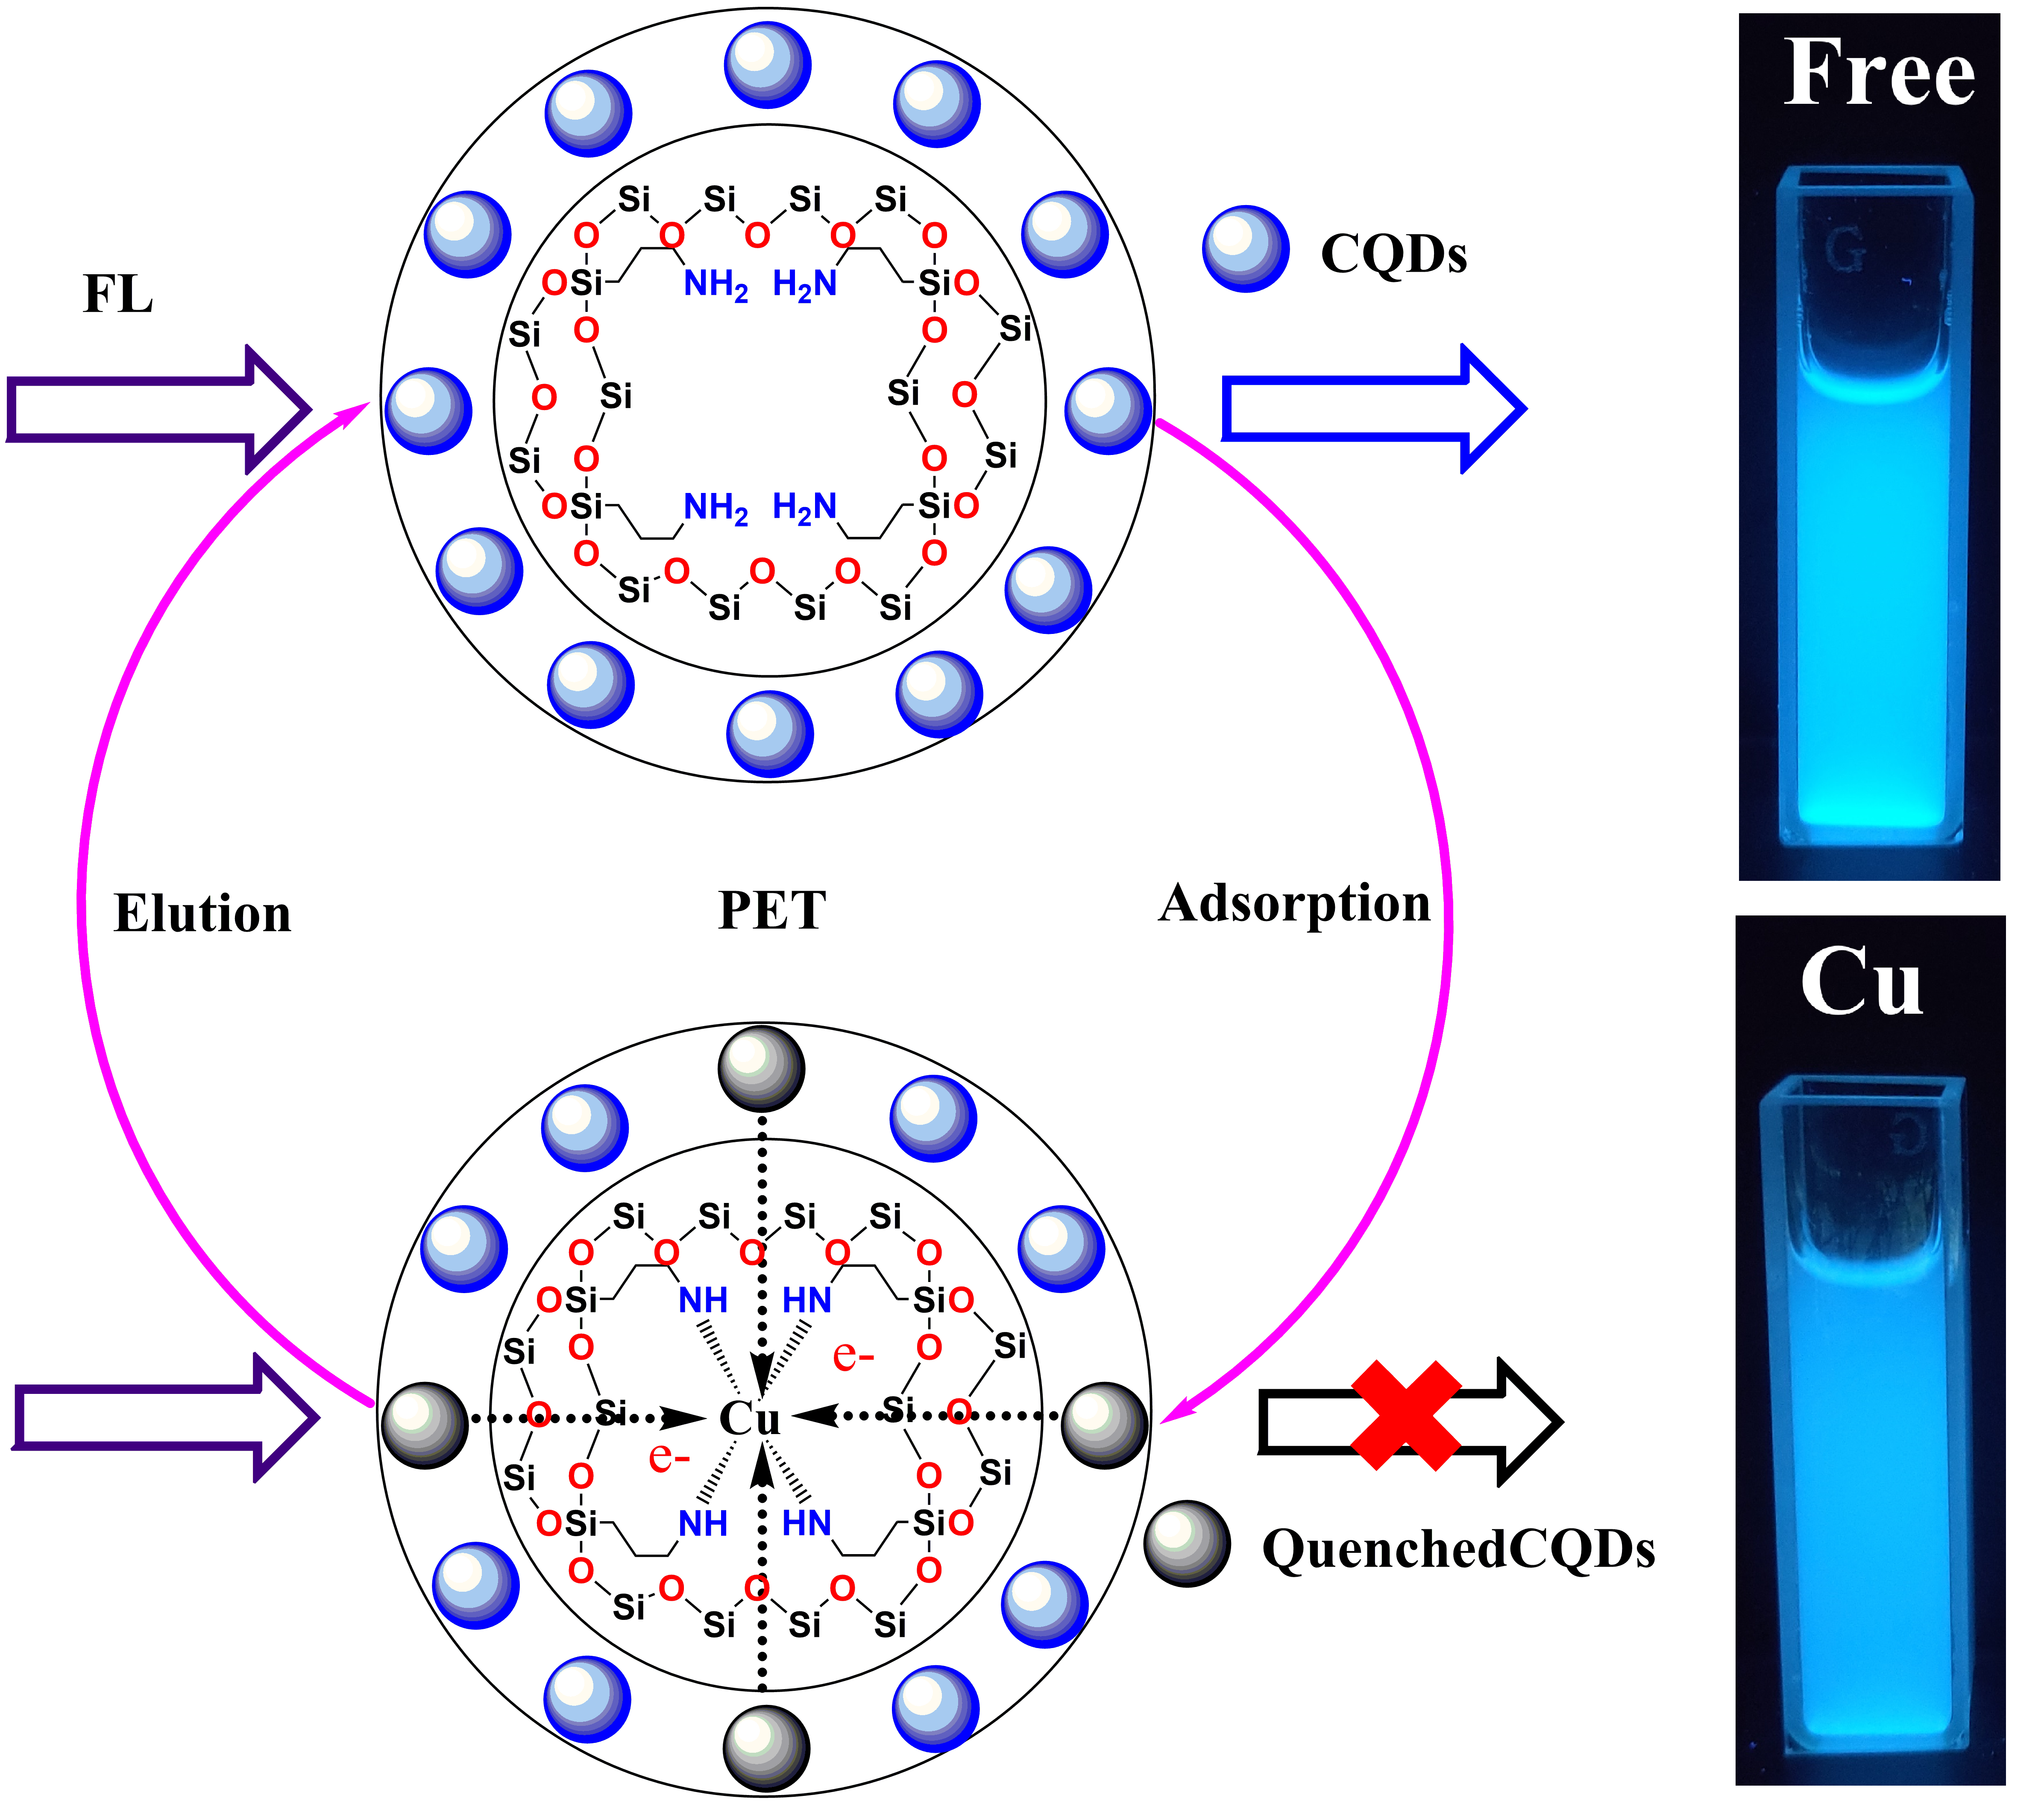
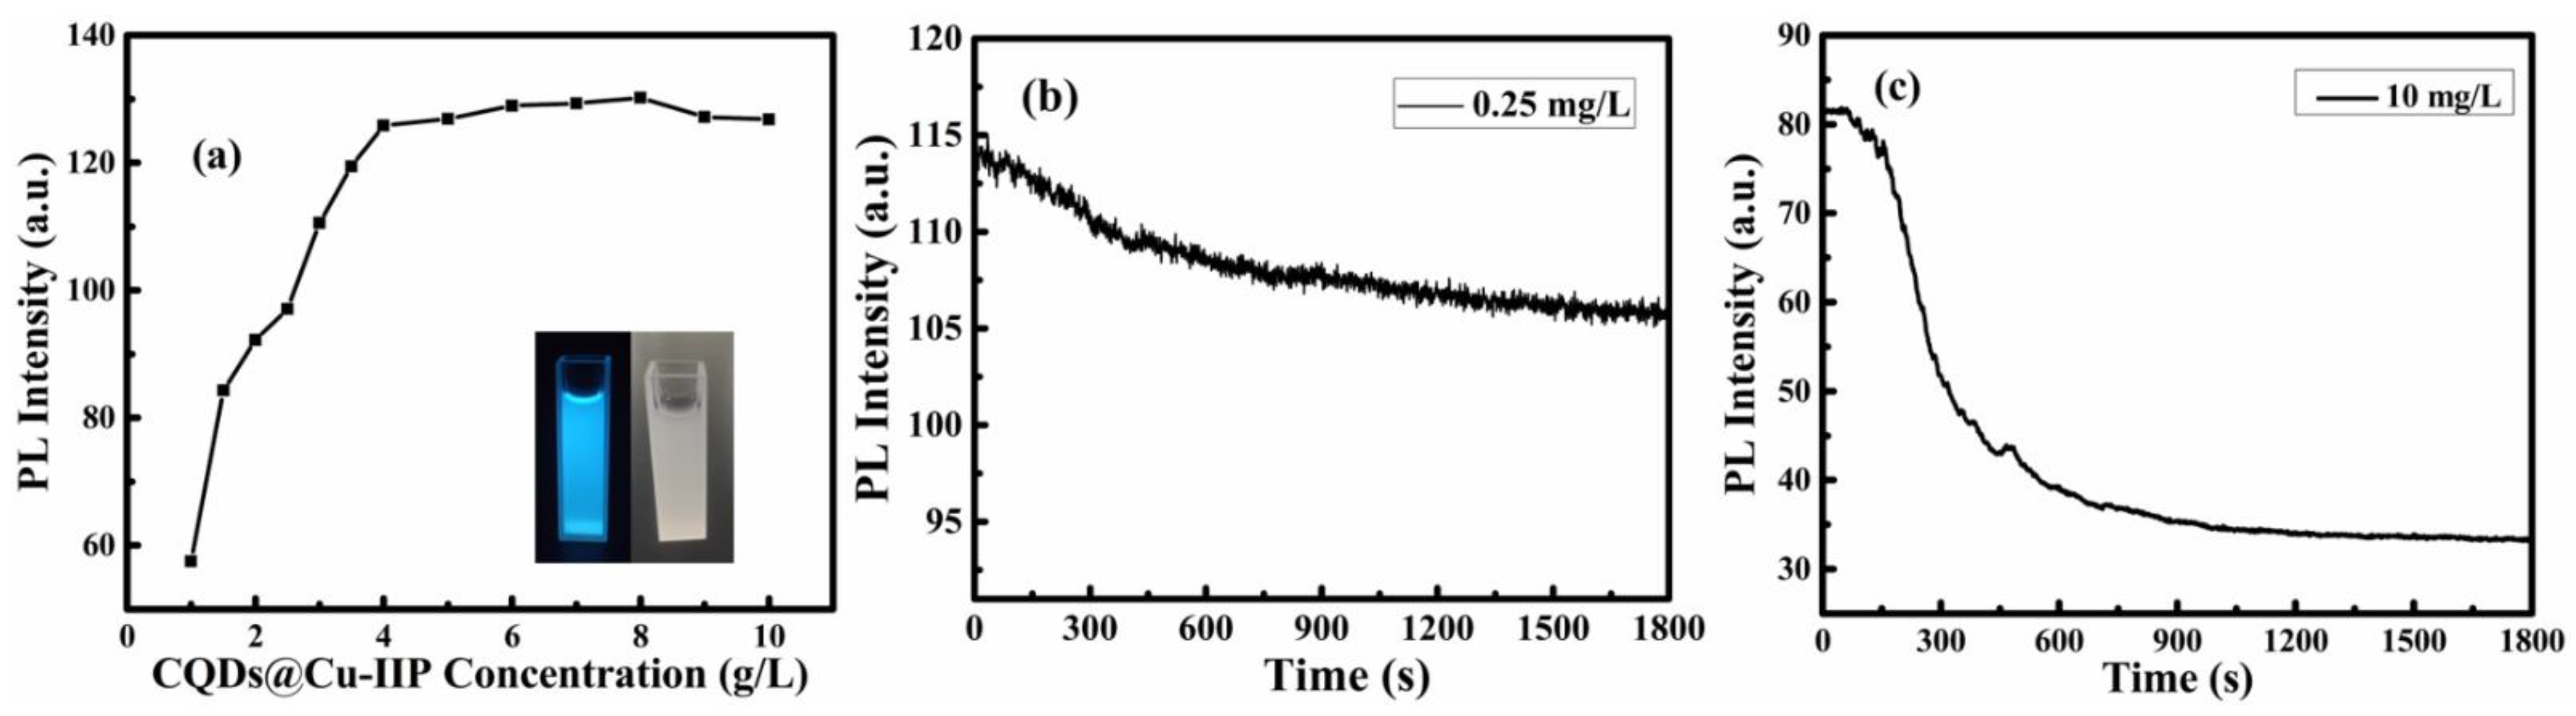
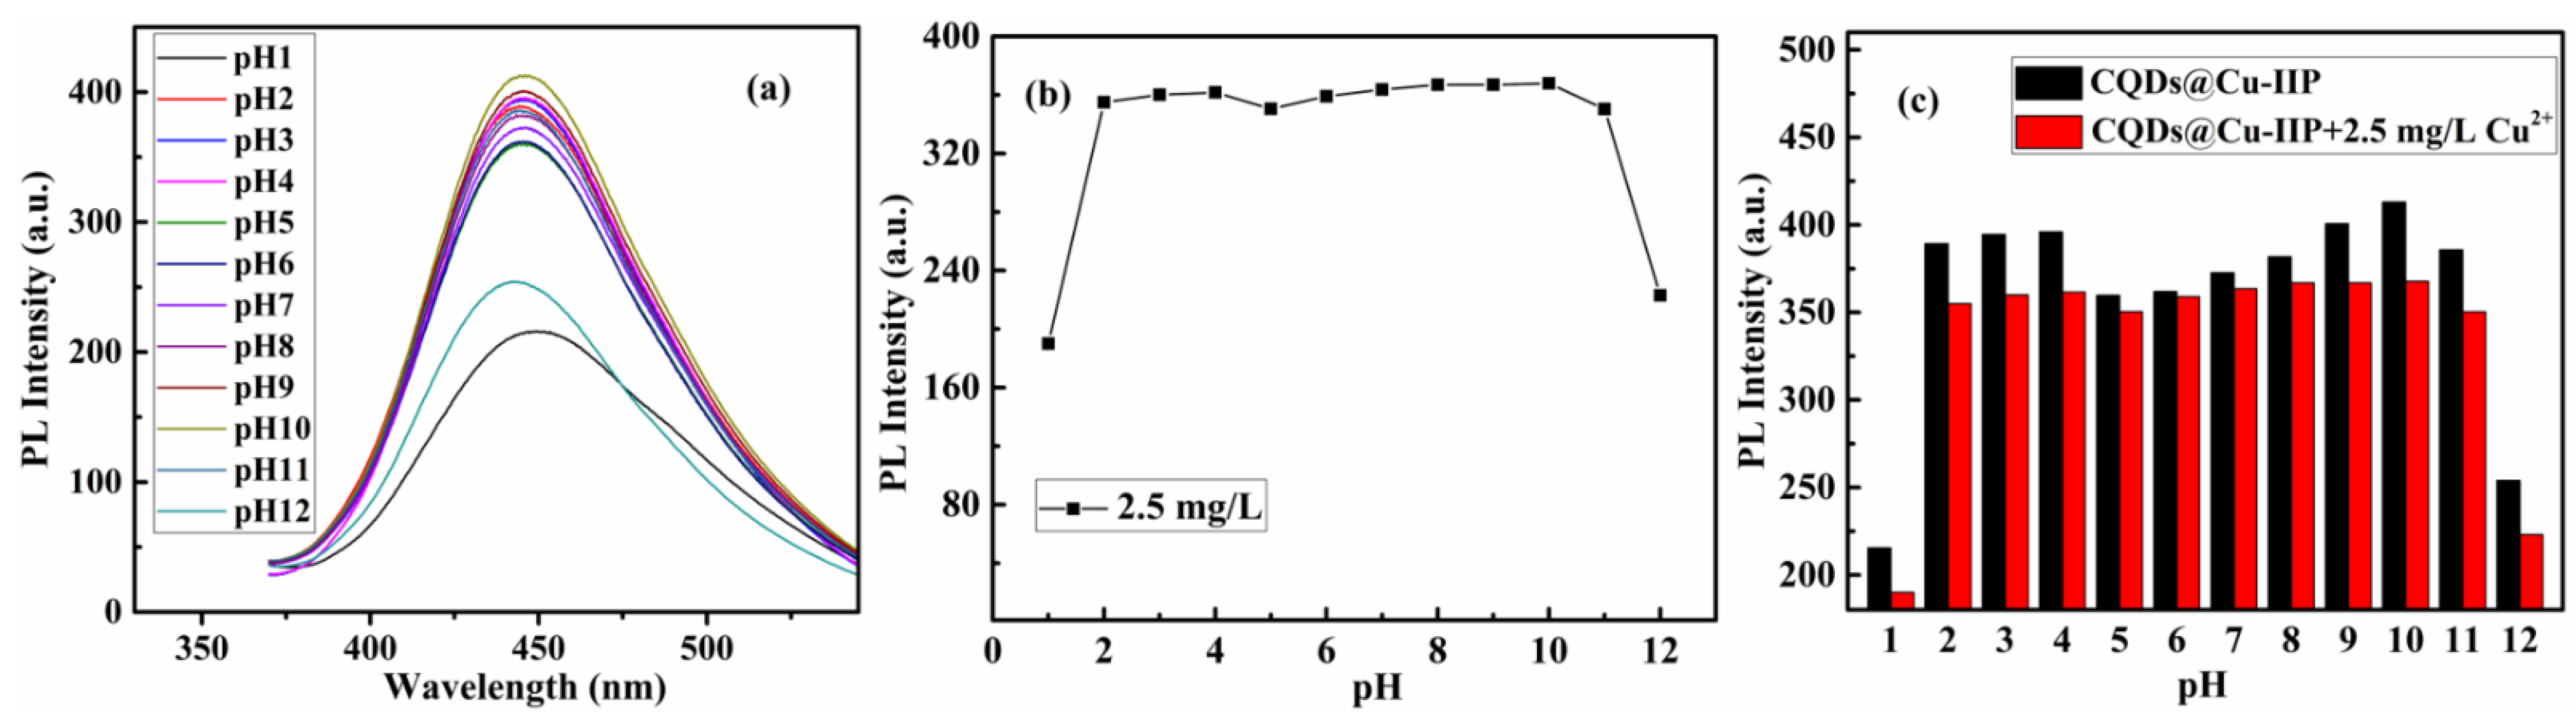
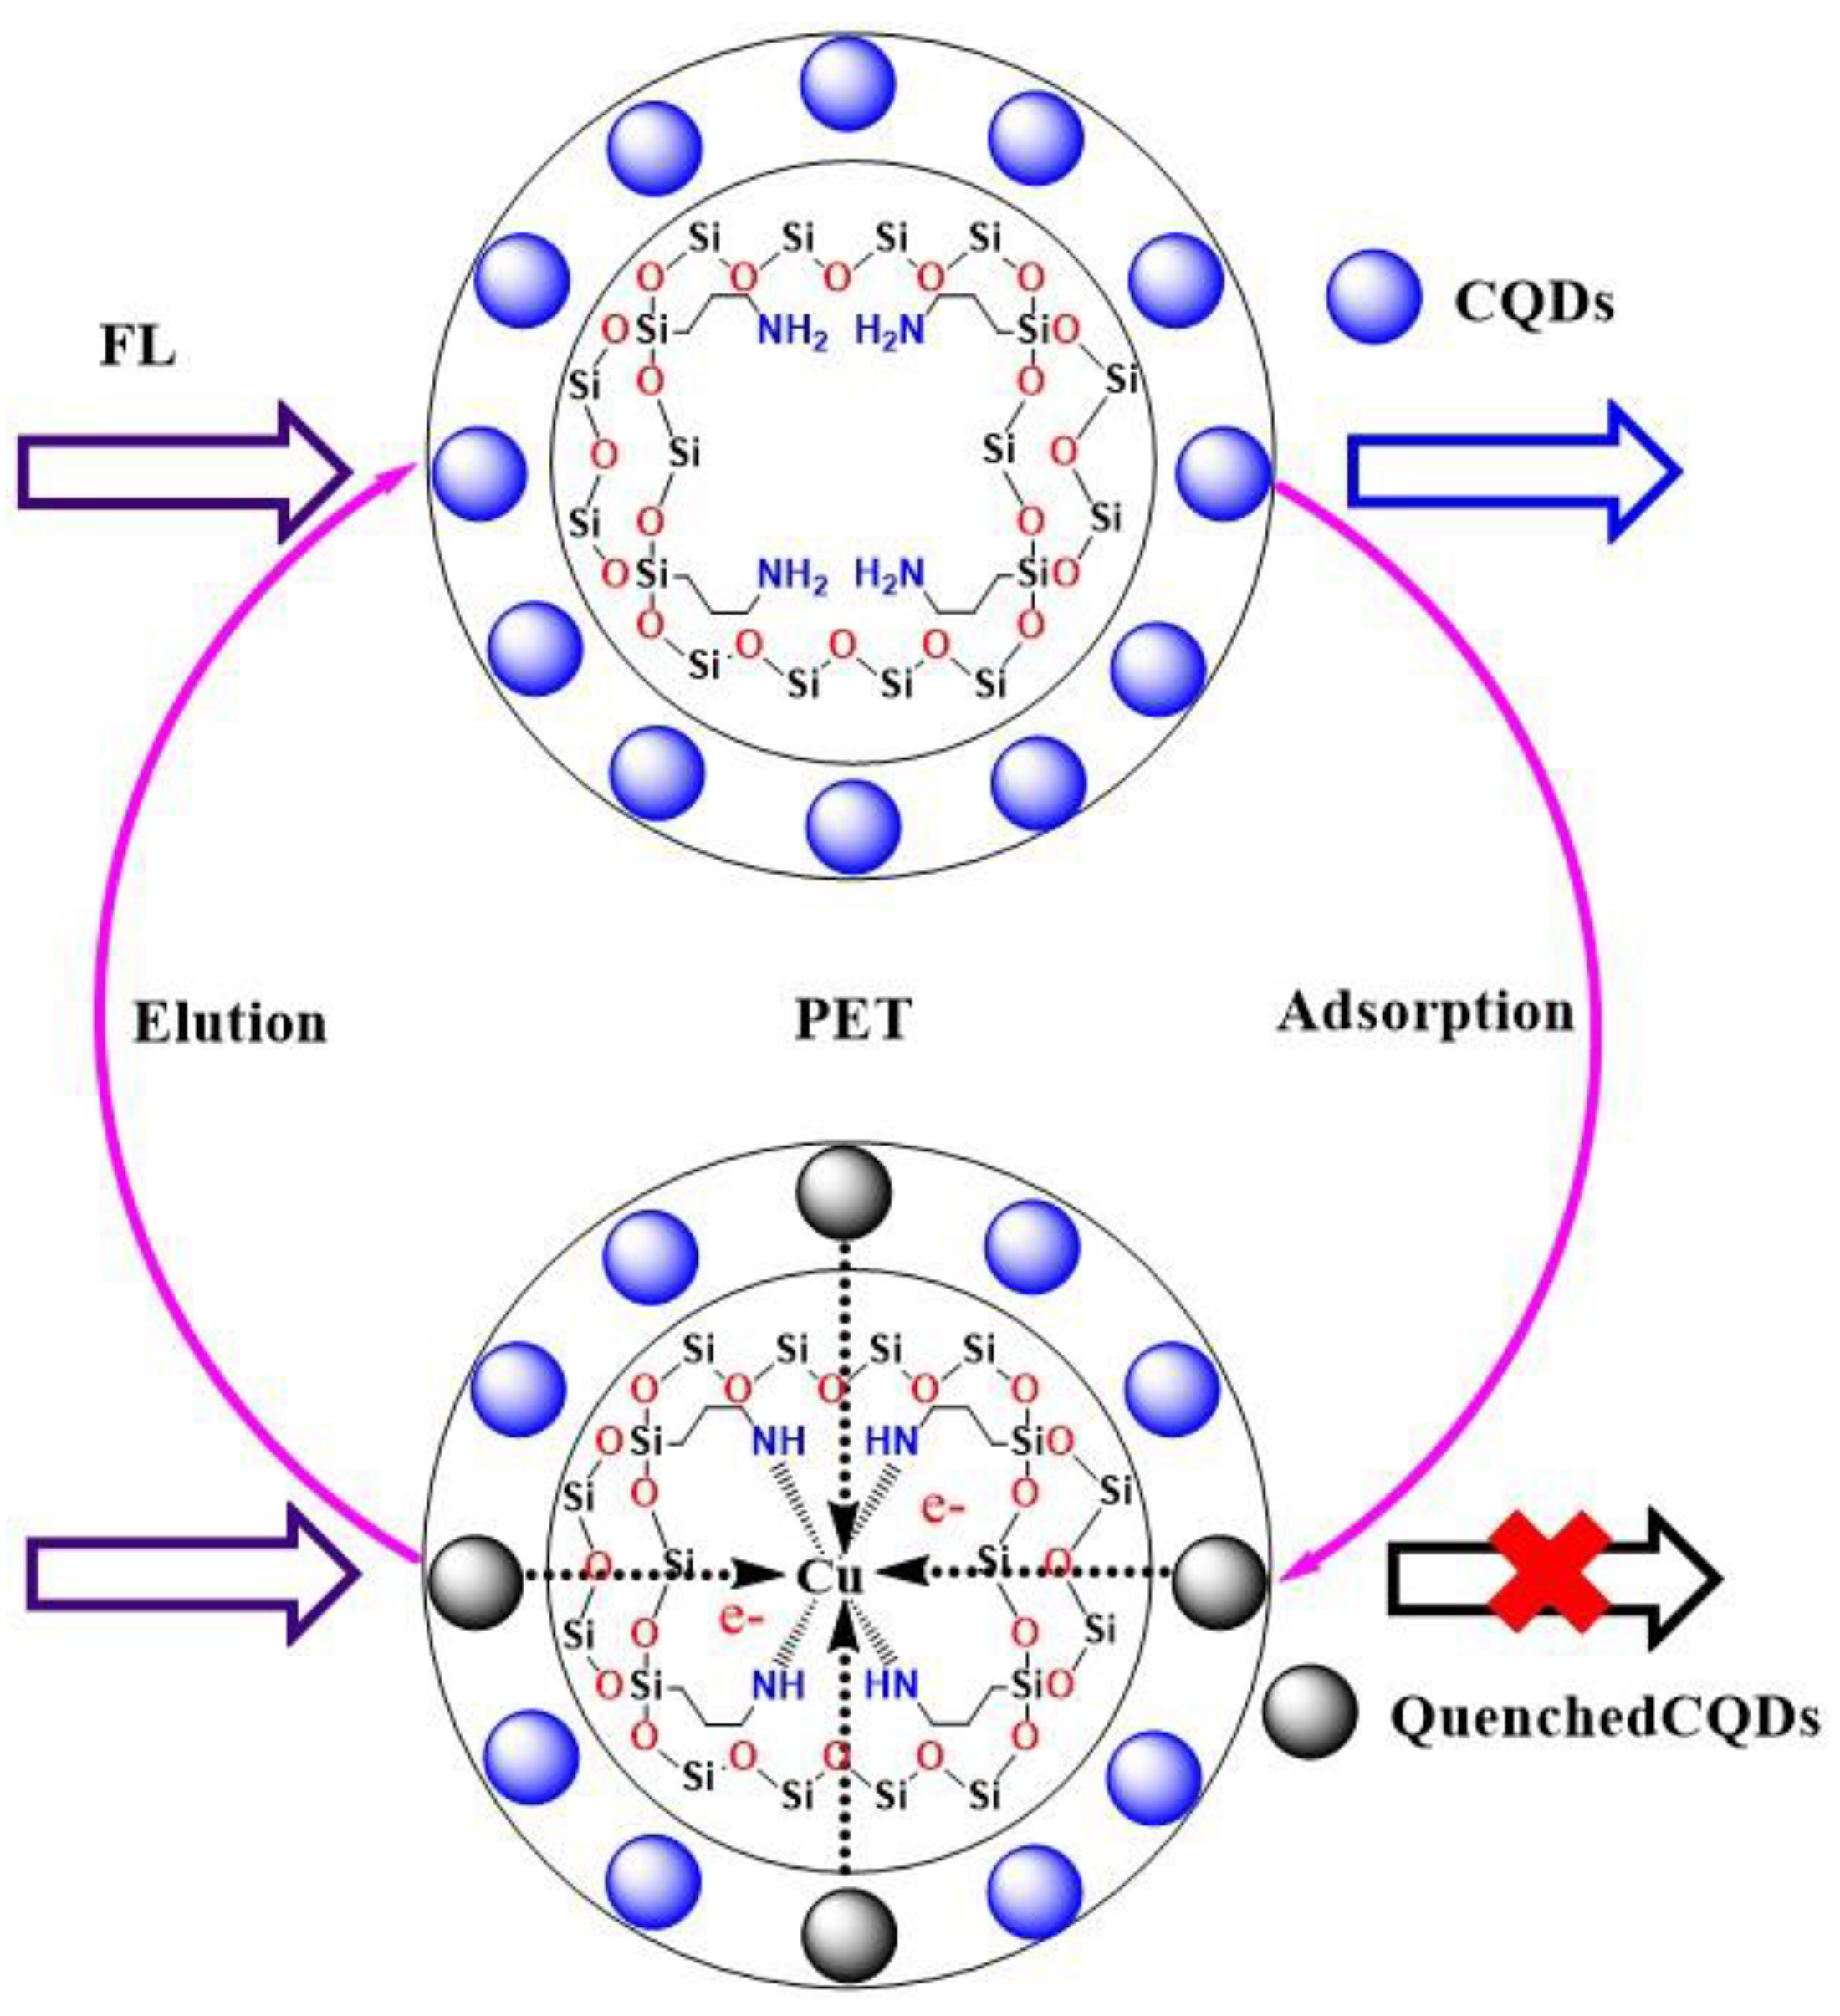
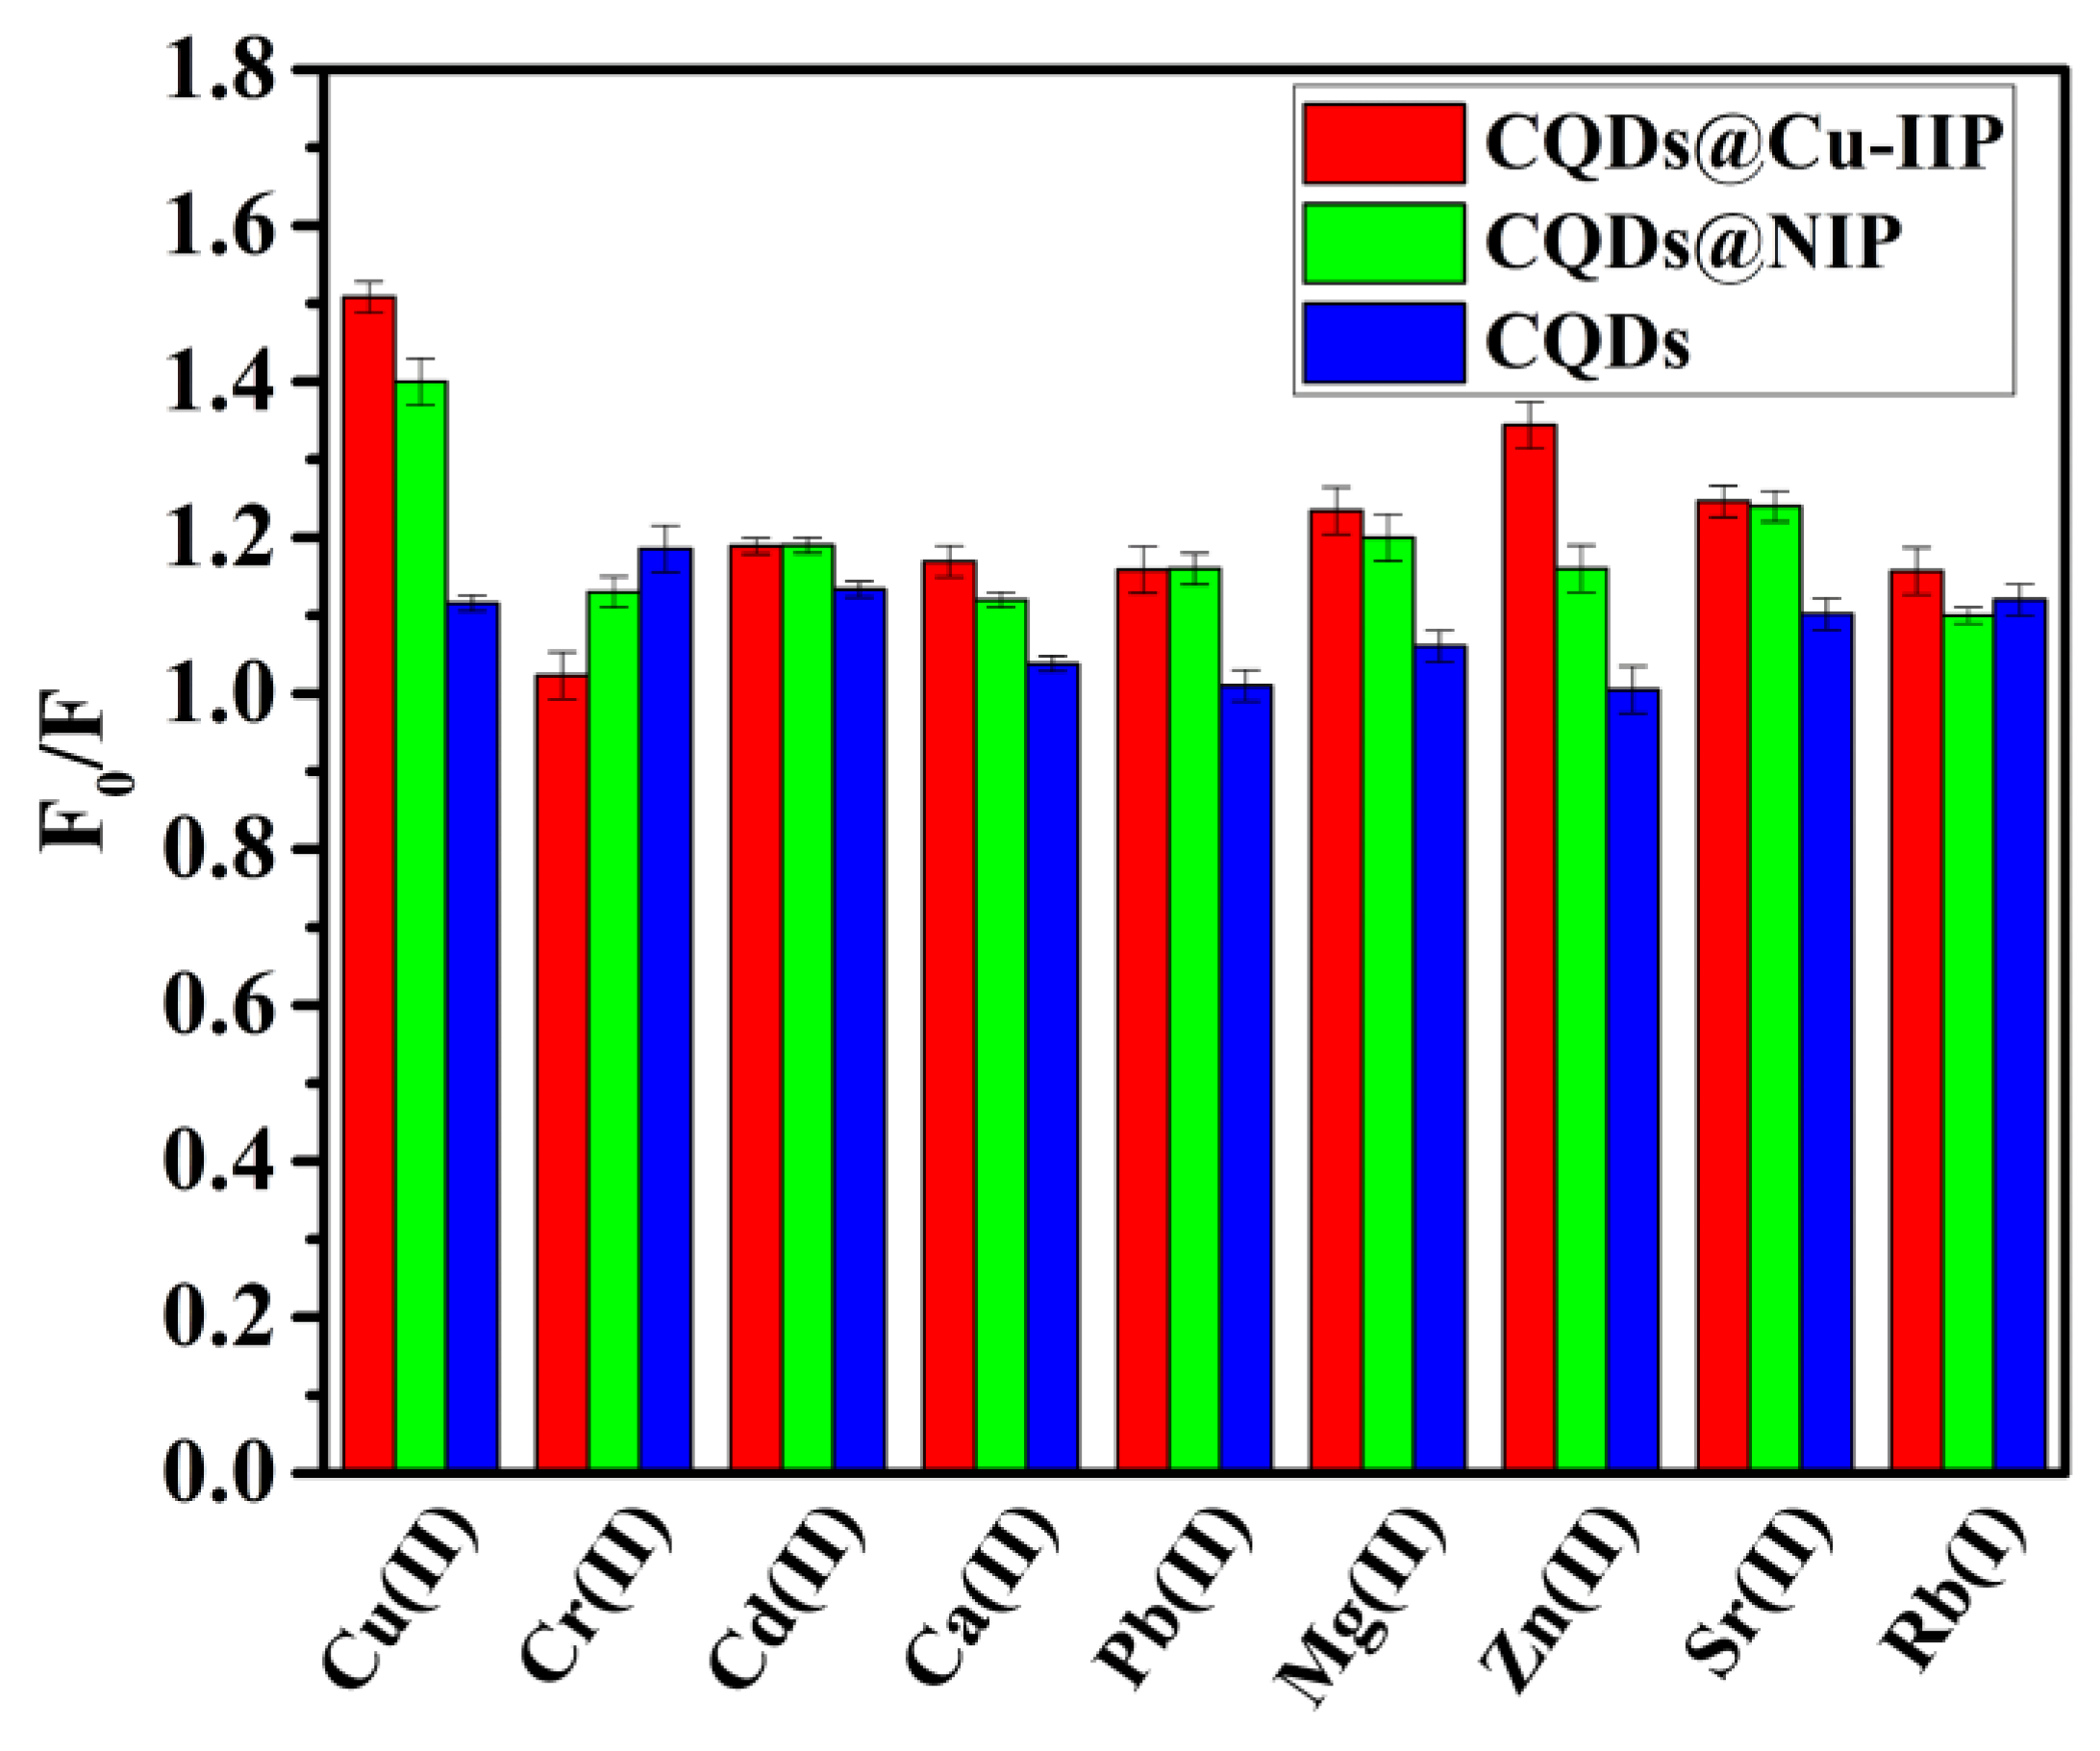
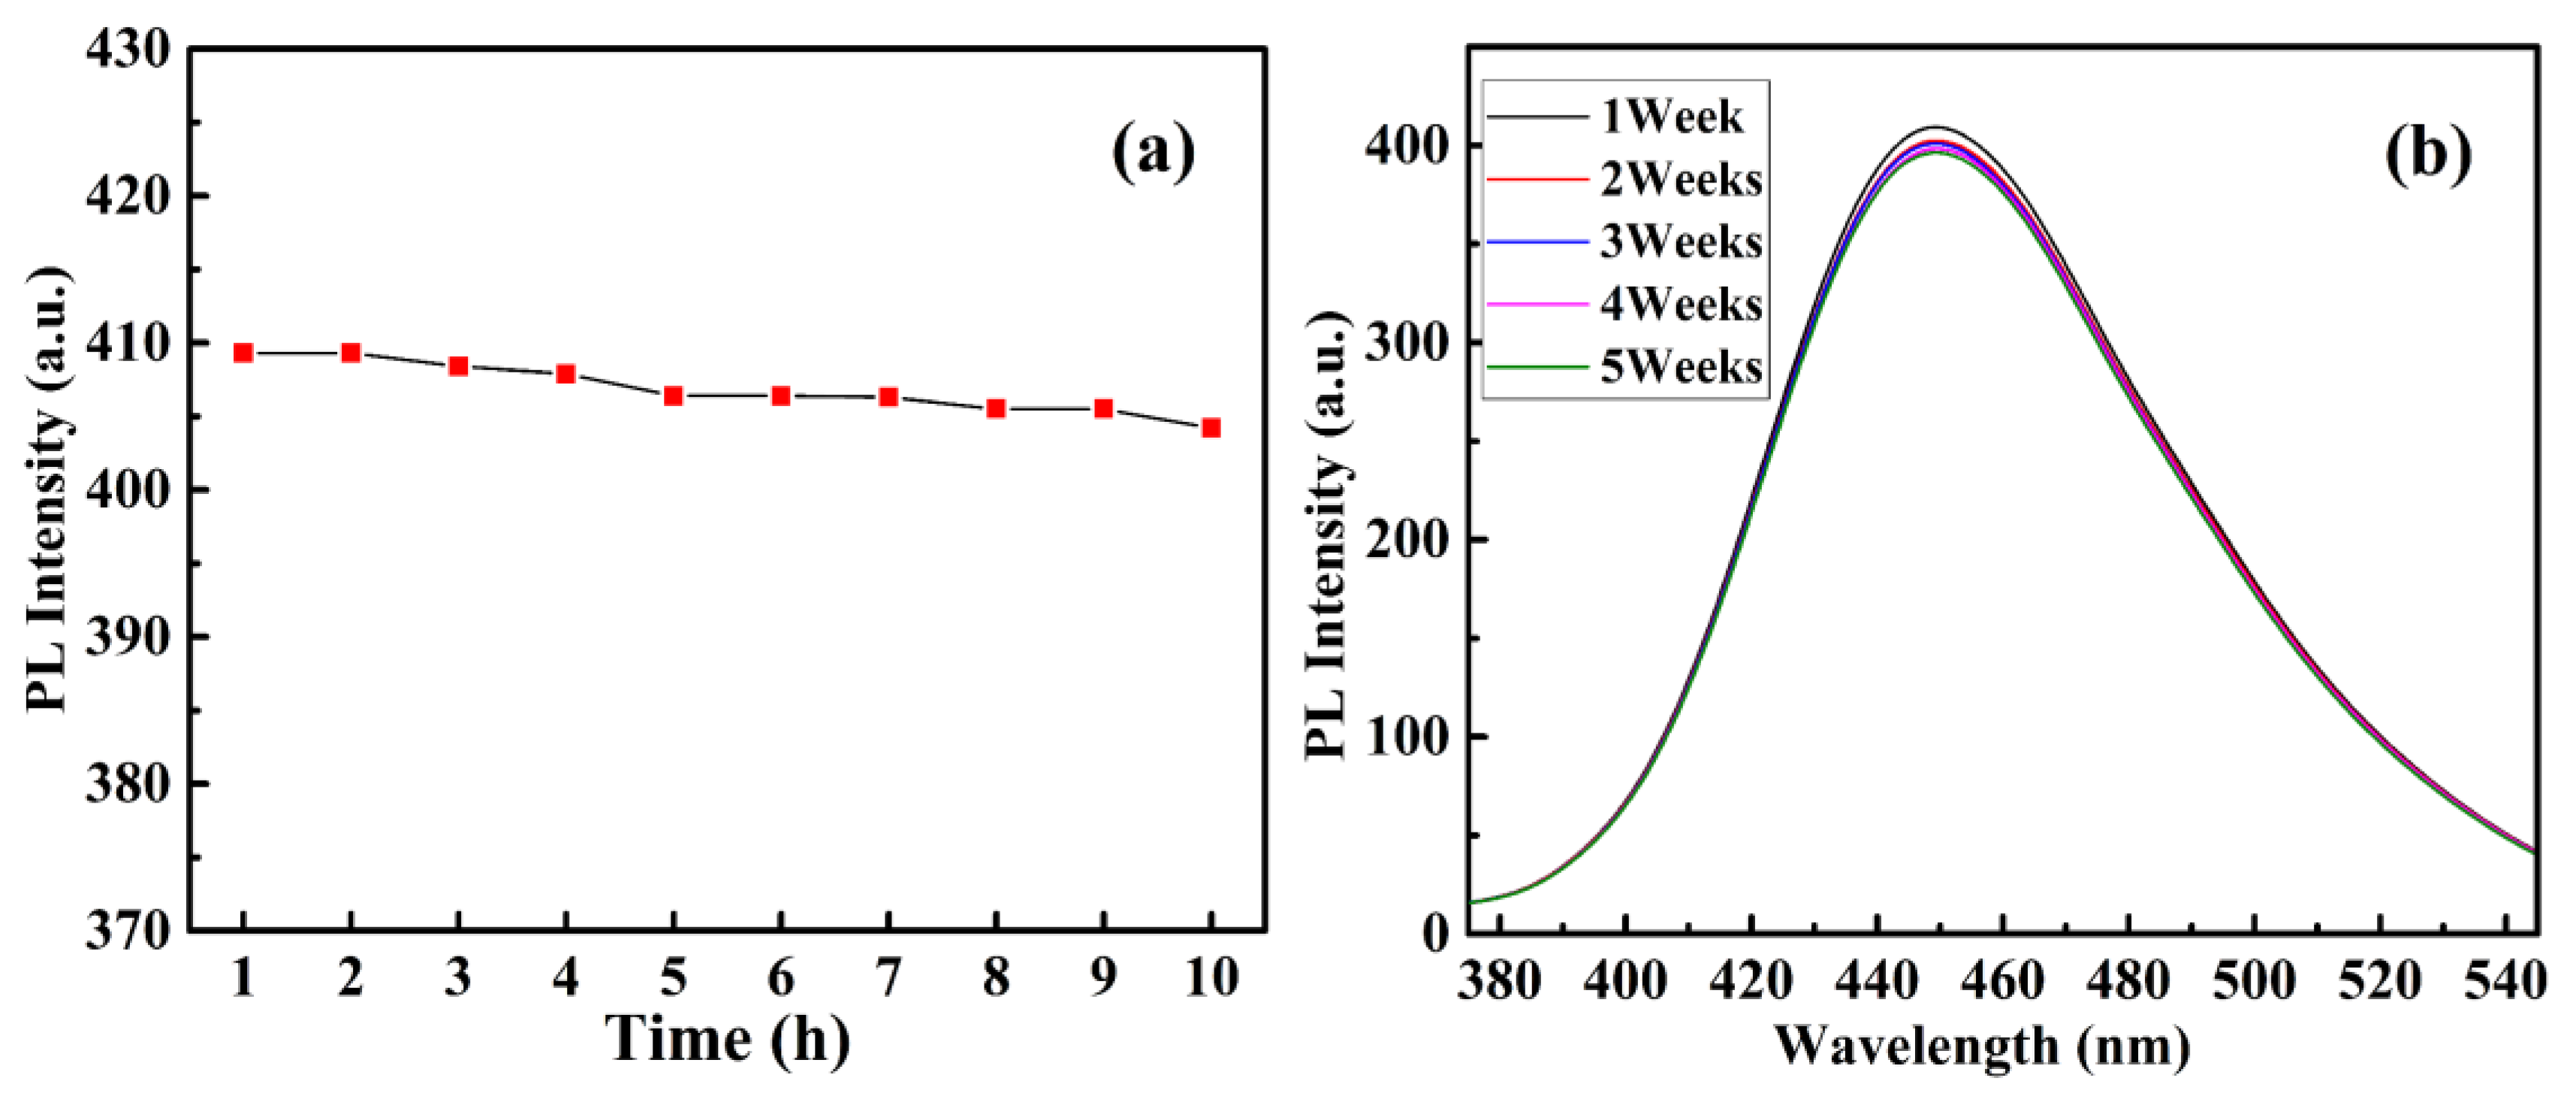
3.3. CQDs@Cu-IIP Sensing Properties

The effects of different reactive conditions (the concentration, reactive time and pH) on the detection of Cu2+ were investigated to achieve excellent sensitivity. The concentration of the ion-imprinted polymer in the detection system plays an important role in the detection range and sensitivity. The effect of concentration is illustrated in Figure 11a. When the concentration reaches 4 g/L, the intensity plateaued and did not significantly increase beyond 4 g/L. Therefore, in the next experiment, the concentration of CQDs@Cu−IIP was set at 4 g/L.
Reaction time is also an important factor in fluorescence detection. We study the effect of contact time on fluorescence intensity at two different copper ion concentration conditions (10 mg/L and 0.25 mg/L). As shown in Figure 11b,c, the fluorescence intensity of both solutions decreased with the increase of time, and the fluorescence intensity stabilized at 13–15 min. This is consistent with the adsorption equilibrium time of most reported ion-imprinted polymers [40]. Reliably, this indicates that the fluorescent material has application prospects in the rapid detection of copper ions. Therefore, in the following experiments, the reaction time of CQDs@Cu-IIP with Cu2+ ions is controlled to 15 min.
The pH of an aqueous solution is one of the important parameters affecting molecular affinity. We studied the fluorescence intensity of CQDs@Cu-IIP at different pH levels ranging from 1 to 12 to determine the optimum pH during the assay. The effect of the pH of the reactive solution is depicted in Figure 12a. The fluorescence intensity of CQDs@Cu-IIP under alkaline conditions is higher than under acidic conditions. In addition, when the pH of the solution is less than 3 or higher than 10, the fluorescence is low, and when the pH is 10, the fluorescence intensity of the solution reaches a maximum. Due to the low concentration, it will not affect the measurement of copper ions when the pH of the solution is 10. Moreover, the influence mechanism of the pH was further studied. In acidic conditions, CQDs agglomerate under the action of hydrogen bonds and protonation, causing fluorescence quenching of the CQDs. In addition, as there are many carboxyl and hydroxyl groups on the surface of CQDs, when the pH of the aqueous solution increases, the H+ of the CQDs combines with OH– and becomes H2O. In addition, the results of the probe’s sensing performance for copper ions at different pH values are shown in Figure 12b. In the range of pH 3–10, the probe’s responsiveness to copper ions can maintain excellent stability. The results show that the probe can achieve quantitative detection of copper ions in a wide pH range. To clearly identify the optimum pH, the results of the comparison between Figure 12a,b have been shown as a column chart in Figure 12c. It can be seen that the probe exhibits maximum fluorescence quenching when the pH is 10.
Under the current research conditions, the capability of the CQDs@Cu-IIP for the quantitative determination of Cu2+ was further studied based on fluorescence quenching due to Cu(II). During the sensing process, copper ions were strongly absorbed by CQDs@Cu-IIP due to specific recognition sites and coordination bond interactions between copper ions and amino groups [23]. The zeta potential of CQDs dispersed in the aqueous solution is −7.39 mV. When CQDs carrying negative charges are excited, copper ions act as electron acceptors and cause the photo-induced Electron Transfer (PET) effect of CQDs. So as shown in Figure 13, the CQDs are difficult to excite, causing a fluorescence quenching phenomenon.

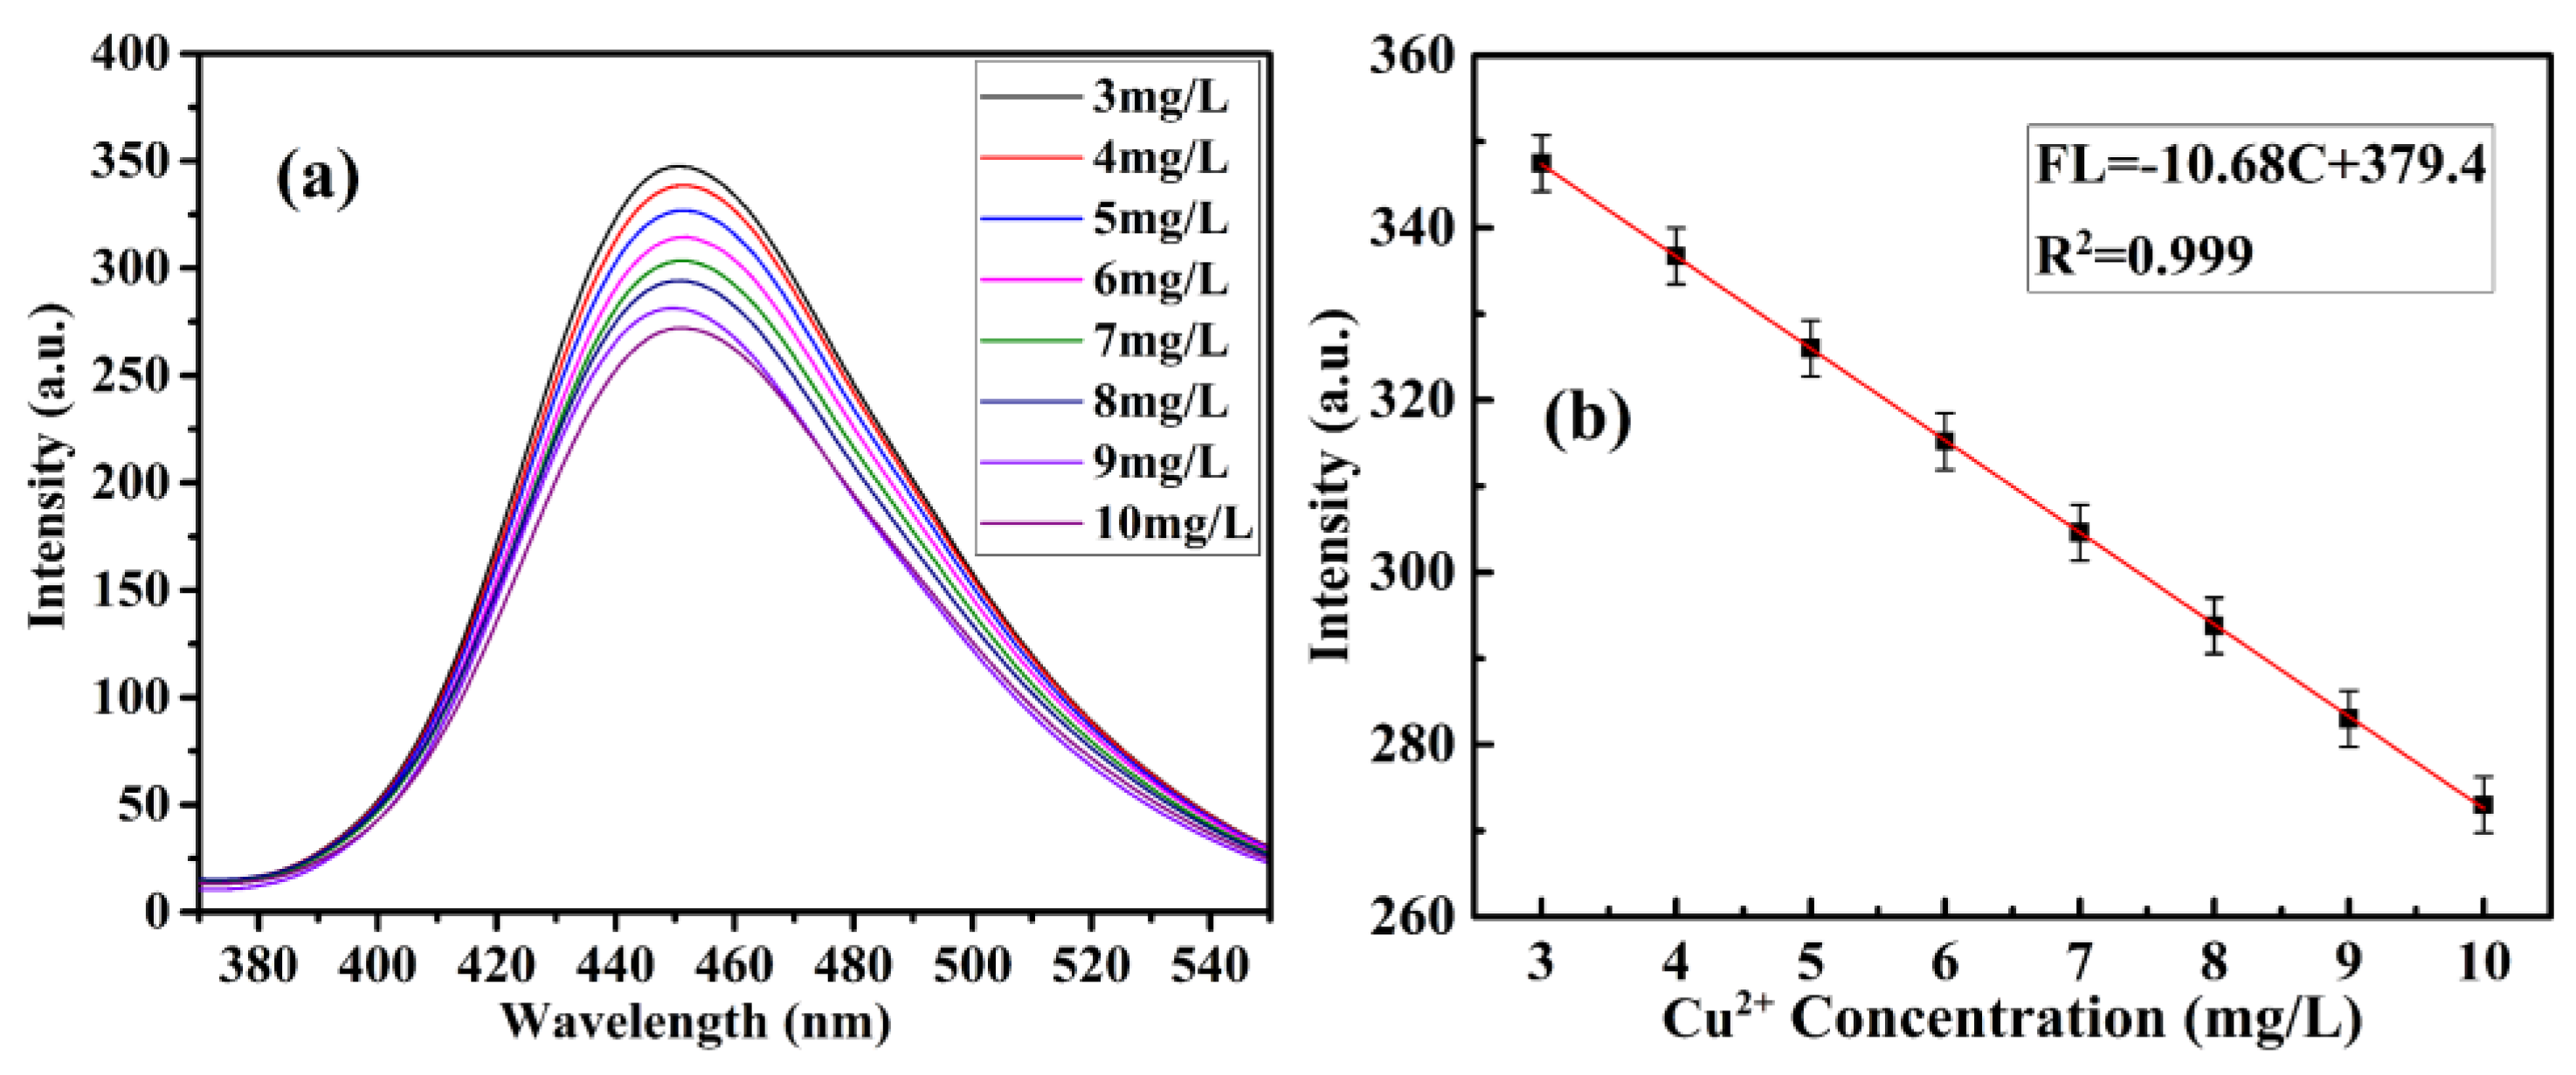
3.4. Fluorescence Detection of Cu(II) ion by CQDs@Cu-IIP

To realize the ion detection function of CQDs@Cu-IIP, they were added to a series of different concentrations of copper ion solutions to detect the fluorescence quenching condition based on the change of fluorescence intensity after the addition. The fluorescence intensity versus the Cu2+ concentration was plotted. Using this curve, the Cu2+ concentration of an unknown solution can be detected, and the detection limit of copper ions by CQDs@Cu-IIP can be calculated. The fluorescence of CQDs@Cu-IIP was effectively quenched by Cu2+ ions at different concentrations, as shown in Figure 14 and Figure 15. The quenching efficiencies were fitted by the following two linear equations, in which the equation of FL = −18.51C + 411.6 (R2 = 0.998) was suitable for low-level determination (0.25–2 mg/L), whereas FL = −10.68C + 379.4 (R2 = 0.999) was suitable for high level determination (3–10 mg/L). The detection limits of Cu2+ ions were estimated to be 0.016 and 0.028 mg/L. The two fitting slopes represent the different quenching speeds of the probe at different copper ion concentrations.
In addition, we compared the properties of our probe with some previously reported sensors, and the results were listed in Table 2. By combining CQDs and Cu-IIP, the sensing performance of the probe can be improved, and the most prominent is that the detection range of copper ions is greatly improved.
To study the CQDs@Cu-IIP fluorescence sensor selectivity, the influence of common interference ions such as Cr2+, Cd2+, Ca2+, Pb2+, Mg2+, Zn2+, Sr2+, and Rb+ (all at 10 mg/L) in the presence of 4 g/L CQDs@Cu-IIP were investigated. The results in the presence of 0.3 g/L CQDs and 4 g/L CQDs@NIP were also recorded for comparison. It can be clearly seen from Figure 16 that CQDs@Cu-IIP has a higher quenching ratio for copper ions over other metal ions. In addition, the selectivity of CQDs@Cu-IIP for Cu2+ ions is much better than that of CQDs@NIP and CQDs. This can be attributed to that CQDs@Cu-IIP have cavities that are complementary in shape and functionality to the template Cu2+ ions.
As the important influence factors, the light-stability and storage-stability of CQDs@Cu-IIP were also studied. Using a tungsten lamp to continuously irradiate 4 g/L CQDs@Cu-IIP solutions for 10 h, and measures the fluorescence intensity of the sample every hour, the results are shown in Figure 17a. The fluorescence intensity of the sensor is almost unchanged after 3 h, but it decreases by 1.3% after 10 h. If the solution is stored in the dark, the fluorescence intensity is almost constant within one week, but decreases by 3.6% after 5 weeks, as shown in Figure 17b. Therefore, 3 h is chosen as the effective photoinduction time of CQDs@Cu-IIP, and the sensor can be used to quantitatively detect copper ions within one week.

3.5. CQDs@Cu-IIP for Analysis of Tap Water Samples

To further verify the practical utility of the prepared CQDs@Cu-IIP, it was used for the detection of copper ions in tap water and Beichuan River water. All real samples were firstly filtered through a 0.45 μm polycarbonate membrane, and the pH values were adjusted to 10 using the 1 mol/L NaOH. The CQDs@Cu-IIP (4 g/L) was used as a probe, at an excitation wavelength of 343 nm, the concentration of copper ions in two actual water samples was tested by fluorescence analysis, and the spike recovery rates were calculated. The detection results were compared with that of the atomic absorption spectrometer (AAS) to discuss the feasibility of CQDs@Cu-IIP sensor. As shown in Table 3, the recovery rates obtained from fluorescence spectrometry were between 99.29% and 105.42%, which was no significant difference compared with the AAS method. It shows that the fluorescence sensor has certain practical applications.

4. Conclusions

Combining the advantages of ion imprinting polymers and the unique fluorescent properties of carbon quantum dots, a metal ion fluorescence sensor with the ion recognition method was successfully synthesized. The fluorescence intensity at an excitation wavelength of 343 nm was significantly quenched upon the addition of copper(II) ions, and it could be used to quantitatively detect copper(II) ions over a wide concentration range. Satisfactory results demonstrated that the CQDs@Cu-IIP could be used as a sensor to detect trace copper(II) ions in solutions.

Author Contributions

Z.W.: investigation and writing. C.Z.: investigation. S.W.: investigation. C.S.: supervision. All authors have read and agreed to the published version of the manuscript.

Funding

This research was financially supported by the National Natural Science Foundation of China (No. 21766028), and the Natural Science Foundation of Qinghai (No. 2018-ZJ-912).

Institutional Review Board Statement

Not applicable.

Informed Consent Statement

Not applicable.

Data Availability Statement

The data presented in this study are available on request from the corresponding author.

Acknowledgments

The authors would like to thank Qinghai University for providing the necessary characterization test equipment. The authors would also like to thank the School of Chemical Engineering for part of the support. The authors would also like to thank anonymous reviewers for their valuable suggestions, which can help improve the quality of the manuscript.

Conflicts of Interest

The authors declare no conflict of interest.

References

  1. Pichel, N.; Vivar, M.; Fuentes, M. The problem of drinking water access: A review of disinfection technologies with an emphasis on solar treatment methods. Chemosphere 2019, 218, 1014–1030. [Google Scholar] [CrossRef]
  2. Sarkar, S.; Chatti, M.; Venkata, N.K.B.; Adusumalli, V. Mahaling-am, Highly selective and sensitive detection of Cu2+ ions using Ce(III)/Tb(III)-doped SrF2 nanocrystals as fluorescent probe. ACS Appl. Mater. 2015, 7, 25702. [Google Scholar] [CrossRef] [PubMed]
  3. Li, F.; Sa, R. Formation of Cu3,4(TCA), making the TCA complex a highly selective probe for Cu2+ detection: A TDDFT study. J. Mater. Chem. C 2019, 7, 2443–2456. [Google Scholar] [CrossRef]
  4. Georgopoulos, P.G.; Roy, A.; Yonone-Lioy, M.J.; Opiekun, R.E.; Lioy, P.J. Environmental copper: Its dynamics and human exposure issues. J. Toxicol. Environ. Health Part B 2001, 4, 341–394. [Google Scholar] [CrossRef] [PubMed]
  5. Mei, M.; Pang, J.; Huang, X.; Luo, Q. Magnetism-reinforced in-tube solid phase microextraction for the online determination of trace heavy metal ions in complex samples. Anal. Chim. Acta 2019, 1090, 82–90. [Google Scholar] [CrossRef]
  6. Becker, J.S.; Matusch, A.; Depboylu, C.; Dobrowolska, J.; Zoriy, M.V. Quantitative Imaging of Selenium, Copper, and Zinc in Thin Sections of Biological Tissues (Slugs−Genus Arion) Measured by Laser Ablation Inductively Coupled Plasma Mass Spectrometry. Anal. Chem. 2007, 79, 6074–6080. [Google Scholar] [CrossRef]
  7. Lin, T.; Huan, S. Direct and Simultaneous Determination of Copper, Chromium, Aluminum, and Manganese in Urine with a Multielement Graphite Furnace Atomic Absorption Spectrometer. Anal. Chem. 2001, 73, 4319–4325. [Google Scholar] [CrossRef]
  8. Otero-Romaní, J.; Moreda-Piñeiro, A.; Bermejo-Barrera, A.; Bermejo-Barrera, P. Evaluation of commercial C18 cartridges for trace elements solid phase extraction from seawater followed by inductively coupled plasma-optical emission spectrometry determination. Anal. Chim. Acta 2005, 536, 213–218. [Google Scholar] [CrossRef]
  9. Yang, W.; Jaramillo, D.; Gooding, J.J.; Hibbert, D.B.; Zhang, R.; Willett, G.D.; Fisher, K.J. Sub-ppt detection limits for copper ions with Gly-Gly-His modified electrodes. Chem. Commun. 2001, 19, 1982–1983. [Google Scholar] [CrossRef]
  10. Wen, T.; Qu, F.; Li, N.B.; Luo, H.Q. A facile, sensitive, and rapid spectrophotometric method for copper(II) ion detection in aqueous media using polyethyleneimine. Arab. J. Chem. 2017, 10, S1680–S1685. [Google Scholar] [CrossRef]
  11. Wang, X.-R.; Li, B.-W.; You, H.-Y.; Chen, L.-X. An Ion Imprinted Polymers Grafted Paper-based Fluorescent Sensor Based on Quantum Dots for Detection of Cu2+ Ions. Chin. J. Anal. Chem. 2015, 43, 1499–1504. [Google Scholar] [CrossRef]
  12. Feng, J.; Tao, Y.; Shen, X.; Jin, H.; Zhou, T.; Zhou, Y.; Hu, L.; Luo, D.; Mei, S.; Lee, Y.-I. Highly sensitive and selective fluorescent sensor for tetrabromobisphenol-A in electronic waste samples using molecularly imprinted polymer coated quantum dots. Microchem. J. 2019, 144, 93–101. [Google Scholar] [CrossRef]
  13. Wang, B.; Li, J.; Tang, Z.; Yang, B.; Lu, S. Near-infrared emissive carbon dots with 33.96% emission in aqueous solution for cellular sensing and light-emitting diodes. Sci. Bull. 2019, 64, 1285–1292. [Google Scholar] [CrossRef] [Green Version]
  14. Liu, Y.; Li, X.; Zhang, Q.; Li, W.; Xie, Y.; Liu, H.; Shang, L.; Liu, Z.; Chen, Z.; Gu, L.; et al. A General Route to Prepare Low-Ruthenium-Content Bimetallic Electrocatalysts for pH-Universal Hydrogen Evolution Reaction by Using Carbon Quantum Dots. Angew. Chem. Int. Ed. Engl. 2020, 59, 1718–1726. [Google Scholar] [CrossRef]
  15. Lu, S.; Xiao, G.; Sui, L.; Feng, T.; Yong, X.; Zhu, S.; Li, B.; Liu, Z.; Zou, B.; Jin, M.; et al. Piezochromic Car-bon Dots with Two-photon Fluorescence. Angew. Chem. Int. Ed. Engl. 2017, 56, 6187–6191. [Google Scholar] [CrossRef] [PubMed]
  16. Molaei, M.J. A review on nanostructured carbon quantum dots and their applications in biotechnology, sensors, and chemiluminescence. Talanta 2019, 196, 456–478. [Google Scholar] [CrossRef]
  17. Khan, Z.M.; Rahman, R.S.; Shumaila Islam, S.; Zulfequar, M. Hydrothermal treatment of red lentils for the synthesis of fluorescent carbon quantum dots and its application for sensing Fe3+. Opt. Mater. 2019, 91, 386–395. [Google Scholar] [CrossRef]
  18. Wang, C.; Wang, Y.; Shi, H.; Yan, Y.; Liu, E.; Hu, X.; Fan, J. A strong blue fluorescent nanoprobe for highly sensitive and selective detection of mercury(II) based on sulfur doped carbon quantum dots. Mater. Chem. Phys. 2019, 232, 145–151. [Google Scholar] [CrossRef]
  19. Feng, S.; Gao, Z.; Liu, H.; Huang, J.; Li, X.; Yang, Y. Feasibility of detection valence speciation of Cr(III) and Cr(VI) in envi-ronmental samples by spectrofluorimetric method with fluorescent carbon quantum dots. Spectrochim. Acta A Mol. Biomol. Spectrosc. 2019, 212, 286–292. [Google Scholar] [CrossRef]
  20. Shakerian, F.; Kim, K.-H.; Kwon, E.; Szulejko, J.E.; Kumar, P.; Dadfarnia, S.; Shabani, A.M.H. Advanced polymeric materials: Synthesis and analytical application of ion imprinted polymers as selective sorbents for solid phase extraction of metal ions. TrAC Trends Anal. Chem. 2016, 83, 55–69. [Google Scholar] [CrossRef]
  21. Qi, J.; Li, B.; Wang, X.; Zhang, Z.; Wang, Z.; Han, J.; Chen, L. Three-dimensional paper-based microfluidic chip device for multiplexed fluorescence detection of Cu2+ and Hg2+ ions based on ion imprinting technology. Sens. Actuators B Chem. 2017, 251, 224–233. [Google Scholar] [CrossRef]
  22. Shao, H.; Li, C.; Ma, C.; Sun, L.; Chen, R.; Cheng, R.; Liu, Y.; Yan, Y.; Sun, Q.; Wu, C. An ion-imprinted material embedded carbon quantum dots for selective fluorometric determination of lithium ion in water samples. Microchim. Acta 2017, 184, 4861–4868. [Google Scholar] [CrossRef]
  23. Dhaneswara, D.; Sofyan, N. Effect of Different Pluronic P123 Triblock Copolymer Surfactant Concentrations on SBA-15 Pore Formation. Int. J. Technol. 2016, 7, 1009. [Google Scholar] [CrossRef]
  24. He, L.; Xu, Q.; Liu, Y.; Wei, H.; Tang, Y.; Lin, W. Coumarin-Based Turn-On Fluorescence Probe for Specific Detection of Glutathione over Cysteine and Homocysteine. ACS Appl. Mater. Interfaces 2015, 7, 12809–12813. [Google Scholar] [CrossRef]
  25. Razym, G.; Bakhshpour, M.; Yavuz, H.; Kip, C.; Tuncel, A.; Denizli, A. Surface-imprinted silica particles for Concanavalin A purification from Canavalia ensiformis. J. Chromatogr. B Analyt. Technol. Biomed. Life Sci. 2020, 1136, 121852. [Google Scholar] [CrossRef]
  26. Li, Y.; Liu, Y.; Shang, X.; Chao, D.; Zhou, L.; Zhang, H. Highly sensitive and selective detection of Fe3+ by utilizing carbon quantum dots as fluorescent probes. Chem. Phys. Lett. 2018, 705, 1–6. [Google Scholar] [CrossRef]
  27. Mohapatra, S.; Sahu, S.; Sinha, N.; Bhutia, S.K. Synthesis of a carbon-dot-based photoluminescent probe for selective and ultrasensitive detection of Hg2+ in water and living cells. Analyst 2014, 140, 1221–1228. [Google Scholar] [CrossRef]
  28. Park, S.Y.; Lee, H.U.; Park, E.S.; Lee, S.C.; Lee, J.-W.; Jeong, S.W.; Kim, C.H.; Lee, Y.-C.; Huh, Y.S.; Lee, J. Photoluminescent Green Carbon Nanodots from Food-Waste-Derived Sources: Large-Scale Synthesis, Properties, and Biomedical Applications. ACS Appl. Mater. Interfaces 2014, 6, 3365–3370. [Google Scholar] [CrossRef]
  29. Yang, Z.; Xu, M.; Liu, Y.; He, F.; Gao, F.; Su, Y.; Wei, H.; Zhang, Y. Nitrogen-doped, carbon-rich, highly photoluminescent carbon dots from ammonium citrate. Nanoscale 2014, 6, 1890–1895. [Google Scholar] [CrossRef]
  30. Jing, S.; Zhao, Y.; Sun, R.-C.; Zhong, L.; Peng, X. Facile and High-Yield Synthesis of Carbon Quantum Dots from Biomass-Derived Carbons at Mild Condition. ACS Sustain. Chem. Eng. 2019, 7, 7833–7843. [Google Scholar] [CrossRef]
  31. Riaz, R.; Ali, M.; Maiyalagan, T.; Anjum, A.S.; Lee, S.Y.; Ko, M.J.; Jeong, S.H. Dye-sensitized solar cell (DSSC) coated with energy down shift layer of nitrogen-doped carbon quantum dots (N-CQDs) for enhanced current density and stability. Appl. Surf. Sci. 2019, 483, 425–431. [Google Scholar] [CrossRef]
  32. Kang, J.-K.; Lee, S.-C.; Kim, S.-B. Enhancement of selective Cu(II) sorption through preparation of surface-imprinted mesoporous silica SBA-15 under high molar concentration ratios of chloride and copper ions. Microporous Mesoporous Mater. 2018, 272, 193–201. [Google Scholar] [CrossRef]
  33. Çanakçı, D. Thermal stability, degradation kinetic and structural characterization of novel aromatic amide compounds. J. Mol. Struct. 2020, 1205, 127645. [Google Scholar] [CrossRef]
  34. Li, Y.; Zhao, Y.; Cheng, H.; Hu, Y.; Shi, G.; Dai, L.; Qu, L. Nitrogen-Doped Graphene Quantum Dots with Oxygen-Rich Functional Groups. J. Am. Chem. Soc. 2012, 134, 15–18. [Google Scholar] [CrossRef] [PubMed]
  35. Xie, Y.; Cheng, D.; Liu, X.; Han, A. Green Hydrothermal Synthesis of N-doped Carbon Dots from Biomass Highland Barley for the Detection of Hg2+. Sensors 2014, 58, 219–225. [Google Scholar] [CrossRef] [PubMed] [Green Version]
  36. Ju, J.; Chen, W. Synthesis of highly fluorescent nitrogen-doped graphene quantum dots for sensitive, label-free detection of Fe (III) in aqueous media. Biosens. Bioelectron. 2014, 58, 219–225. [Google Scholar] [CrossRef] [PubMed]
  37. Wang, L.; Zhou, H.S. Green Synthesis of Luminescent Nitrogen-Doped Carbon Dots from Milk and Its Imaging Application. Anal. Chem. 2014, 86, 8902–8905. [Google Scholar] [CrossRef] [PubMed]
  38. Wu, W.; Shi, C.; Bian, X.; Bai, Y. Microwave radiation hydrothermal synthesis and characterization of micro- and mesoporous composite molecular sieve Y/SBA-15. Arab. J. Chem. 2017, 10, S2773–S2777. [Google Scholar] [CrossRef] [Green Version]
  39. Xing, S.; Lv, P.; Fu, J.; Wang, J.; Fan, P.; Yang, L.; Yuan, Z. Direct synthesis and characterization of pore-broadened Al-SBA-15. Microporous Mesoporous Mater. 2017, 239, 316–327. [Google Scholar] [CrossRef]
  40. Wang, H.; Shang, H.; Sun, X.; Hou, L.; Wen, M.; Qiao, Y. Preparation of thermo-sensitive surface ion-imprinted polymers based on multi-walled carbon nanotube composites for selective adsorption of lead(II) ion. Colloids Surf. A Physicochem. Eng. Asp. 2020, 585, 124139. [Google Scholar] [CrossRef]
  41. Chen, J.; Li, Y.; Lv, K.; Zhong, W.; Wang, H.; Wu, Z.; Yi, P.; Jiang, J. Cyclam-functionalized carbon dots sensor for sensitive and selective detection of copper(II) ion and sulfide anion in aqueous media and its imaging in live cells. Sens. Actuators B Chem. 2016, 224, 298–306. [Google Scholar] [CrossRef]
  42. Shen, Q.; Tang, S.; Li, W.; Nie, Z.; Liu, Z.; Huang, Y.; Yao, S. A novel DNA-templated click chemistry strategy for fluorescent detection of copper(ii) ions. Chem. Commun. 2011, 48, 281–283. [Google Scholar] [CrossRef]
  43. Zong, J.; Yang, X.; Trinchi, A.; Hardin, S.; Cole, I.; Zhu, Y.; Li, C.; Muster, T.; Wei, G. Carbon dots as fluorescent probes for “off–on” detection of Cu2+ and l-cysteine in aqueous solution. Biosens. Bioelectron. 2014, 51, 330–335. [Google Scholar] [CrossRef] [PubMed]
  44. Zhao, X.; Wang, L.; Liu, Q.; Chen, M.; Chen, X. Facile synthesis of B,N-doped CQDs as versatile fluorescence probes for sensitive detection of cobalt ions in environmental water and biological samples. Microchem. J. 2021, 163, 105888. [Google Scholar] [CrossRef]
  45. Ng, Y.H.; Chin, S.F.; Pang, S.C.; Ng, S.M. Utilising the interface interaction on tris(hydroxymethy)aminomethane-capped carbon dots to enhance the sensitivity and selectivity towards the detection of Co(II) ions. Sens. Actuators B Chem. 2018, 273, 83–92. [Google Scholar] [CrossRef]
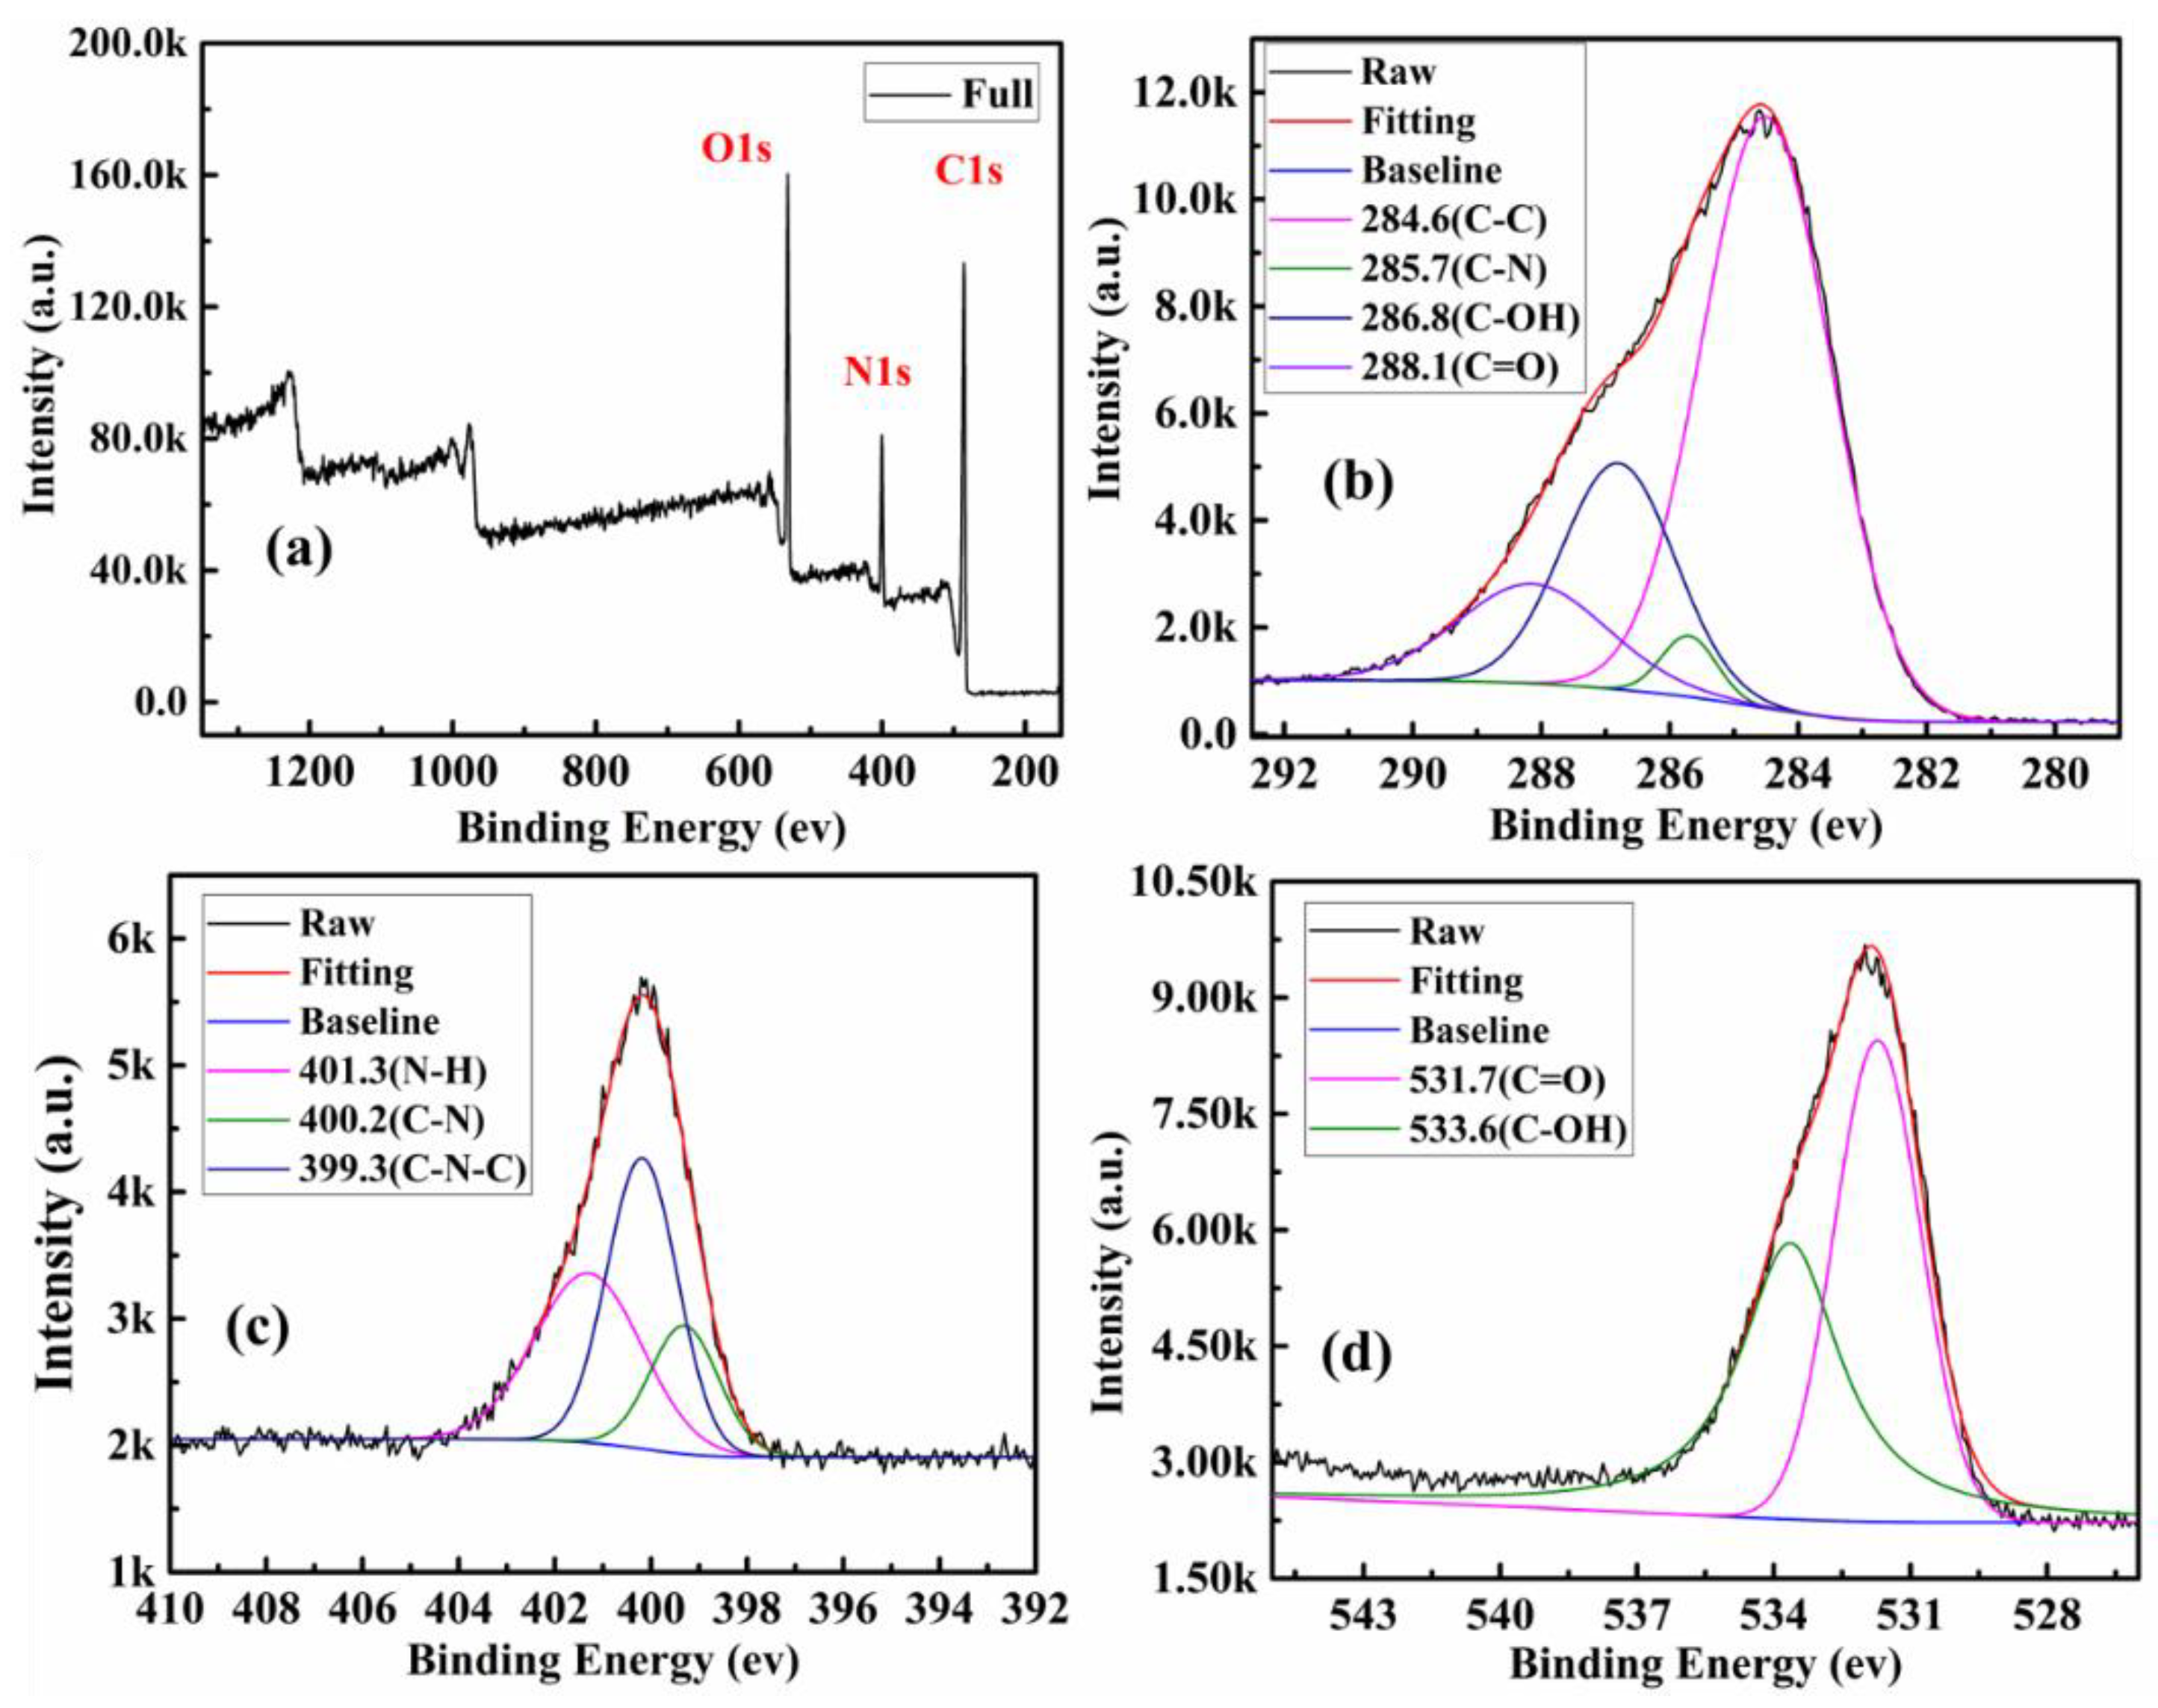
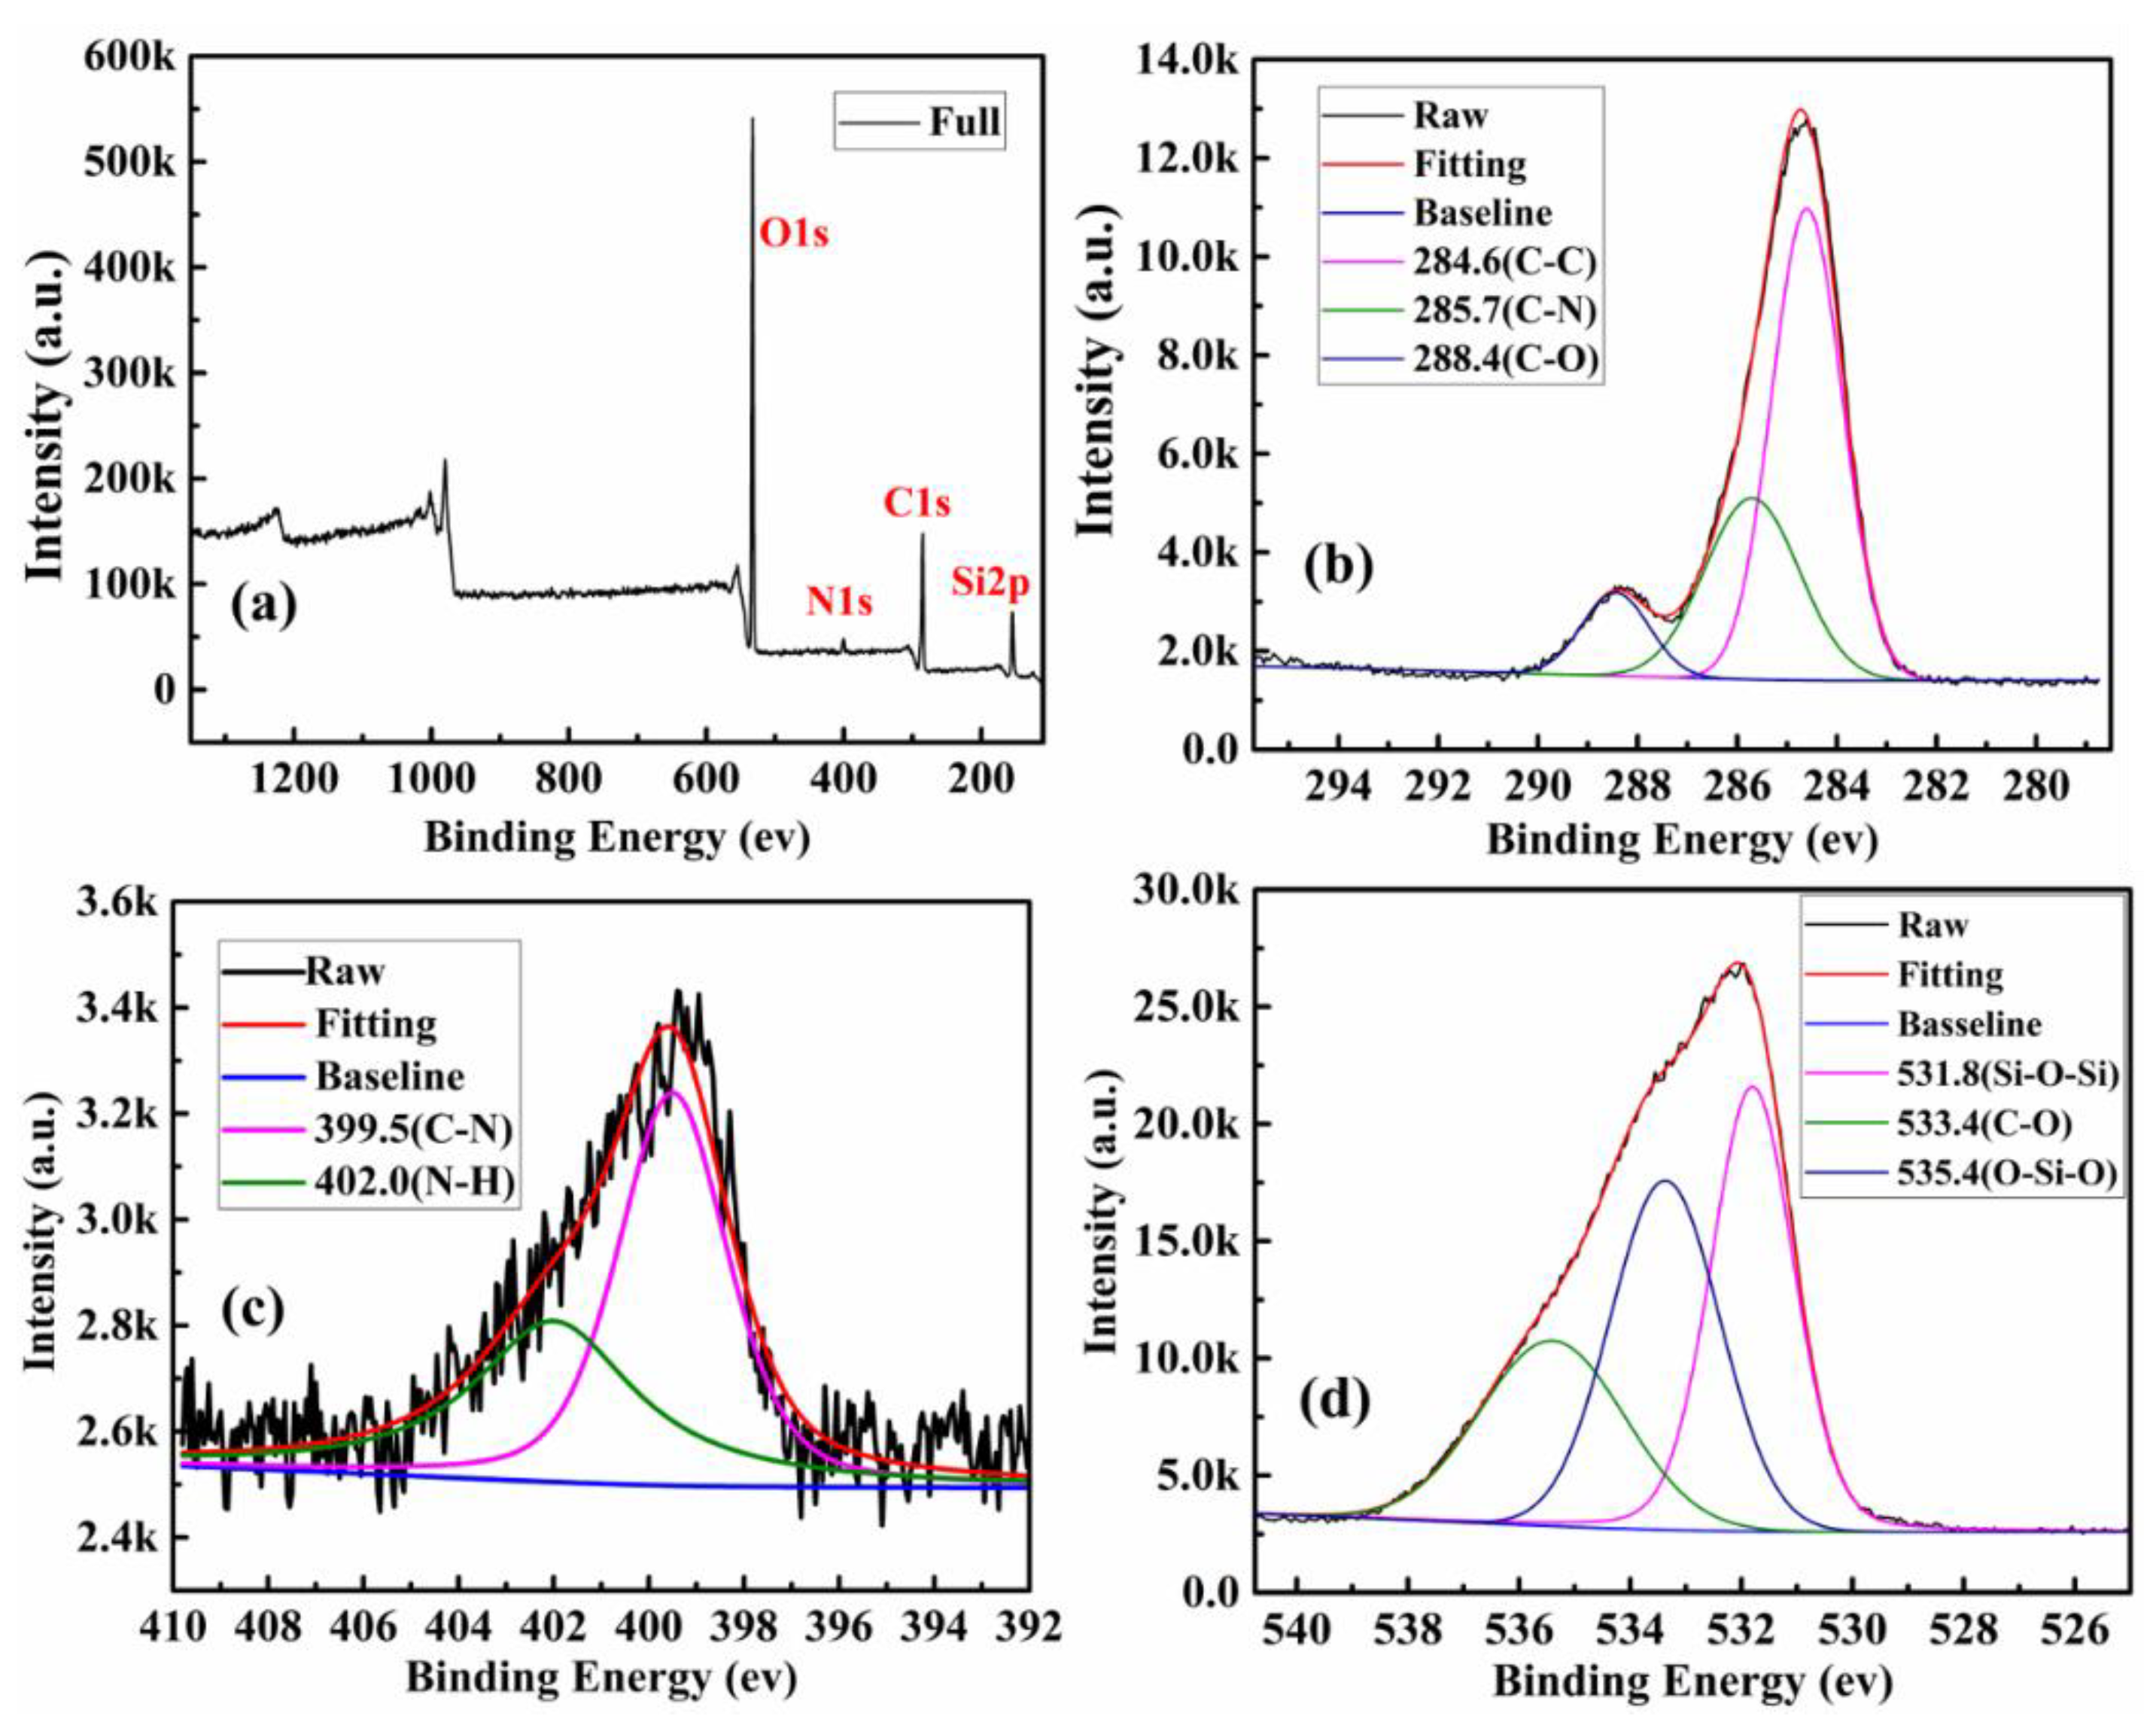
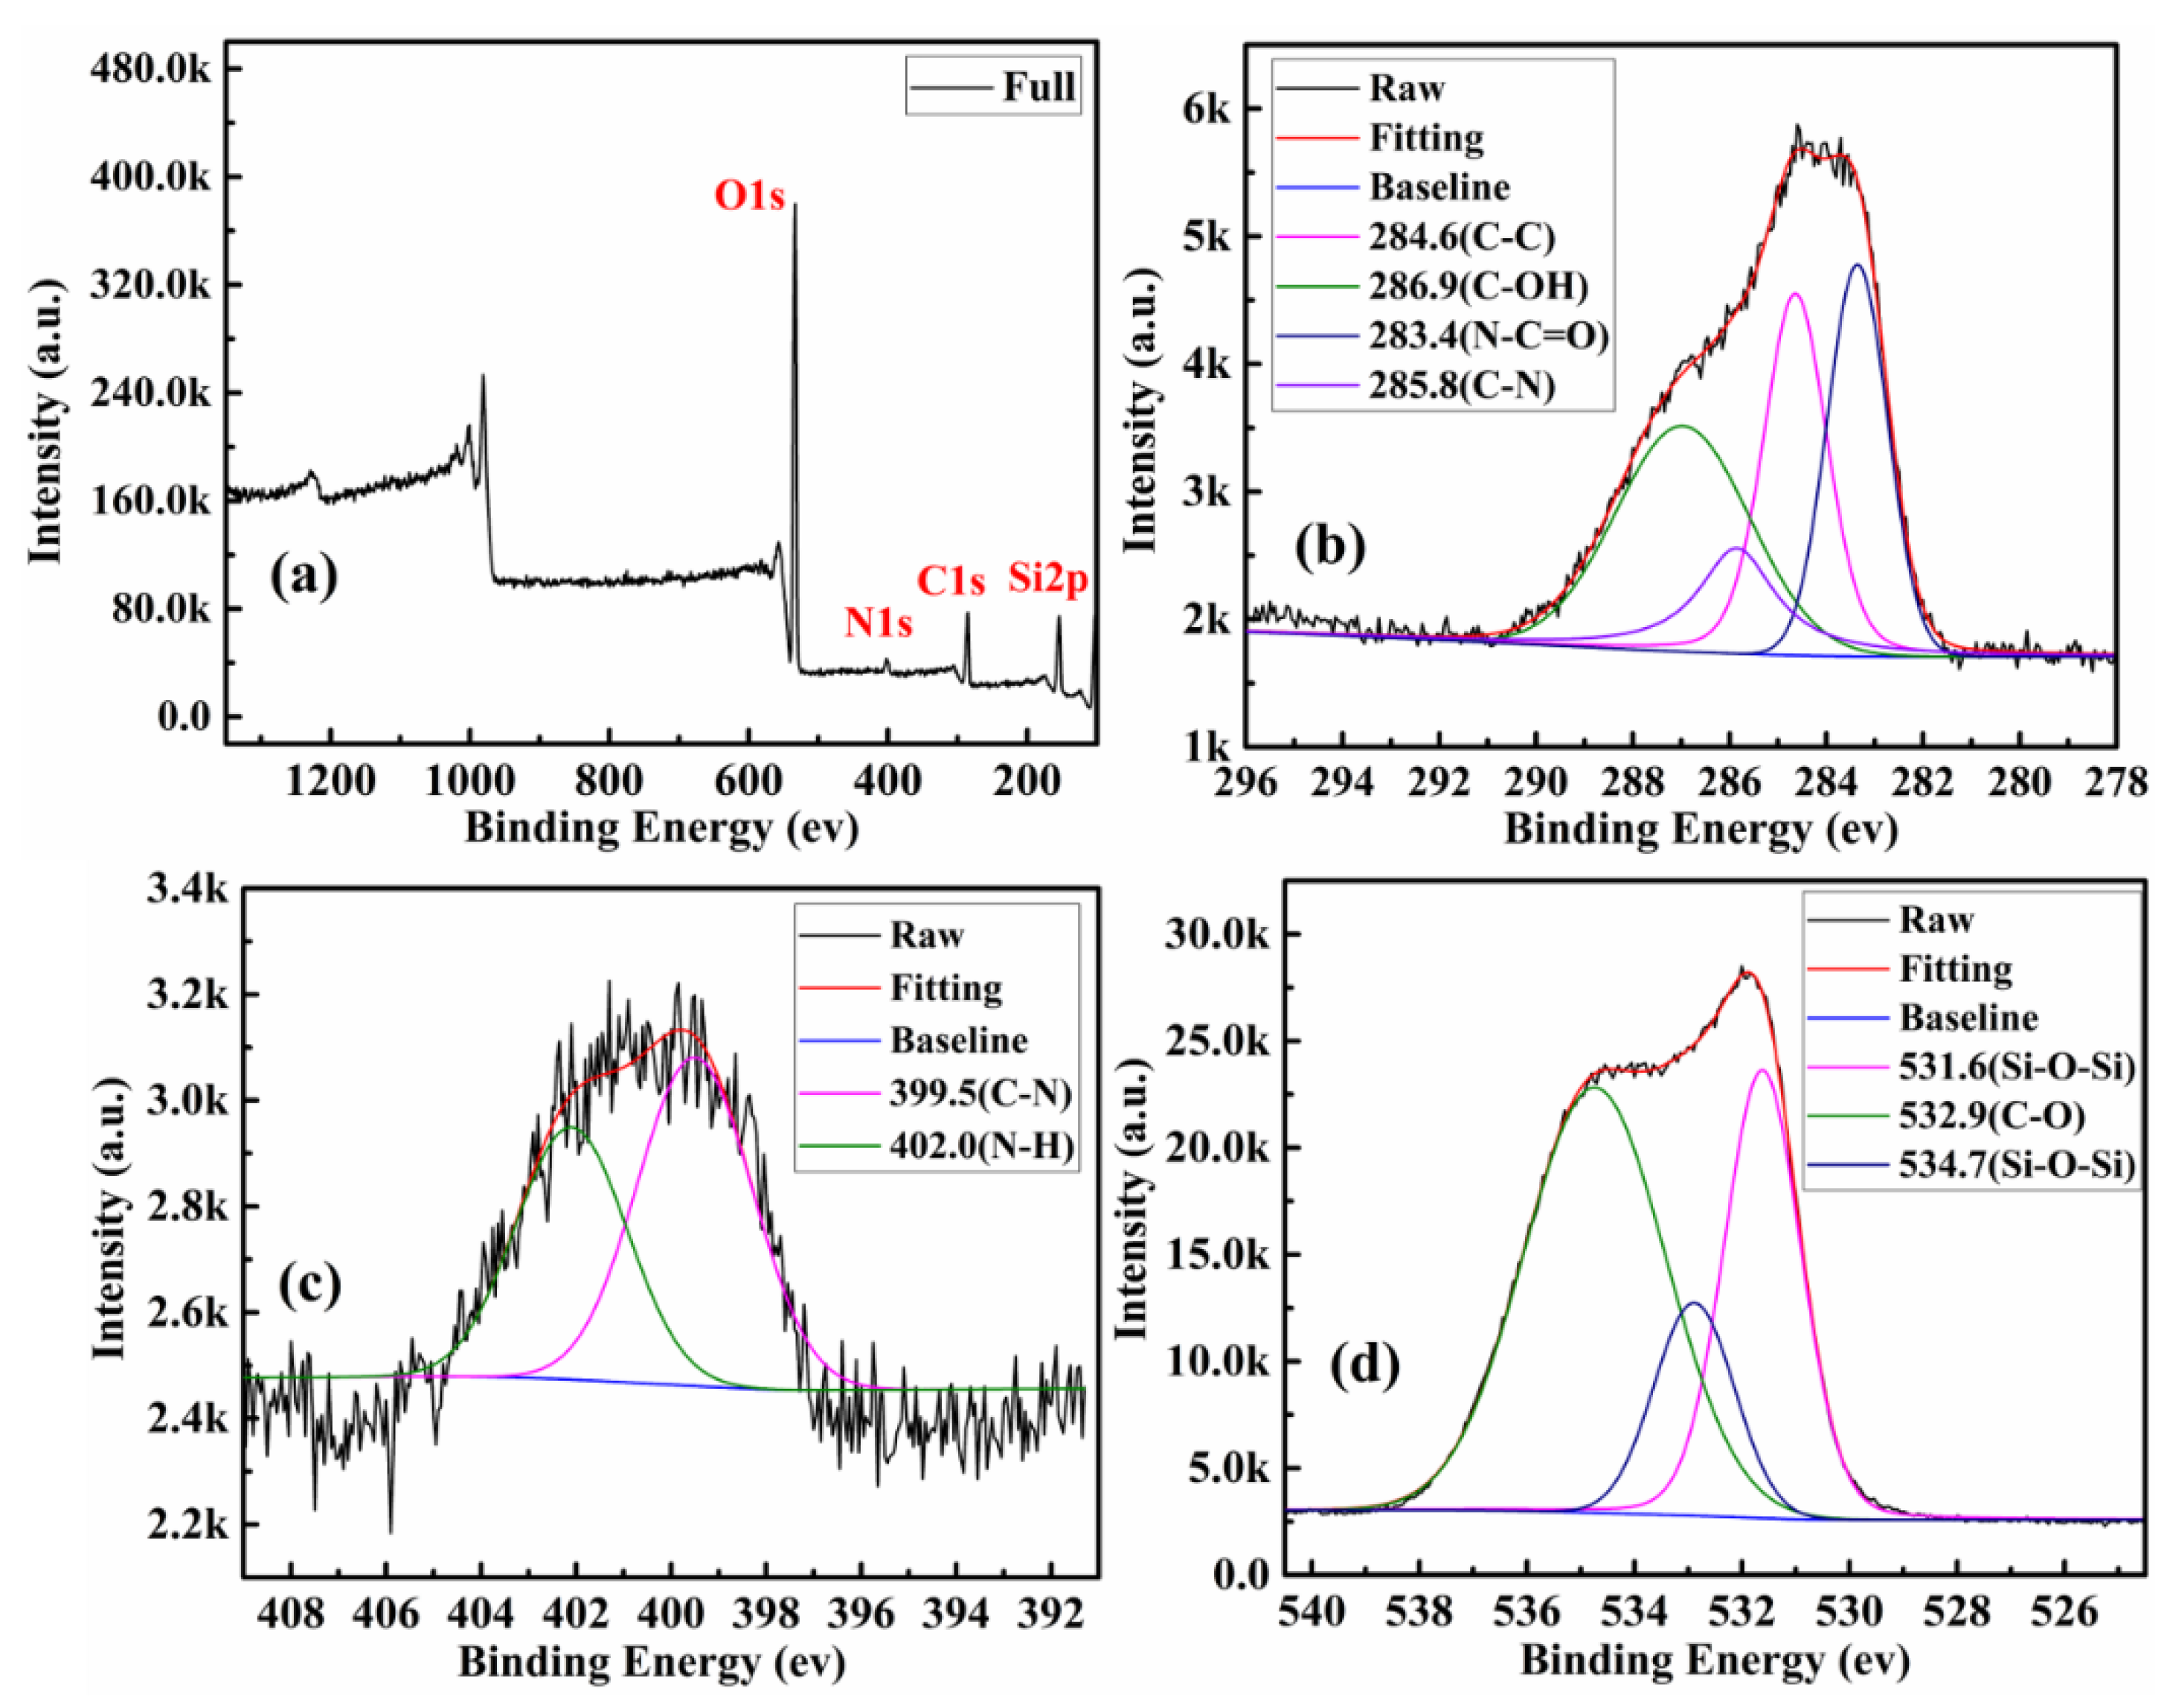
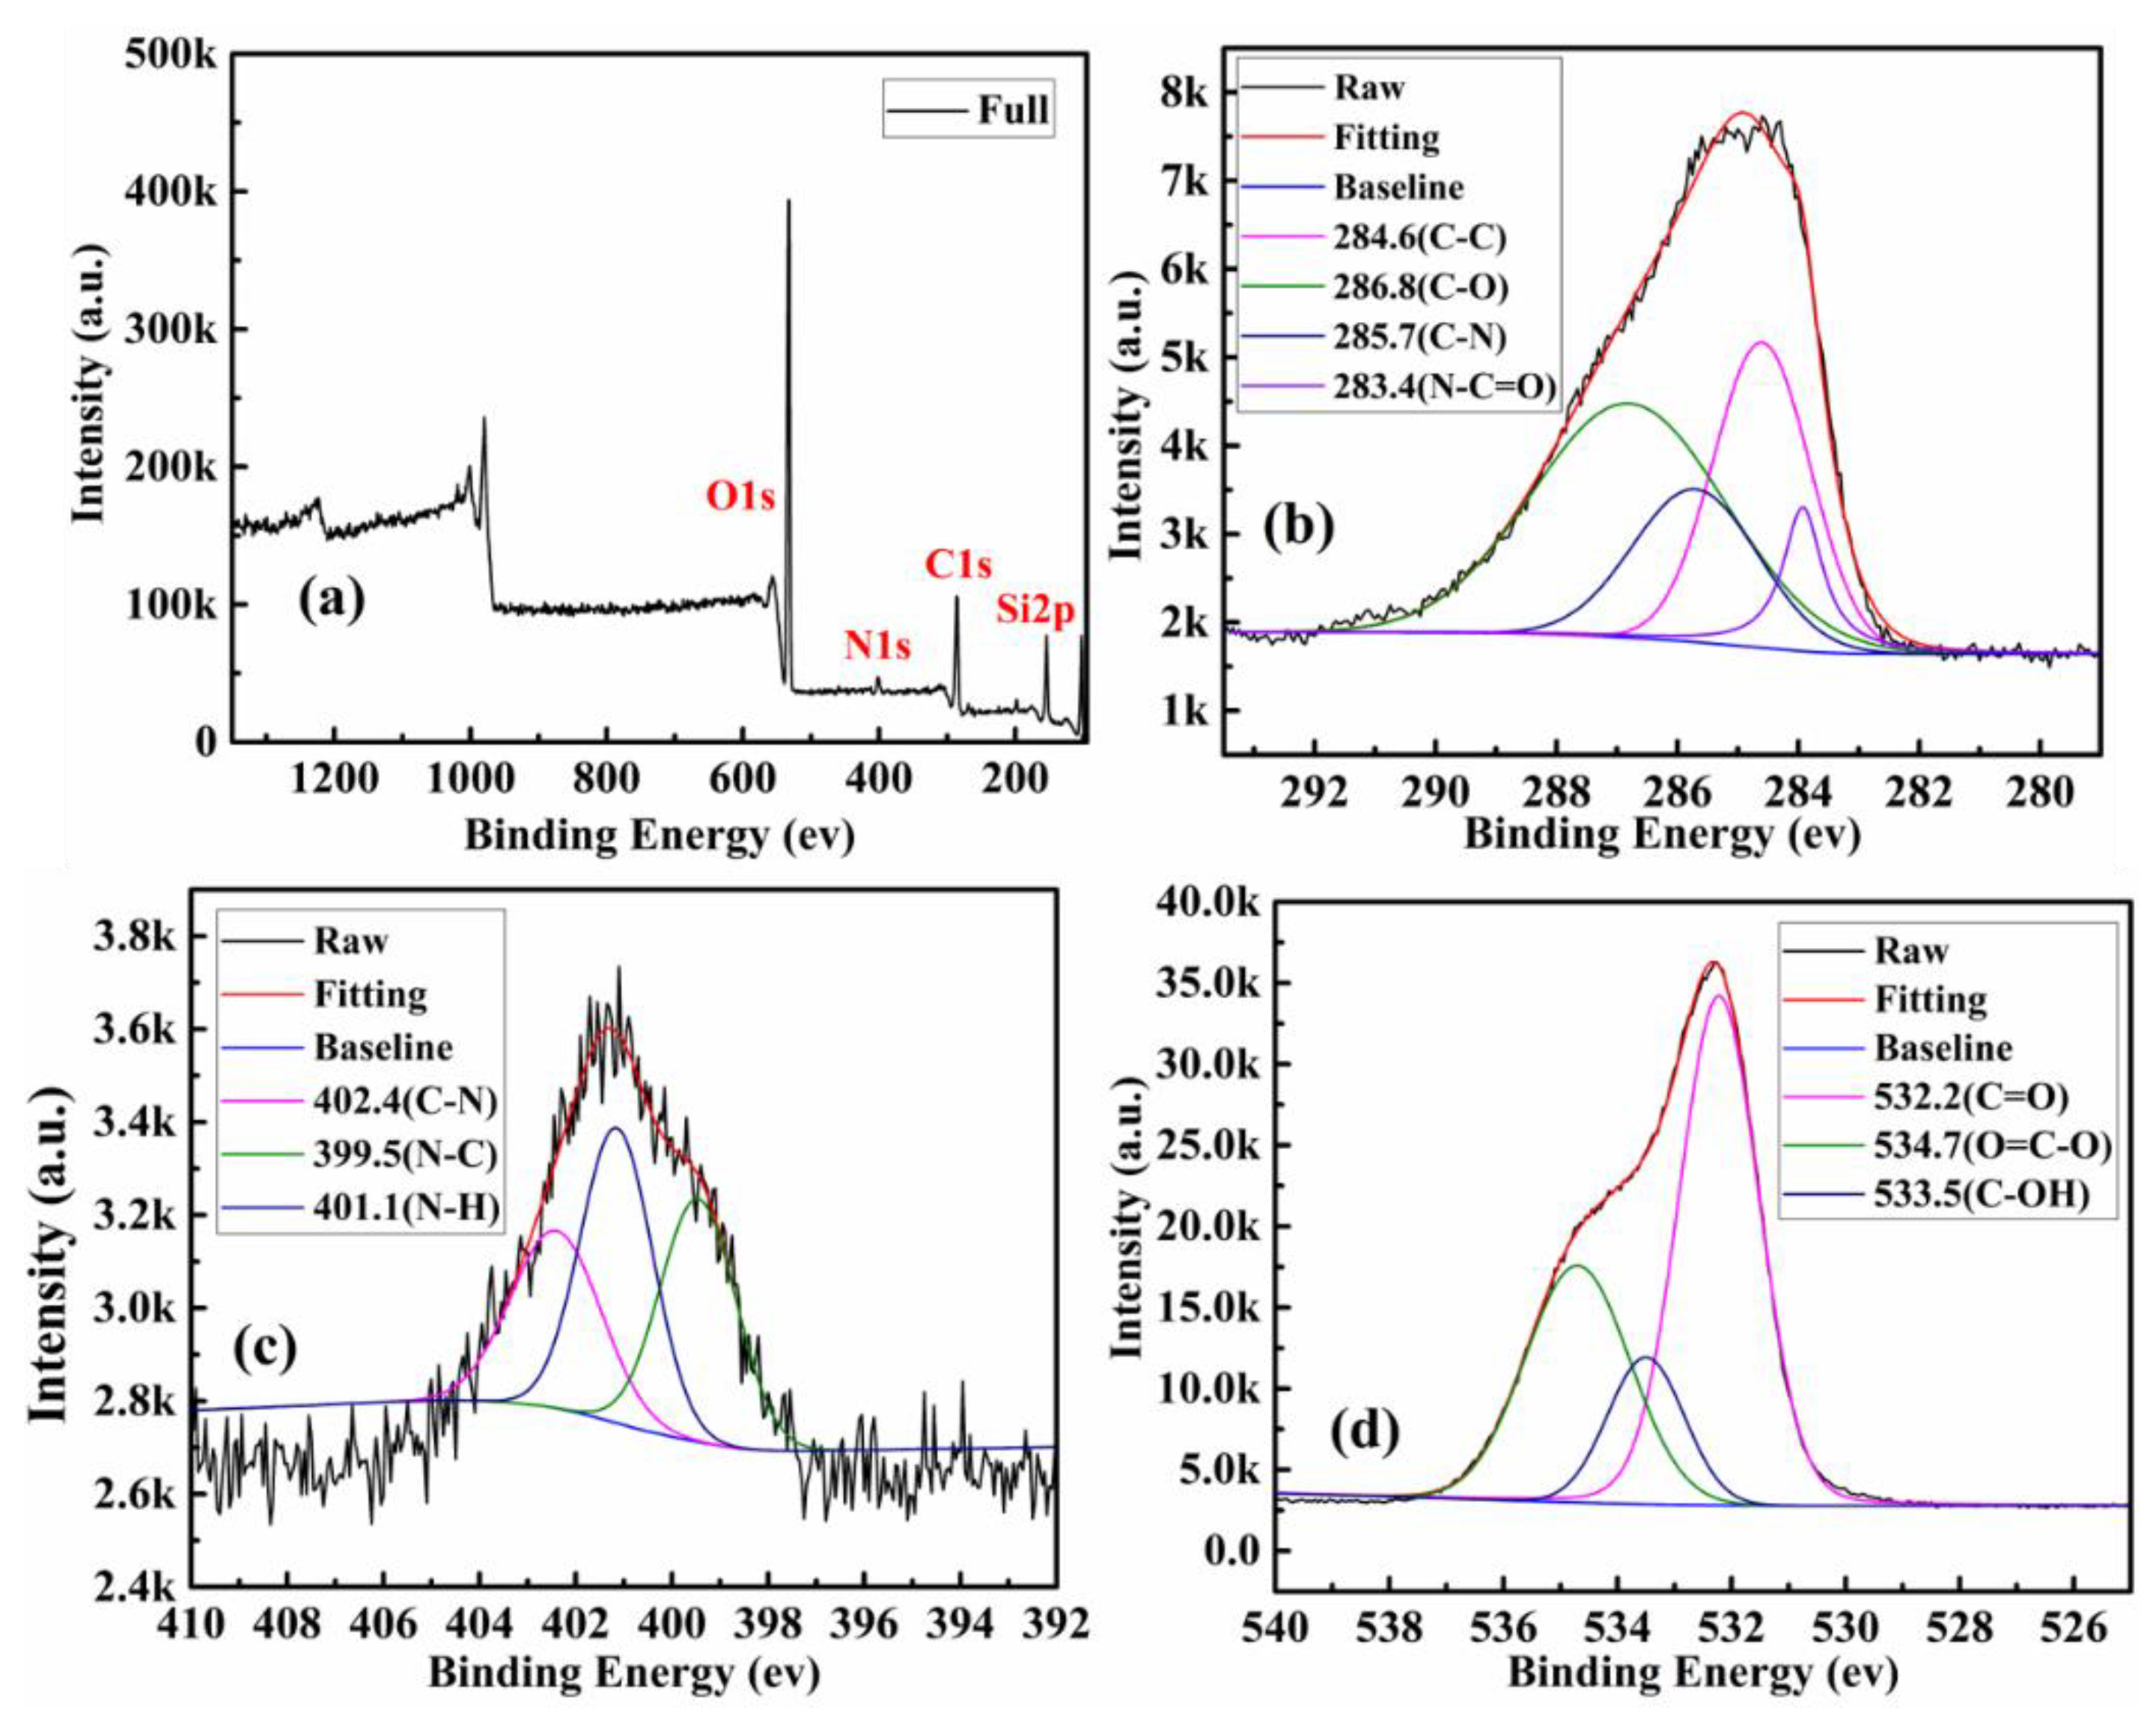
Figure 1. The synthetic route of CQDs@Cu-IIP. Physical and optical properties of CQDs and CQDs@Cu-IIP.
Polymers 13 01376 g001
Figure 2. XRD patterns of CQDs (a), SBA-15-CQDs (b) and CQDs@Cu-IIP (c).
Polymers 13 01376 g002
Figure 3. The FT-IR spectra of CQDs (a), SBA-15 (b), SBA-15-CQDs (c) and CQDs@Cu-IIP (d).
Polymers 13 01376 g003
Figure 4. XPS analysis of as-prepared CQDs, (a) XPS survey spectrum of the CQDs; (b) high-resolution spectrum of C1s; (c) high-resolution spectrum of O1s; and (d) high-resolution spectrum of N1s.
Polymers 13 01376 g004
Figure 5. XPS analysis of as-prepared SBA-15-NH2, (a) XPS survey spectrum of the SBA-15-NH2; (b) high-resolution spectrum of C1s; (c) high-resolution spectrum of N1s; and (d) high-resolution spectrum of O1s.
Polymers 13 01376 g005
Figure 6. XPS analysis of as-prepared SBA-15-CQDs, (a) XPS survey spectrum of the SBA-15-CQDs; (b) high-resolution spectrum of C1s; (c) high-resolution spectrum of N1s; and (d) high-resolution spectrum of O1s.
Polymers 13 01376 g006
Figure 7. XPS analysis of as-prepared CQDs@IIP, (a) XPS survey spectrum of the CQDs@IIP; (b) high-resolution spectrum of C1s; (c) high-resolution spectrum of N1s; and (d) high-resolution spectrum of O1s.
Polymers 13 01376 g007
Figure 8. TEM image of CQDs (a) and particle size statistics of CQDs (b); TEM image of SBA-15 (c); SEM image of SBA-15-CQDs (d); SEM (e) and TEM (f) image of CQDs@Cu-IIP.
Polymers 13 01376 g008
Figure 9. UV-Vis spectra of (a) CQDs (0.05 g/L) and (b) CQDs@Cu-IIP (0.05 g/L) in aqueous solution.
Polymers 13 01376 g009
Figure 10. (a) The fluorescence intensity of CQDs at different concentrations in the aqueous solution. (b) Fluorescence excitation and emission spectra of 0.25 g/L CQDs. (c) Emission spectra of 0.25 g/L CQDs at different excitation wavelengths.
Polymers 13 01376 g010
Figure 11. (a) The fluorescence intensity of CQDs@Cu-IIP at different concentrations in the aqueous solution. Inset shows the images of 4 g/L CQDs@Cu-IIP aqueous solutions under 365 nm ultraviolet lamp and daylight lamp. (b) Fluorescence–time curve of 0.25 mg/L copper ion solution containing 4 g/L CQDs@Cu-IIP. (c) Fluorescence–time curve of 10 mg/L copper ion solution containing 4 g/L CQDs@Cu-IIP. (Ex = 343 nm).
Polymers 13 01376 g011
Figure 12. (a) The relationship between the pH values and the fluorescence intensity of 4 g/L CQDs@Cu-IIP solutions. (b) The relationship between the pH values and the fluorescence intensity of 4 g/L CQDs@Cu-IIP containing 2.5 mg/L copper ions. (c) The comparison results are shown as a column chart. (Ex = 343 nm, the pH was adjusted by 1 mol/L sodium hydroxide solution).
Polymers 13 01376 g012
Figure 13. Fluorescence quenching process: Photo-induced electron transfer.
Polymers 13 01376 g013
Figure 14. Fluorescence spectra (a) and linear fitting equations (b) of CQDs@Cu−IIP (4 g/L) and different concentrations of Cu2+, 0.25–2 mg/L. (Ex = 343 nm, pH = 10).
Polymers 13 01376 g014
Figure 15. Fluorescence spectra (a) and linear fitting equations (b) of CQDs@Cu−IIP (4 g/L) and different concentrations of Cu2+, 3–10 mg/L. (Ex = 343 nm, pH = 10).
Polymers 13 01376 g015
Figure 16. Selectivity of CQDs@Cu-IIP(4 g/L), CQDs@NIP(4 g/L) and CQDs(0.3 g/L). (Ex = 343 nm, pH = 10).
Polymers 13 01376 g016
Figure 17. Light-stability (a) and storage stability (b) of 4 g/L CQDs@Cu-IIP. (Ex = 343 nm).
Polymers 13 01376 g017
Table 1. Chemical composition obtained by XPS for products.
ComponentsCQDsSBA-15-NH2SBA-15-CQDsCQDs@IIP
BE(eV)Atomic%BE(eV)Atomic%BE(eV)Atomic%BE(eV)Atomic%
C285.9367.77285.334.86285.7320.22285.7130.40
N400.2811.94400.454.18401.162.85401.593.42
O531.9220.29532.8443.31533.5553.89532.9546.46
Si--103.8117.65103.3720.04102.9719.72
Table 2. Comparison of the proposed probe with various reported sensors.
ProbeDetection LimitDetection RangeReference
Ce(III)/Tb(III)-doped SrF2 0.11–0.14 µM0–70.0 µM[2]
Carbon dots Sensor0.10µM0.7–4.0 µM[41]
double-stranded DNA0.29µM0.5–10 µM[42]
Carbon dots Sensor23 nM0–10 µM[43]
B, N-CQDs0.52 nM0.5–10, 10–2000 nM[44]
Carbon dots Sensor16.84 µM0–1870 µM[45]
CQDs@Cu-IIP2.86 µM
(0.0016 mg/L)
3.93–31.47, 47.21–157.37 µM
(0.25–2, 3–10 mg/L)
This work
Table 3. Determination of copper in real water samples.
SampleSpike (mg/L)CQDs@Cu-IIP Found (mg/L)Recovery a (%)AAS Found (mg/L)Recovery a (%)
Tap Water00.6468-0.6421-
11.639799.291.630398.82
55.8278103.625.6901100.96
Beichuan River Water00.4592-0.4250-
11.4766101.741.406098.10
55.7301105.425.4970101.44
a Mean ± standard deviation. (n = 7).
Publisher’s Note: MDPI stays neutral with regard to jurisdictional claims in published maps and institutional affiliations.

