
Characteristic Tearing Energy and Fatigue Crack Propagation of Filled Natural Rubber


Abstract
:1. Introduction
2. Tearing Energy and Fatigue Crack Propagation Law
3. Experiments
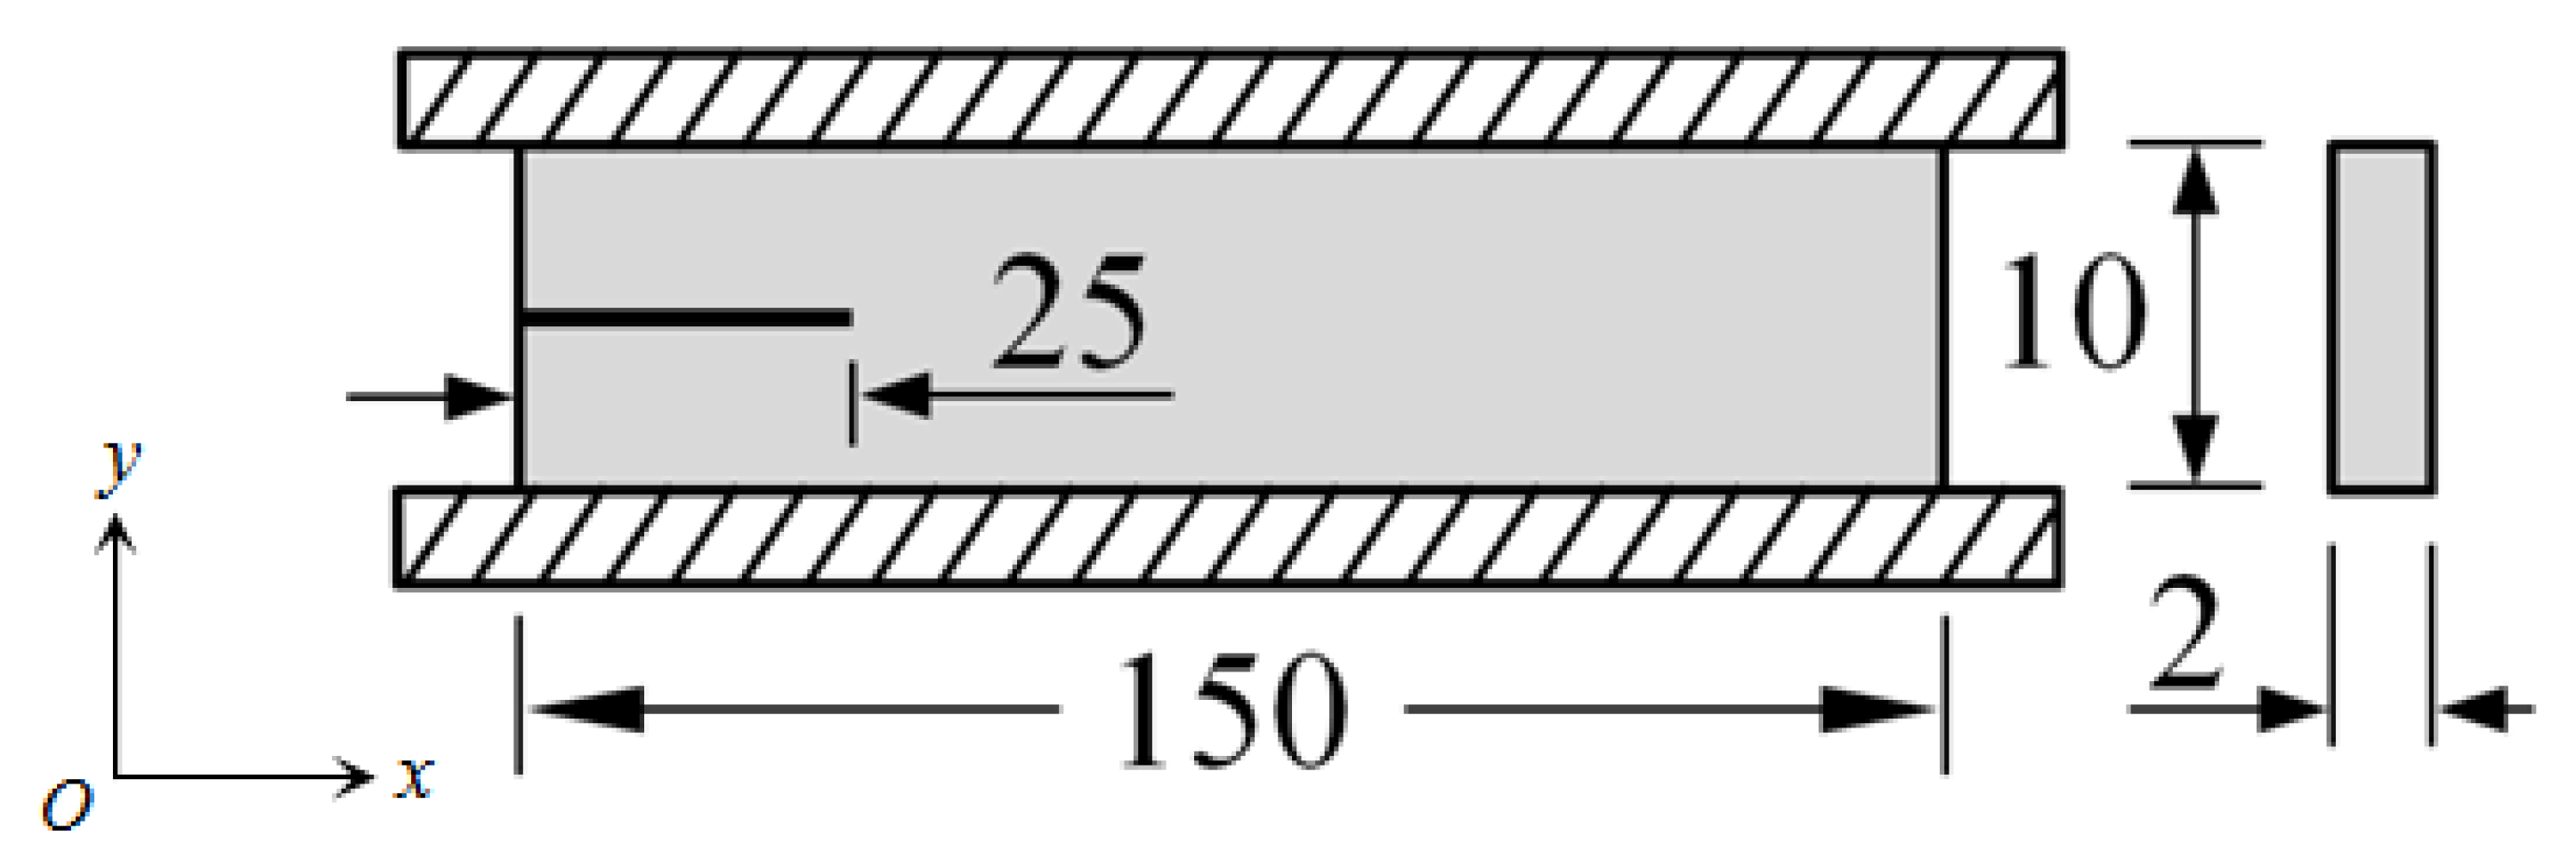
3.1. Specimen
3.2. Pure Shear Tension Experiment
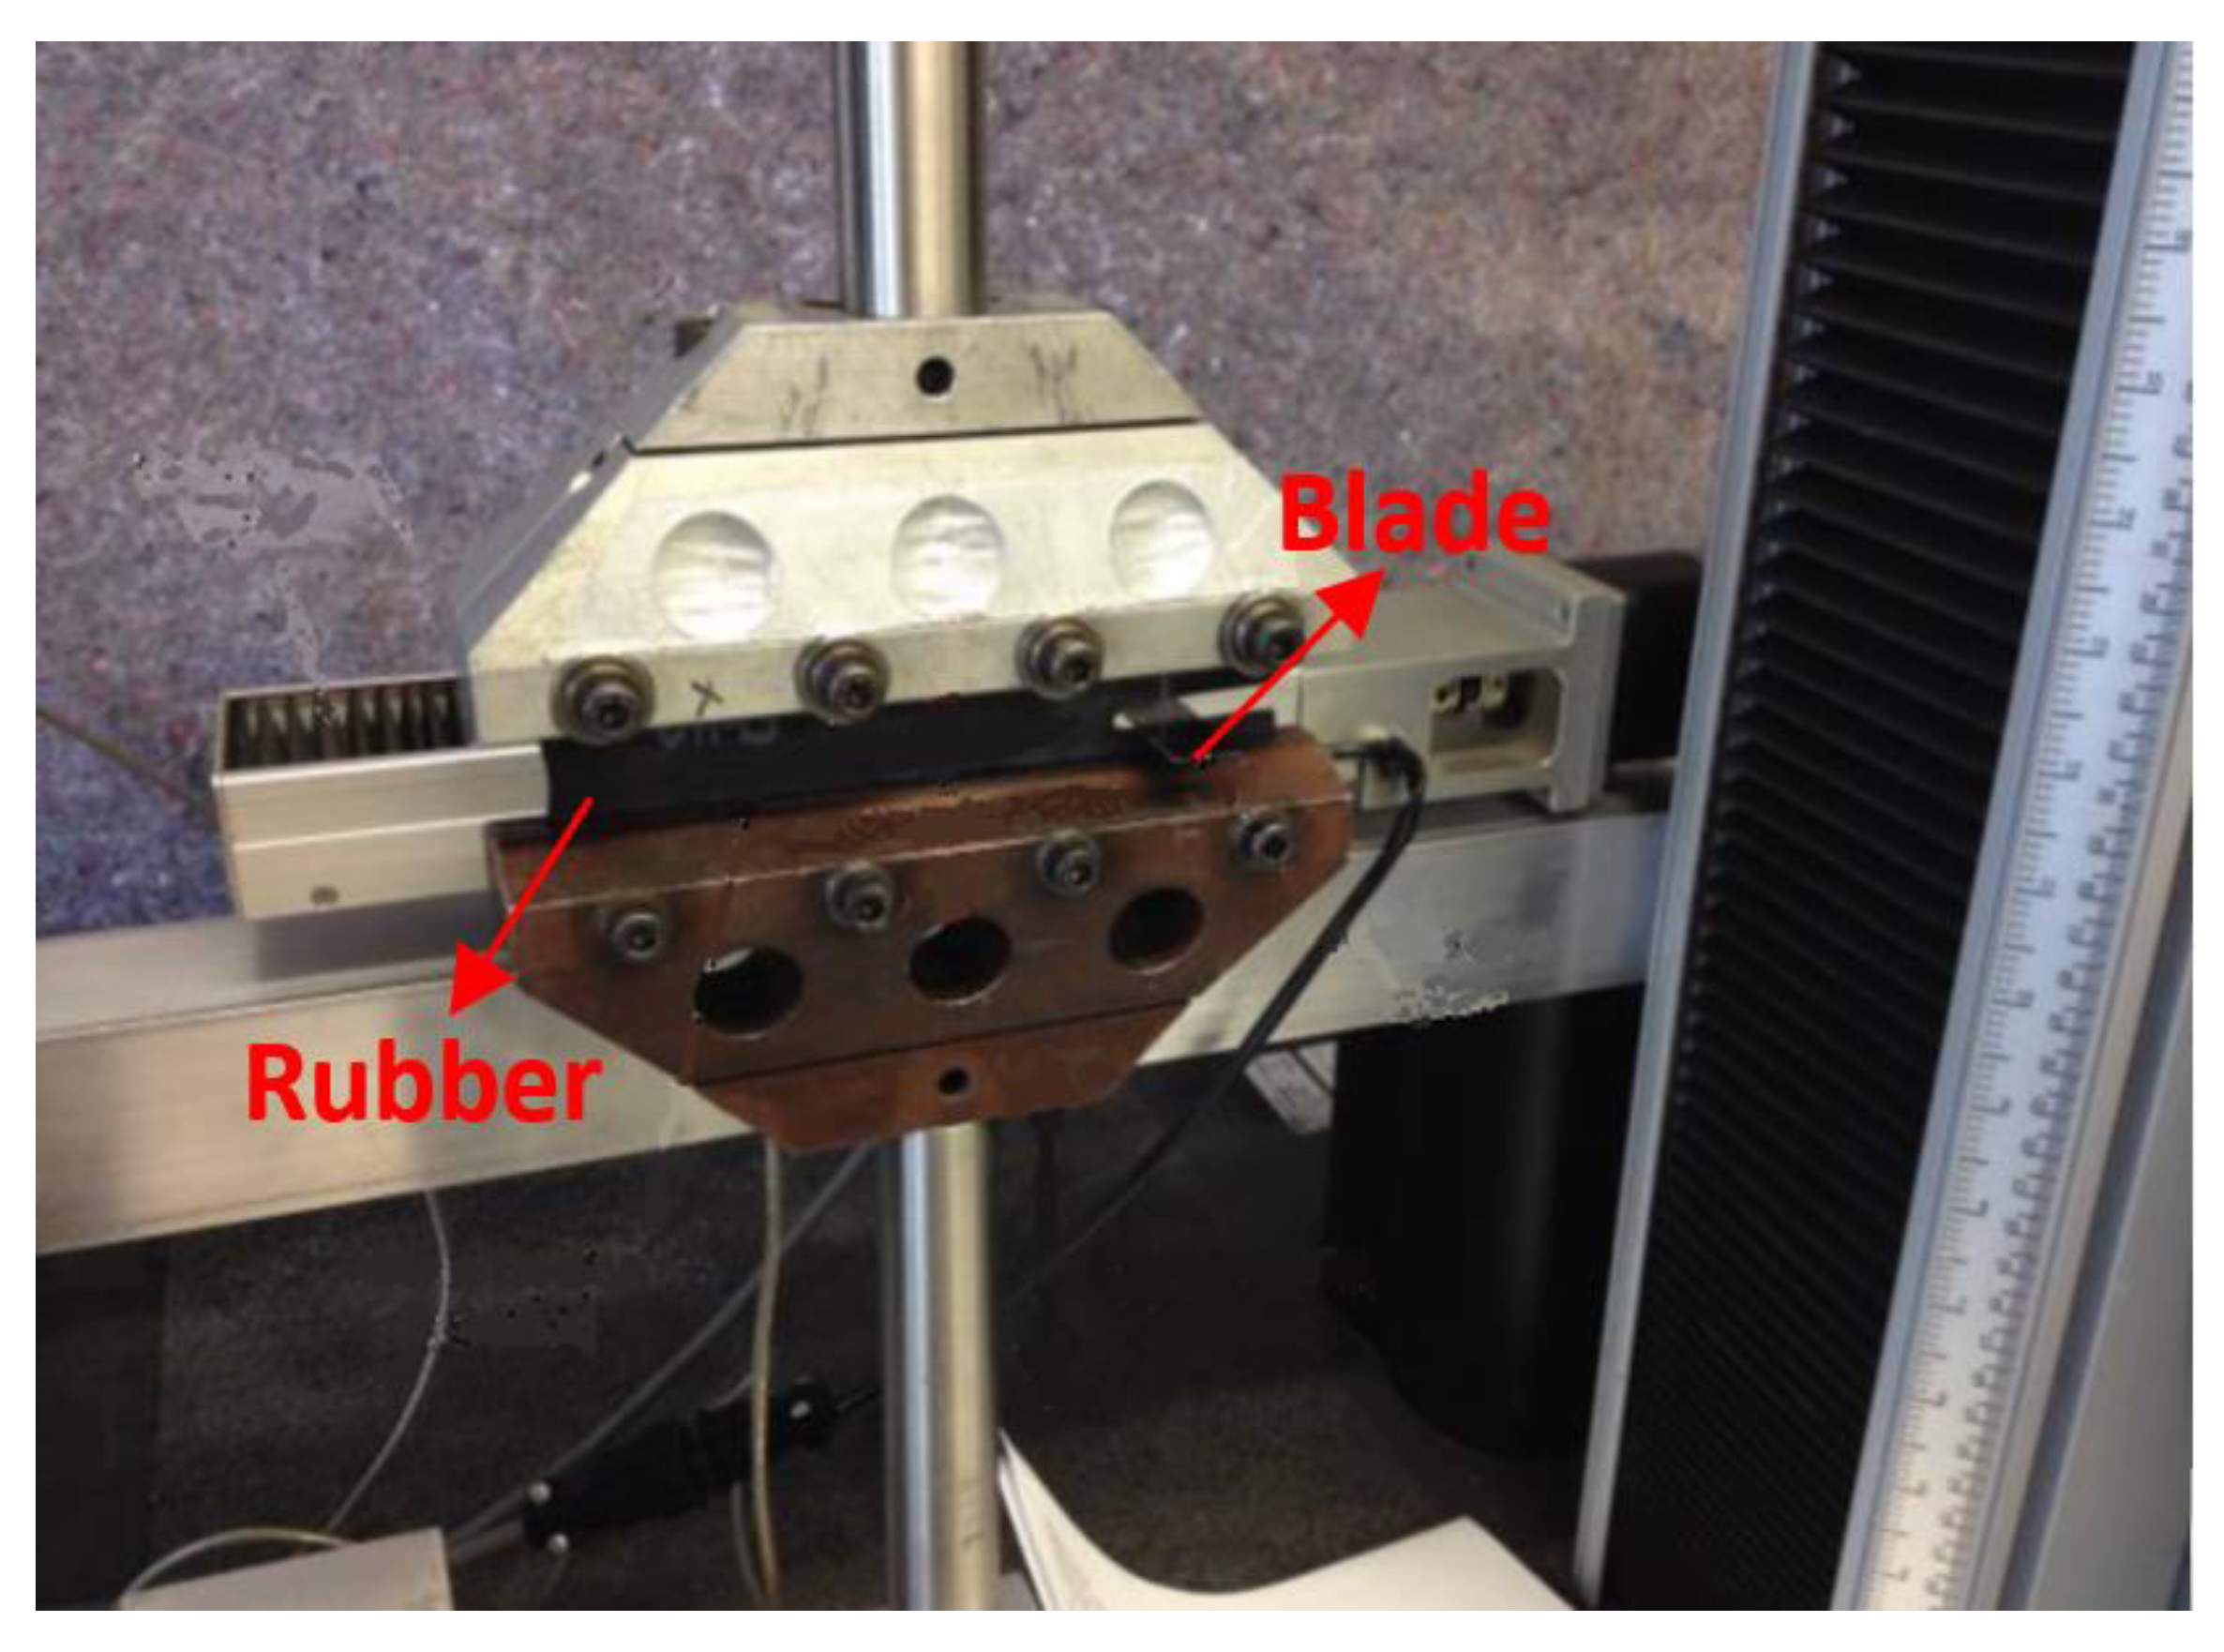
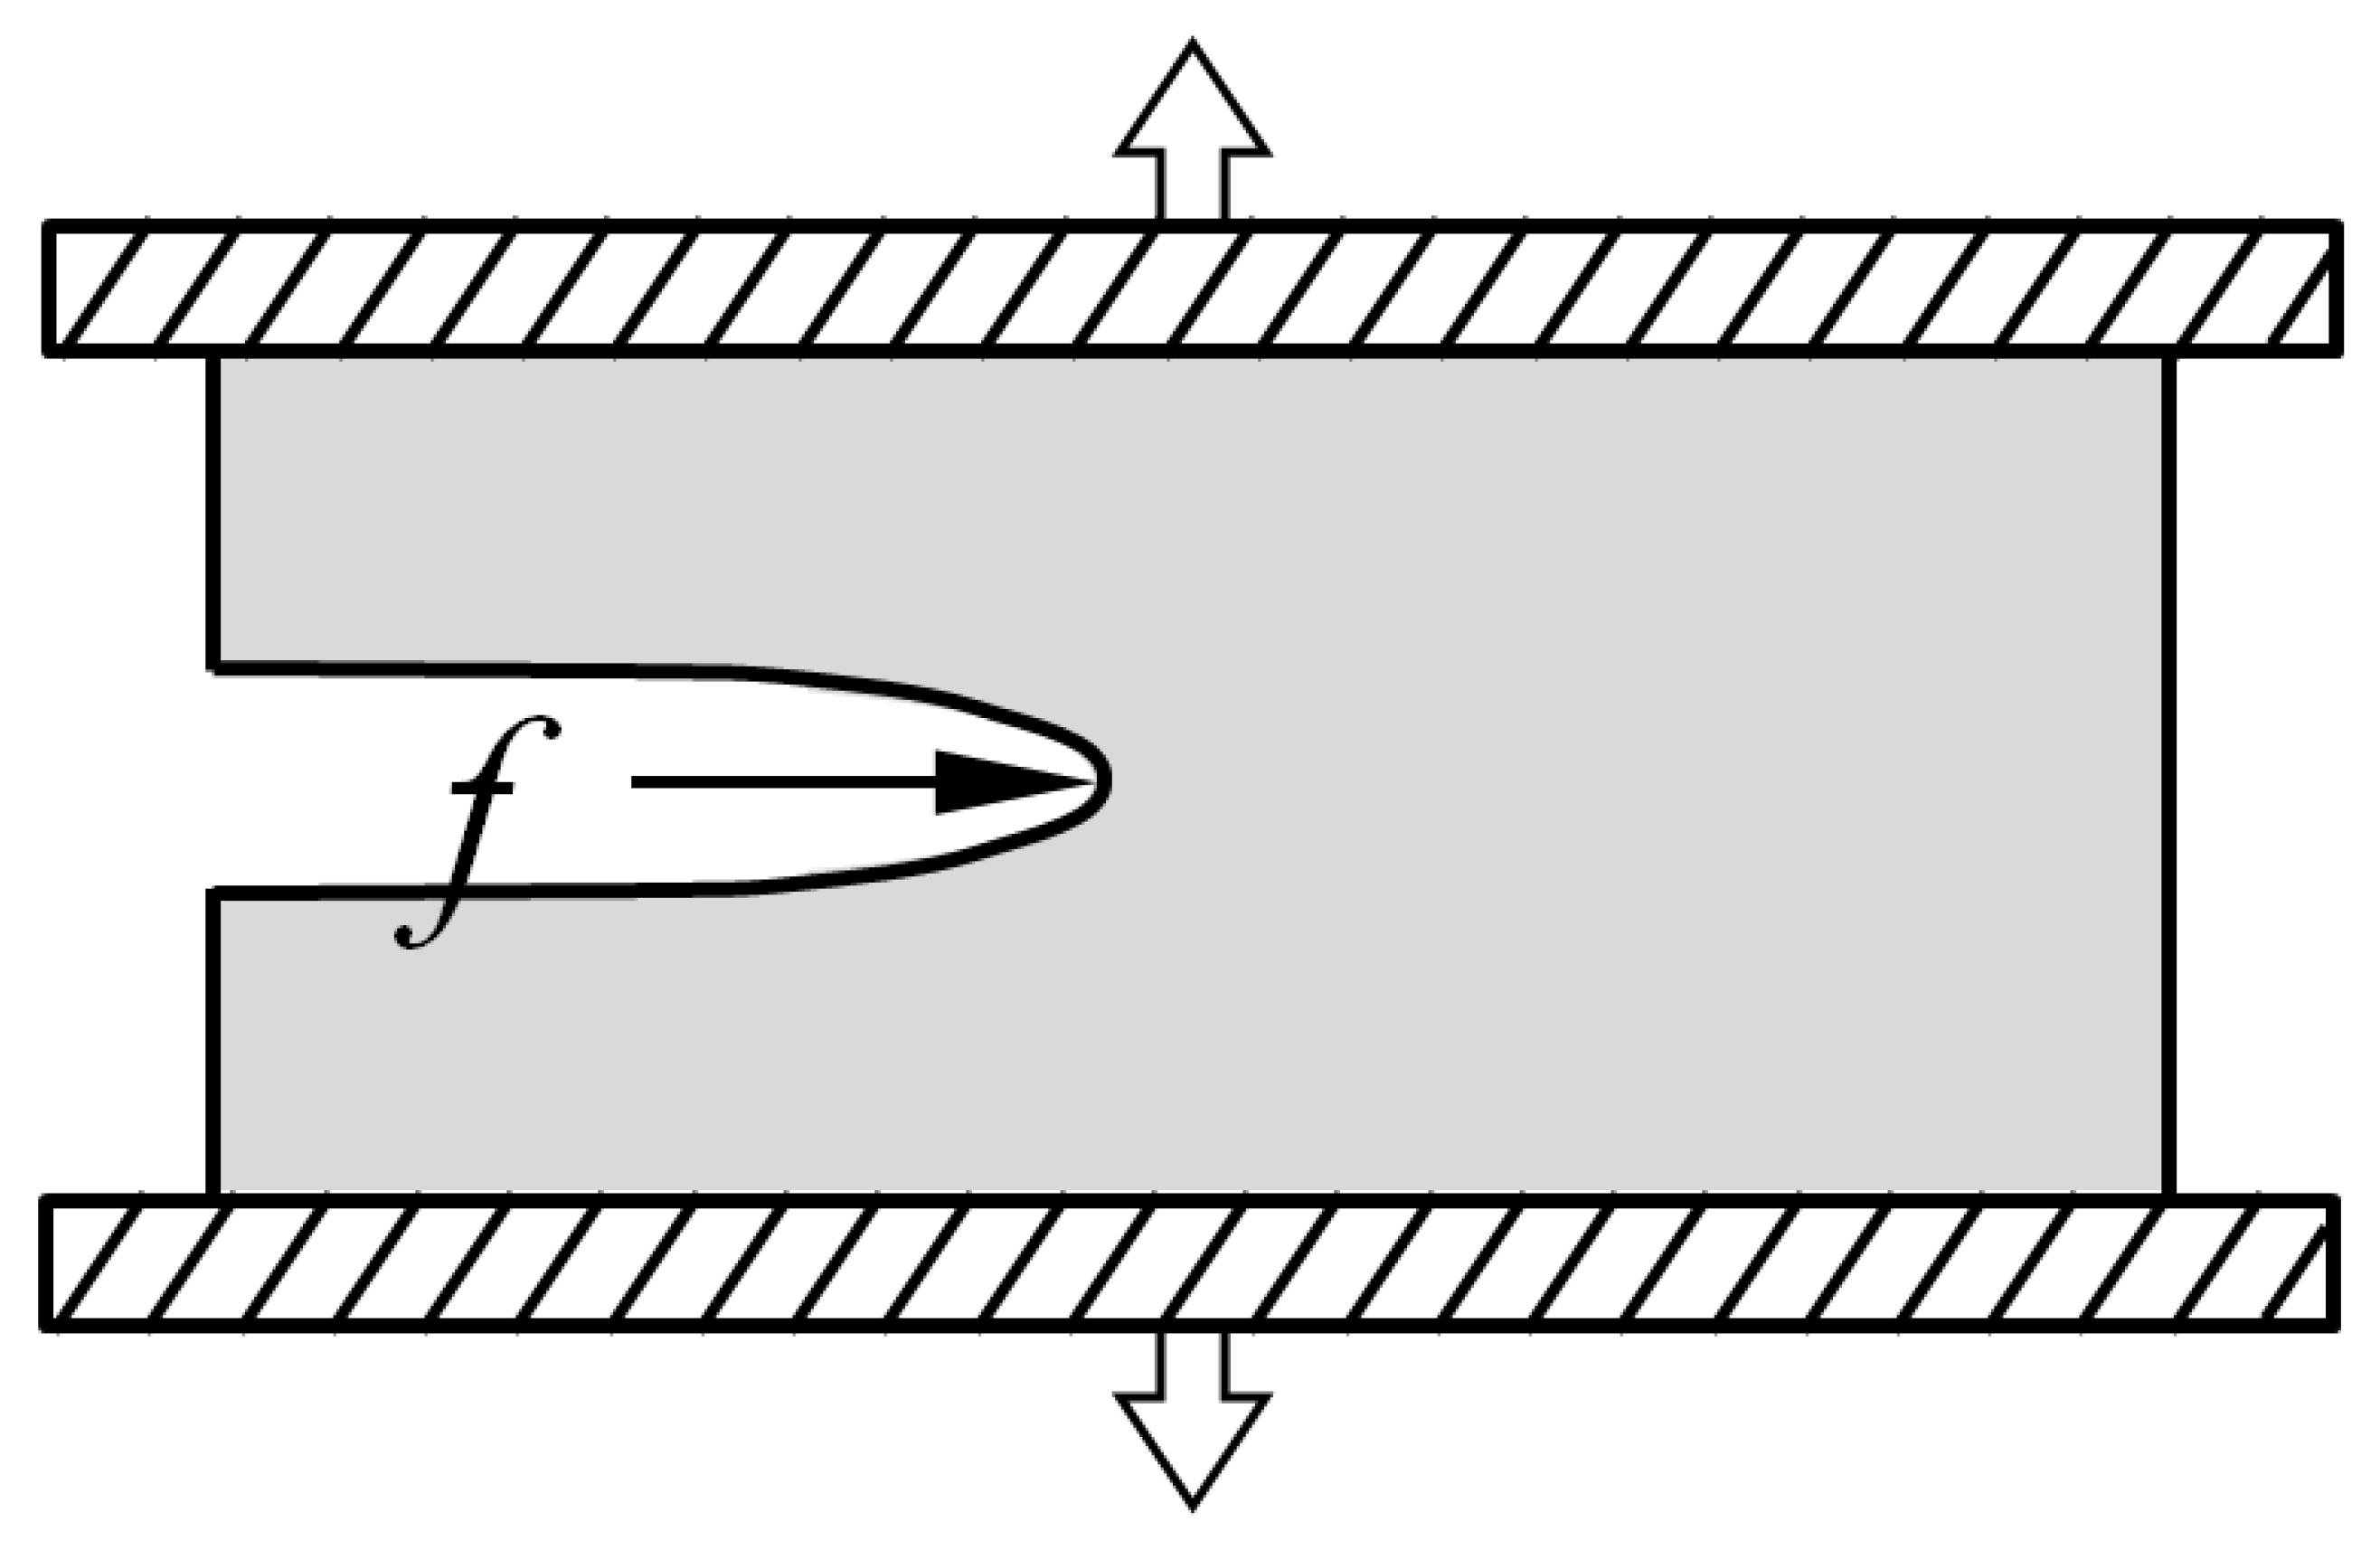
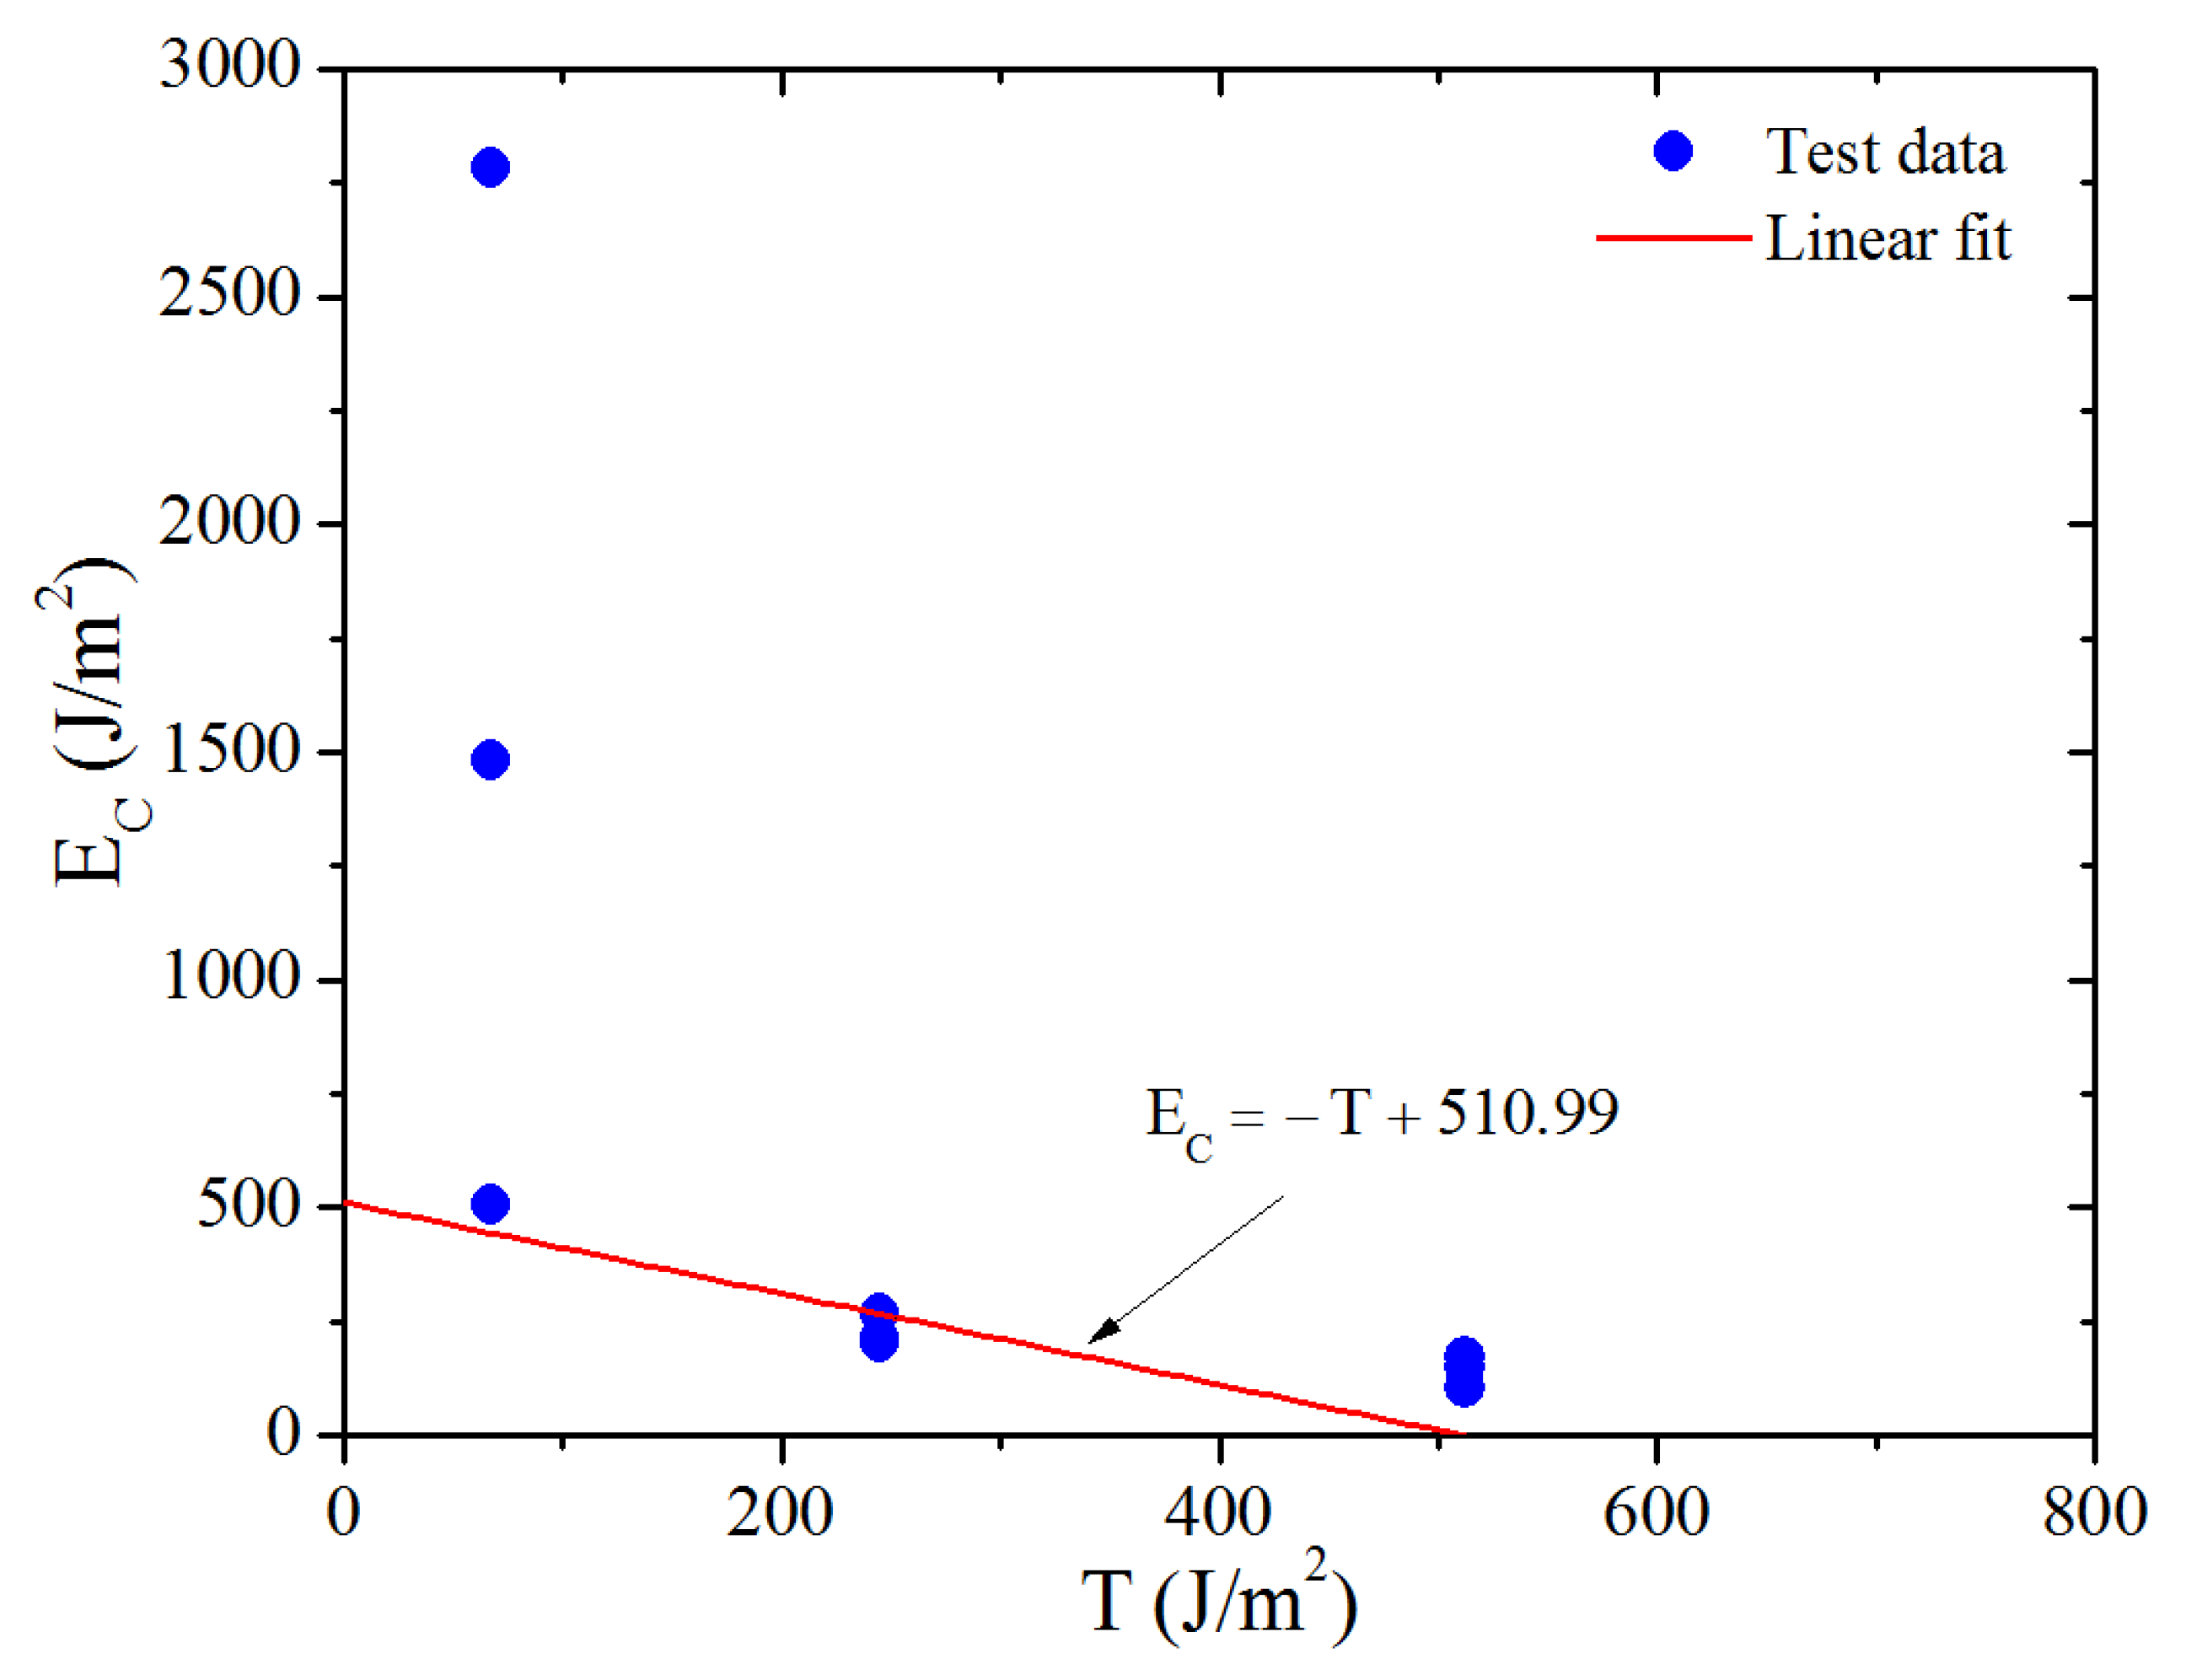
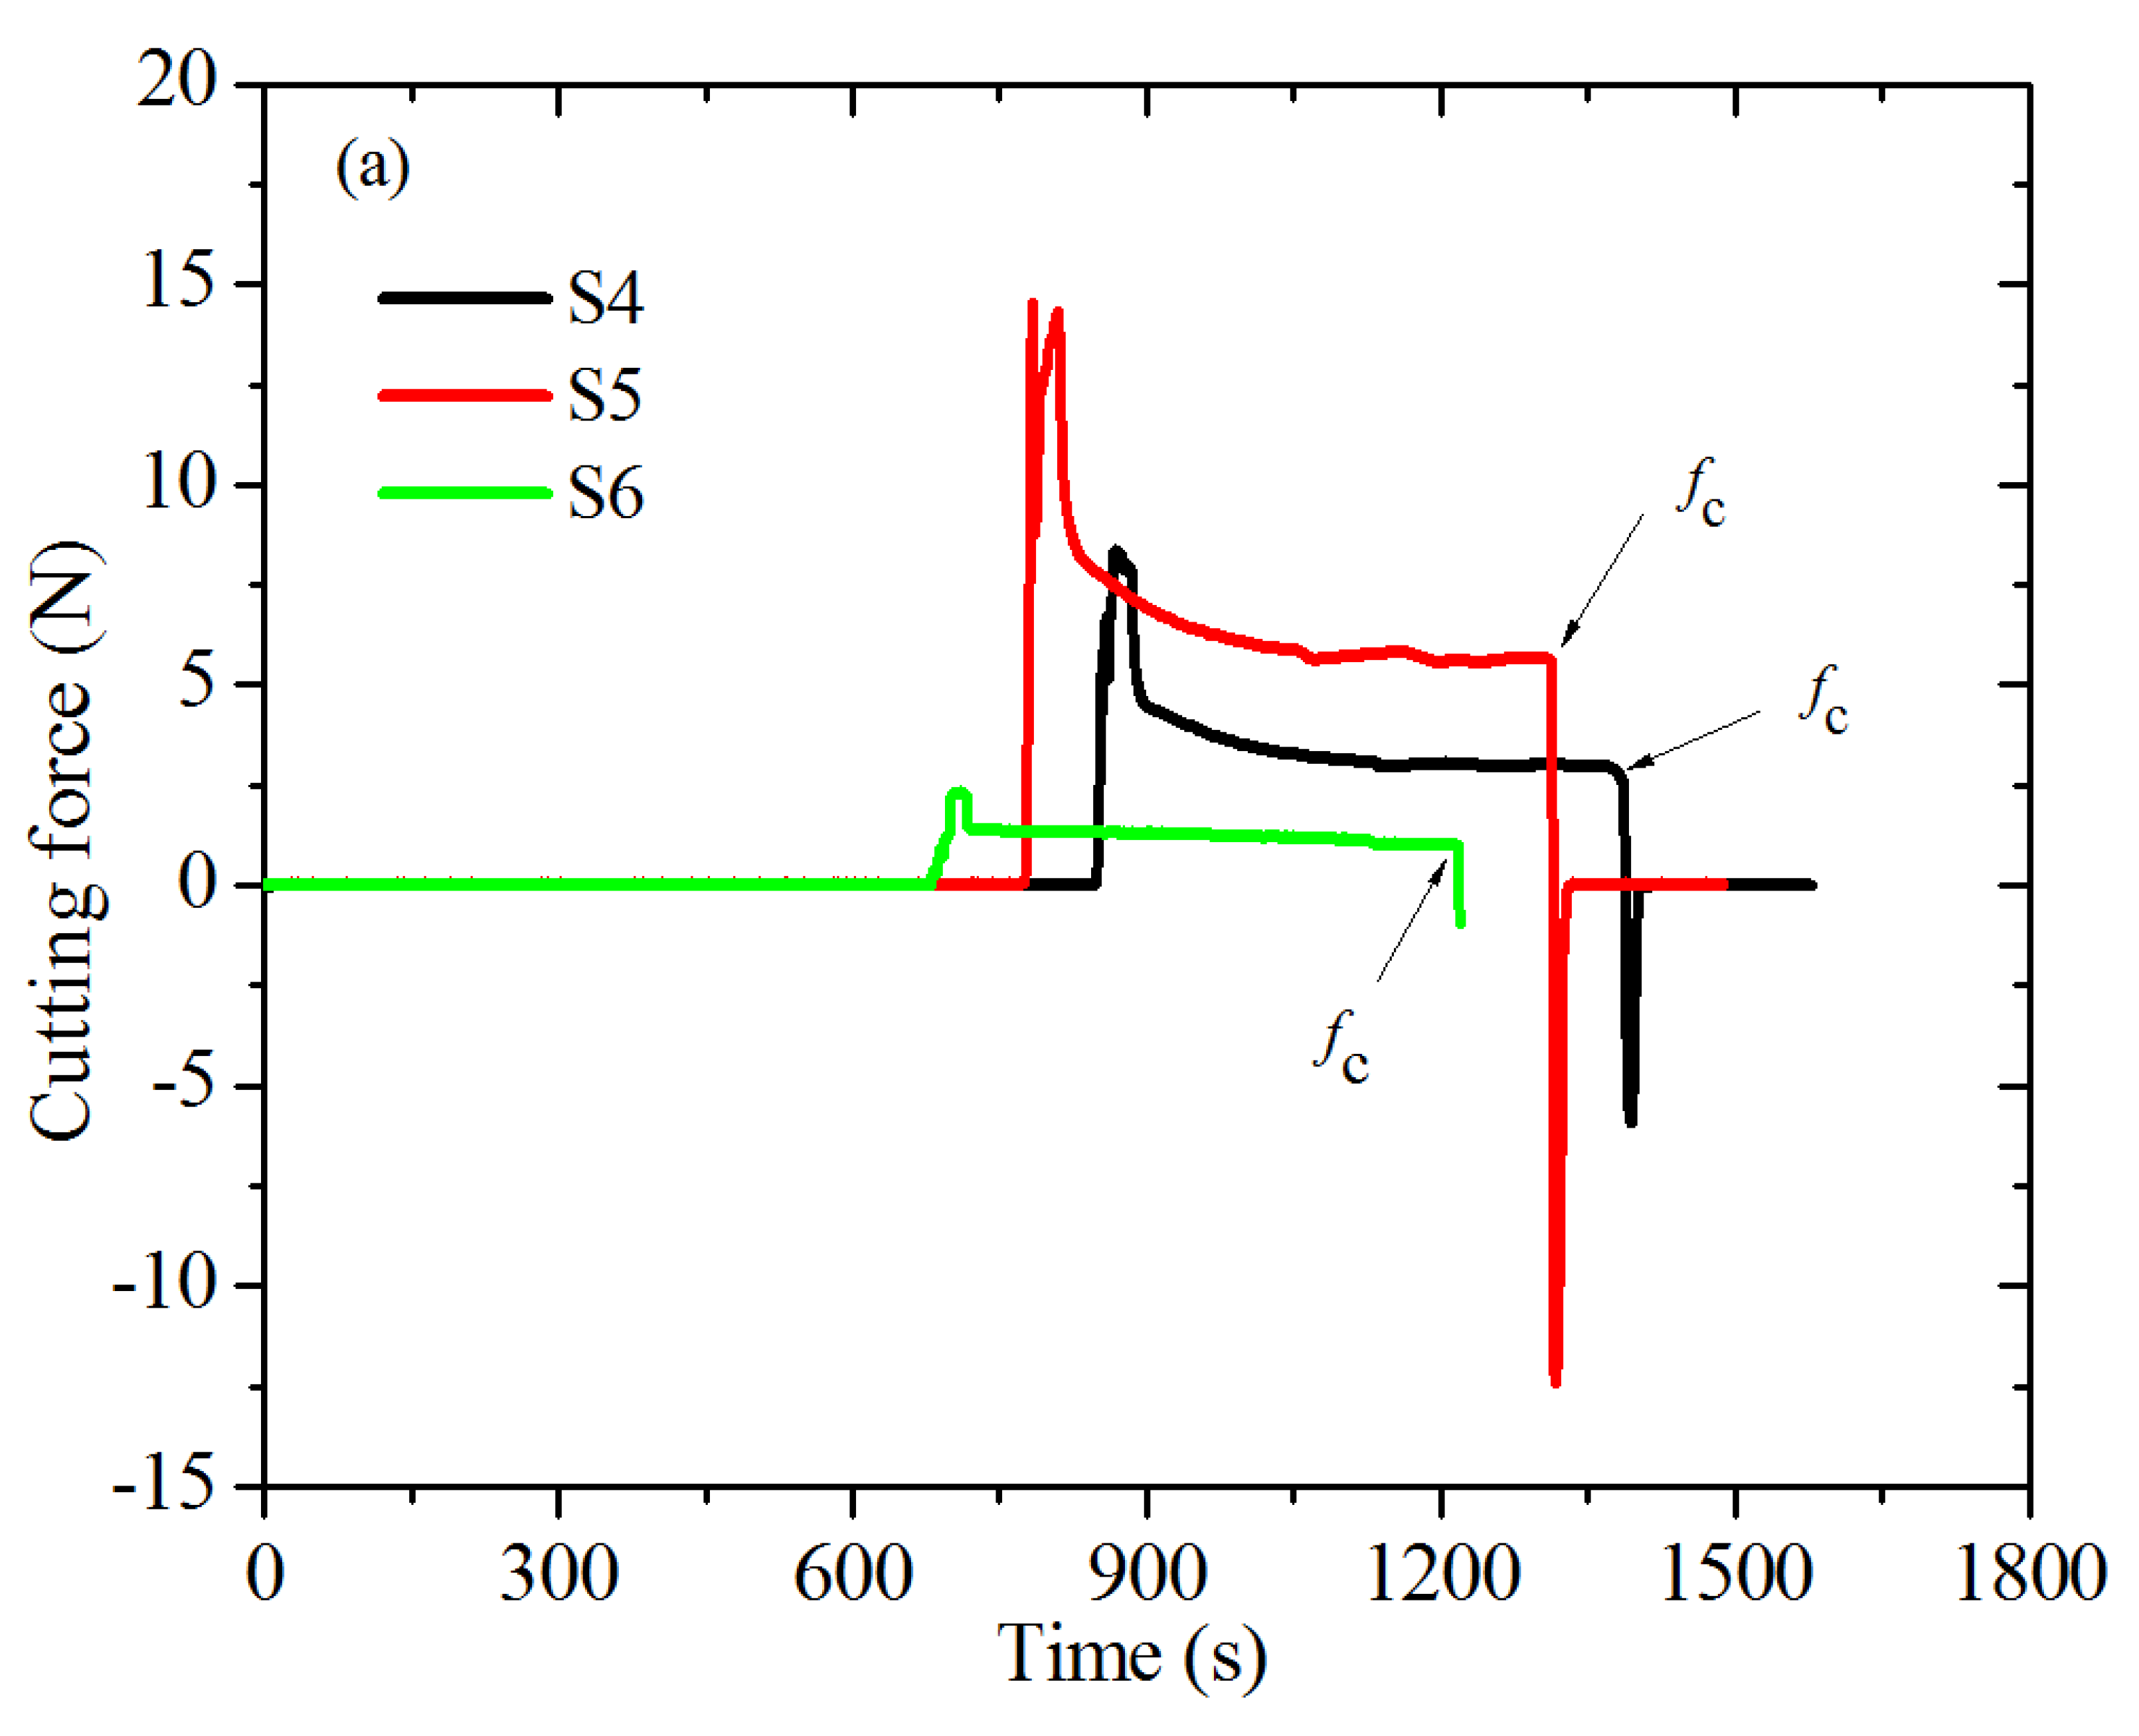
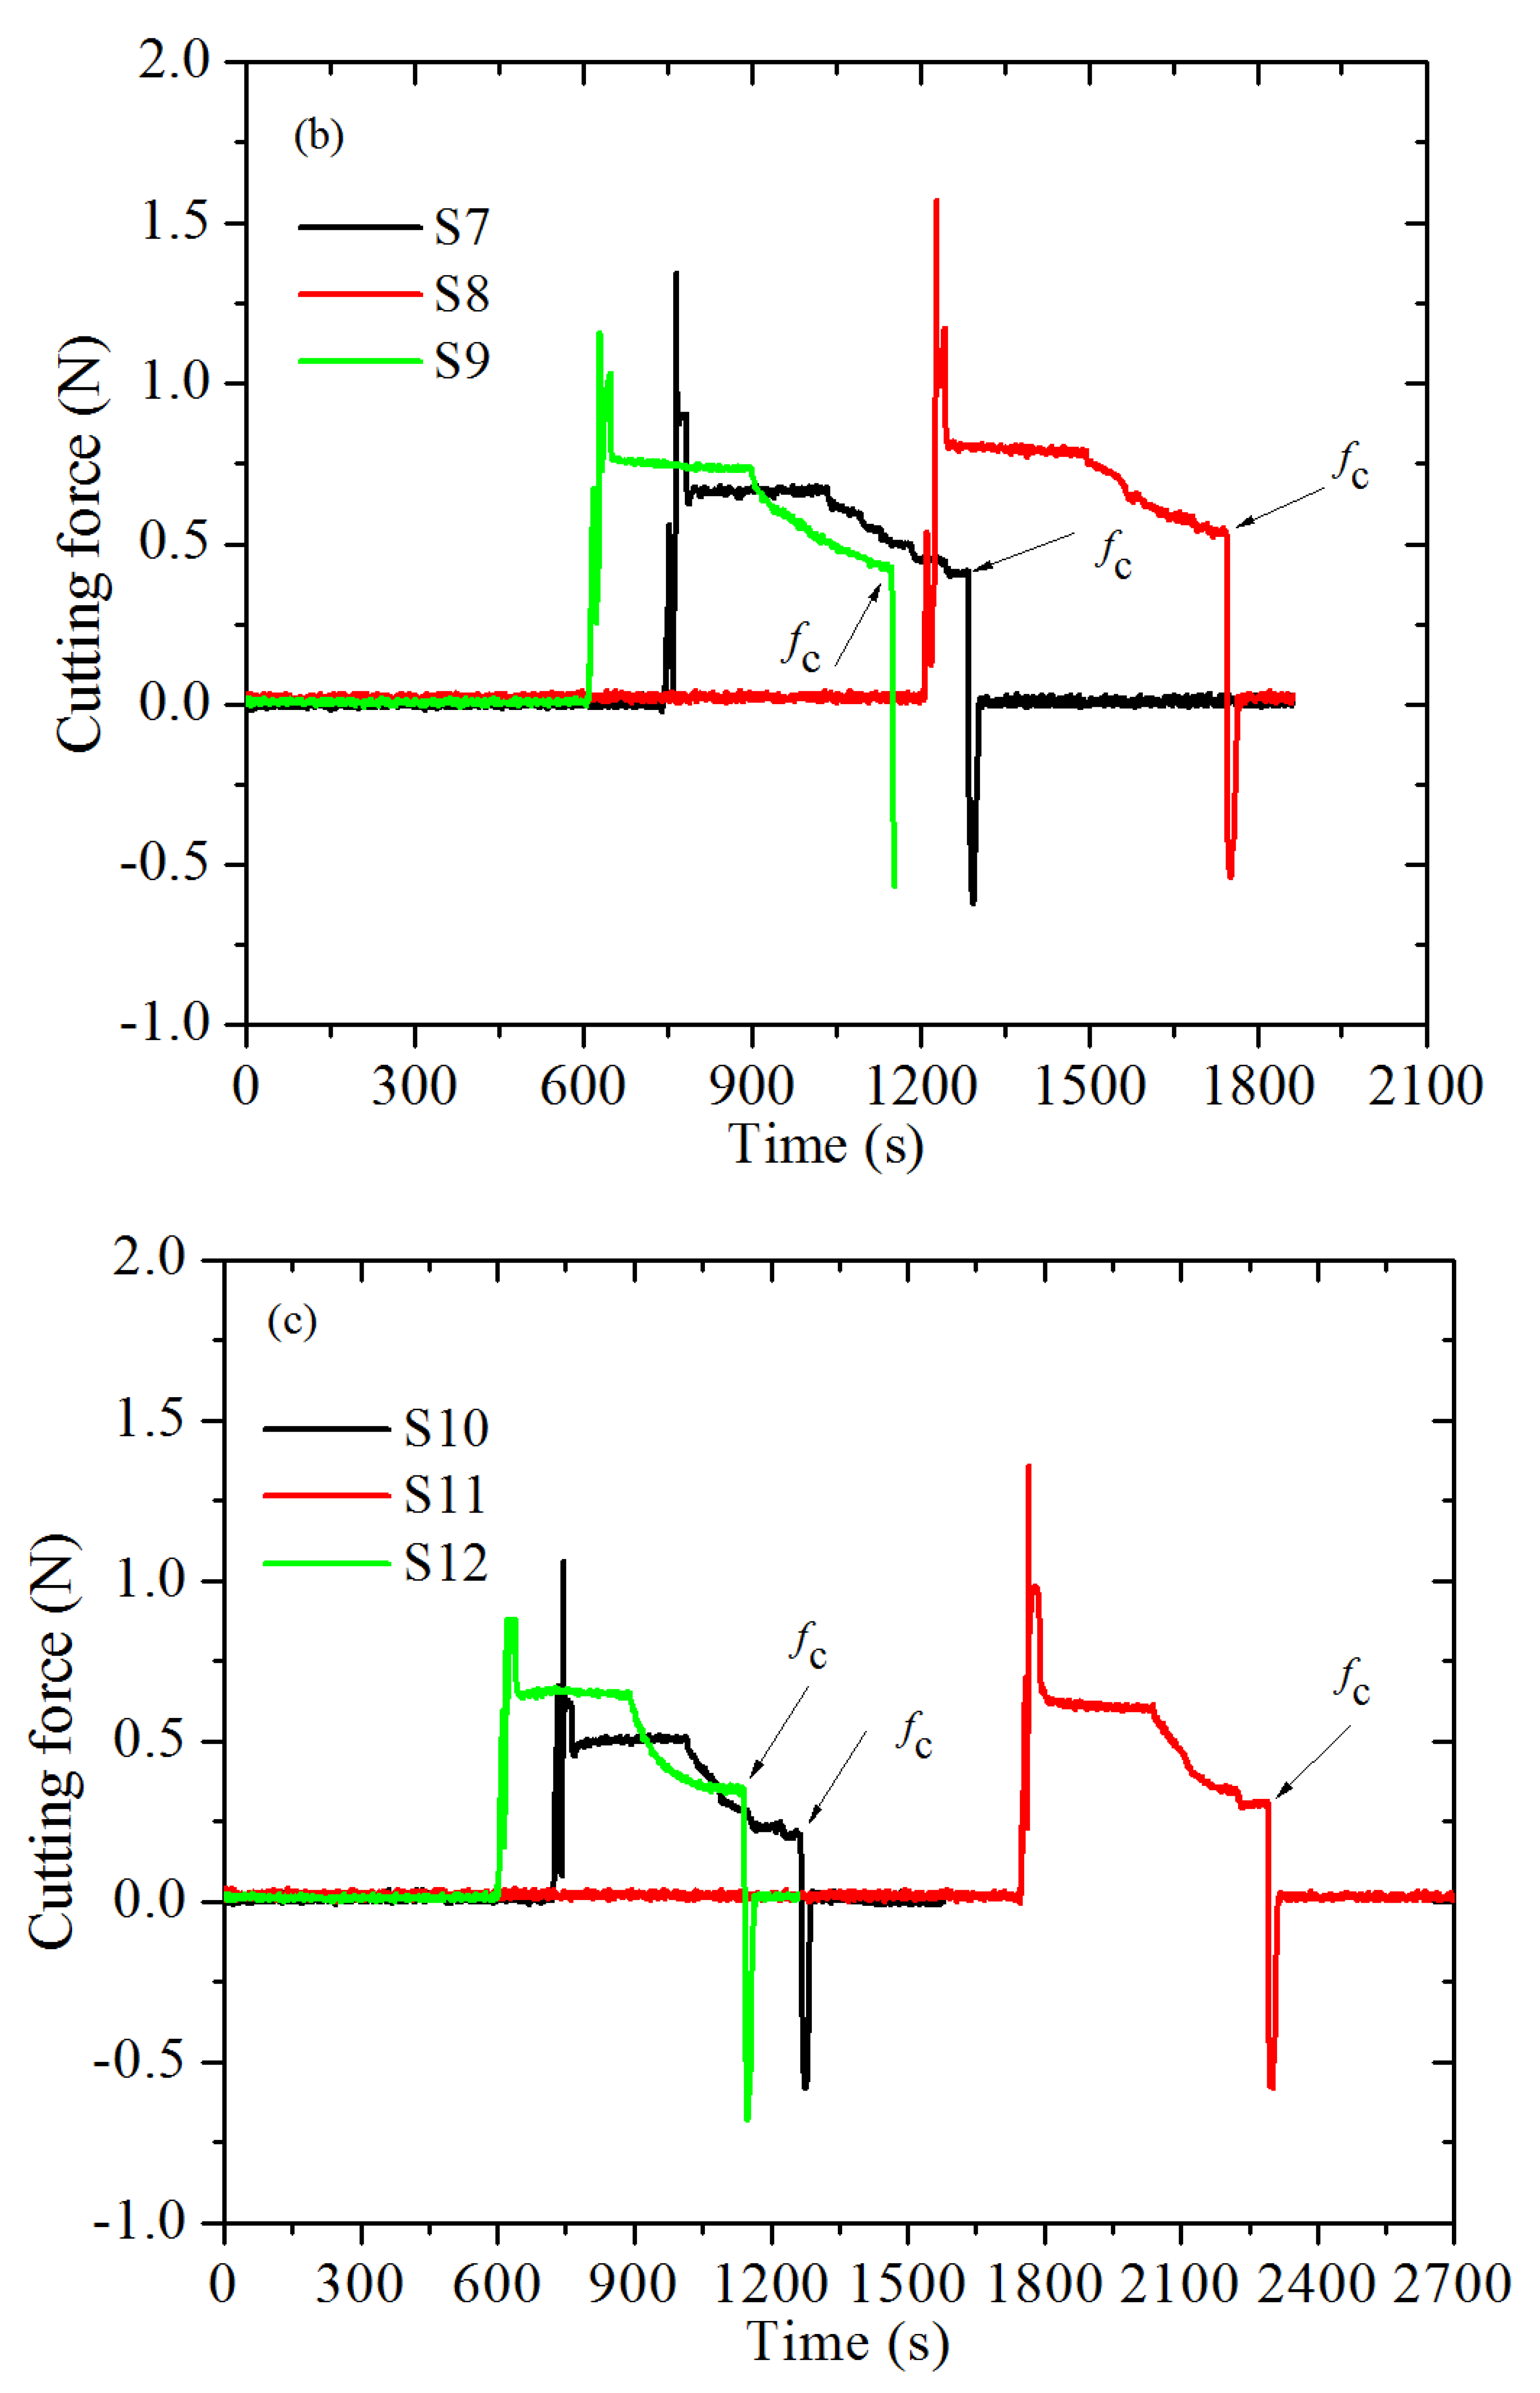
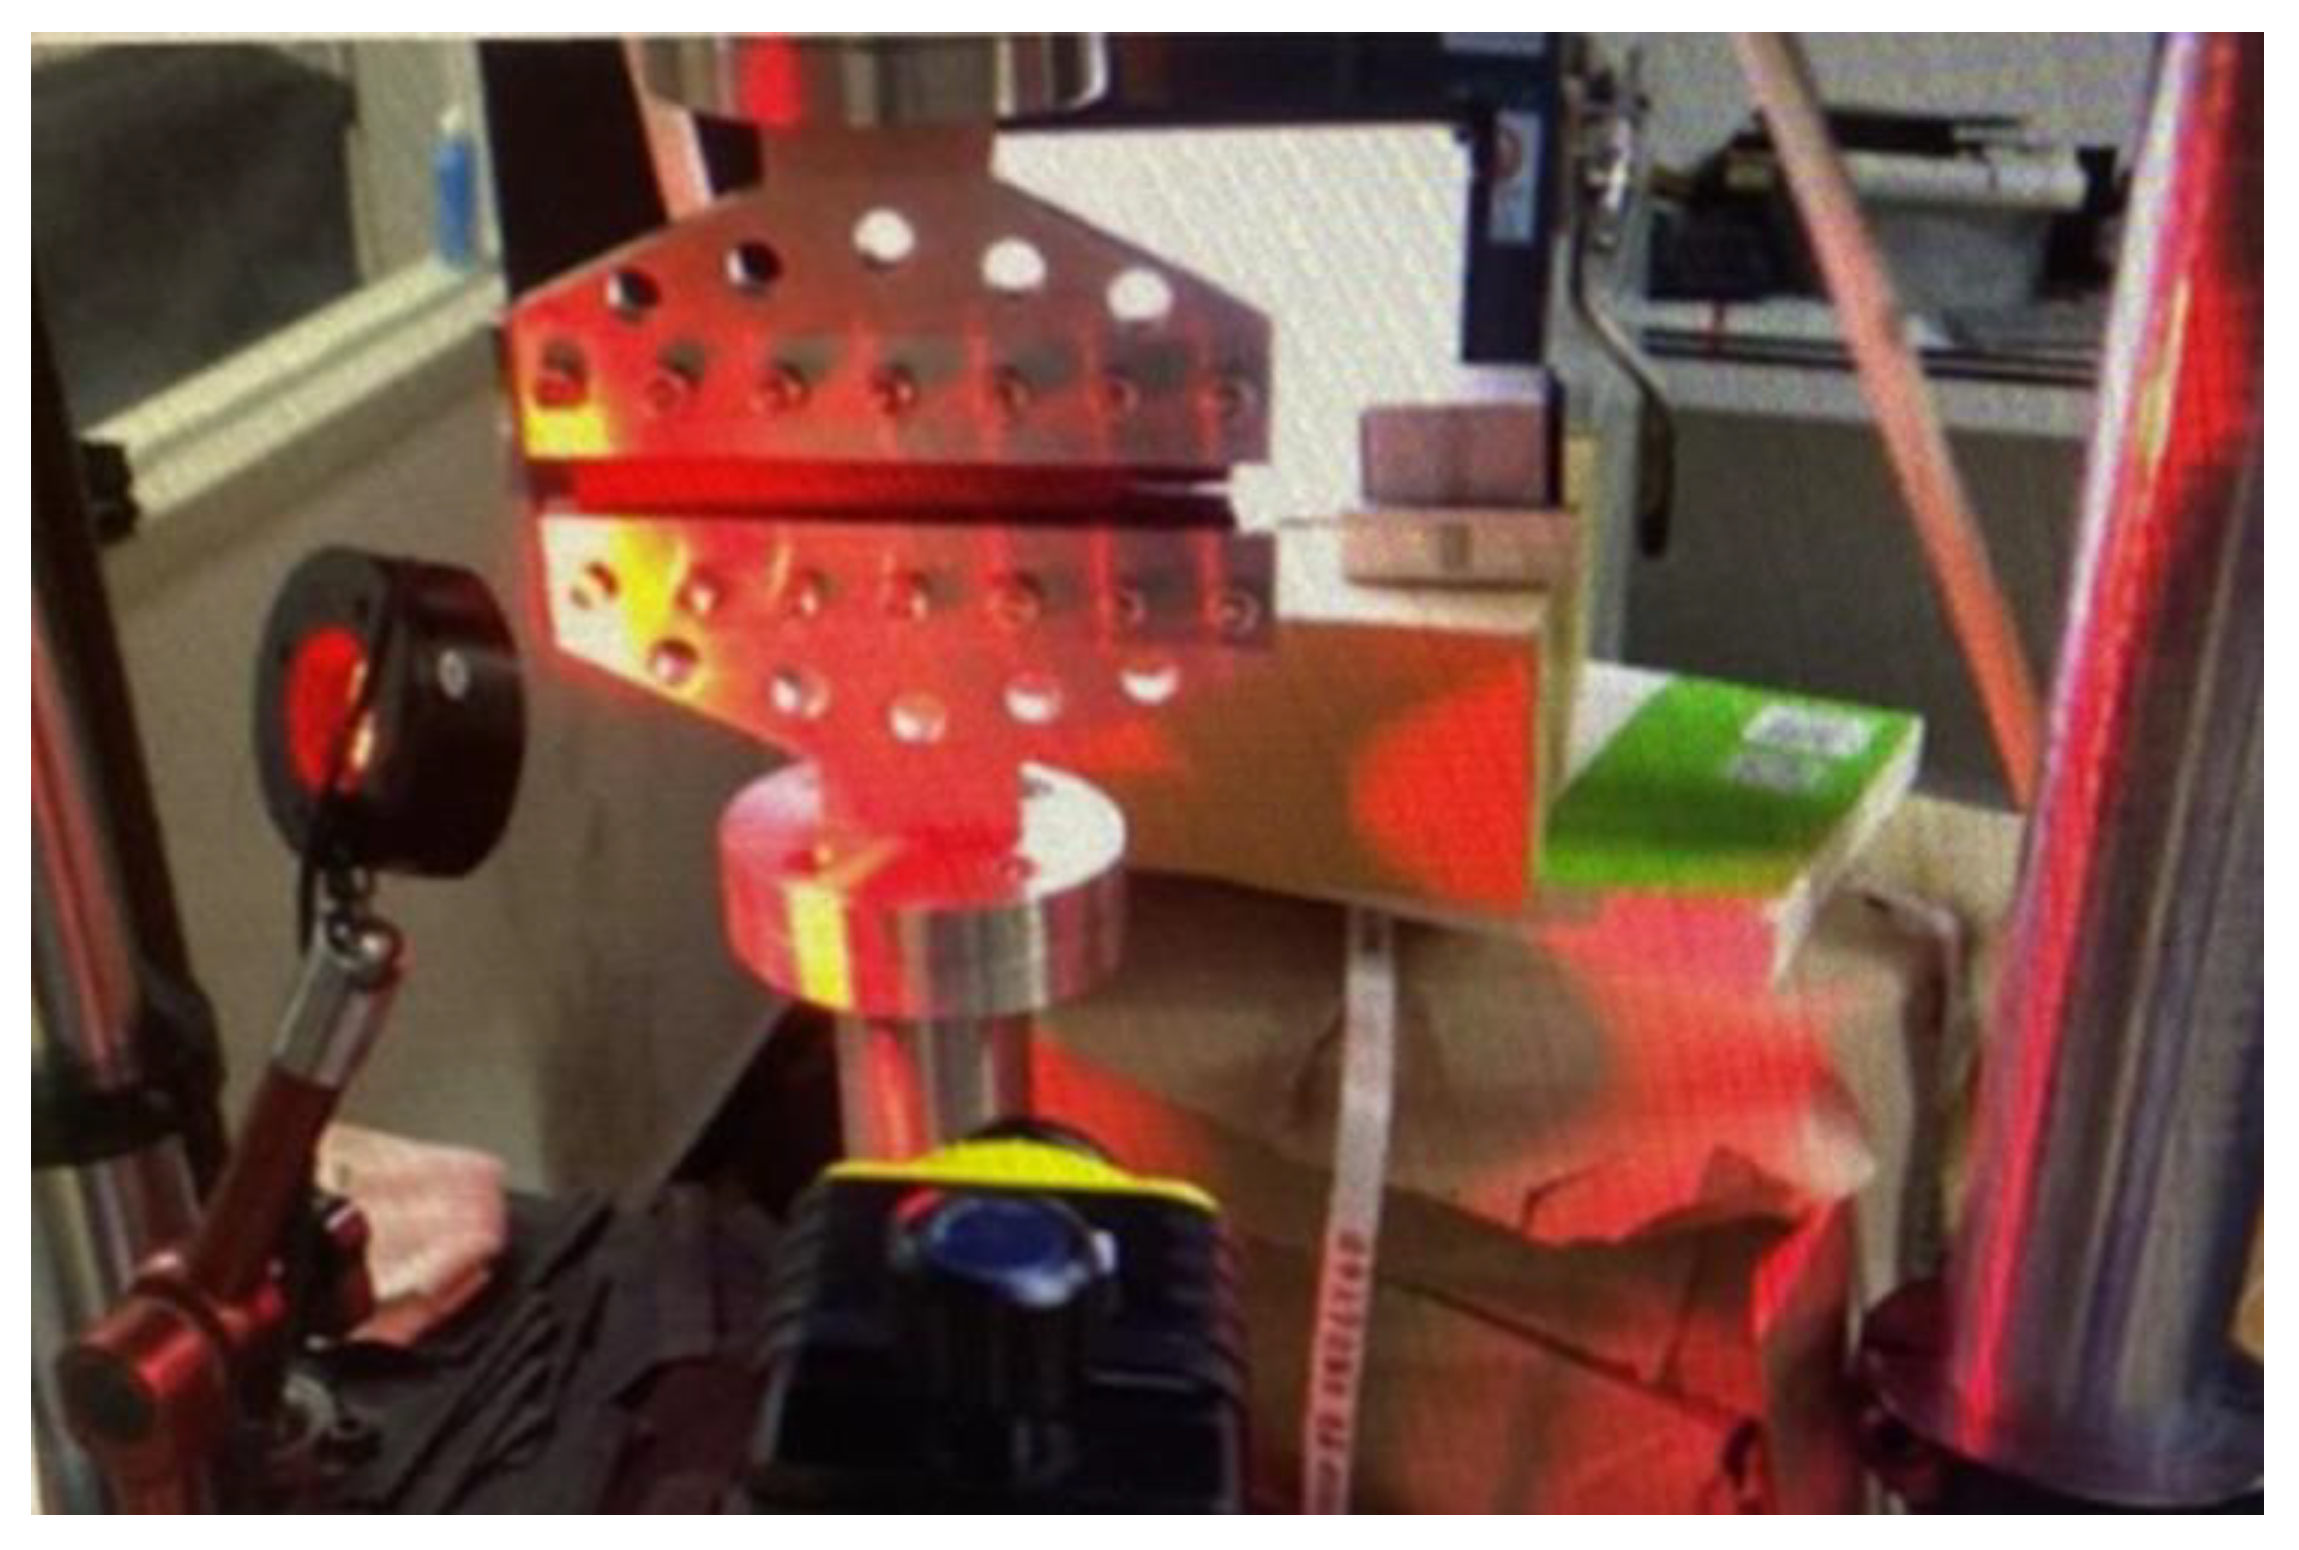
3.3. Rubber Cutting Experiment
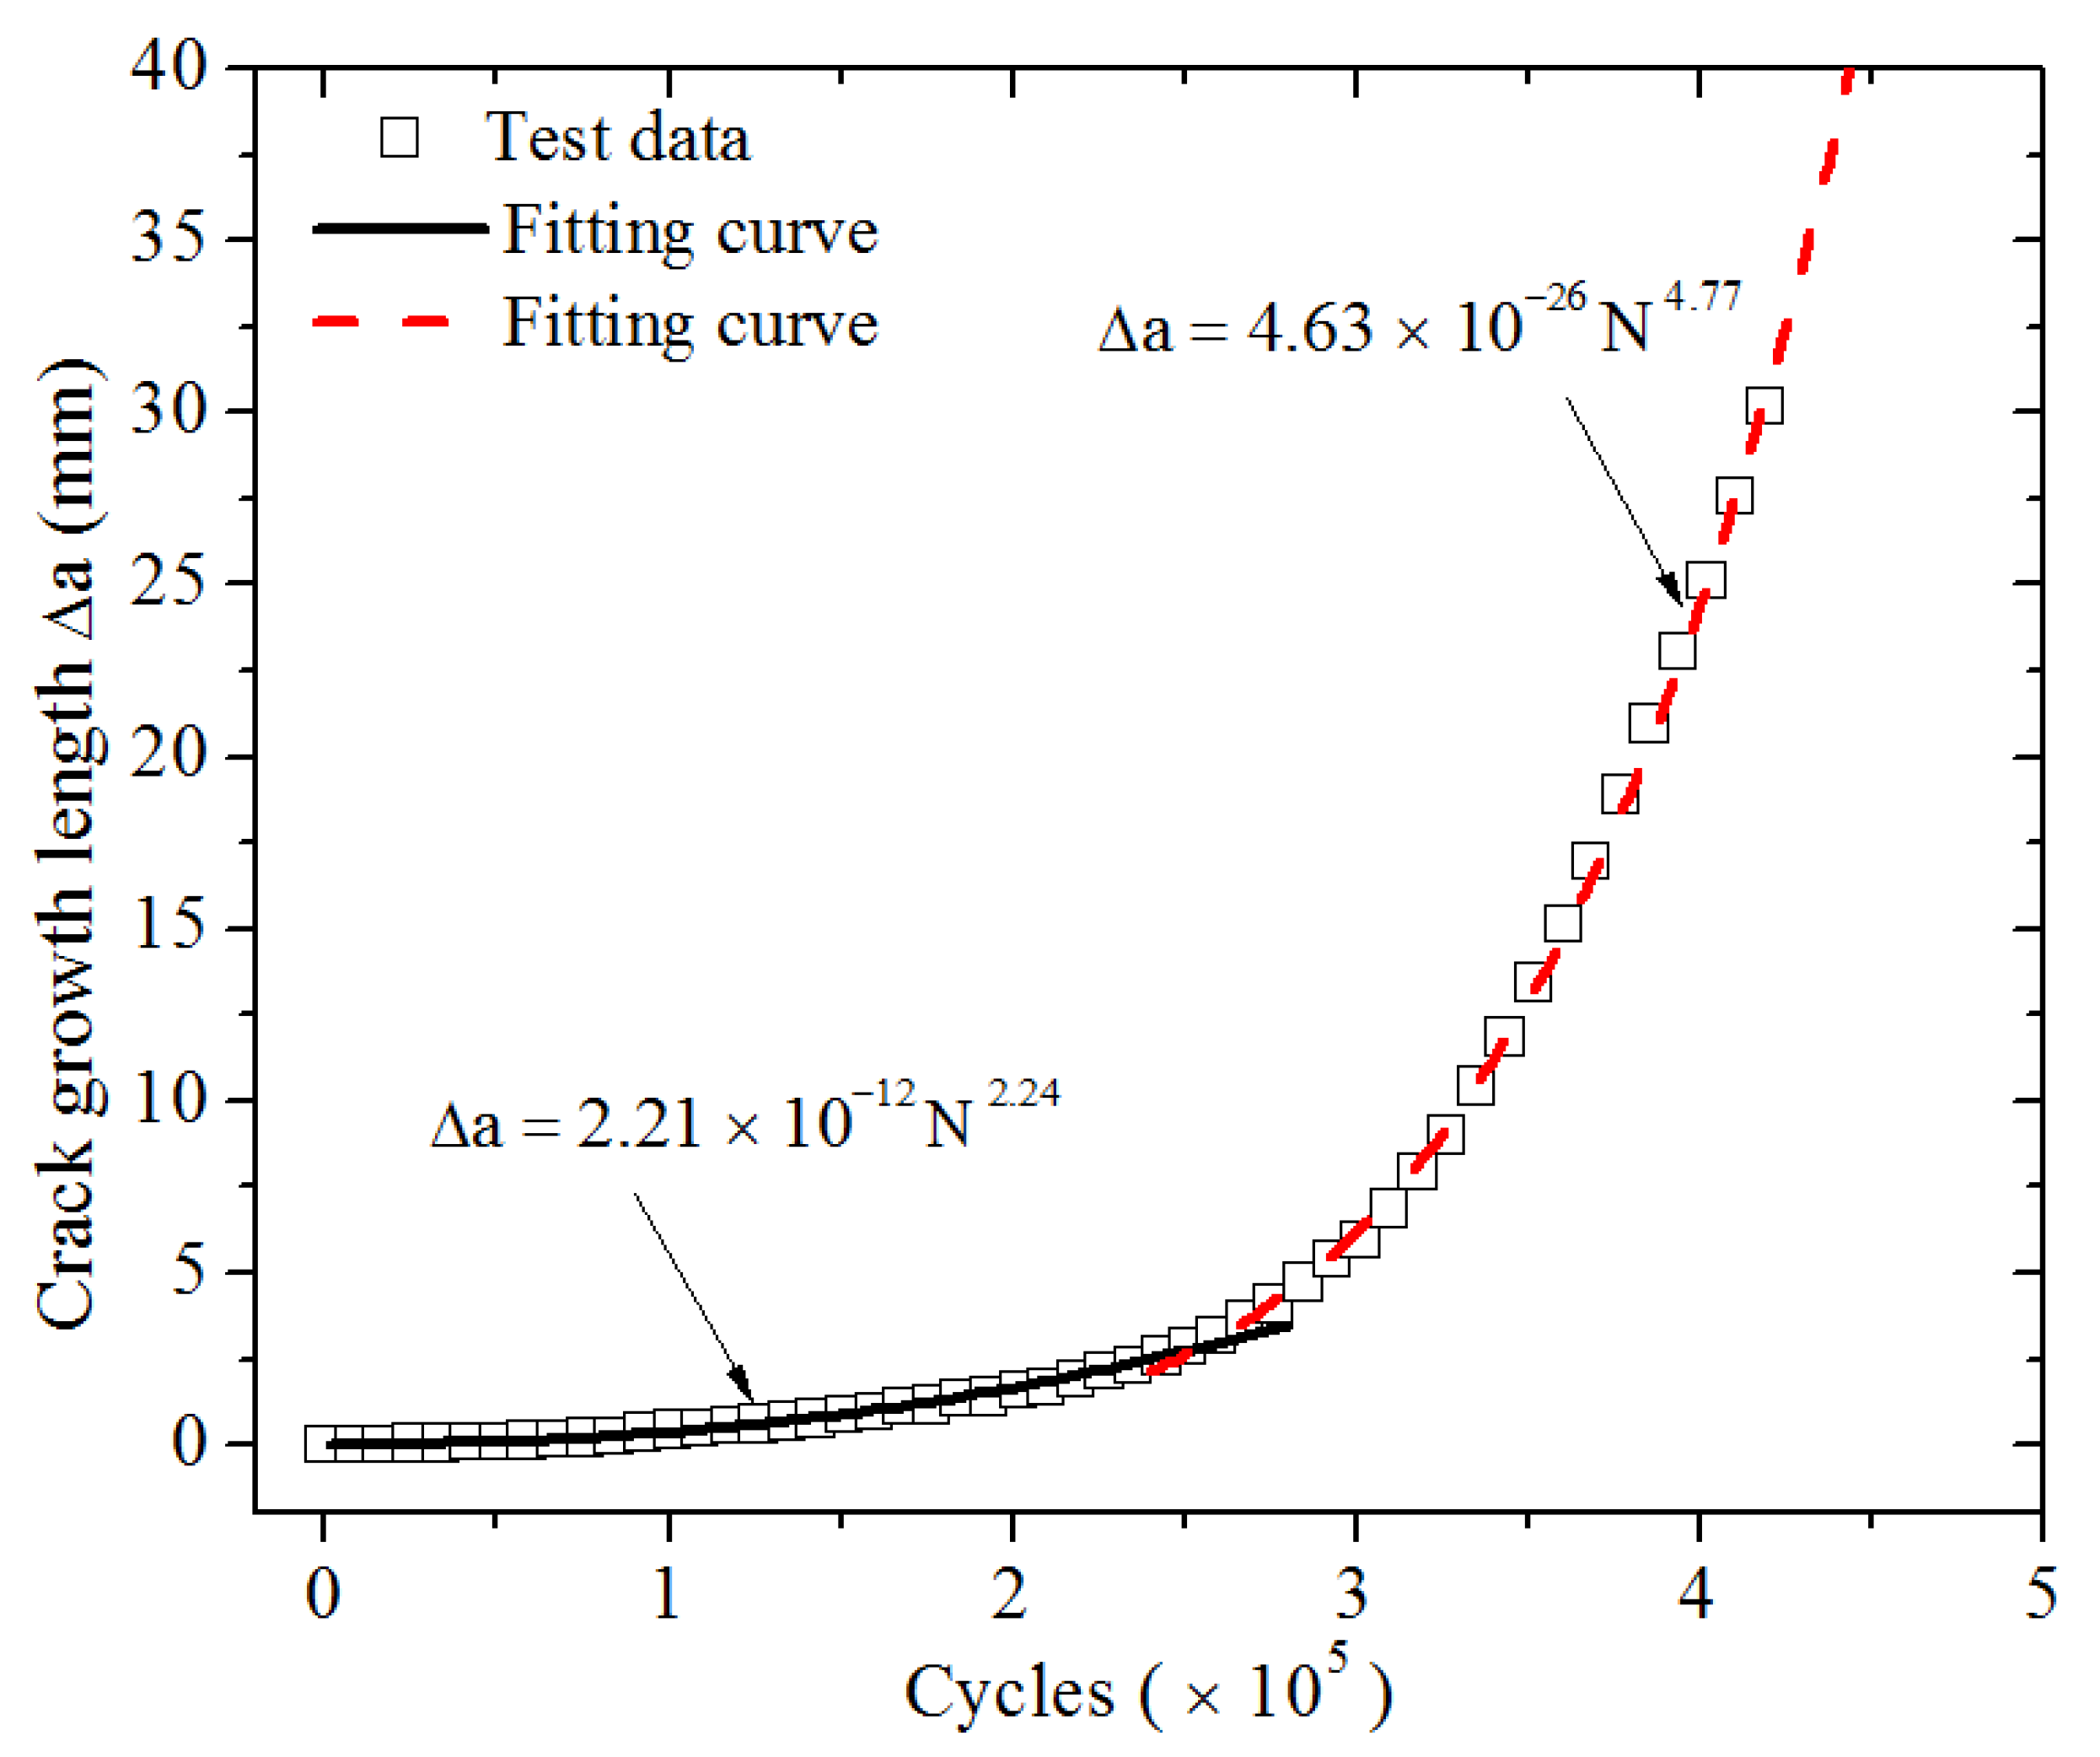
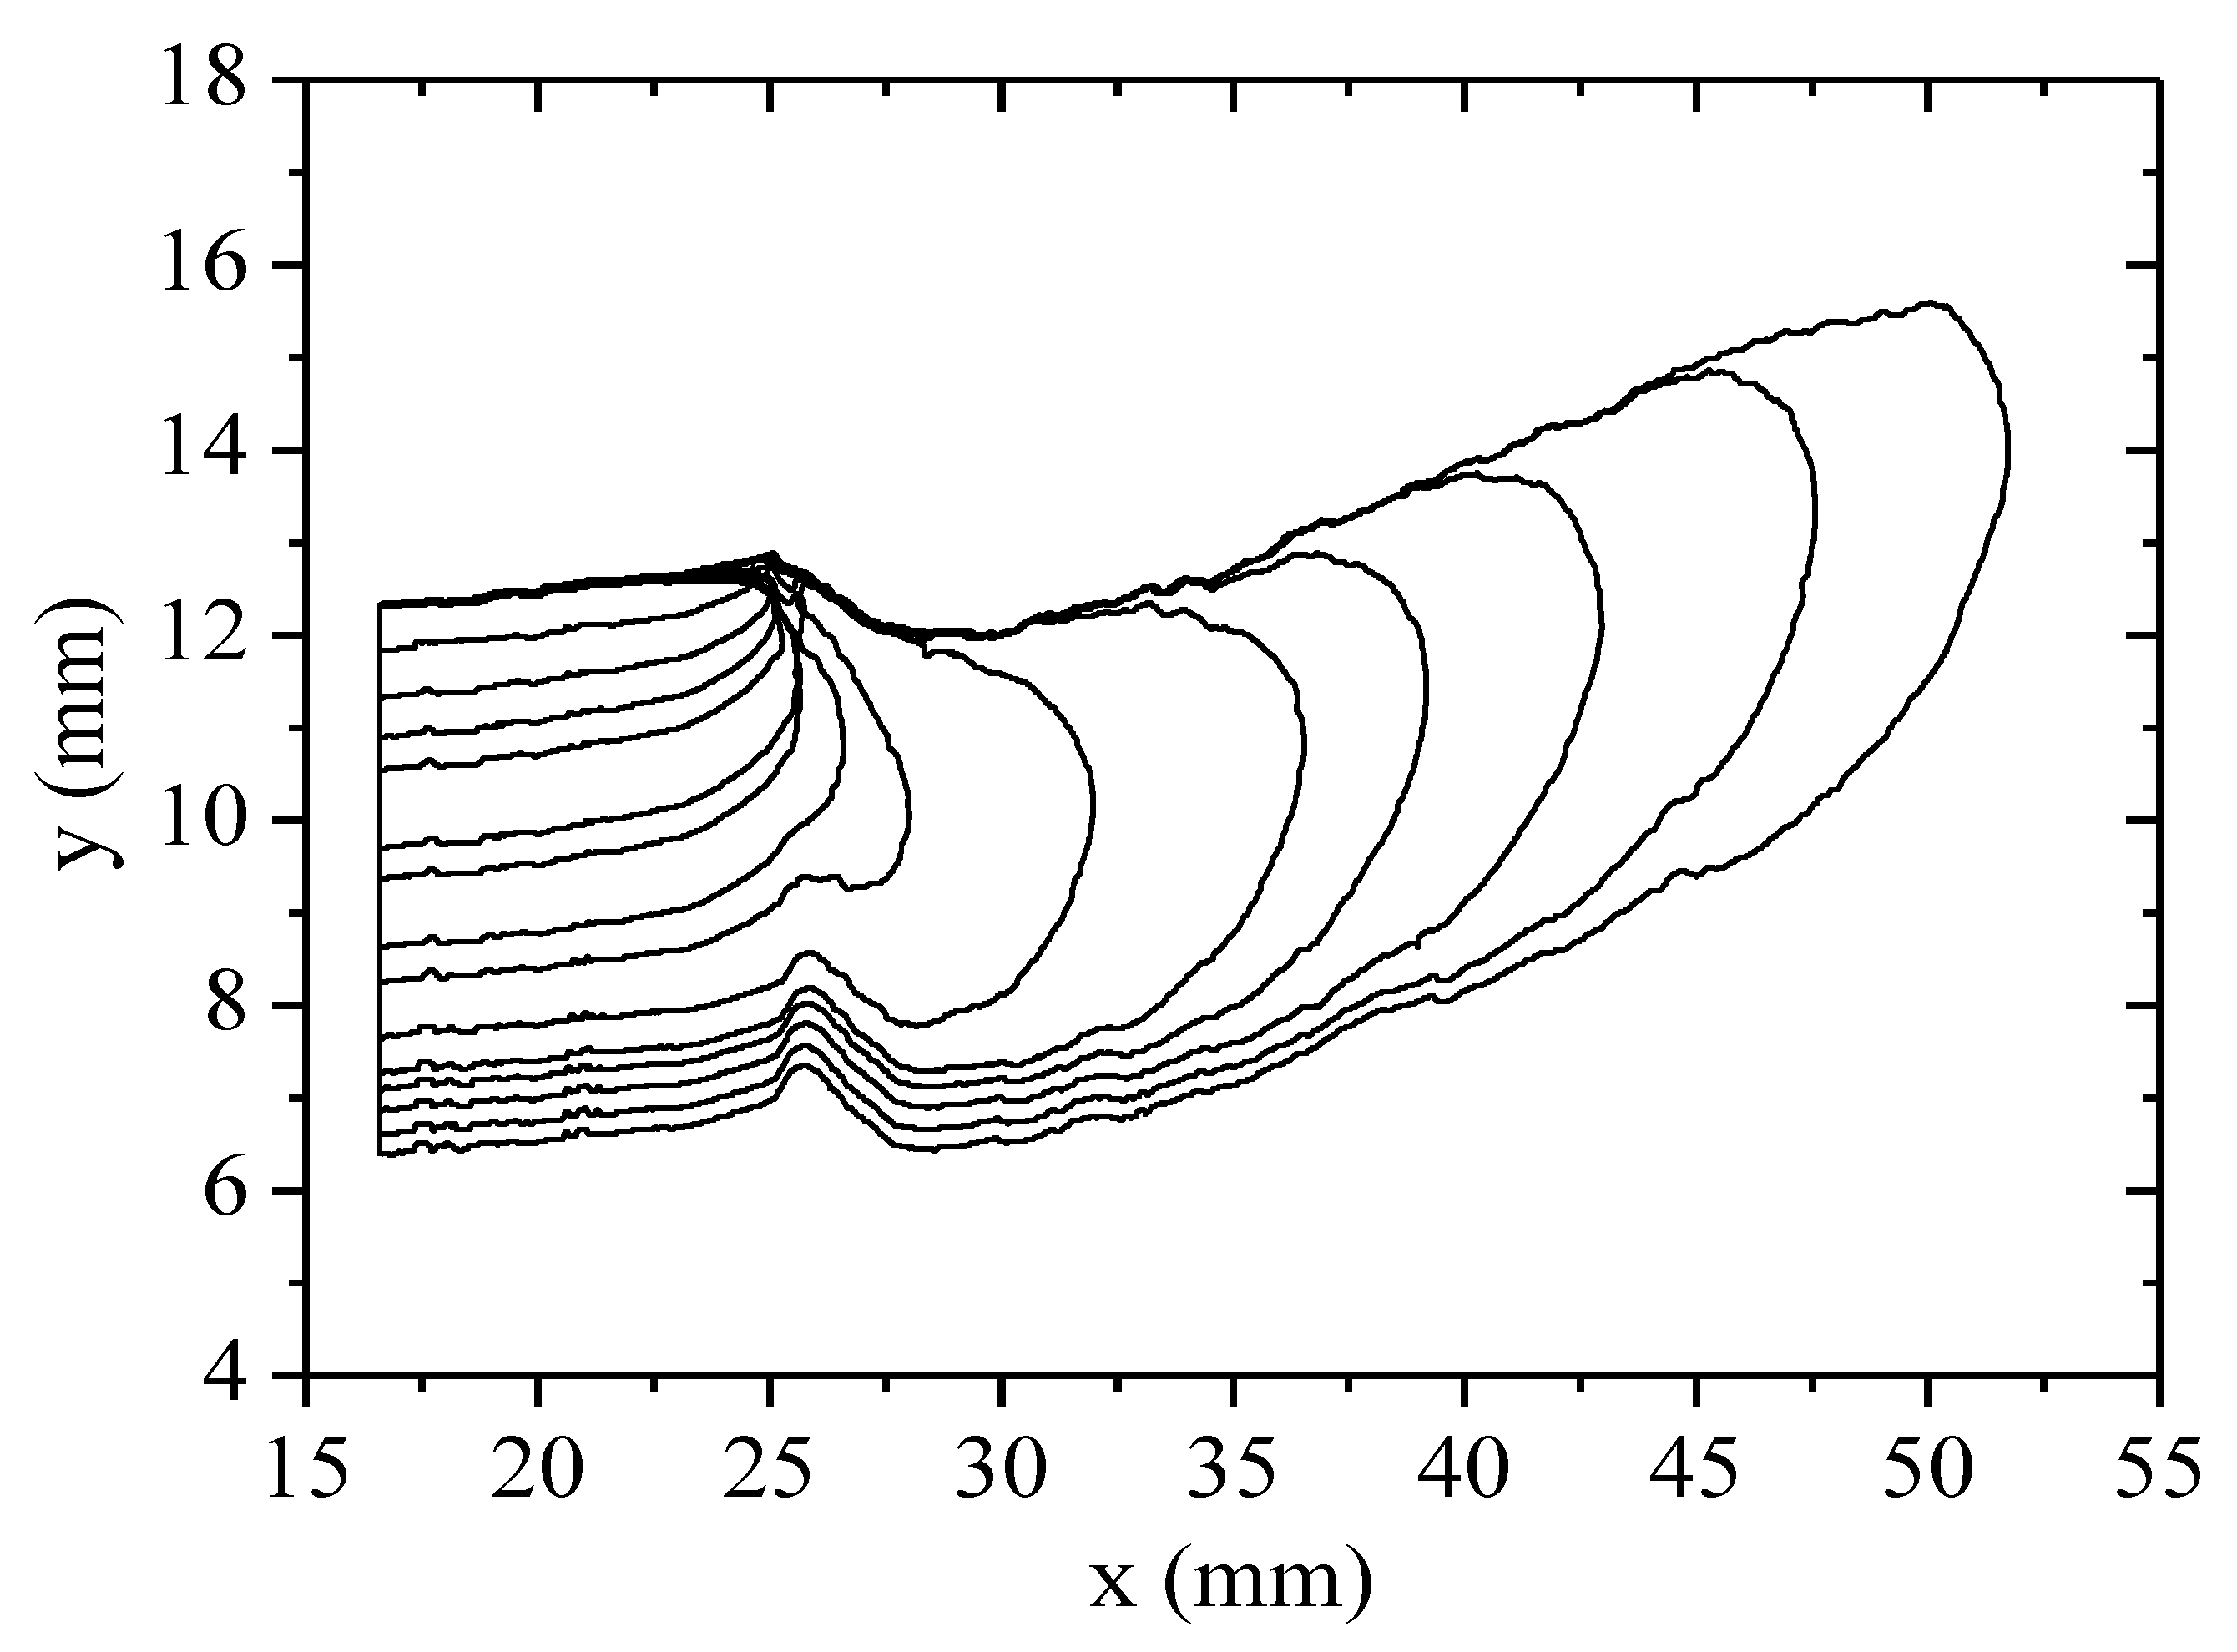
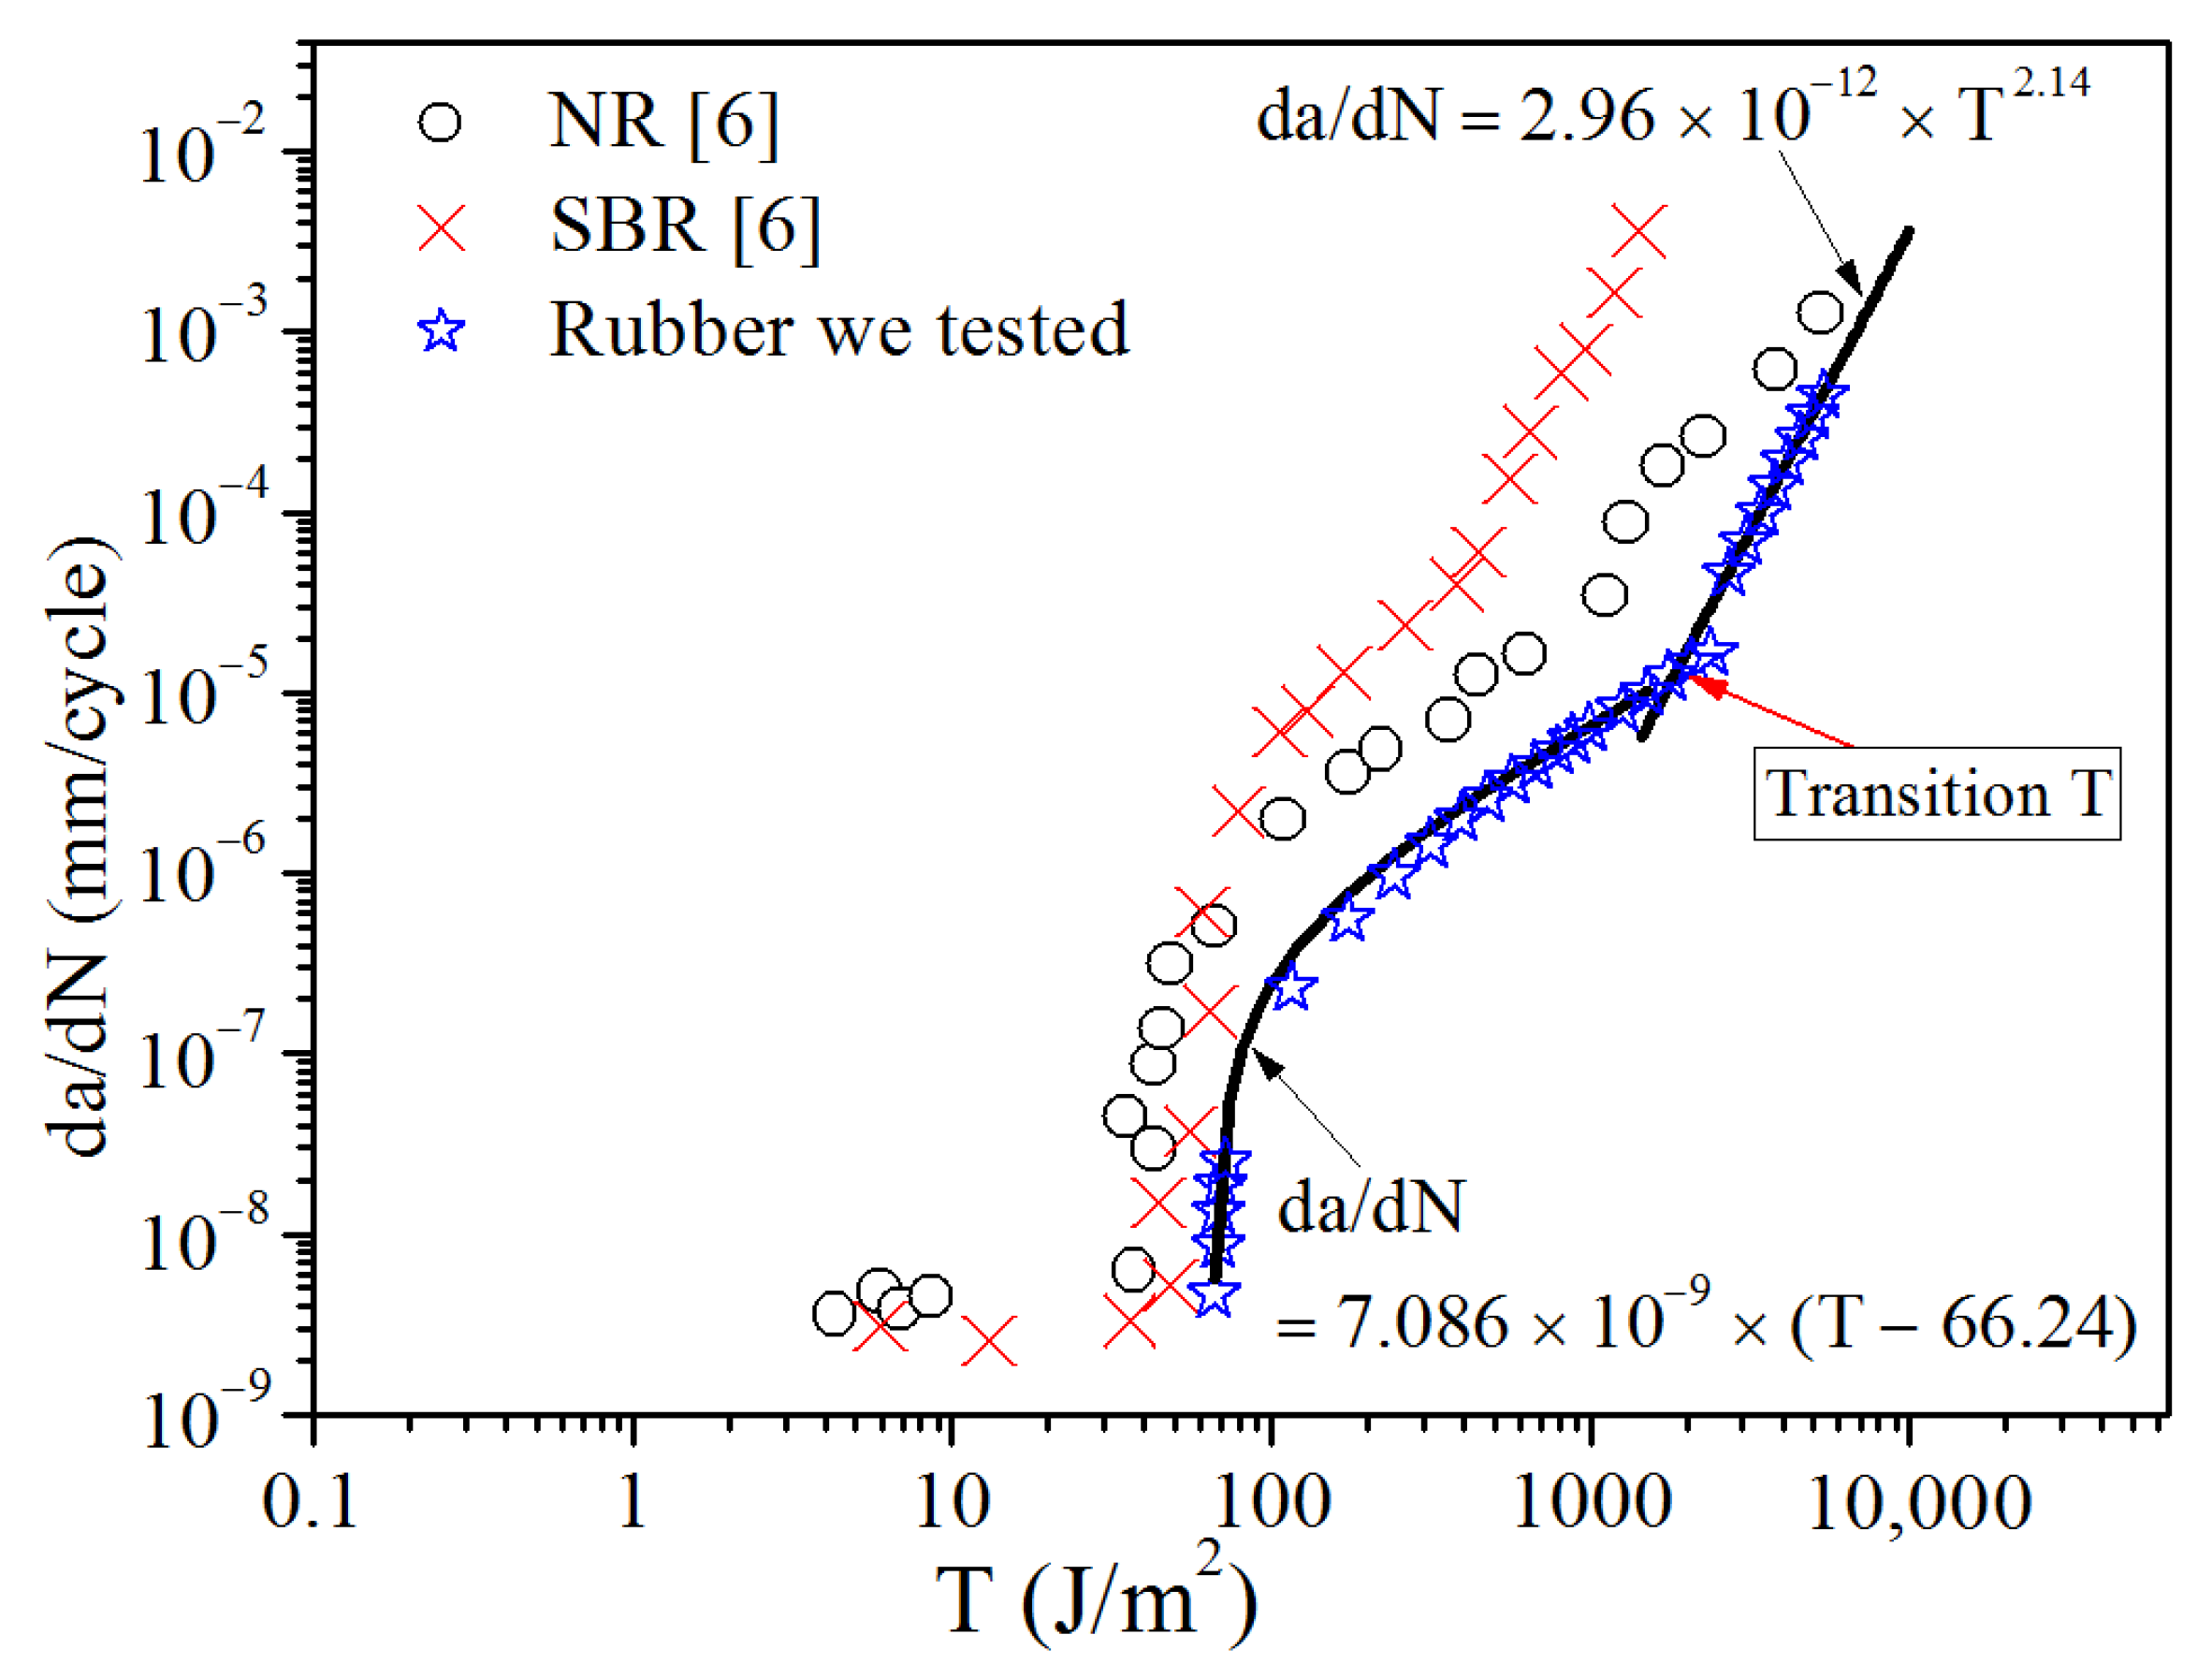
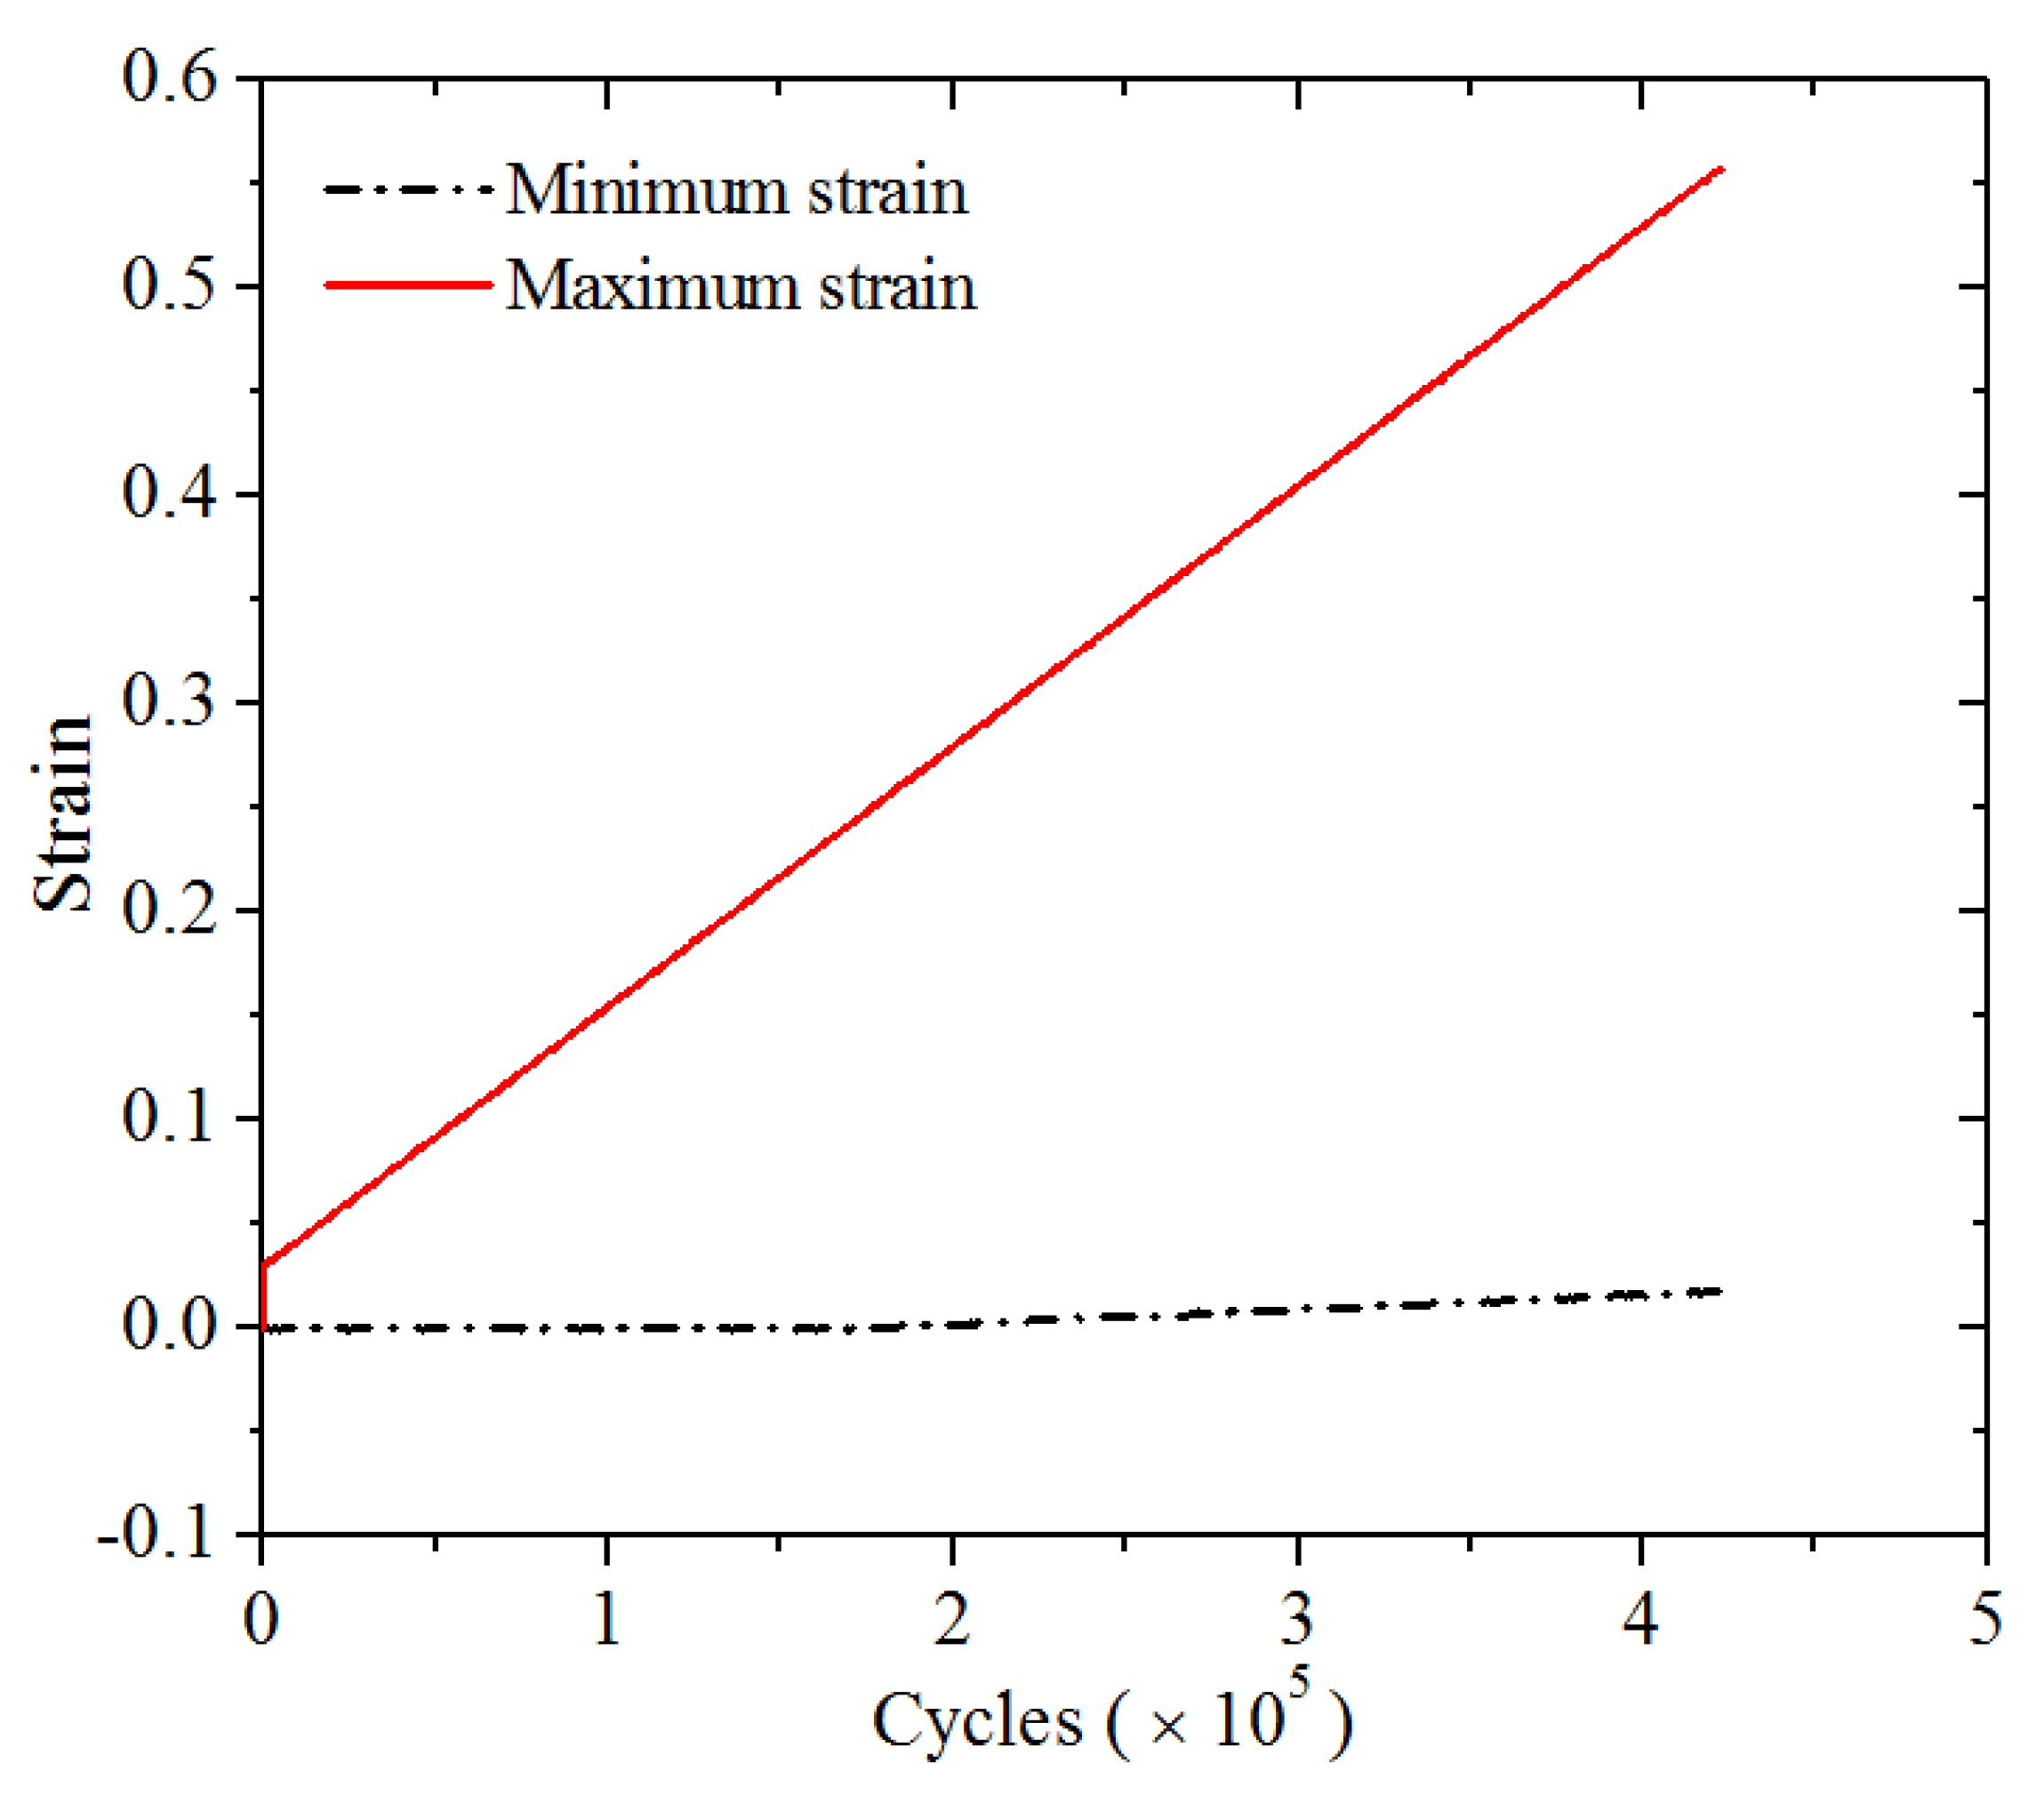
3.4. Fatigue Crack Propagation Experiment
4. Conclusions
Author Contributions
Funding
Institutional Review Board Statement
Informed Consent Statement
Data Availability Statement
Conflicts of Interest
References
- Tee, Y.L.; Loo, M.S.; Andriyana, A. Recent advances on fatigue of rubber after the literature survey by Mars and Fatemi in 2002 and 2004. Int. J. Fract. 2018, 110, 115–129. [Google Scholar] [CrossRef]
- Shangguan, W.B.; Wang, X.L.; Deng, J.X. Experiment and modeling of uniaxial tension fatigue performances for filled natural rubbers. Mater. Des. 2014, 58, 65–73. [Google Scholar] [CrossRef]
- Fang, Y.; Long, L.; Niu, S.; Yang, P.K.; Wang, Z.; Chen, J.; Zhou, Y.; Zi, Y.; Jie, W.; Liao, Q. Stretchable-rubber-based triboelectric nanogenerator and its application as self-powered body motion sensors. Adv. Funct. Mater. 2015, 25, 3688–3696. [Google Scholar]
- Yang, X.; Tu, Q.Z.; Shen, X.M.; Zhu, P.X.; Li, Y.; Zhang, S. A novel method for deposition of muti-walled carbon nanotubes onto poly (p-phenylene terephthalamide) fibers to enhance interfacial adhesion with rubber matrix. Polymers 2019, 11, 374. [Google Scholar] [CrossRef] [Green Version]
- Chen, X.Z.; An, J.; Cai, G.M.; Zhang, J.; Chen, W.; Dong, X.W.; Zhu, L.C.; Tang, B.; Wang, J.F.; Wang, X.G. Environmentally friendly flexible strain sensor from waste cotton fabrics and natural rubber latex. Polymers 2019, 11, 404. [Google Scholar] [CrossRef] [PubMed] [Green Version]
- Lake, G.J.; Lindley, P.B. The mechanical fatigue limit for rubber, I.J. Appl. Polym. Sci. 1965, 9, 1233–1251. [Google Scholar] [CrossRef]
- Robertson, C.G.; Stoček, R.; Mars, W.V. The Fatigue Threshold of Rubber and Its Characterization Using the Cutting Method. In Fatigue Crack Growth in Rubber Materials, 1st ed.; Heinrich, G., Kipscholl, R., Stoček, R., Eds.; Springer International Publishing: Cham, Switzerland, 2021; pp. 57–83. [Google Scholar]
- Rivlin, R.S.; Thomas, A.G. The incipient characteristic tearing energy for an elastomer crosslinked under strain. J. Polym. Sci. 1983, 21, 1807–1814. [Google Scholar] [CrossRef]
- Lake, G.J.; Yeoh, O.H. Measurement of rubber cutting resistance in the absence of friction. Int. J. Fract. 1978, 14, 509–526. [Google Scholar] [CrossRef]
- Chang, L.; Wang, H. Cutting tests: A new method to determine the fracture toughness of polymeric materials. J. Appl. Mech. Eng. 2013, 2, 2–3. [Google Scholar] [CrossRef] [Green Version]
- Zhang, B.; Shiang, C.S.; Yang, S.J.; Hutchens, S.B. Y-shaped cutting for the systematic characterization of cutting and tearing. Exp. Mech. 2019, 59, 517–529. [Google Scholar] [CrossRef]
- Morishita, Y.; Tsunoda, K.; Urayama, K. Velocity transition in the crack growth dynamics of filled elastomers: Contributions of nonlinear viscoelasticity. Phys. Rev. E 2016, 93, 043001. [Google Scholar] [CrossRef] [PubMed]
- Morishita, Y.; Tsunoda, K.; Urayama, K. Crack-tip shape in the crack-growth rate transition of filled elastomers. Polymers 2017, 108, 230–241. [Google Scholar] [CrossRef]
- Mars, W.V.; Fatemi, A. A literature survey on fatigue analysis approaches for rubber. Int. J. Fatigue 2002, 24, 949–961. [Google Scholar] [CrossRef]
- Ghosh, P.; Stocek, R.; Gehde, M.; Mukhopadhyay, R.; Krishnakumar, R. Investigation of fatigue crack growth characteristics of NR/BR blend based tyre tread compounds. Int. J. Fatigue 2014, 188, 9–21. [Google Scholar] [CrossRef]
- Young, D.G. Dynamic property and fatigue crack propagation research on tire sidewall and model compounds. Rubber Chem. Technol. 1985, 58, 785–805. [Google Scholar] [CrossRef]


| Strain Levels | Sample | Cutting Force fc (N) | Cutting Energy Ec (J/m2) |
|---|---|---|---|
| 0.05 | S1 | 2.94 | 1.470 |
| 0.05 | S2 | 5.61 | 2.805 |
| 0.05 | S3 | 1.01 | 0.505 |
| 0.10 | S4 | 0.41 | 0.205 |
| 0.10 | S5 | 0.53 | 0.265 |
| 0.10 | S6 | 0.43 | 0.215 |
| 0.15 | S7 | 0.22 | 0.110 |
| 0.15 | S8 | 0.31 | 0.155 |
| 0.15 | S9 | 0.34 | 0.170 |
Publisher’s Note: MDPI stays neutral with regard to jurisdictional claims in published maps and institutional affiliations. |
© 2021 by the authors. Licensee MDPI, Basel, Switzerland. This article is an open access article distributed under the terms and conditions of the Creative Commons Attribution (CC BY) license (https://creativecommons.org/licenses/by/4.0/).
Share and Cite
Rong, J.; Yang, J.; Huang, Y.; Luo, W.; Hu, X. Characteristic Tearing Energy and Fatigue Crack Propagation of Filled Natural Rubber. Polymers 2021, 13, 3891. https://doi.org/10.3390/polym13223891
Rong J, Yang J, Huang Y, Luo W, Hu X. Characteristic Tearing Energy and Fatigue Crack Propagation of Filled Natural Rubber. Polymers. 2021; 13(22):3891. https://doi.org/10.3390/polym13223891
Chicago/Turabian StyleRong, Jigang, Jun Yang, Youjian Huang, Wenbo Luo, and Xiaoling Hu. 2021. "Characteristic Tearing Energy and Fatigue Crack Propagation of Filled Natural Rubber" Polymers 13, no. 22: 3891. https://doi.org/10.3390/polym13223891
APA StyleRong, J., Yang, J., Huang, Y., Luo, W., & Hu, X. (2021). Characteristic Tearing Energy and Fatigue Crack Propagation of Filled Natural Rubber. Polymers, 13(22), 3891. https://doi.org/10.3390/polym13223891