
Common Origin of Filler Network Related Contributions to Reinforcement and Dissipation in Rubber Composites


Abstract
:
1. Introduction
2. Experimental
2.1. Materials
2.2. Rubber Processing
2.3. Methods
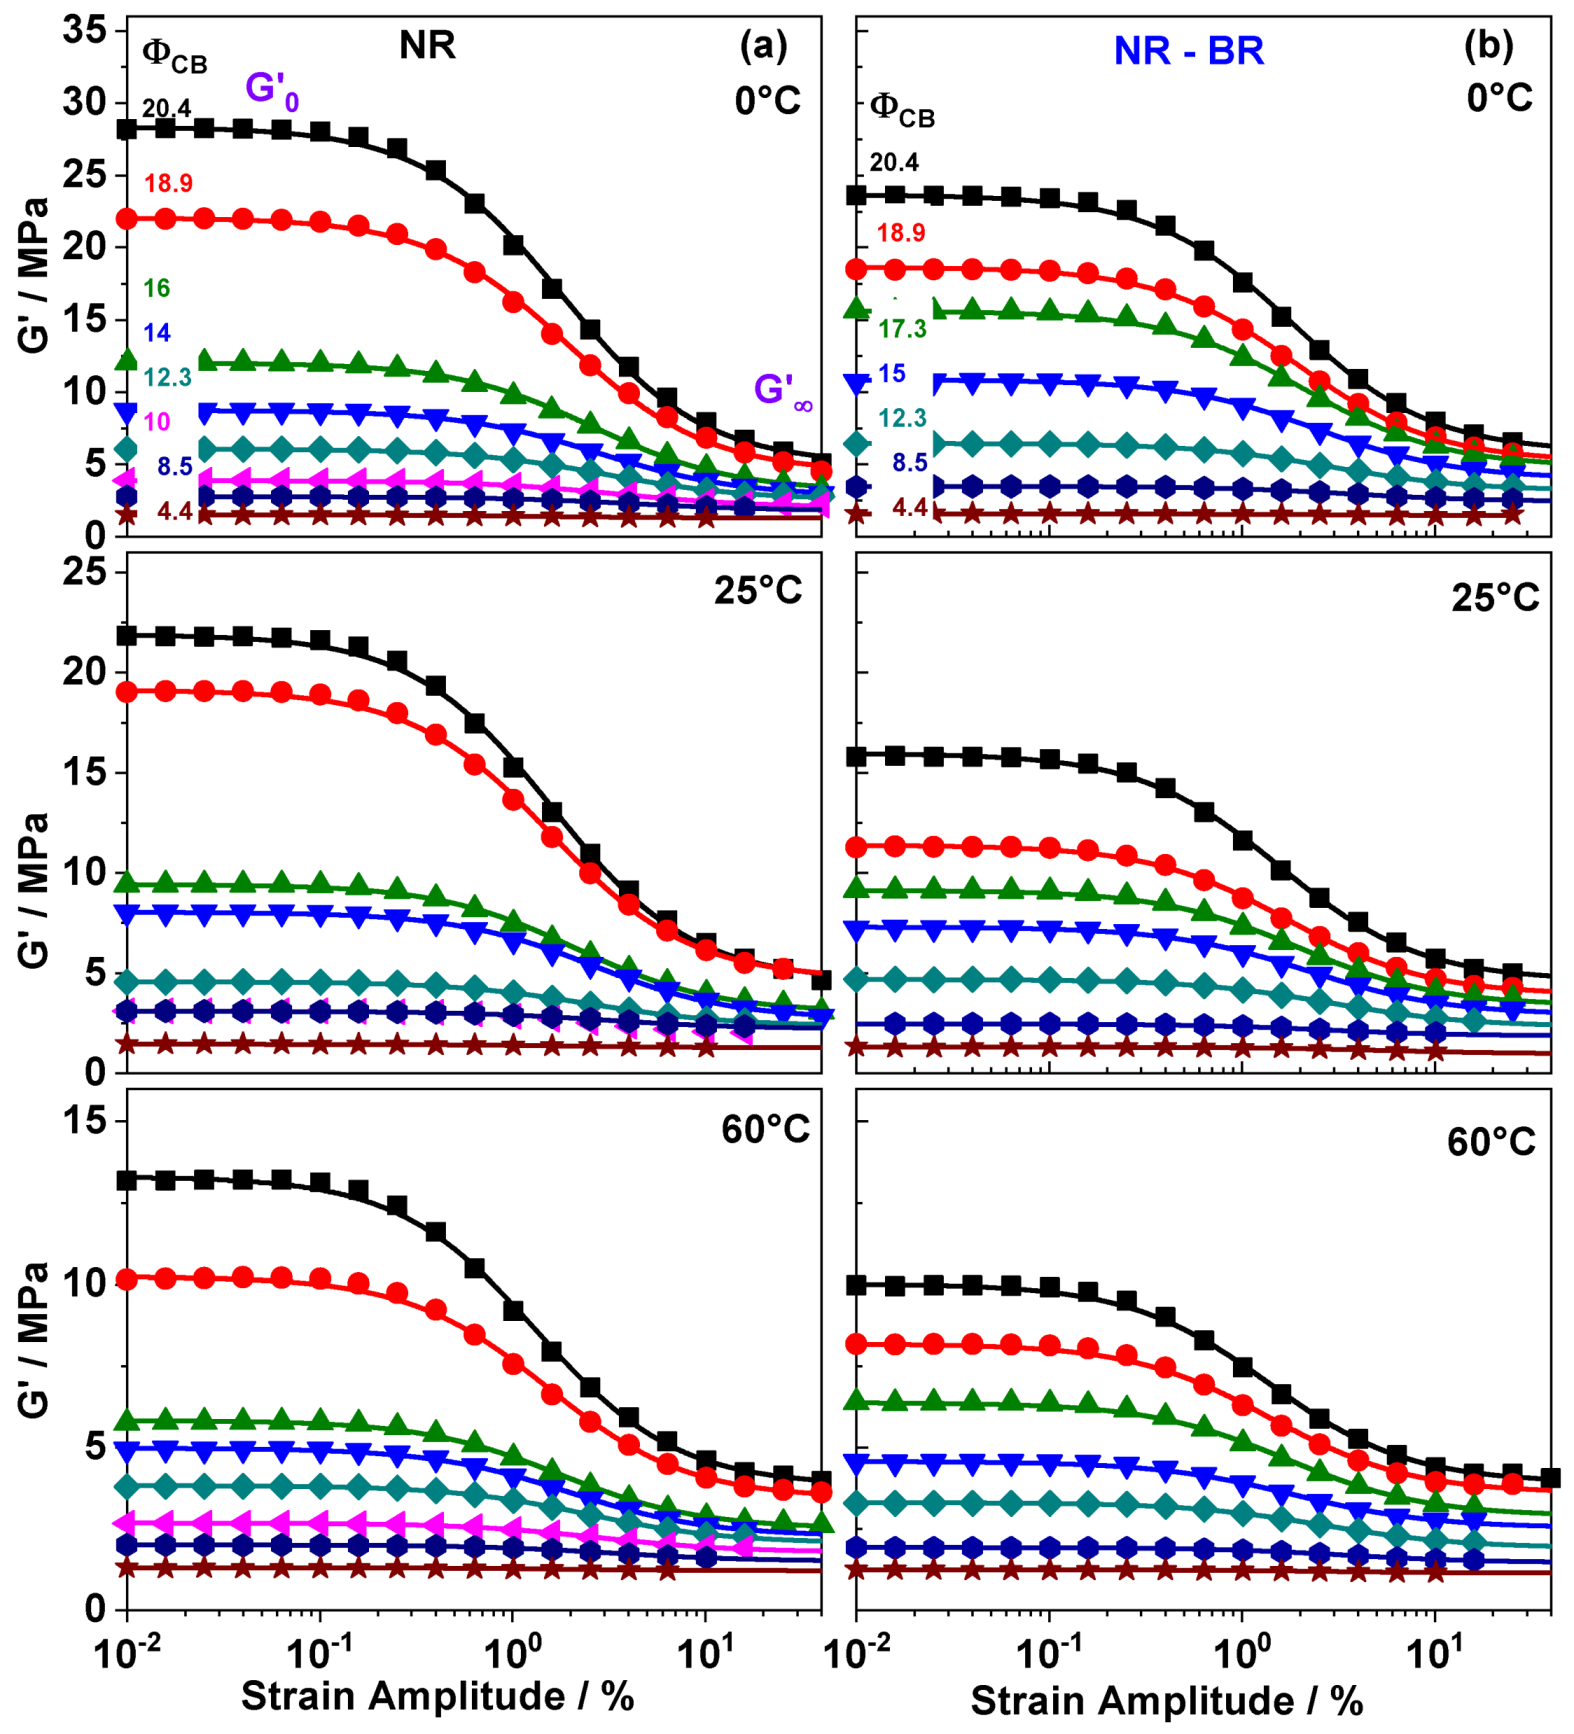
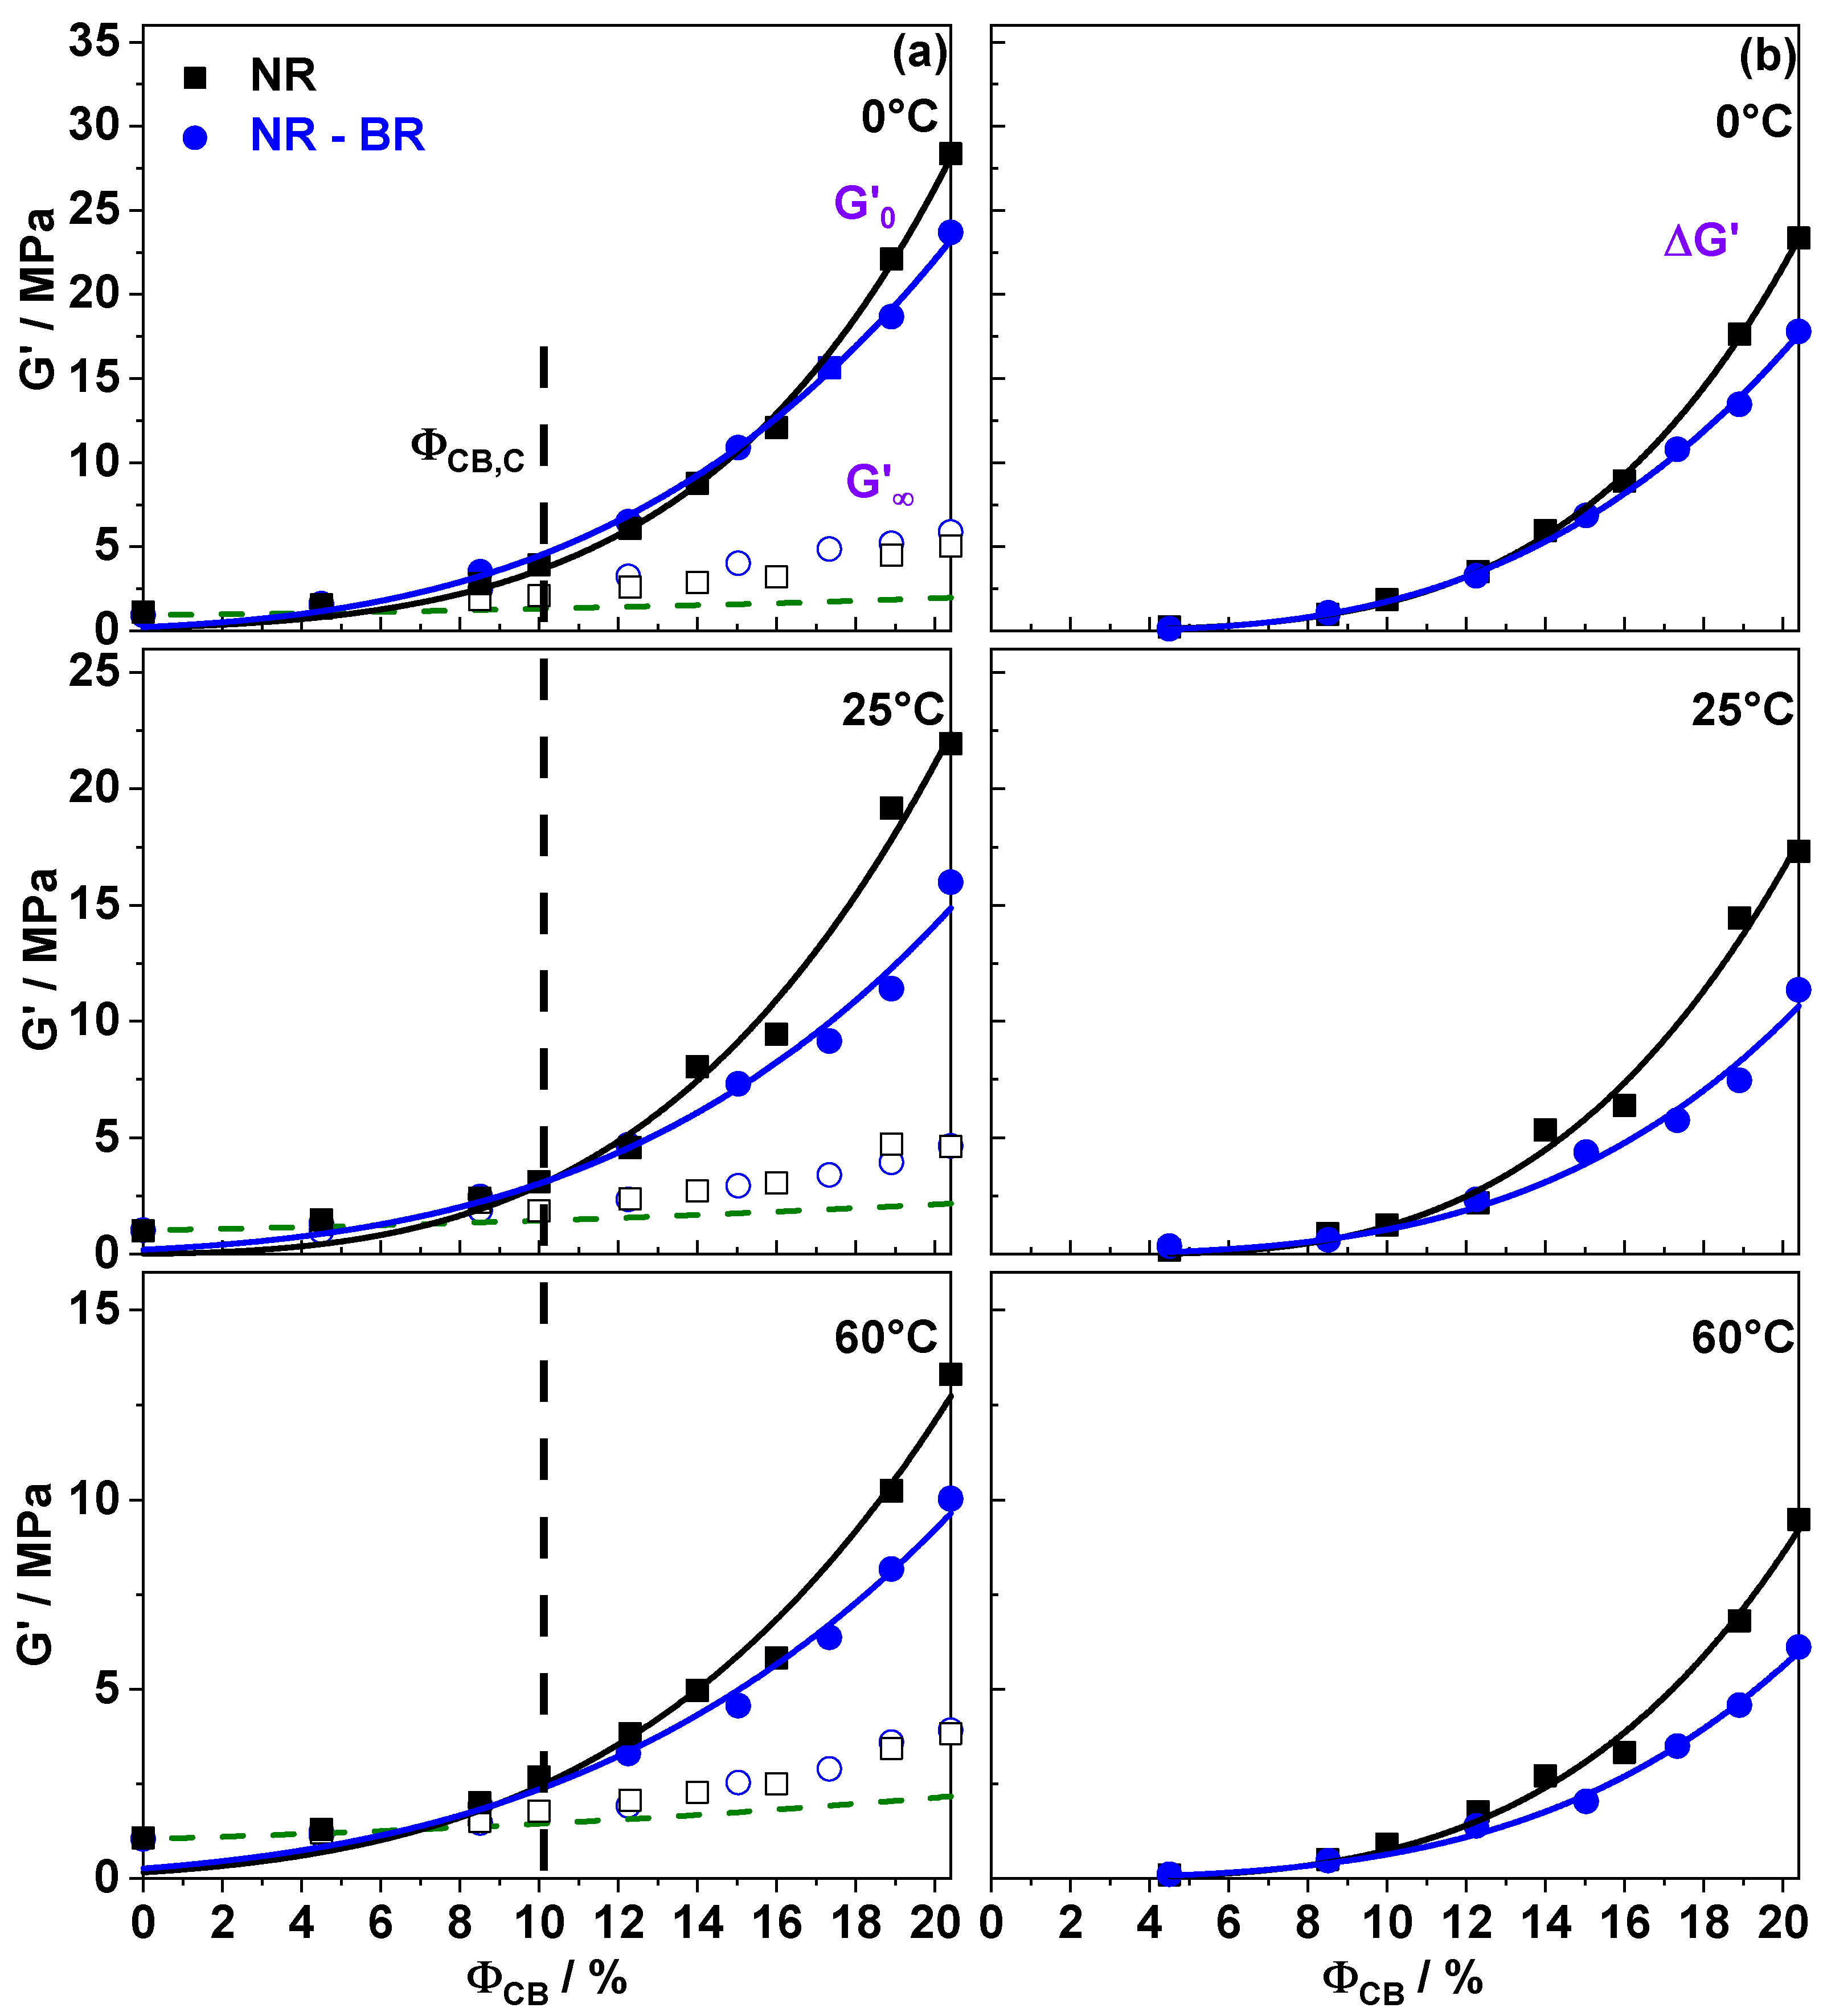
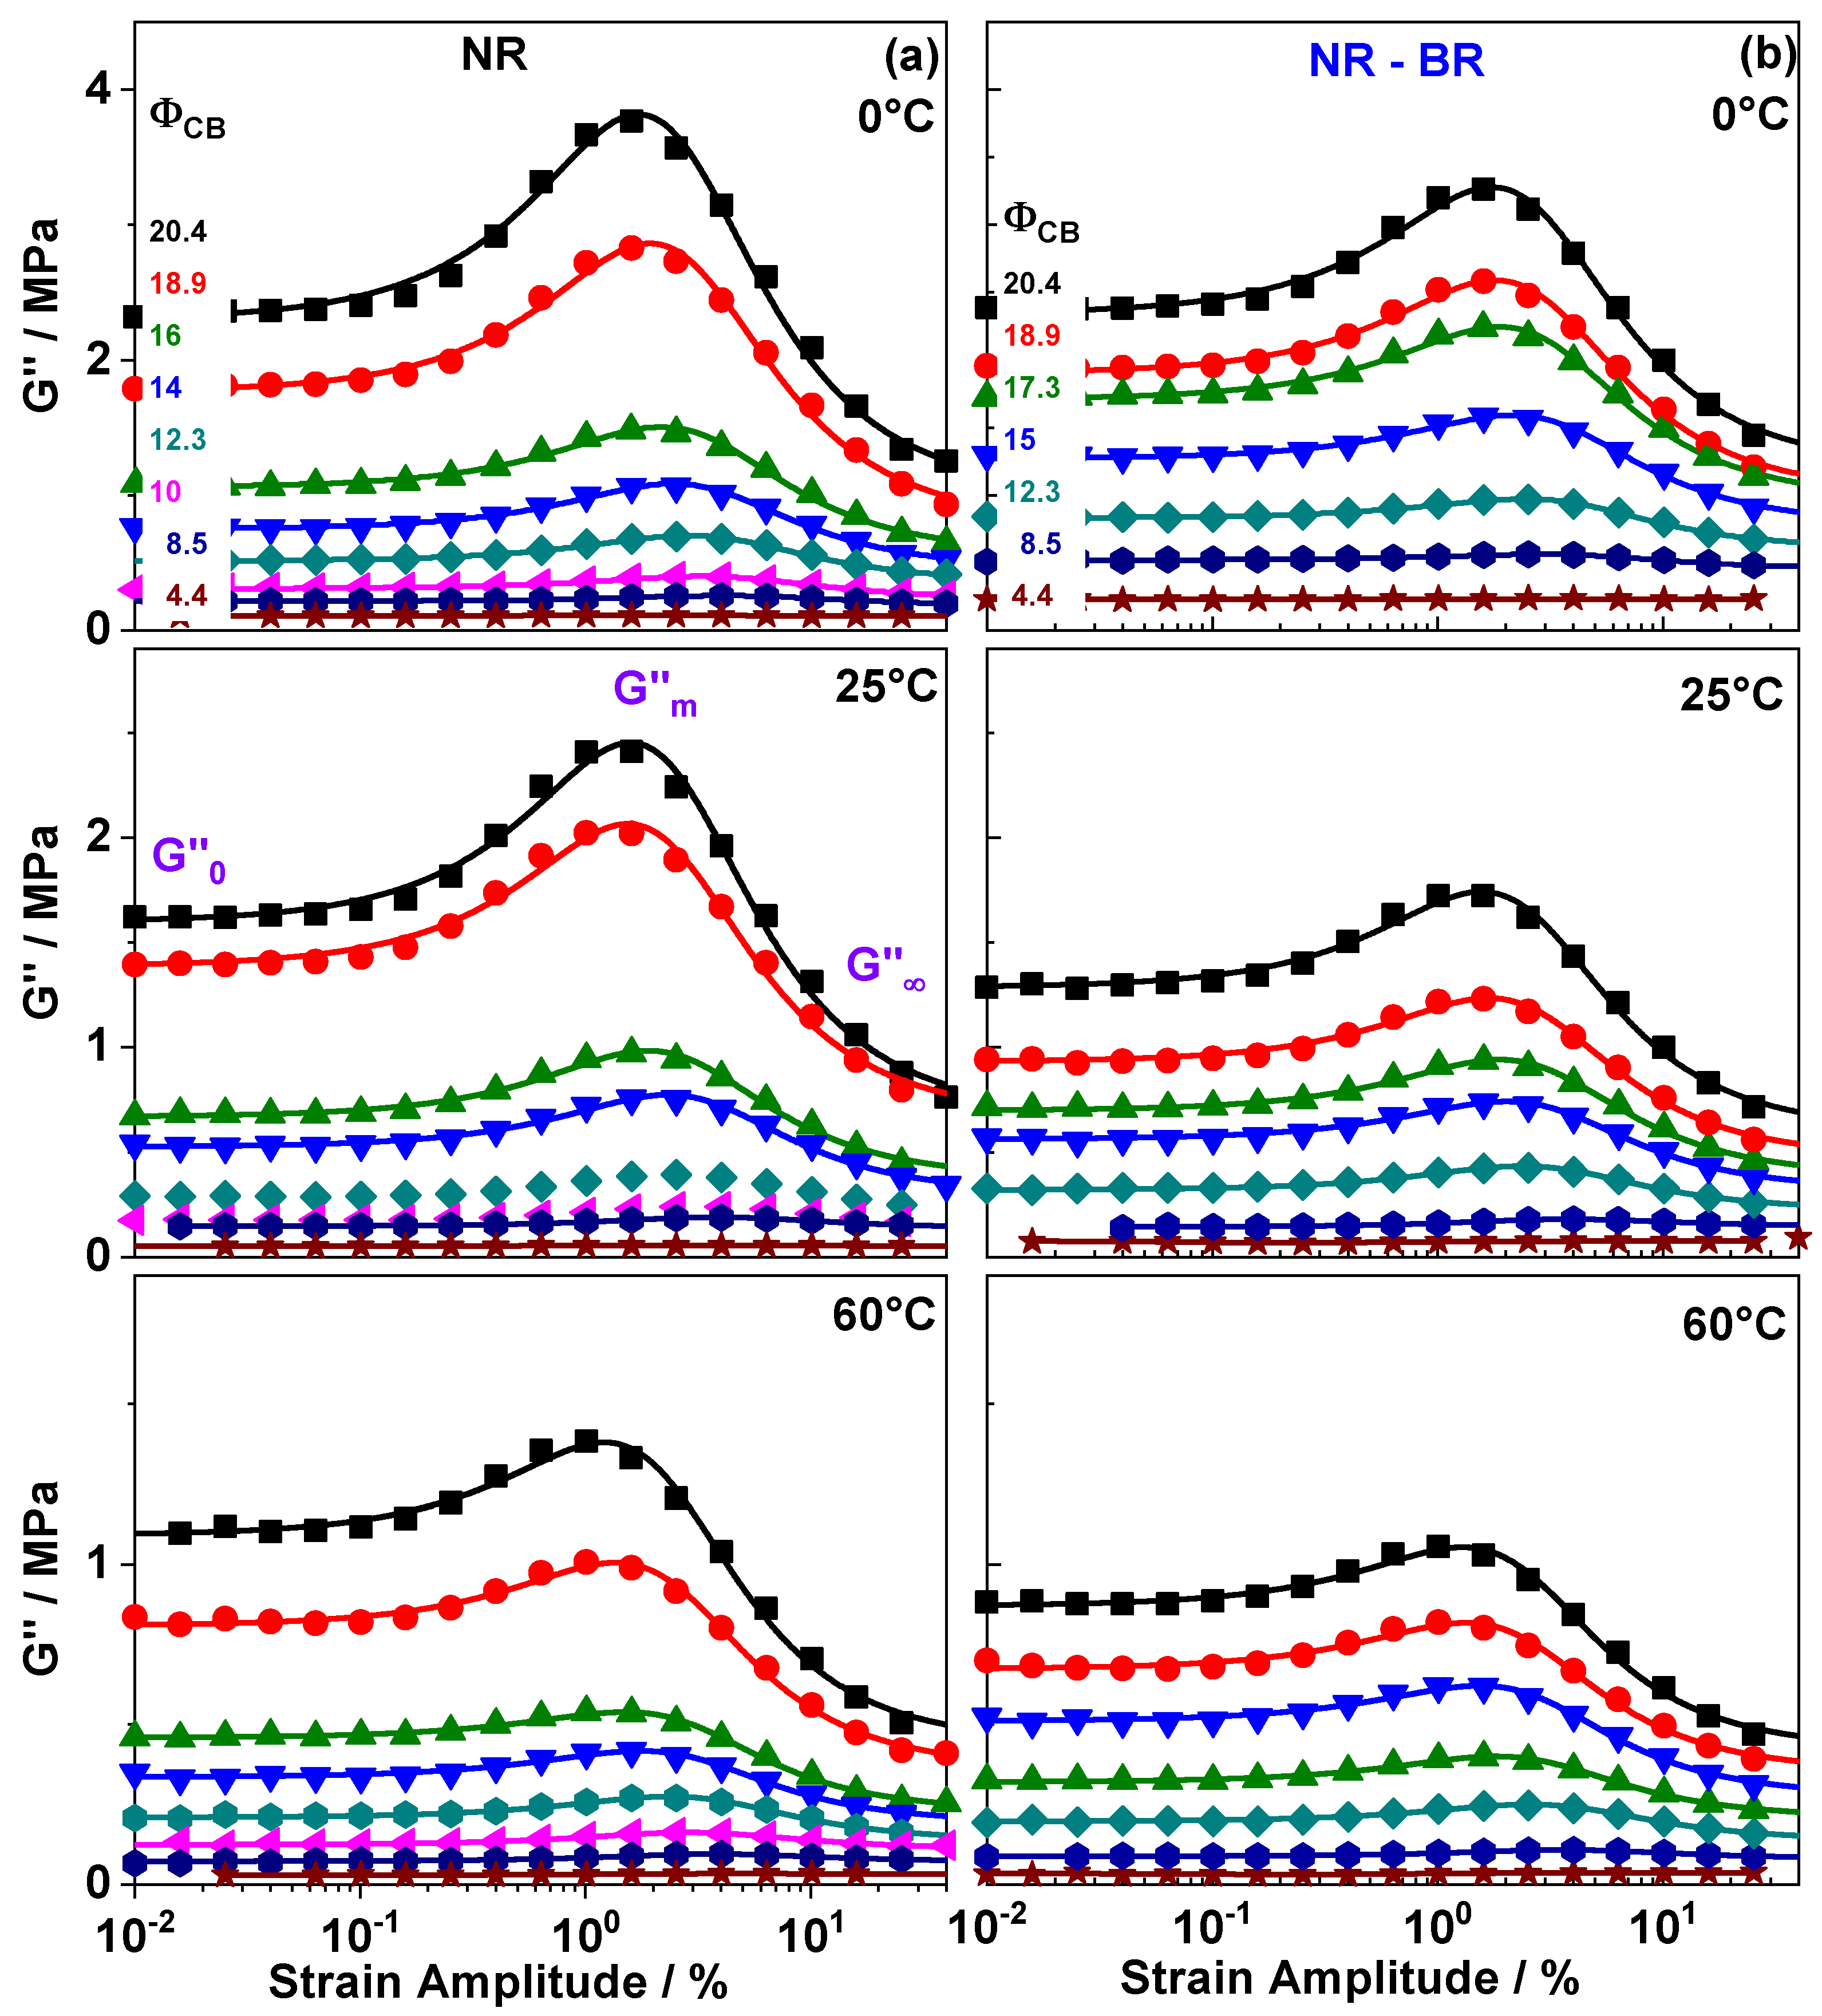
3. Results
4. Discussion
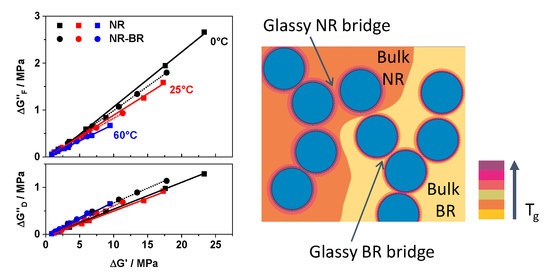
4.1. About the Common Origin of Filler Network Related Contributions to Reinforcement and Dissipation in Rubber Composites
4.2. Influence of Filler Network Topology and Glassy Rubber Bridge Composition on Dissipation and Reinforcement
5. Conclusions and Outlook
Author Contributions
Funding
Data Availability Statement
Conflicts of Interest
References
- Wang, M.J. Effect of Polymer-filler and Filler-filler Interactions on Dynamic Properties of Filled Vulcanizates. Rubber Chem. Technol. 1998, 71, 520–589. [Google Scholar] [CrossRef]
- Zhang, P.; Morris, M.; Doshi, D. Materials Development for Lowering Rolling Resistance of Tires. Rubber Chem. Technol. 2016, 89, 79–116. [Google Scholar] [CrossRef]
- Balazs, A.C.; Emrick, T.; Russell, T.P. Nanoparticle Polymer Composites: Where Two Small Worlds Meet. Science 2016, 314, 1107–1110. [Google Scholar] [CrossRef] [PubMed]
- Payne, A.R.; Watson, W.F. Carbon-black Structure in Rubber. Rubber Chem. Technol. 1963, 36, 147–155. [Google Scholar] [CrossRef]
- Smit, P.P.A. The glass transition in carbon black reinforced rubber. Rheol Acta 1966, 5, 277–283. [Google Scholar] [CrossRef]
- Vilgis, T.; Heinrich, G. Disorder-induced enhancement of polymer adsorption—A model for the rubber-polymer interaction in filled rubbers. Macromolecules 1994, 27, 7846–7854. [Google Scholar] [CrossRef]
- Meyer, J.; Hentschke, R.; Hager, J.; Hojdis, N.W.; Karimi-Varzaneh, H.A. Molecular Simulation of Viscous Dissipation due to Cyclic Deformation of a Silica—Silica Contact in Filled Rubber. Macromolecules 2017, 50, 6679–6689. [Google Scholar] [CrossRef]
- Nie, S.; Lacayo-Pineda, J.; Wilhelm, M. Fourier-transform Rheology of Unvulcanized Styrene Butadiene Rubber Filled with Increasingly Silanized Silica. Soft Mater. 2019, 17, 269–282. [Google Scholar] [CrossRef]
- Nordsiek, M.K.H. The integral rubber concept- an approach to an ideal tire tread rubber. KGK Kautsch. Gummi Kunststoffe 1984, 38, 178–185. [Google Scholar]
- Lechtenboehmer, A.; Moneypenny, H.G.; Mersch, F. A Review of Polymer Interfaces in Tyre Technology. J. Brit. Polym. 1990, 22, 265–301. [Google Scholar] [CrossRef]
- Heinrich, G. The Dynamics of Tire Tread Compounds and Their Relationship to Wet Skid Behavior. Prog. Colloid Polym. Sci. 1992, 90, 16–26. [Google Scholar]
- Heinrich, G.; Klüppel, M. Recent Advances in The Theory of Filler Networking in Elastomers. Fill. Elastomers Drug Deliv. Syst. 2002, 160, 1–44. [Google Scholar]
- Gusev, A.A. Micromechanical mechanism of reinforcement and losses in filled rubbers. Macromolecules 2006, 39, 5960–5962. [Google Scholar] [CrossRef]
- Long, D.; Sotta, P. Stress Relaxation of Large Amplitudes and Long Timescales in Soft Thermoplastic and Filled Elastomers. Rheol. Acta 2007, 46, 1029–1044. [Google Scholar] [CrossRef]
- Vieweg, S.; Unger, R.; Schröter, K.; Donth, E. Frequency and Temperature Dependent of the Small-strain Behaviour of Carbon-black Filled Vulcanizates. Polym. Net Blends 1995, 5, 199–204. [Google Scholar]
- Jouault, N.; Vallat, P.; Dalmas, F.; Said, S.; Jestin, J.; Boue, F. Well-dispersed Fractal Aggregates as Filler in Polymer-silica Nanocomposites: Long-range Effects in Rheology. Macromolecules 2009, 42, 2031–2040. [Google Scholar] [CrossRef] [Green Version]
- Fragiadakis, D.; Bokobza, L.; Pissis, P. Dynamics near the filler surface in natural rubber-silica nanocomposites. Polymer 2011, 52, 3175–3182. [Google Scholar] [CrossRef]
- Fritzsche, J.; Klüppel, M. Structural Dynamics and The Interfacial Properties of Filled Reinforced Elastomers. J. Phys. Cond. Matter 2011, 23, 035104. [Google Scholar] [CrossRef] [PubMed]
- Berriot, J.; Montes, H.; Lequeux, F.; Long, D.; Sotta, P. Evidence for the Shift of the Glass Transition near the Particles in Silica-filled Elastomers. Macromolecules 2002, 35, 9756–9762. [Google Scholar] [CrossRef]
- Tsagaropoulos, G.; Eisenberg, A. Direct Observation of Two Glass Transitions in Silica-Filled Polymers. Implications for the Morphology of Random Ionomers. Macromolecules 1995, 28, 396–398. [Google Scholar] [CrossRef]
- Robertson, C.; Roland, C. Glass Transition and Interfacial Segmental Dynamics in Polymer-particle Composites. Rubber Chem. Technol. 2008, 81, 506–522. [Google Scholar] [CrossRef]
- Jouault, N.; Moll, J.F.; Meng, D.; Windsor, K.; Ramcharan, S.; Kearney, C.; Kumar, S.K. Bound polymer layer in nanocomposites. Macro Lett. 2013, 2, 371–374. [Google Scholar] [CrossRef]
- Berriot, J.; Montes, H.; Lequeux, F.; Long, D.; Sotta, P. Gradient of Glass Transition Temperature in Filled Elastomers. Europhys. Lett. 2003, 64, 50–56. [Google Scholar] [CrossRef]
- Litvinov, V.M.; Orza, R.A.; Klüppel, M.; Van Duin, M.; Magusin, P.C.M.M. Rubber—Filler Interactions and Network Structure in Relation to Stress Strain Behavior of Vulcanized, Carbon Black Filled EPDM. Macromolecules 2011, 44, 4887–4900. [Google Scholar] [CrossRef]
- Mujtaba, A.; Keller, M.; Ilisch, S.; Radusch, H.J.; Thurn-Albrecht, T.; Saalwächter, K.; Beiner, M. Mechanical Properties and Cross-link Density of Styrene Butadiene Model Composites Containing Fillers with Bimodal Particle Size Distribution. Macromolecules 2012, 45, 6504–6515. [Google Scholar] [CrossRef]
- Mujtaba, A.; Keller, M.; Ilisch, S.; Radusch, H.J.; Thurn-Albrecht, T.; Saalwächter, K.; Beiner, M. Detection of Surface-immobilized Components and Their Role in Viscoelastic Reinforcement of Rubber-Silica Nanocomposites. ACS Macro Lett. 2014, 3, 481–485. [Google Scholar] [CrossRef]
- Kraus, G. Mechanical Losses in Carbon-black Filled Rubbers. J. Appl. Polym. Sci. Appl. Polym. Symp. 1984, 39, 75–92. [Google Scholar]
- Aguiar da Silva, C.; Nagaraja, S.M.; Weydert, M.; Beiner, M. Diblock-Copolymer-Based Composites for Tire-Tread Applications with Improved Filler Network Topology. ACS Appl. Nano Mater. 2018, 1, 1003–1008. [Google Scholar] [CrossRef]
- Nagaraja, S.M.; Mujtaba, A.; Beiner, M. Quantification of different contributions to dissipation in elastomer nanoparticle composites. Polymer 2017, 111, 48–52. [Google Scholar] [CrossRef]
- Guth, E.; Gold, O. On the Hydrodynamical Theory of the Viscosity of Suspensions. Phys. Rev. 1938, 53, 322. [Google Scholar]
- Ulmer, J.D. Strain Dependence of Dynamic Mechanical Properties of Carbon-black Filled Rubber Compounds. Rubber Chem. Technol. 1996, 69, 15–47. [Google Scholar] [CrossRef]
- Massié, J.; Hirst, R.C.; Halasa, A. Carbon Black Distribution in NR/Polybutadiene Blends. Rubber Chem. Technol. 1993, 66, 276–285. [Google Scholar] [CrossRef]
- Merabia, S.; Sotta, P.; Long, D.R. A Microscopic Model for the Reinforcement and the Nonlinear Behavior of Filled Elastomers and Thermoplastic Elastomers (Payne and Mullins Effects). Macromolecules 2008, 41, 8252–8266. [Google Scholar] [CrossRef]
- Le, H.H.; Ilisch, S.; Prodanova, I.; Radusch, H. Online electrical conductivity as a measure to characterize the rheological and thermodynamic effects on the carbon black dispersion in rubber compounds. KGK Kautsch. Gummi Kunststoffe 2004, 57, 388–395. [Google Scholar]
- Le, H.H.; Sriharish, M.; Henning, S.; Klehm, J.; Menzel, M.; Frank, W.; Wiessner, S.; Das, A.; Stäckelhuber, K.; Heinrich, G.; et al. Dispersion and distribution of carbon nanotubes in ternary rubber blends. Compos. Sci. Technol. 2014, 90, 180–186. [Google Scholar] [CrossRef]
- Doolittle, A.K. Studies in Newtonian Flow. II. The Dependence of the Viscosity of Liquids on Free Space. J. Appl. Phys. 1951, 22, 1471–1475. [Google Scholar] [CrossRef]
- Hess, W.M.; Vegvari, P.C.; Swor, R.A. Carbon Black in NR/BR Blends for Truck Tires. Rubber Chem. Technol. 1985, 58, 350–382. [Google Scholar] [CrossRef]
- Hess, W.M.; Chirico, V.E. Elastomer Blend Properties Influence of Carbon Black Type and Location. Rubber Chem. Technol. 1977, 50, 301–326. [Google Scholar] [CrossRef]


| NR Composites | |||||||||
|---|---|---|---|---|---|---|---|---|---|
| T= 0C | T= 25C | T= 60C | |||||||
(MPa) | (MPa) | (MPa) | (MPa) | (MPa) | (MPa) | (MPa) | (MPa) | (MPa) | |
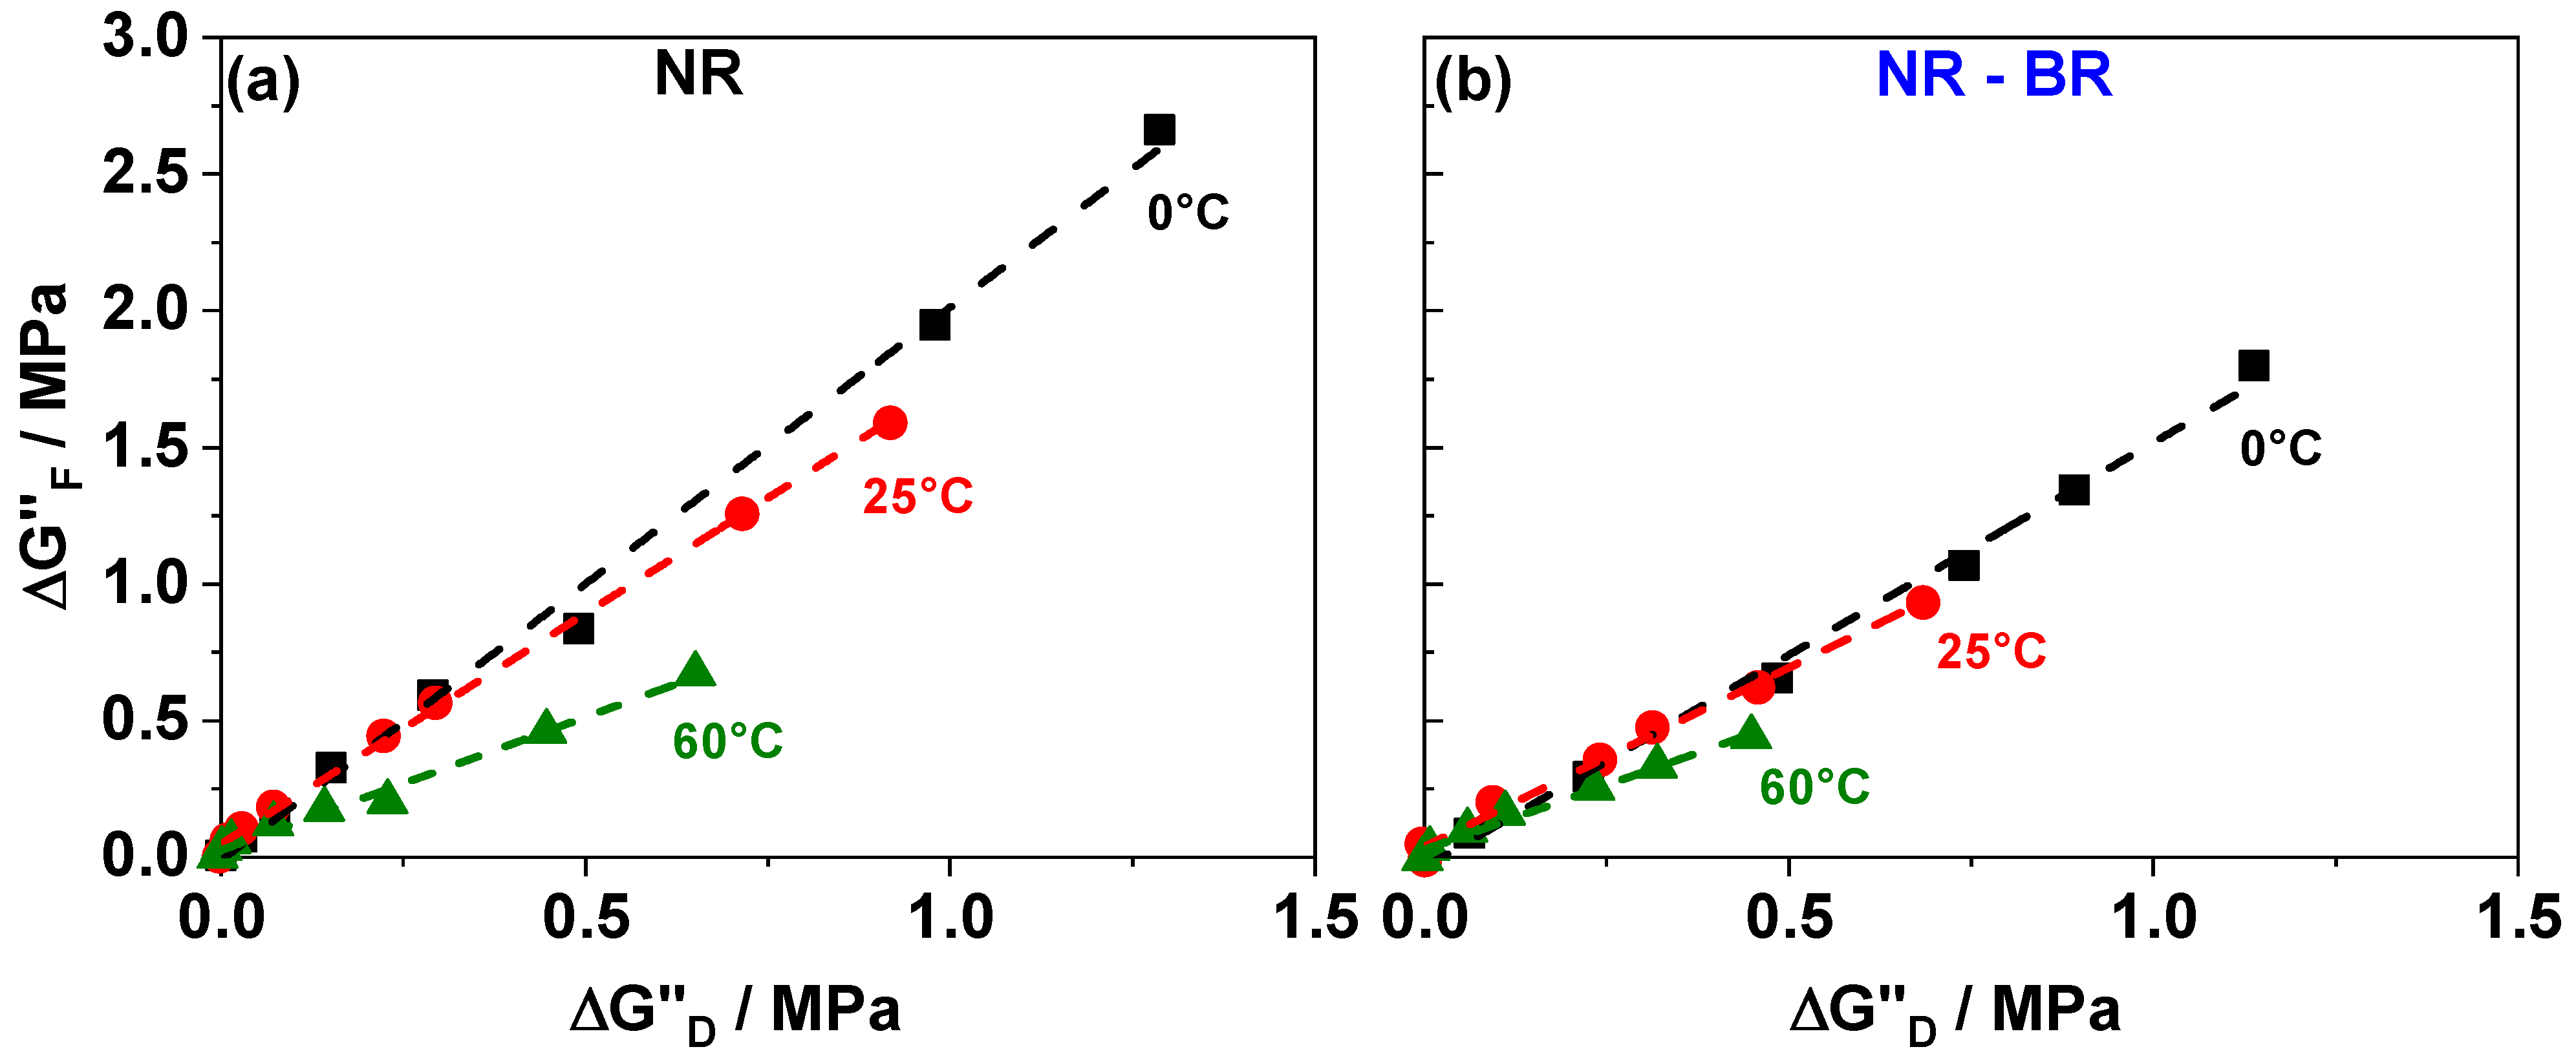
| 20.4 | 23.33 | 1.29 | 2.66 | 17.28 | 0.92 | 1.59 | 9.48 | 0.65 | 0.67 |
| 18.9 | 17.60 | 0.98 | 1.95 | 14.42 | 0.72 | 1.25 | 6.80 | 0.45 | 0.46 |
| 16.0 | 8.87 | 0.49 | 0.83 | 6.38 | 0.29 | 0.57 | 3.32 | 0.23 | 0.20 |
| 14.0 | 5.91 | 0.29 | 0.59 | 5.33 | 0.22 | 0.44 | 2.70 | 0.14 | 0.17 |
| 12.3 | 3.49 | 0.15 | 0.33 | 2.20 | 0.07 | 0.18 | 1.77 | 0.07 | 0.12 |
| 10.0 | 1.83 | 0.07 | 0.16 | 1.25 | 0.03 | 0.11 | 0.90 | 0.01 | 0.06 |
| 8.5 | 0.95 | 0.03 | 0.07 | 0.87 | 0.01 | 0.06 | 0.50 | 0.00 | 0.03 |
| 4.4 | 0.22 | 0.00 | 0.01 | 0.17 | 0.00 | 0.00 | 0.09 | 0.00 | 0.00 |
| NR-BR Composites | |||||||||
| T= 0C | T= 25C | T= 60C | |||||||
(MPa) | (MPa) | (MPa) | (MPa) | (MPa) | (MPa) | (MPa) | (MPa) | (MPa) | |
| 20.4 | 17.80 | 1.14 | 1.80 | 11.34 | 0.68 | 0.93 | 6.11 | 0.45 | 0.44 |
| 18.9 | 13.46 | 0.89 | 1.34 | 7.47 | 0.46 | 0.62 | 4.58 | 0.32 | 0.33 |
| 17.3 | 10.77 | 0.74 | 1.07 | 5.75 | 0.31 | 0.47 | 3.48 | 0.23 | 0.25 |
| 15.0 | 6.85 | 0.48 | 0.66 | 4.38 | 0.24 | 0.36 | 2.03 | 0.11 | 0.16 |
| 12.3 | 3.26 | 0.23 | 0.29 | 2.35 | 0.09 | 0.20 | 1.39 | 0.06 | 0.10 |
| 8.5 | 1.05 | 0.06 | 0.09 | 0.60 | 0.00 | 0.05 | 0.46 | 0.01 | 0.03 |
| 4.4 | 0.11 | 0.00 | 0.01 | 0.34 | 0.00 | −0.01 | 0.10 | 0.00 | −0.01 |
Publisher’s Note: MDPI stays neutral with regard to jurisdictional claims in published maps and institutional affiliations. |
© 2021 by the authors. Licensee MDPI, Basel, Switzerland. This article is an open access article distributed under the terms and conditions of the Creative Commons Attribution (CC BY) license (https://creativecommons.org/licenses/by/4.0/).
Share and Cite
Nagaraja, S.M.; Henning, S.; Ilisch, S.; Beiner, M. Common Origin of Filler Network Related Contributions to Reinforcement and Dissipation in Rubber Composites. Polymers 2021, 13, 2534. https://doi.org/10.3390/polym13152534
Nagaraja SM, Henning S, Ilisch S, Beiner M. Common Origin of Filler Network Related Contributions to Reinforcement and Dissipation in Rubber Composites. Polymers. 2021; 13(15):2534. https://doi.org/10.3390/polym13152534
Chicago/Turabian StyleNagaraja, Sriharish Malebennur, Sven Henning, Sybill Ilisch, and Mario Beiner. 2021. "Common Origin of Filler Network Related Contributions to Reinforcement and Dissipation in Rubber Composites" Polymers 13, no. 15: 2534. https://doi.org/10.3390/polym13152534
APA StyleNagaraja, S. M., Henning, S., Ilisch, S., & Beiner, M. (2021). Common Origin of Filler Network Related Contributions to Reinforcement and Dissipation in Rubber Composites. Polymers, 13(15), 2534. https://doi.org/10.3390/polym13152534