Numerical Approach for the Assessment of Micro-Textured Walls Effects on Rubber Injection Moulding
Abstract
1. Introduction
2. Materials and Methods
2.1. Rubber Injection Moulding: Mathematical Model
2.1.1. Alpha Equation
2.1.2. Mass-Conservation Equation
2.1.3. Momentum-Conservation Equation
2.1.4. Rubber Cure Kinetics
2.1.5. Energy-Conservation Equation
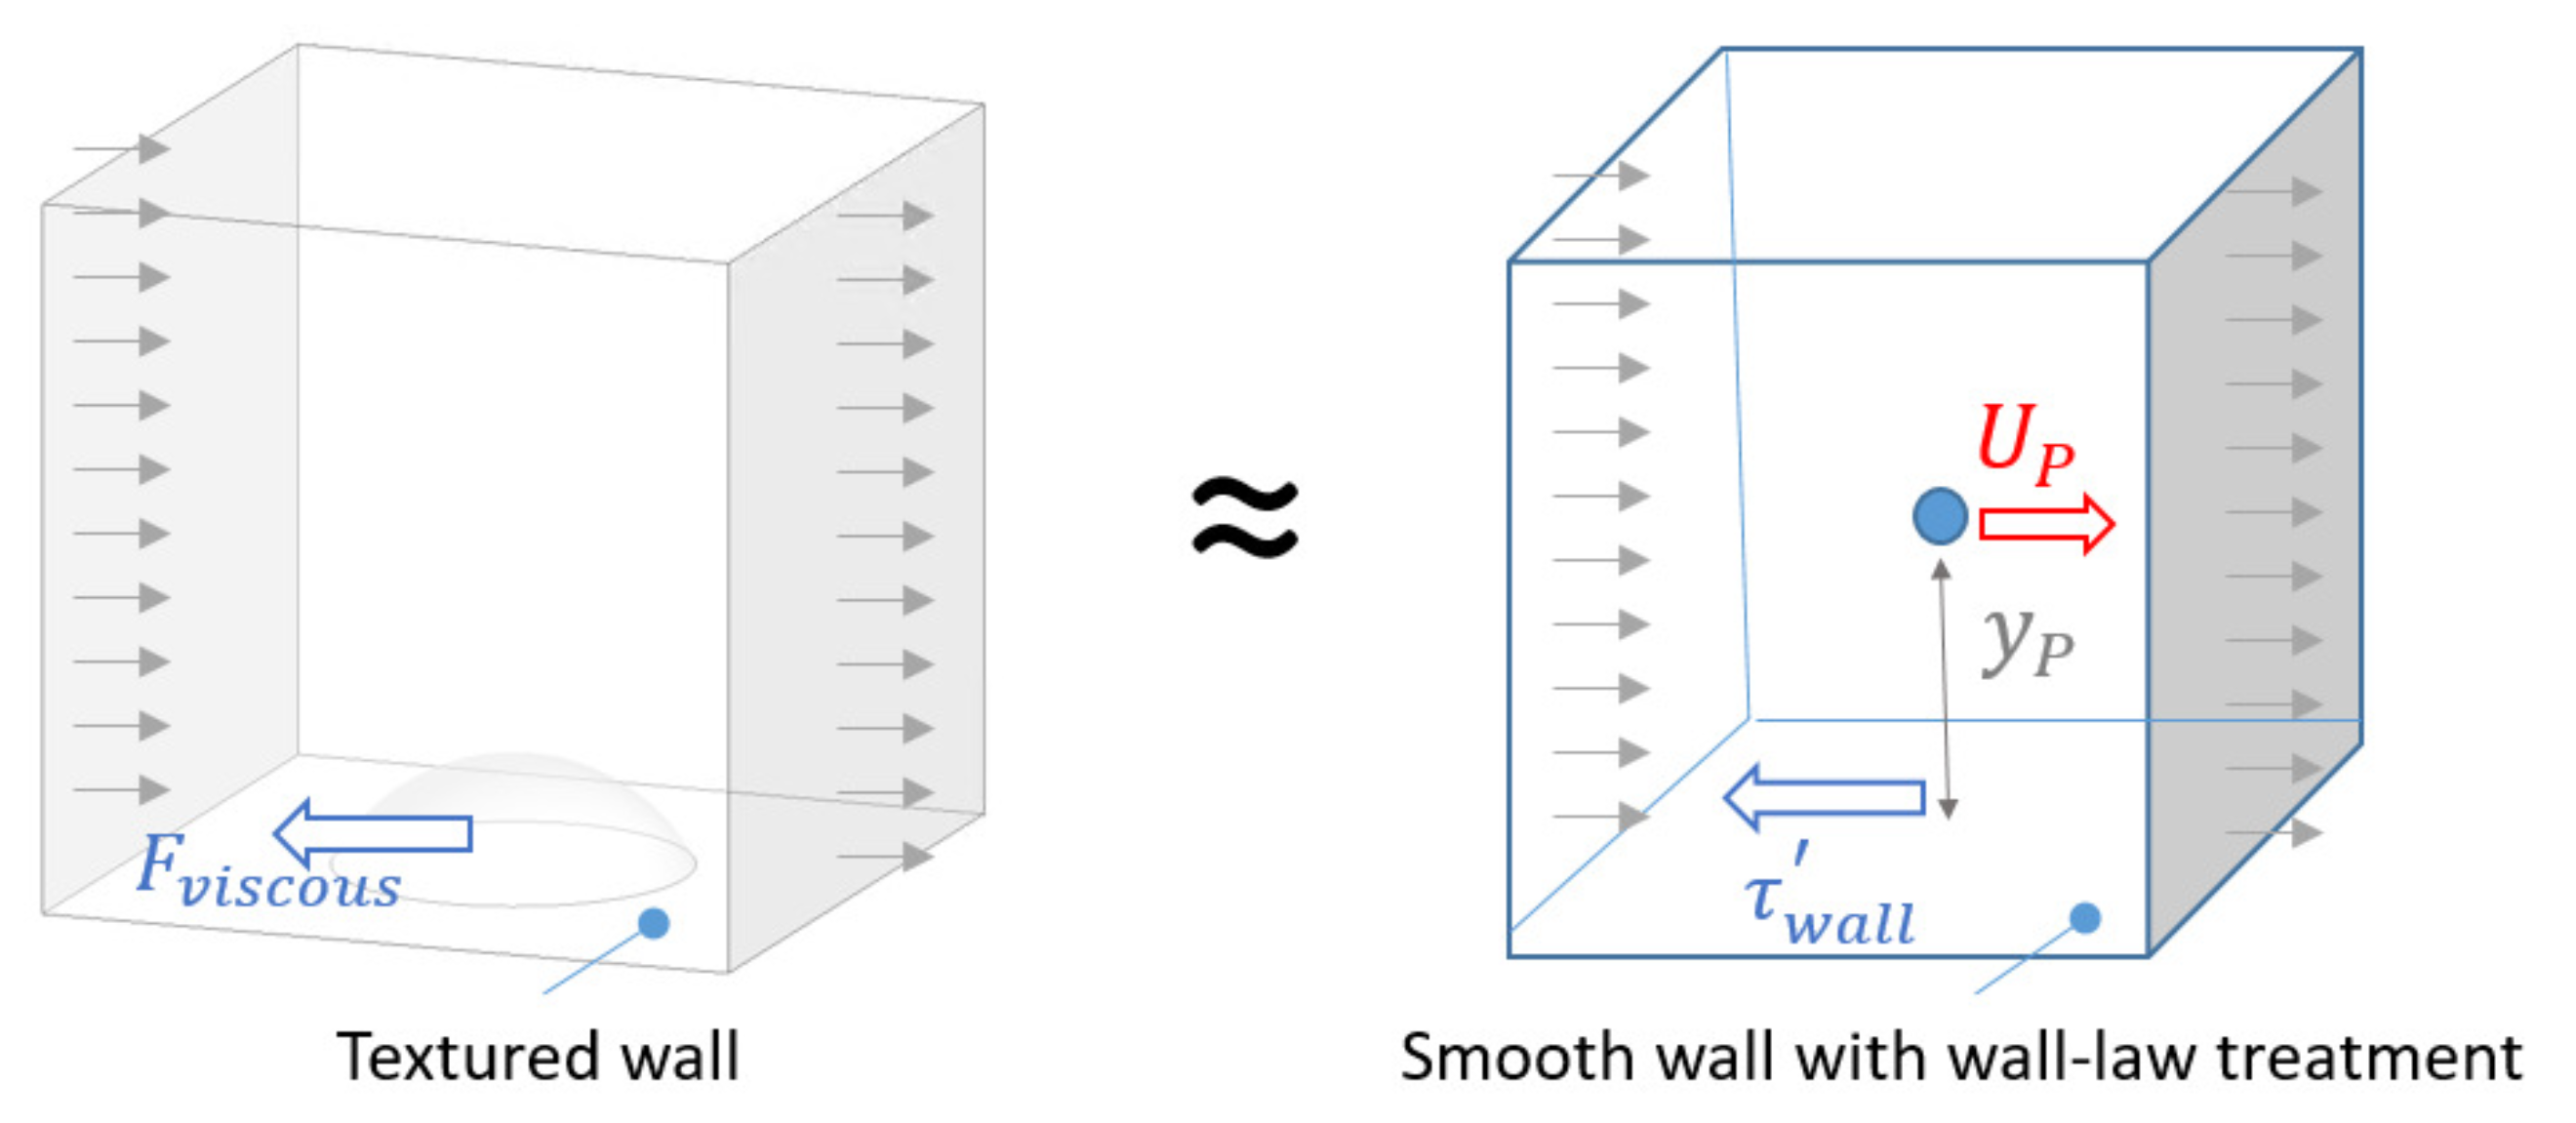
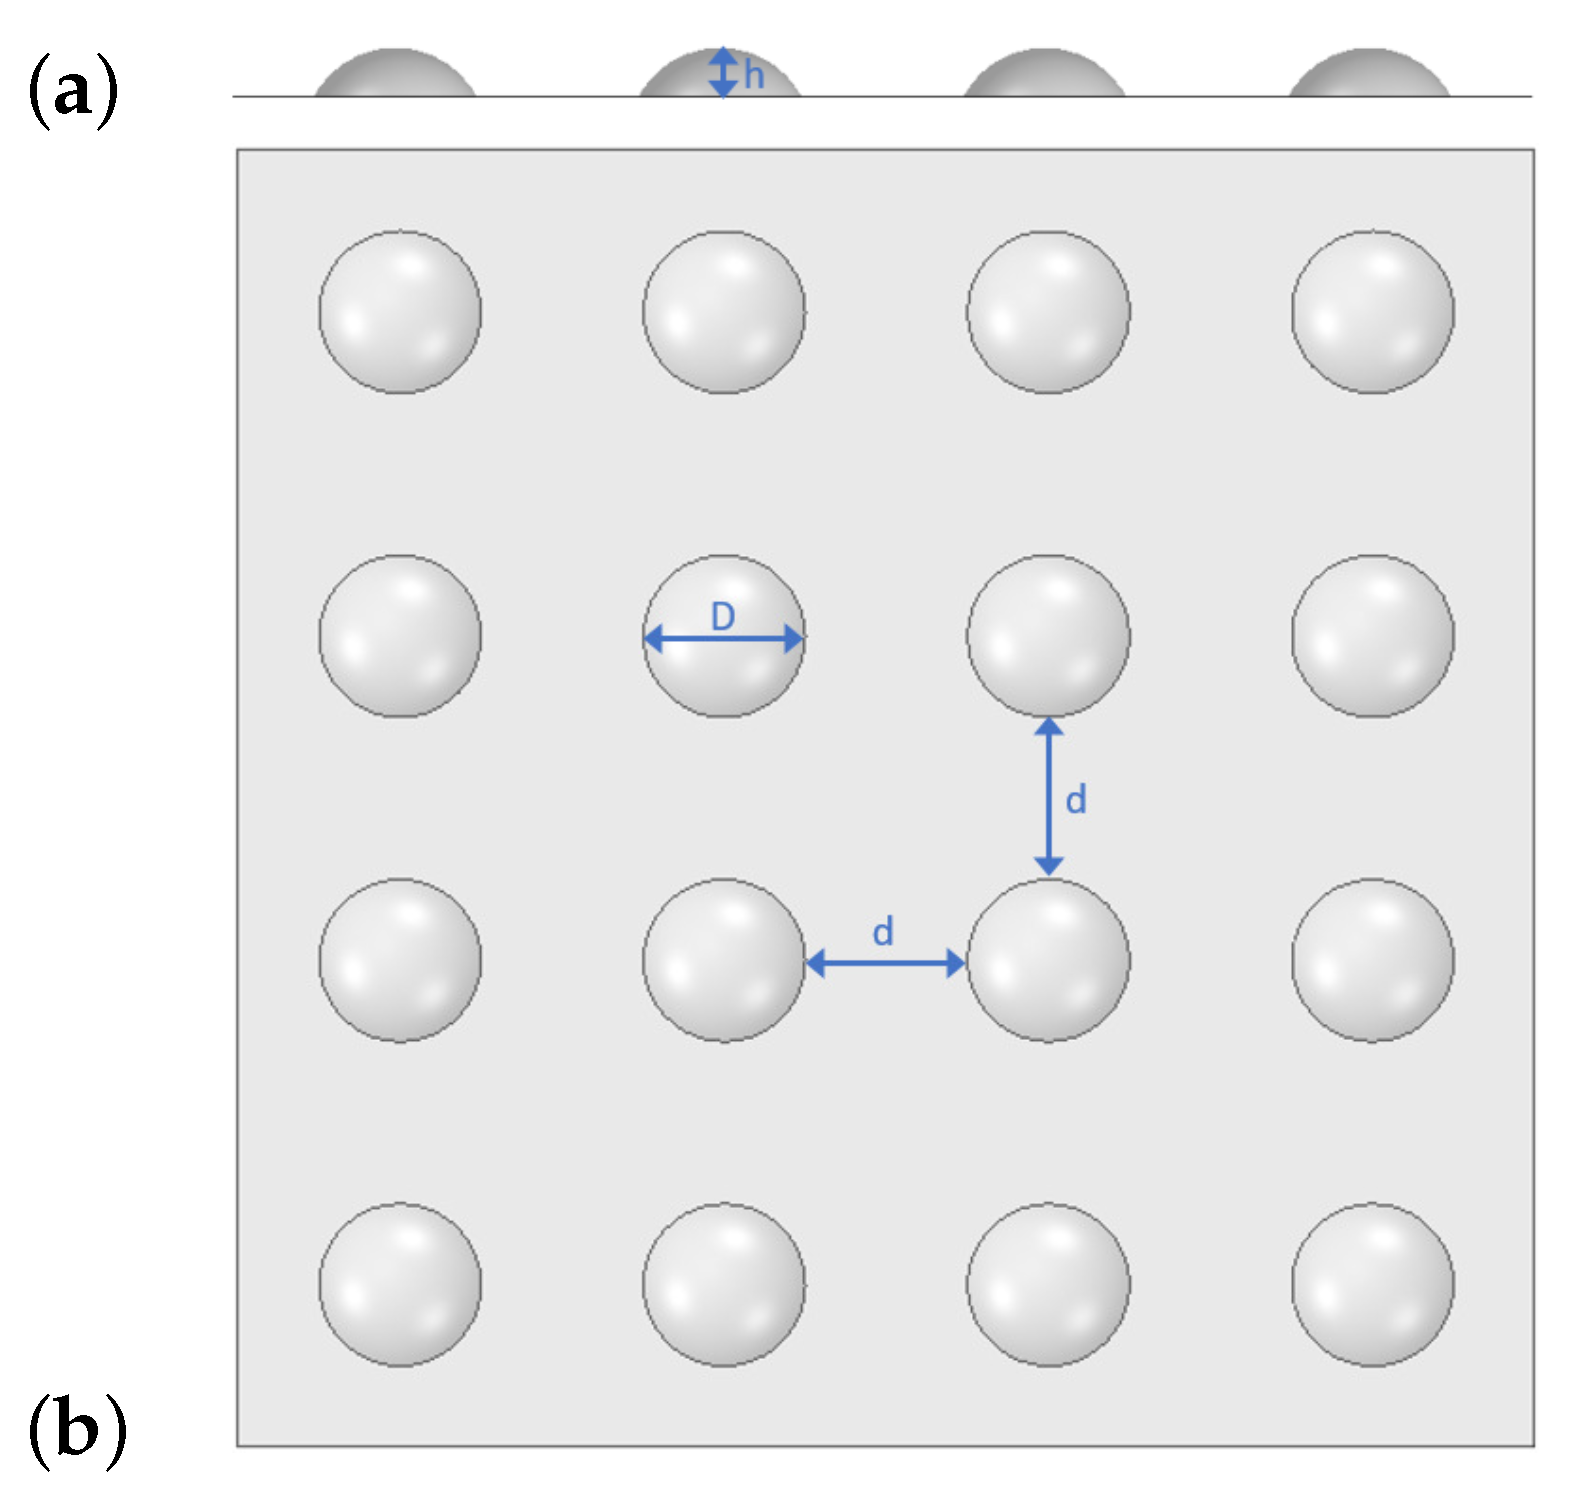
2.2. Wall Texture: An Effective Viscosity Modelling Approach
2.3. Numerical Approach
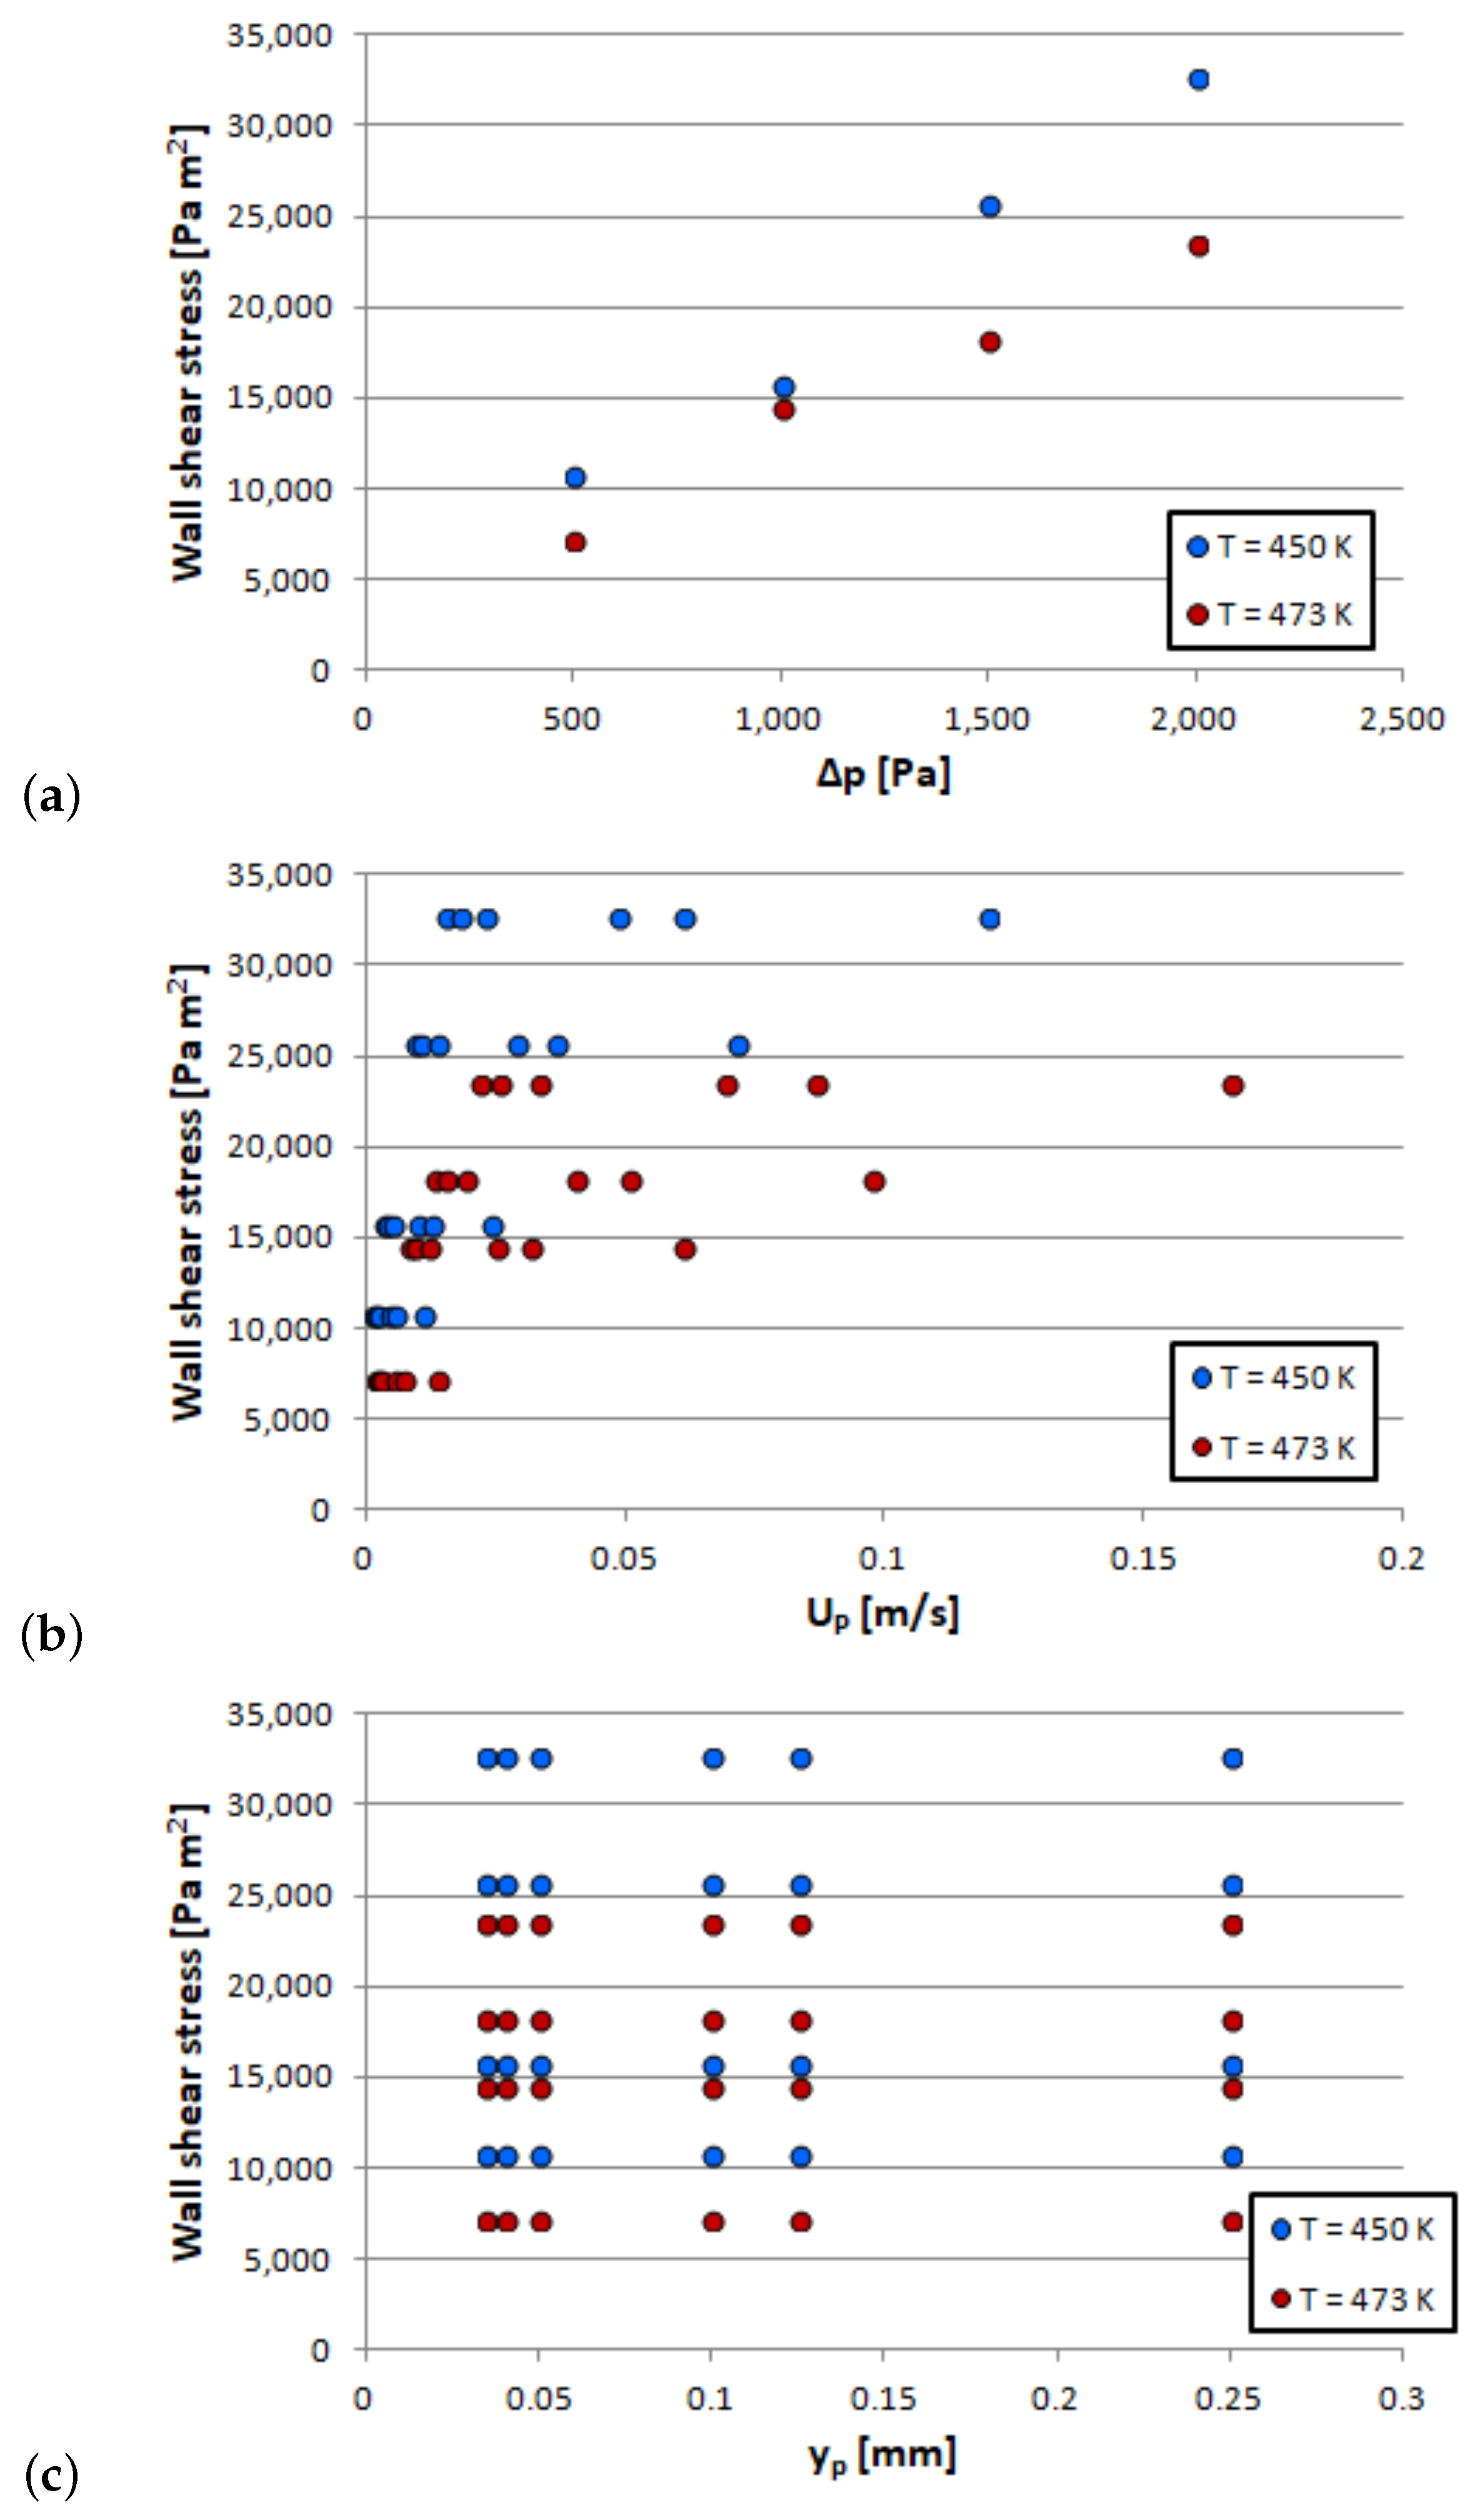
2.3.1. Texture Wall Law: ROM
2.4. Experimental Rubber Characterization
3. Results
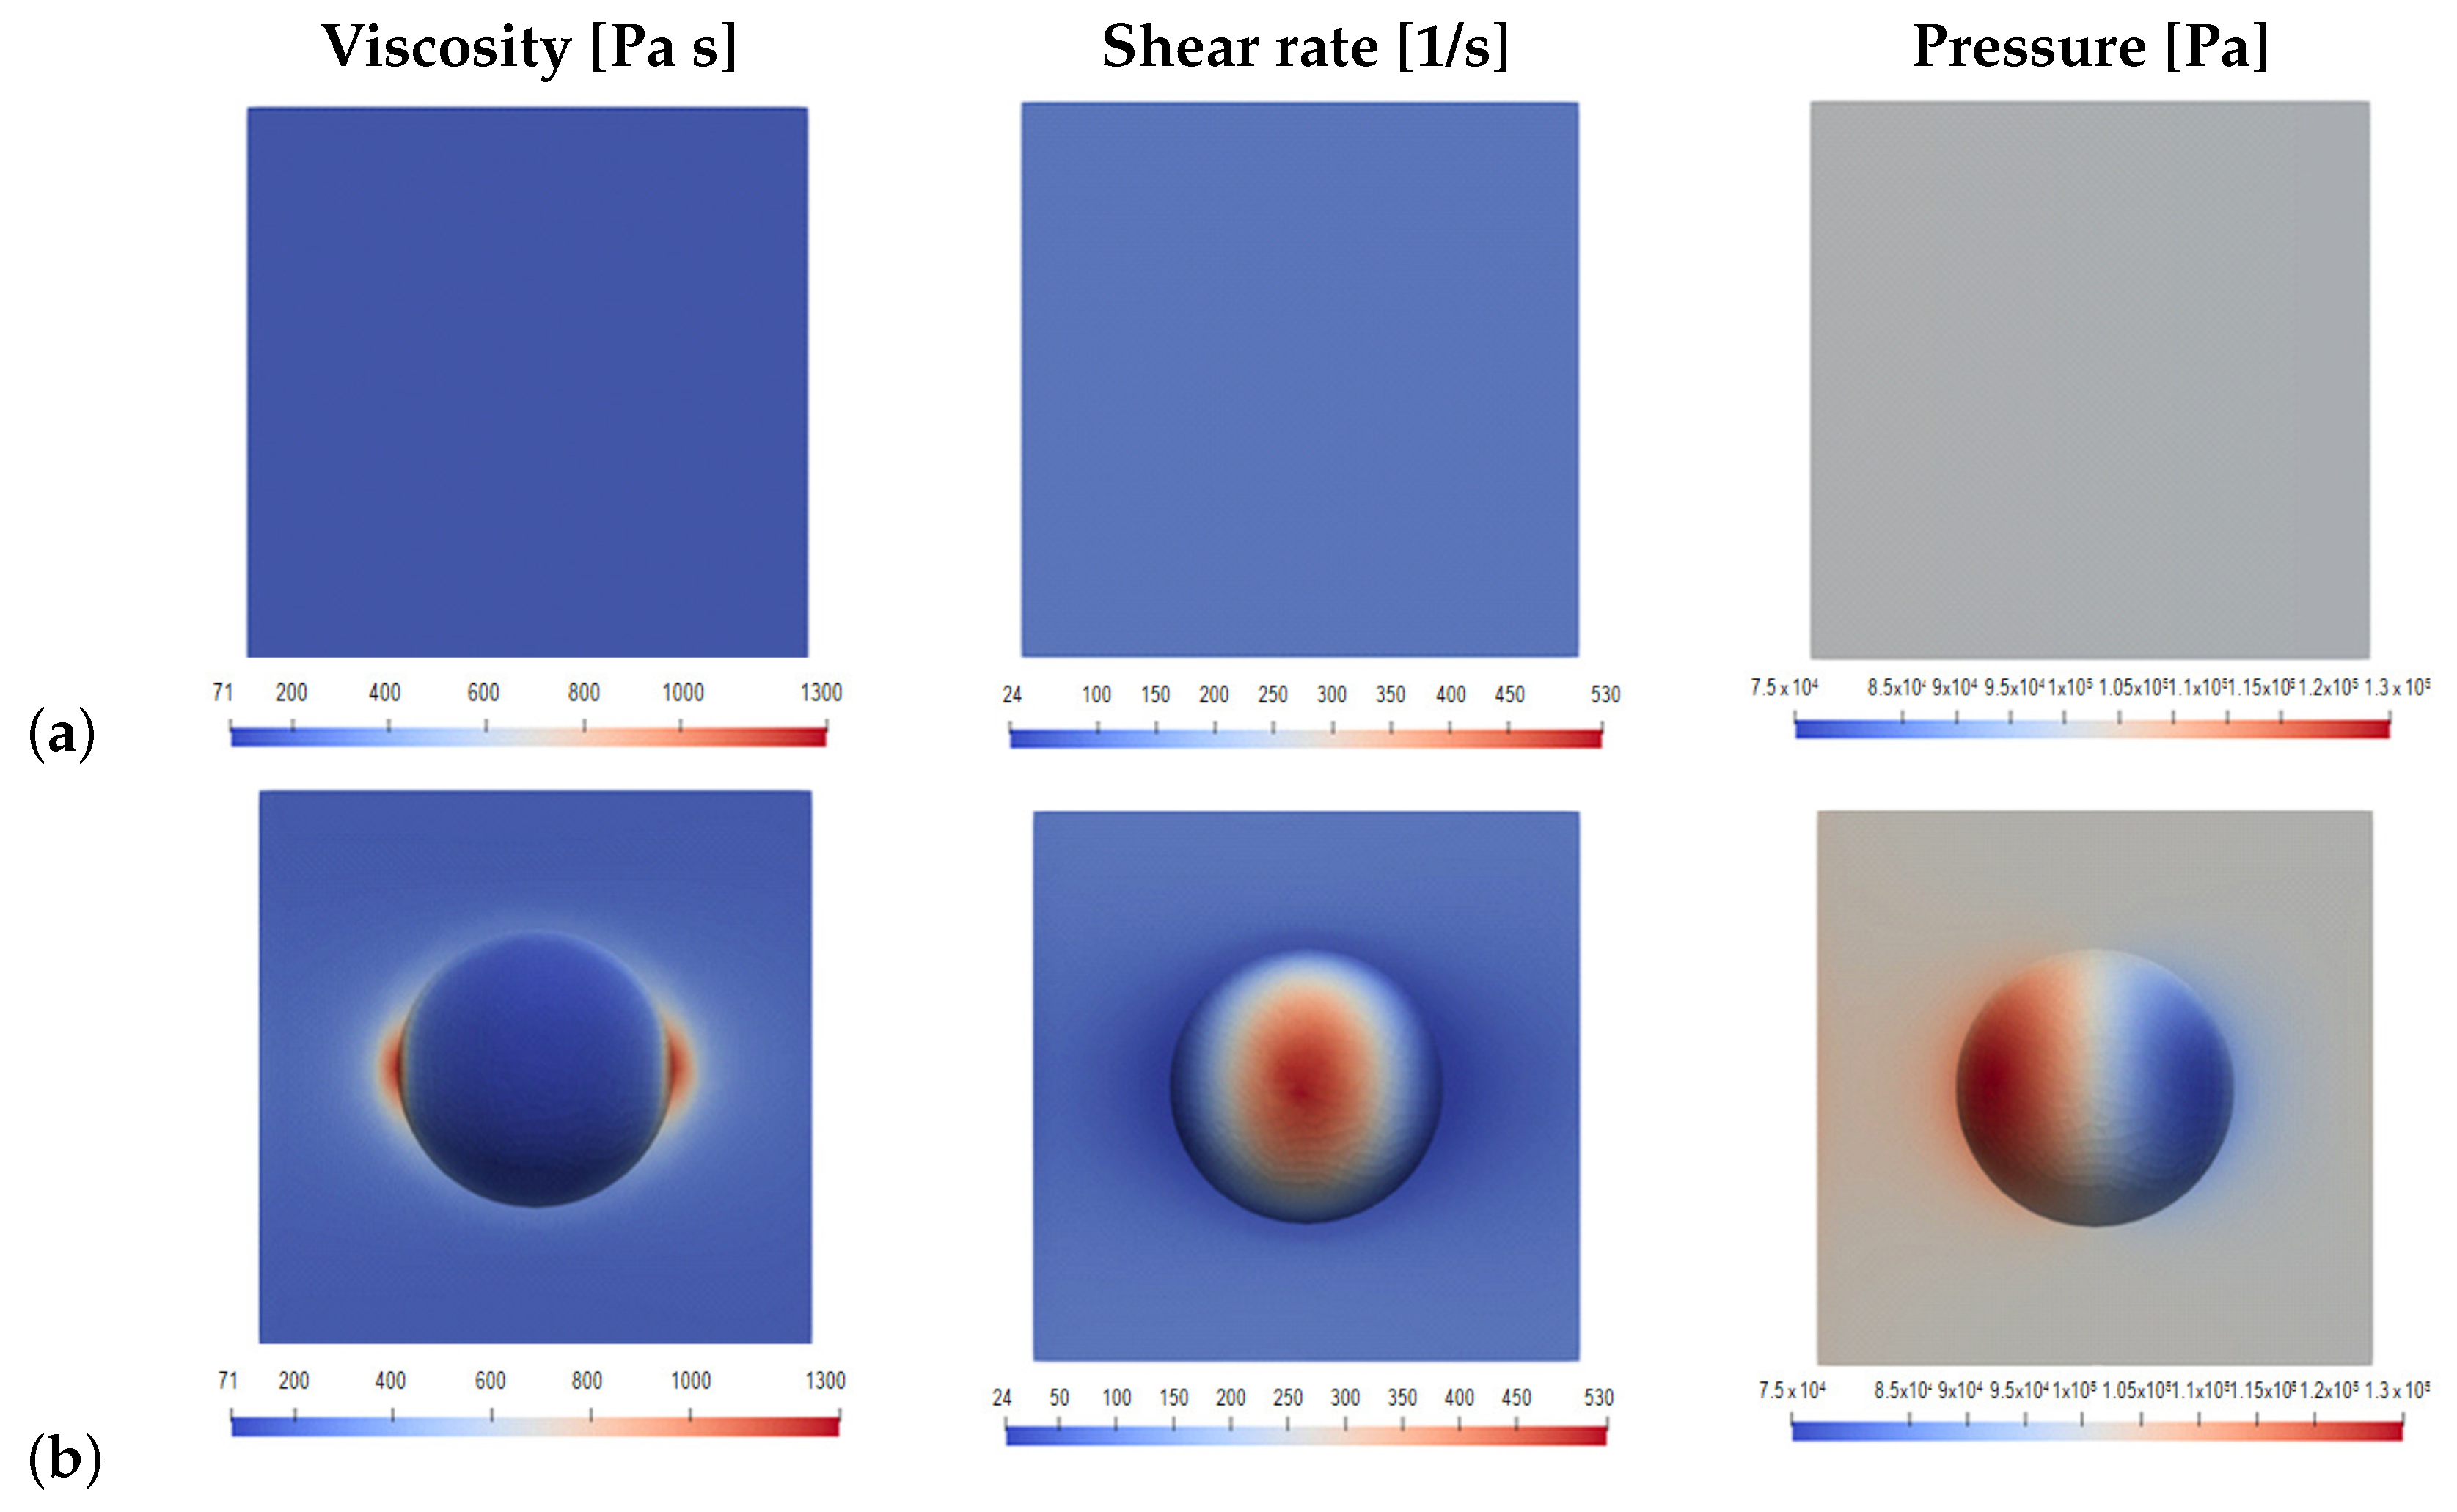
3.1. Rubber Flow Near the Textured Wall
3.2. Rubber Injection in Textured-Wall Moulds
3.2.1. Test Case: Straight Pipe
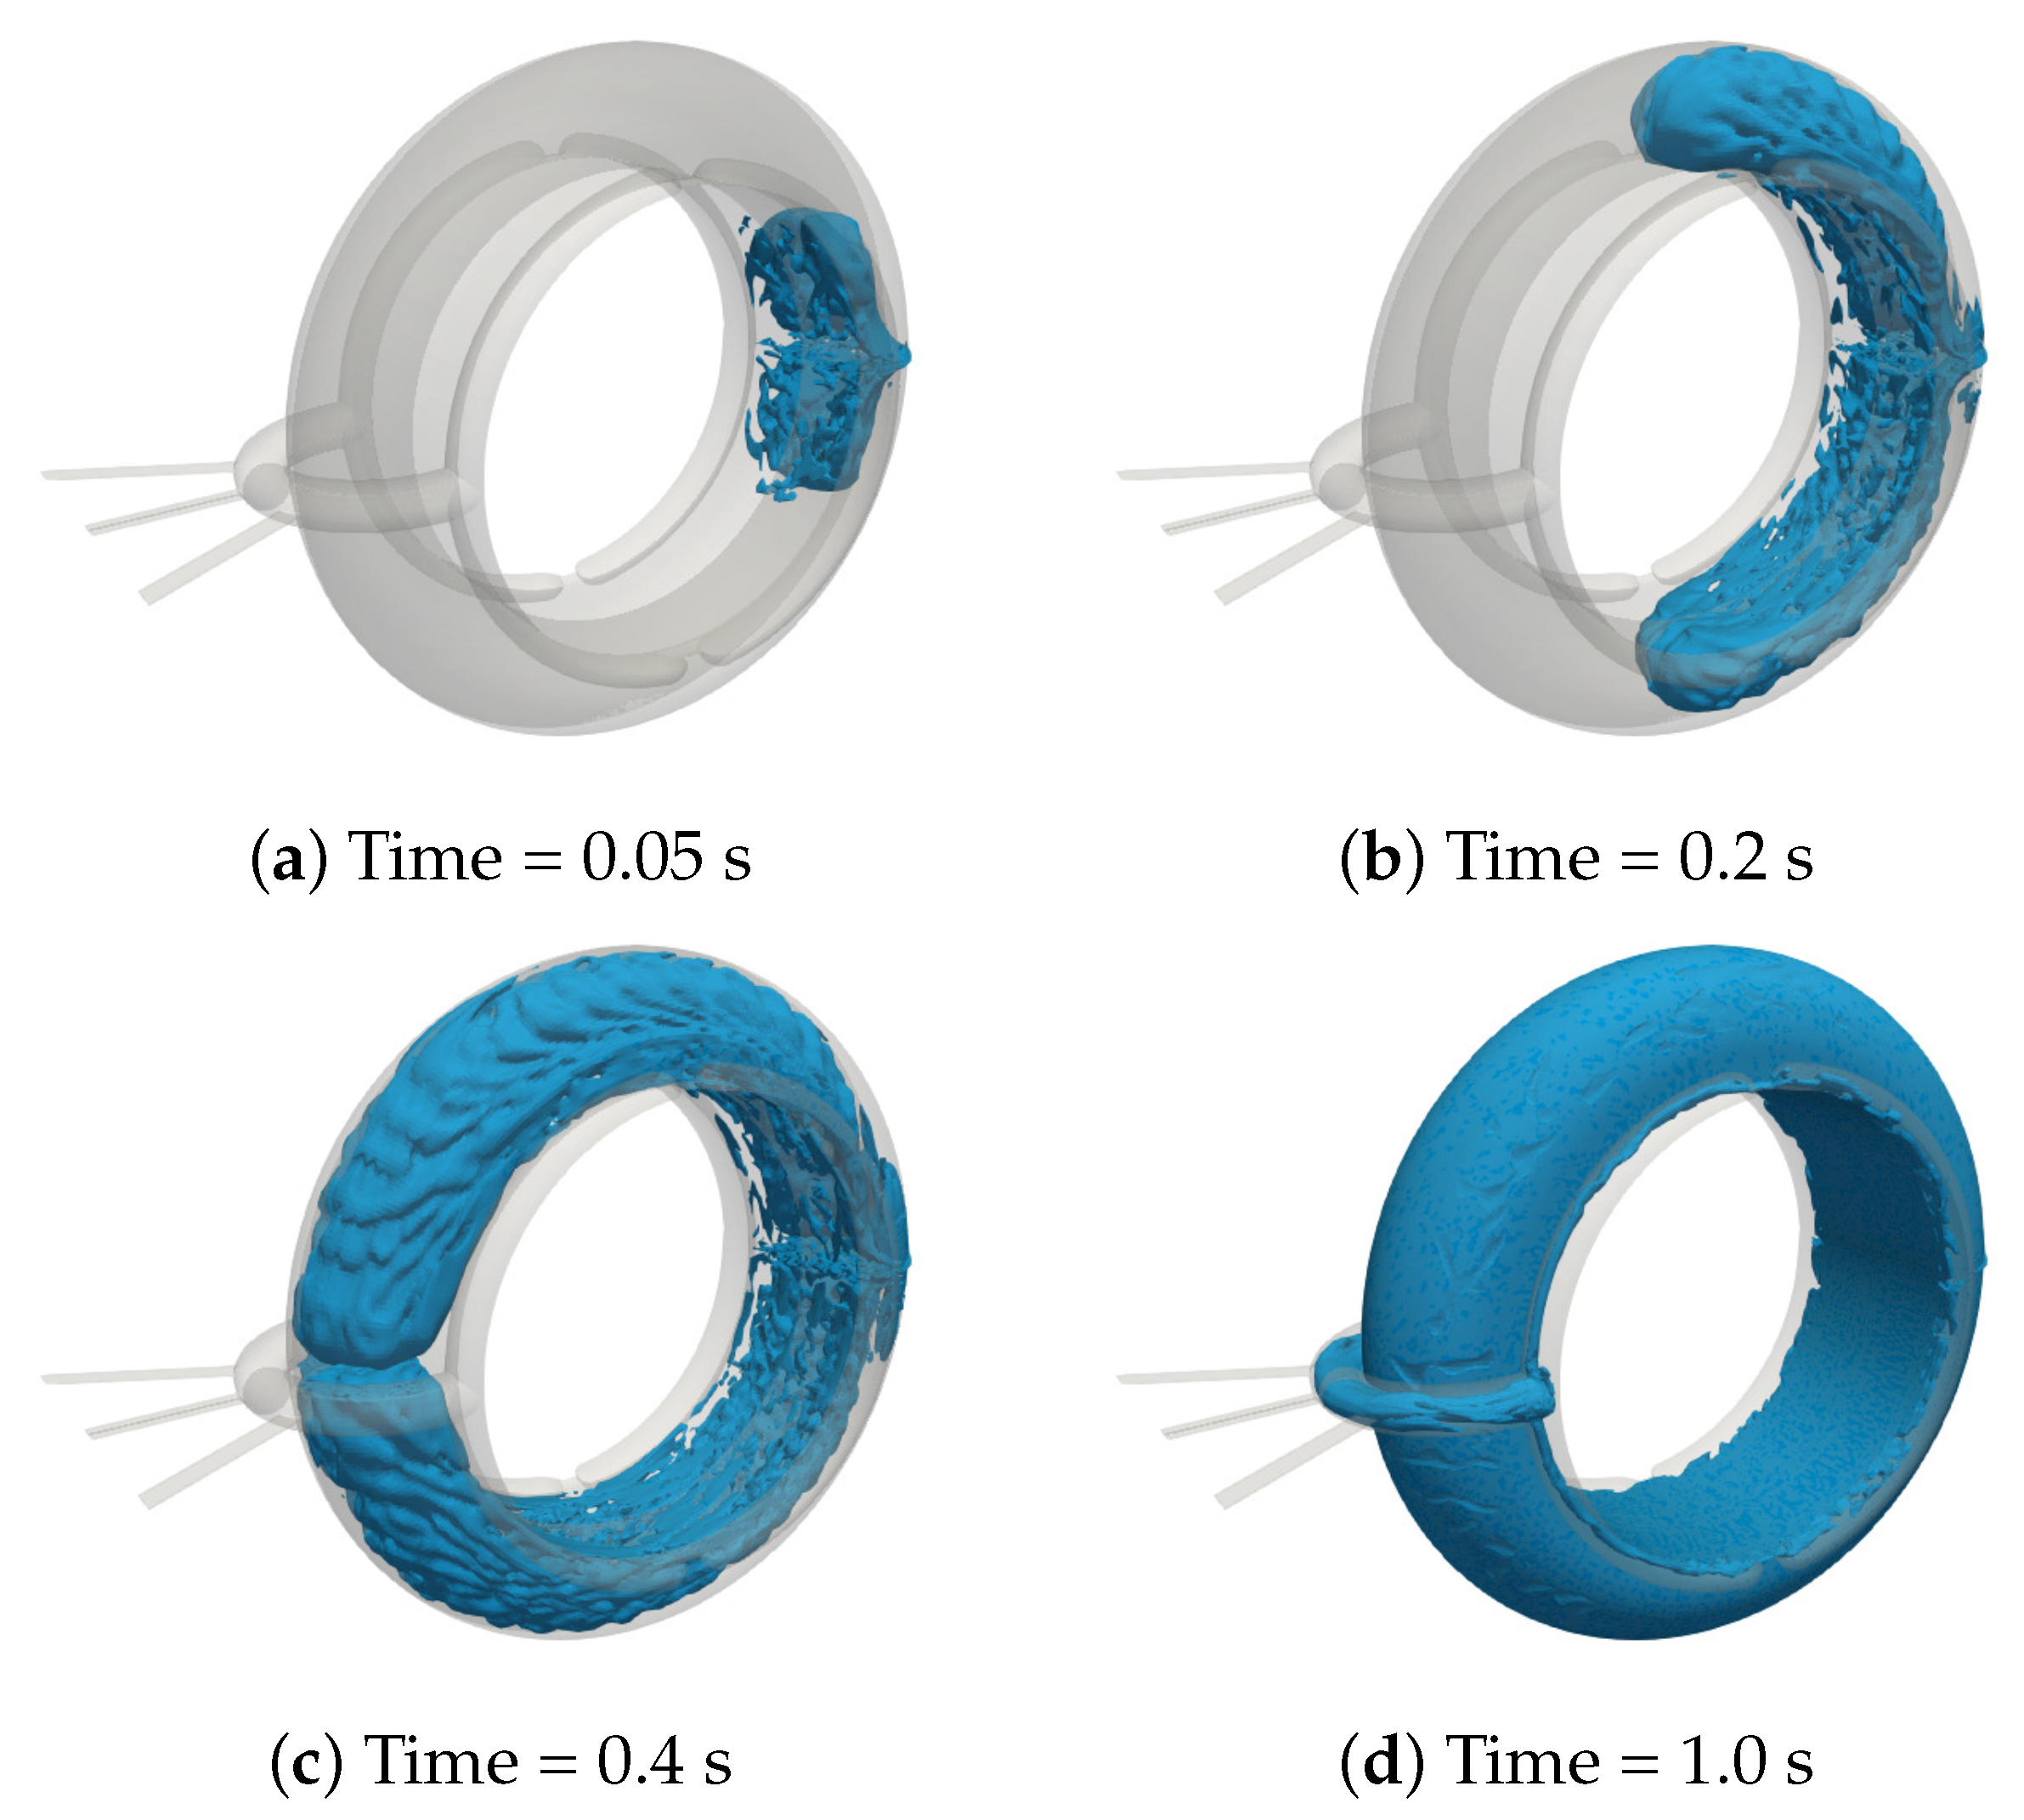
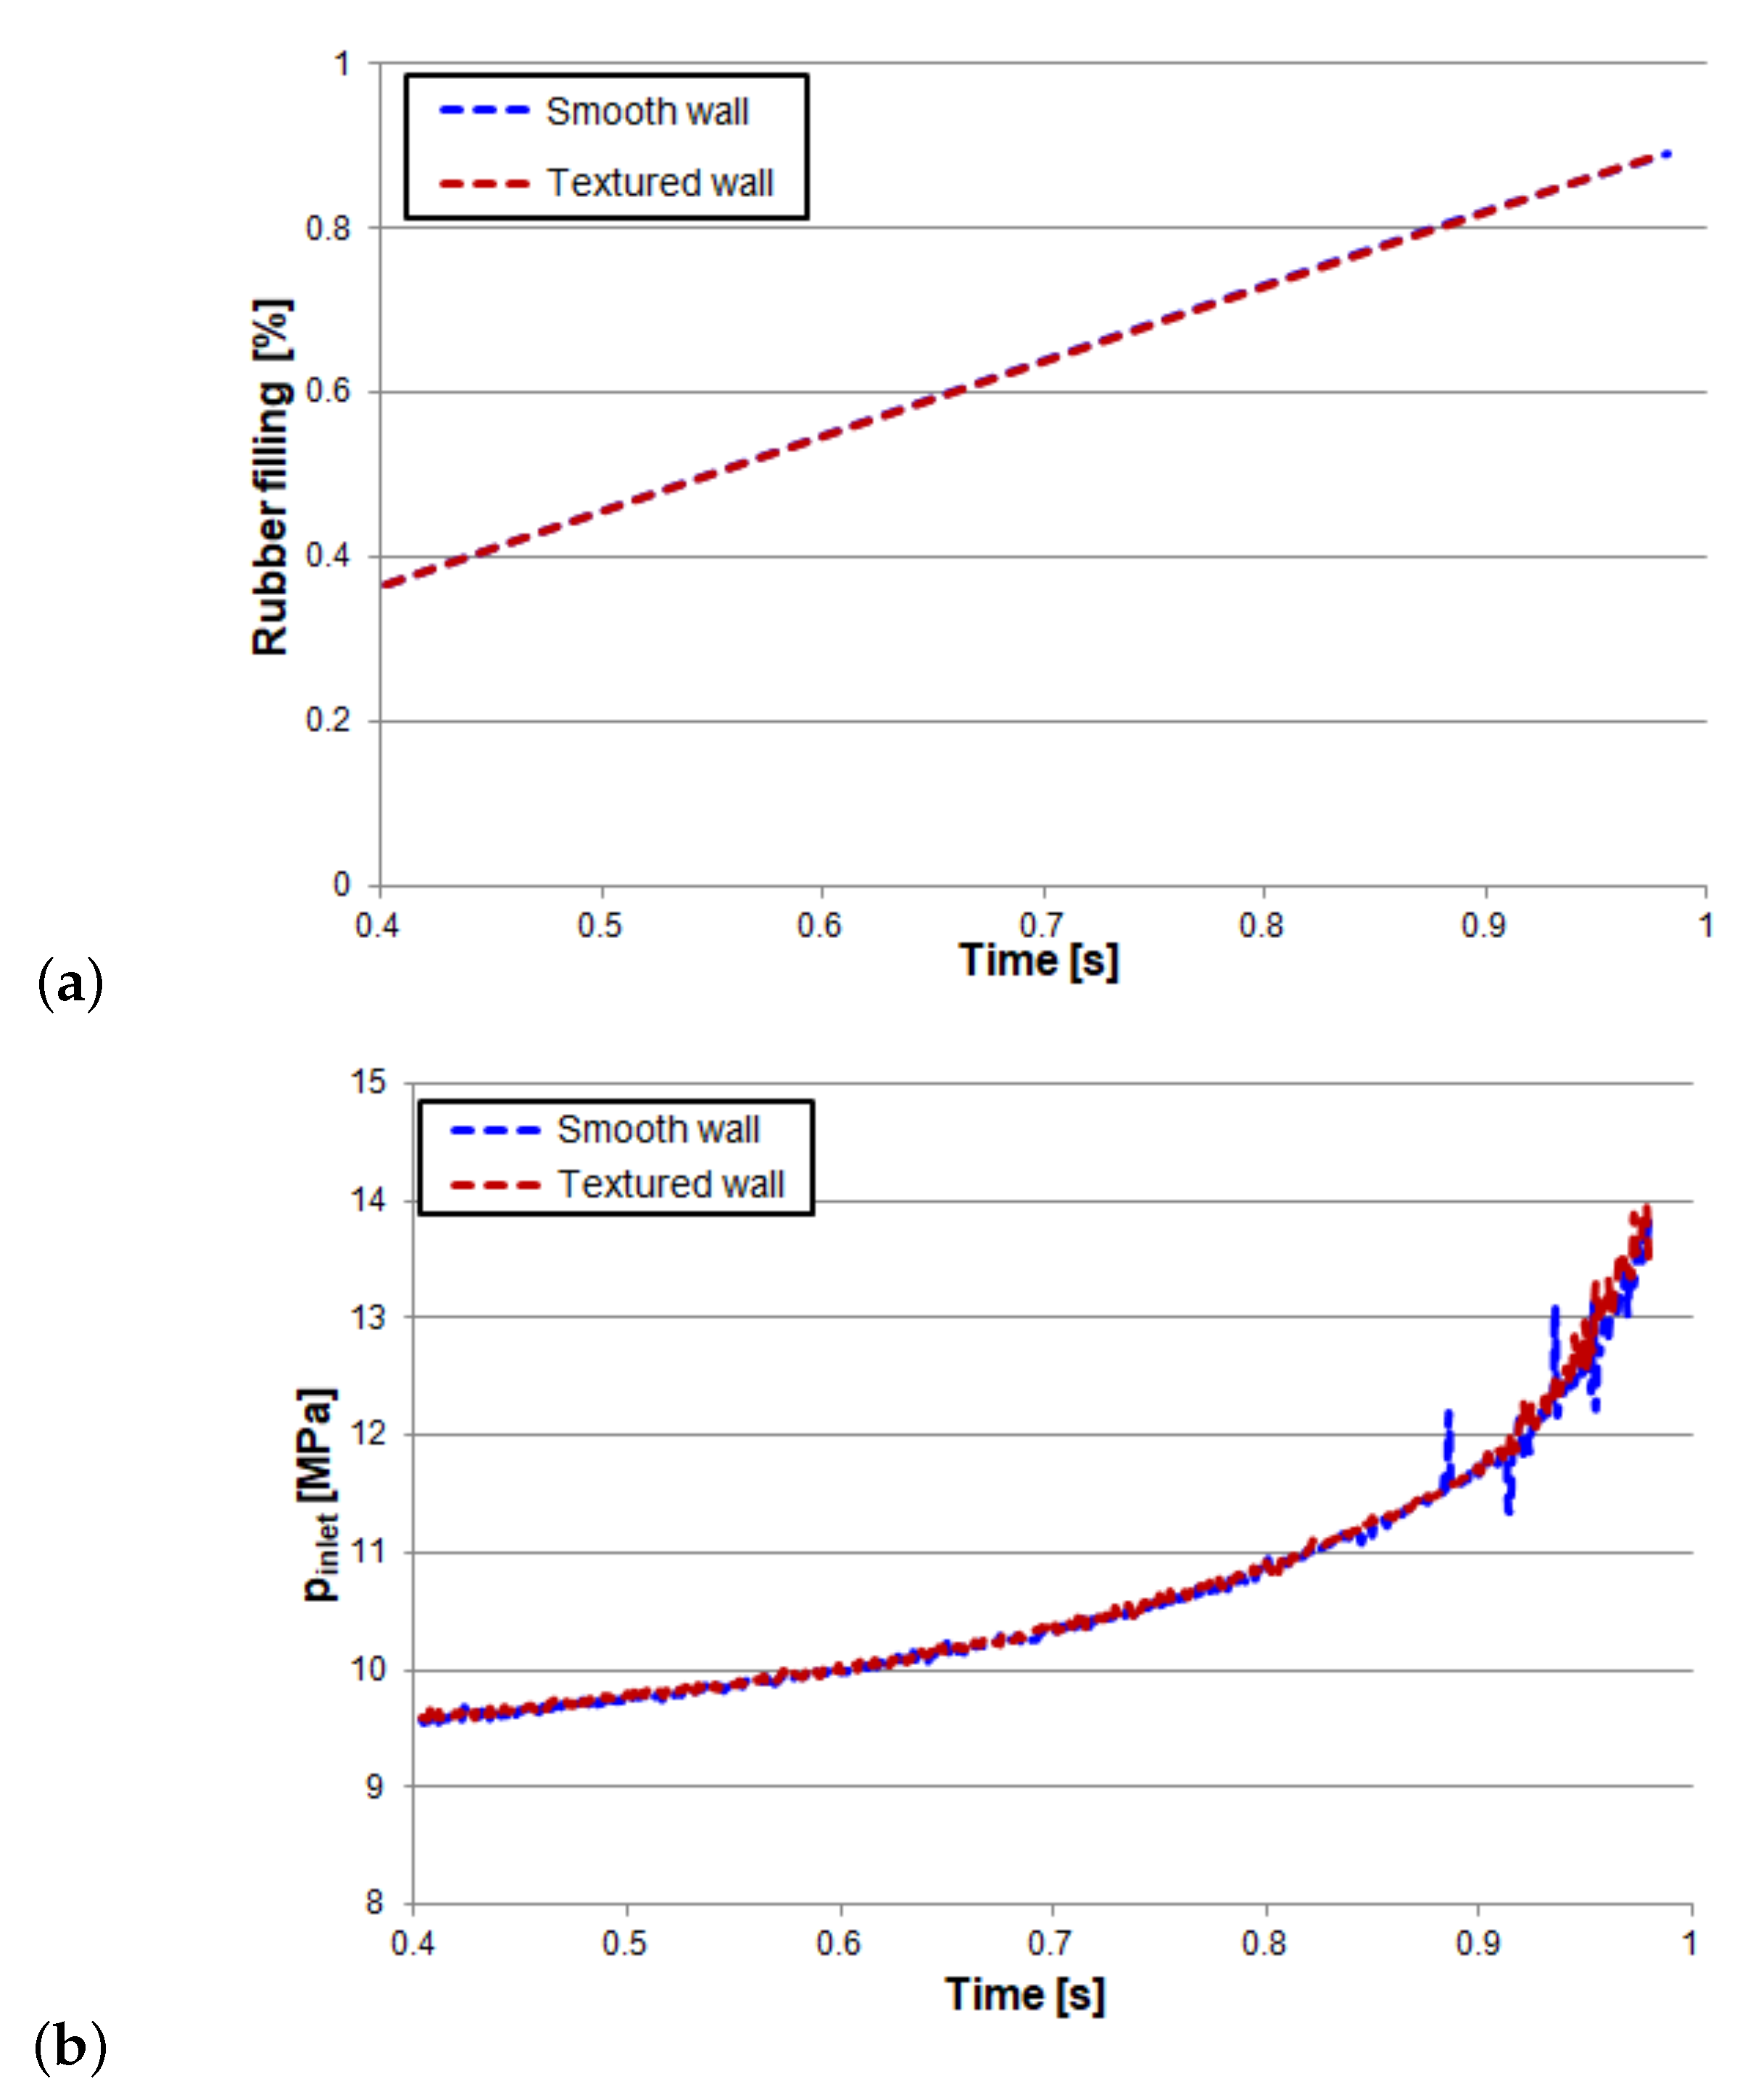
3.2.2. Real Case: D-Ring Mould
4. Discussion
5. Conclusions
Supplementary Materials
Author Contributions
Funding
Institutional Review Board Statement
Informed Consent Statement
Data Availability Statement
Conflicts of Interest
Appendix A. ROM_Output_file.txt
| *********************************************************************** |
| *** ROM summary |
| *** Number of terms: 5 |
| *** Number of dimensions: 3 |
| *** Dimension 1 discretization: 2 2 2 2 2 |
| *** Dimension 2 discretization: 8 8 8 8 8 |
| *** Dimension 3 discretization: 12 12 12 12 12 |
| *********************************************************************** |
| ROM Data: |
| Term 1 |
| Alpha: 412848 |
| Dimension 1 |
| 450 0.853266 473 0.521476 |
| Dimension 2 |
| 3.5 × 10 0.536588 4.39583 × 10 0.475352 5.29167 × 10 0.435076 9.77083 × 10 0.381214 0.000106667 0.131042 0.000124583 0.299927 |
| 0.000133542 0.0146306 0.00025 0.210134 |
| Dimension 3 |
| 0.00136384 0.0608335 0.00824975 0.132693 0.0151356 0.170953 0.0220216 0.203596 0.0289075 0.229498 0.0357934 0.252525 0.0426793 0.276441 |
| 0.0495652 0.294166 0.0564511 0.31351 0.063337 0.327378 0.0908806 0.391973 0.166625 0.51915 |
| Term 2 |
| Alpha: 2667.23 |
| Dimension 1 |
| 450 −0.943357 473 0.33178 |
| Dimension 2 |
| 3.5 × 10 0.0138087 4.39583 × 10 −0.354879 5.29167 × 10 −0.890803 9.77083 × 10 0.0510481 0.000106667 0.0175478 0.000124583 |
| −0.114979 0.000133542 −0.00560872 0.00025 0.253328 |
| Dimension 3 |
| 0.00136384 −0.168722 0.00824975 0.816757 0.0151356 −0.286778 0.0220216 −0.0292196 0.0289075 −0.131955 0.0357934 −0.138186 0.0426793 |
| 0.330298 0.0495652 −0.0797557 0.0564511 0.160481 0.063337 −0.093528 0.0908806 0.18641 0.166625 0.011386 |
| Term 3 |
| Alpha: 1645.94 |
| Dimension 1 |
| 450 0.798857 473 0.601521 |
| Dimension 2 |
| 3.5 × 10 −0.25005 4.39583 × 10 0.157966 5.29167 × 10 0.0714464 9.77083 × 10 0.868813 0.000106667 0.298654 0.000124583 |
| 0.217874 0.000133542 0.010628 0.00025 0.125718 |
| Dimension 3 |
| 0.00136384 0.623631 0.00824975 0.0585777 0.0151356 −0.631778 0.0220216 −0.255556 0.0289075 −0.00579108 0.0357934 −0.0640496 0.0426793 |
| 0.0493176 0.0495652 −0.0170427 0.0564511 0.252543 0.063337 −0.111981 0.0908806 0.110066 0.166625 0.218881 |
| Term 4 |
| Alpha: 2189.93 |
| Dimension 1 |
| 450 −0.652909 473 −0.757436 |
| Dimension 2 |
| 3.5 × 10 0.0795748 4.39583 × 10 0.824329 5.29167 × 10 −0.537909 9.77083 × 10 0.0884352 0.000106667 0.0303996 0.000124583 |
| 0.0814518 0.000133542 0.00397326 0.00025 −0.097 |
| Dimension 3 |
| 0.00136384 −0.00741717 0.00824975 0.183312 0.0151356 0.137525 0.0220216 −0.756504 0.0289075 0.535539 0.0357934 −0.174232 0.0426793 |
| 0.0858151 0.0495652 −0.0884338 0.0564511 −0.0504824 0.063337 0.0901165 0.0908806 0.177468 0.166625 −0.0249437 |
| Term 5 |
| Alpha: 1087.76 |
| Dimension 1 |
| 450 −0.353853 473 0.935301 |
| Dimension 2 |
| 3.5 × 10 −0.345931 4.39583 × 10 −0.171289 5.29167 × 10 0.914857 9.77083 × 10 −0.0957467 0.000106667 −0.0329129 0.000124583 |
| 0.00318454 0.000133542 0.000155344 0.00025 0.0613852 |
| Dimension 3 |
| 0.00136384 0.139599 0.00824975 0.33411 0.0151356 −0.215309 0.0220216 0.0686149 0.0289075 0.00205378 0.0357934 −0.0832903 0.0426793 |
| 0.0700626 0.0495652 −0.451532 0.0564511 −0.679474 0.063337 0.363554 0.0908806 0.0879399 0.166625 0.022273 |
References
- Power-Gen International; EEUU: New Orleans, LA, USA, 2013.
- Valdés, J.; Bielsa, J.; Nadal, I.; Miana, M.; Jiménez, M.; Pütz, T. Dynamic simulation of contamination tests in hydraulic cylinder seals. In Proceedings of the 20th International Conference on Fluid Sealing, Nottingham, UK, 7–9 October 2009. [Google Scholar]
- Mouldtex Project. Available online: www.mouldtex-project.eu (accessed on 30 October 2017).
- Gerber, A.; Dubay, R.; Healy, A. CFD-based predictive control of melt temperature in plastic injection molding. Appl. Math. Model. 2006, 30, 884–903. [Google Scholar] [CrossRef]
- Wittemann, F.; Maertens, R.; Kärger, L.; Henning, F. Injection molding simulation of short fiber reinforced thermosets with anisotropic and non-Newtonian flow behavior. Compos. Part A Appl. Sci. Manuf. 2019, 124, 105476. [Google Scholar] [CrossRef]
- Laschet, G.; Nokhostin, H.; Koch, S.; Meunier, M.; Hopmann, C. Prediction of effective elastic properties of a polypropylene component by an enhanced multiscale simulation of the injection molding process. Mech. Mater. 2020, 140, 103225. [Google Scholar] [CrossRef]
- Kitayama, S.; Tamada, K.; Takano, M.; Aiba, S. Numerical optimization of process parameters in plastic injection molding for minimizing weldlines and clamping force using conformal cooling channel. J. Manuf. Process. 2018, 32, 782–790. [Google Scholar] [CrossRef]
- Sharma, P.; Chandra, L.; Ghoshdastidar, P.; Shekhar, R. A novel approach for modelling fluid flow and heat transfer in an Open Volumetric Air Receiver using ANSYS-FLUENT. Sol. Energy 2020, 204, 246–255. [Google Scholar] [CrossRef]
- Ramorino, G.; Girarki, M.; Agnelli, S. Injection Molding of Engineering Rubber Components: A Comparison Between Experimental Results and Numerical Simulation. Int. J. Mater. Form. 2010, 3, 551–554. [Google Scholar] [CrossRef]
- OpenFOAM-v1706. Available online: https://www.openfoam.com/releases/openfoam-v1706/ (accessed on 5 June 2017).
- Wittemann, F.; Maertens, R.; Bernath, A.; Hohberg, M.; Kärger, L.; Henning, F. Simulation of Reinforced Reactive Injection Molding with the Finite Volume Method. J. Compos. Sci. 2018, 2, 5. [Google Scholar] [CrossRef]
- Loaldi, D.; Regi, F.; Baruffi, F.; Calaon, M.; Quagliotti, D.; Zhang, Y.; Tosello, G. Experimental Validation of Injection Molding Simulations of 3D Microparts and Microstructured Components Using Virtual Design of Experiments and Multi-Scale Modeling. Micromachines 2020, 11, 614. [Google Scholar] [CrossRef]
- Surace, R.; Sorgato, M.; Bellantone, V.; Modica, F.; Lucchetta, G.; Fassi, I. Effect of cavity surface roughness and wettability on the filling flow in micro injection molding. J. Manuf. Process. 2019, 43, 105–111. [Google Scholar] [CrossRef]
- Baruffi, F.; Charalambis, A.; Calaon, M.; Elsborg, R.; Tosello, G. Comparison of micro and conventional injection moulding based on process precision and accuracy. Procedia CIRP 2018, 75, 149–154. [Google Scholar] [CrossRef]
- Masato, D.; Sorgato, M.; Lucchetta, G. A new approach to the evaluation of ejection friction in micro injection molding. J. Manuf. Process. 2021, 62, 28–36. [Google Scholar] [CrossRef]
- Hill, S.; Kamper, K.; Dasbach, U.; Dopper, J.; Erhfeld, W.; Kaupert, M. An investigation of computer modelling for micro-injection moulding. WIT Trans. Built Environ. 1970, 13. [Google Scholar] [CrossRef]
- Fernandes, C.; Pontes, A.J.; Viana, J.C.; Gaspar-Cunha, A. Modeling and Optimization of the Injection-Molding Process: A Review. Adv. Polym. Technol. 2018, 37, 429–449. [Google Scholar] [CrossRef]
- Nakhoul, R.; Laure, P.; Silva, L.; Vincent, M. A multiphase Eulerian approach for modelling the polymer injection into a textured mould. Int. J. Mater. Form. 2018, 11, 53–66. [Google Scholar] [CrossRef]
- Rytka, C.; Kristiansen, P.; Neyer, A. Iso-and variothermal injection compression moulding of polymer micro-and nanostructures for optical and medical applications. J. Micromech. Microeng. 2015, 25, 065008. [Google Scholar] [CrossRef]
- Khalilian, S.A.; Park, S.S.; Freiheit, T.I. The application of commercial injection molding software to micro-component design and process development. In Proceedings of the 8th International Conference on MicroManufacturing (ICOMM 2013), Victoria, BC, Canada, 25–28 March 2013. [Google Scholar]
- Miller, S.; Jasak, H.; Boger, D.; Paterson, E.; Nedungadi, A. A pressure-based, compressible, two-phase flow finite volume method for underwater explosions. Comput. Fluids 2013, 87, 132–143. [Google Scholar] [CrossRef]
- Koch, M.; Lechner, C.; Reuter, F.; Köhler, K.; Mettin, R.; Lauterborn, W. Numerical modeling of laser generated cavitation bubbles with the finite volume and volume of fluid method, using OpenFOAM. Comput. Fluids 2016, 126, 71–90. [Google Scholar] [CrossRef]
- Suponitsky, V.; Froese, A.; Barsky, S. Richtmyer–Meshkov instability of a liquid–gas interface driven by a cylindrical imploding pressure wave. Comput. Fluids 2014, 89, 1–19. [Google Scholar] [CrossRef]
- Brackbill, J.; Kothe, D.; Zemach, C. A state-of-the-art review on the mathematical modeling and computer simulation of rubber vulcanization process. J. Comput. Phys. 1992, 100, 335–354. [Google Scholar] [CrossRef]
- Rusche, H. Computational Fluid Dynamics of Dispersed Two-Phase Flows at High Phase Fractions. Ph.D. Thesis, Imperial College London (University of London), London, UK, January 2003. [Google Scholar]
- Feng, D.; Li, X.; Wang, X.; Li, J.; Zhang, X. Capillary filling under nanoconfinement: The relationship between effective viscosity and water-wall interactions. Int. J. Heat Mass Transf. 2018, 118, 900–910. [Google Scholar] [CrossRef]
- Pouplin, A.; Masbernat, O.; Décarre, S.; Liné, A. Wall friction and effective viscosity of a homogeneous dispersed liquid–liquid flow in a horizontal pipe. AIChE J. 2011, 57, 1119–1131. [Google Scholar] [CrossRef]
- Izquierdo, S.; Rafael, R.; Zambrano, V. TWINKLE: A Digital-Twin-Building Kernel for Real-Time Computer-Aided Engineering. Available online: https://github.com/caeliaITAINNOVA/Twinkle (accessed on 15 January 2019).
- Zambrano, V.; Rodríguez-Barrachina, R.; Calvo, S.; Izquierdo, S. TWINKLE: A digital-twin-building kernel for real-time computer-aided engineering. SoftwareX 2020, 11, 100419. [Google Scholar] [CrossRef]
- MESGO Compounding Solutions. Available online: https://www.mesgo.it/ (accessed on 10 May 2021).



| Parameter | Value |
|---|---|
| B | 0.250839 |
| 9947.615 | |
| 0.027699 | |
| n | 0.461665 |
| 0.796923 | |
| 4.291385 | |
| −4.13821 |
| Parameter | Value |
|---|---|
| 3.77 × | |
| 13,350 | |
| 8.72 × | |
| 13,962 | |
| m | 1.22 |
| n | 1.36 |
| 1.05 × | |
| 9124.8 |
| T [K] | Δp [Pa] |
|---|---|
| 450 | 500 |
| 1000 | |
| 1500 | |
| 2000 | |
| 473 | 500 |
| 1000 | |
| 1500 | |
| 2000 |
| Patch | Type | Relevant Boundary Definition |
|---|---|---|
| Inlet (−x) | mappedPatch | Pressure: fixedValue Velocity: mappedField |
| Outlet (+x) | patch | Pressure: fixedValue |
| Lateral wall (−y) | symmetry | Symmetry |
| Lateral wall (+y) | symmetry | Symmetry |
| Upper wall (+z) | wall | Velocity: non-texturized case |
| Lower wall (−z) | wall | Velocity: No slip (0 0 0) |
| Cases | [m/s] | D [mm] | L [mm] |
|---|---|---|---|
| 1 | 0.05 | 1 | 20 |
| 2 | 0.08 | ||
| 3 | 0.1 | ||
| 4 | 0.1 | 0.7 | 20 |
| 5 | 1 | ||
| 6 | 1.5 | ||
| 7 | 0.1 | 1 | 20 |
| 8 | 50 | ||
| 9 | 100 |
| Patch | Type | Relevant Boundary Definition |
|---|---|---|
| inlet | patch | Velocity: flowRateInletVelocity |
| outlet_1, outlet_2 | patch | Pressure: fixedValue |
| symmetry | symmetry | symmetry |
| wall | wall | Velocity: noSlip |
| wallTexture | wall | Velocity: noSlip |
| Viscosity: Texture wall law |
Publisher’s Note: MDPI stays neutral with regard to jurisdictional claims in published maps and institutional affiliations. |
© 2021 by the authors. Licensee MDPI, Basel, Switzerland. This article is an open access article distributed under the terms and conditions of the Creative Commons Attribution (CC BY) license (https://creativecommons.org/licenses/by/4.0/).
Share and Cite
García-Camprubí, M.; Alfaro-Isac, C.; Hernández-Gascón, B.; Valdés, J.R.; Izquierdo, S. Numerical Approach for the Assessment of Micro-Textured Walls Effects on Rubber Injection Moulding. Polymers 2021, 13, 1739. https://doi.org/10.3390/polym13111739
García-Camprubí M, Alfaro-Isac C, Hernández-Gascón B, Valdés JR, Izquierdo S. Numerical Approach for the Assessment of Micro-Textured Walls Effects on Rubber Injection Moulding. Polymers. 2021; 13(11):1739. https://doi.org/10.3390/polym13111739
Chicago/Turabian StyleGarcía-Camprubí, María, Carmen Alfaro-Isac, Belén Hernández-Gascón, José Ramón Valdés, and Salvador Izquierdo. 2021. "Numerical Approach for the Assessment of Micro-Textured Walls Effects on Rubber Injection Moulding" Polymers 13, no. 11: 1739. https://doi.org/10.3390/polym13111739
APA StyleGarcía-Camprubí, M., Alfaro-Isac, C., Hernández-Gascón, B., Valdés, J. R., & Izquierdo, S. (2021). Numerical Approach for the Assessment of Micro-Textured Walls Effects on Rubber Injection Moulding. Polymers, 13(11), 1739. https://doi.org/10.3390/polym13111739


