Article

Effects of Recycled Fe2O3 Nanofiller on the Structural, Thermal, Mechanical, Dielectric, and Magnetic Properties of PTFE Matrix

by
Ahmad Mamoun Khamis
1,
Zulkifly Abbas
1,2,*,
Raba’ah Syahidah Azis
1,3,
Ebenezer Ekow Mensah
4 and
Ibrahim Abubakar Alhaji
1
1
Department of Physics, Faculty of Science, Universiti Putra Malaysia, Serdang 43400, Selangor, Malaysia
2
Introp, University Putra Malaysia, Serdang 43400, Selangor, Malaysia
3
Institute of Advanced Material, University Putra Malaysia, Serdang 43400, Selangor, Malaysia
4
Faculty of Science Education, University of Education, Winneba, P.O. Box 40 Mampong, Ashanti, Ghana
*
Author to whom correspondence should be addressed.
Polymers 2021, 13(14), 2332; https://doi.org/10.3390/polym13142332
Submission received: 15 June 2021 / Revised: 29 June 2021 / Accepted: 29 June 2021 / Published: 16 July 2021

Abstract

:
The purpose of this study was to improve the dielectric, magnetic, and thermal properties of polytetrafluoroethylene (PTFE) composites using recycled Fe2O3 (rFe2O3) nanofiller. Hematite (Fe2O3) was recycled from mill scale waste and the particle size was reduced to 11.3 nm after 6 h of high-energy ball milling. Different compositions (5–25 wt %) of rFe2O3 nanoparticles were incorporated as a filler in the PTFE matrix through a hydraulic pressing and sintering method in order to fabricate rFe2O3–PTFE nanocomposites. The microstructure properties of rFe2O3 nanoparticles and the nanocomposites were characterized through X-ray diffraction (XRD), field emission scanning electron microscopy (FESEM), and high-resolution transmission electron microscopy (HRTEM). The thermal expansion coefficients (CTEs) of the PTFE matrix and nanocomposites were determined using a dilatometer apparatus. The complex permittivity and permeability were measured using rectangular waveguide connected to vector network analyzer (VNA) in the frequency range 8.2–12.4 GHz. The CTE of PTFE matrix decreased from 65.28 × 10 6 / ° C to 39.84 × 10 6 / ° C when the filler loading increased to 25 wt %. The real (ε′) and imaginary (ε″) parts of permittivity increased with the rFe2O3 loading and reached maximum values of 3.1 and 0.23 at 8 GHz when the filler loading was increased from 5 to 25 wt %. A maximum complex permeability of 1.1 j 0.07 was also achieved by 25 wt % nanocomposite at 10 GHz.

1. Introduction

Mill scale scrap is considered as a solid waste generated in the steel and iron industries. In general, nearly (8–15) kg of mill scale waste is produced per 1000 kg of steel, and the annual production of mill scale waste is over 13.5 million tons according to preliminary statistics. Moreover, most of this waste is stockpiled in factories due to its limited utilization. The iron protoxide in this waste can be dissolved in acid rain and subsequently transferred into soil and ground waters. Mill scale waste has a dual concern with respect to environmental pollution and land occupancy. Therefore, it is crucial to develop a cleaner method to solve the abundant mill scale resource issue [1].
The study of synthetic techniques for ferrite nanoparticles production has recently attracted considerable attention in view of their excellent magnetic and electrical properties [2]. Up to date, various techniques have been used for the synthesis of Fe2O3 nanoparticles (Reference code: 00-024-0072) such as electrospinning technique [3], reduction-oxidation process [4], and hydrolysis process [5]. Indeed, the latter techniques have many disadvantages such as: friability of inorganic nanofibers after calcination [6], non-cost-effective for high contaminant concentrations, and slow reaction speed, respectively. However, mill scale waste materials have never been used to obtain Fe2O3 (00-024-0072) yet.
The microwave absorbing materials (MAMs) are in high demand to absorb the unwanted electromagnetic waves via dielectric and magnetic losses [7]. Microwave materials are used in the frequency range (300 MHz–300 GHz) [8]. MAMs are extensively used for many military and commercial applications such as electromagnetic shielding [9]. Therefore, the development of polymer composites (PCs) with tunable dielectric and magnetic properties have triggered researchers in recent years. The PCs reinforced with nanofillers have been widely studied to provide improved radiation protection properties compared to their metal counterparts. In addition, the electronics, packaging, household, energy, sports, communication, and leisure industries are fully involved in the use of PCs for various applications [10]. The advanced polymer composites can be fabricated based on the requirement by selecting quantity, shape, size, and type, of fillers as the reinforcements in different polymer matrix [11].
Polytetrafluoroethylene (PTFE) is a thermoplastic polymer, and PTFE is the best solvent chemical with the best resistance among thermoplastics. The properties of PTFE such as high service temperature, low moisture absorption, chemical inertness, etc., are crucial for many microwave applications [12]. However, PTFE also has certain disadvantages such as high coefficient of thermal expansion (CTE) [13,14], and low relative complex permittivity (ε) [15]. In addition, several studies have used Fe2O3 as the filler in PTFE matrix. Madusanka et al. synthesized thick film gas sensor using PTFE and α-Fe2O3 nanoparticles [16] while Kang et al. fabricated porous Fe2O3-PTFE nanofiber membranes for photocatalysis applications [17]. Moreover, PTFE-Al-Fe2O3 composites were prepared to be used as reactive materials [18]. The electro-Fenton system was synthesized by combining multiwall carbon nanotubes and Fe@Fe2O3 nanowires with PTFE [19]. It is also worth noting that Fe2O3 nanoparticles have been widely used as fillers to enhance the dielectric and magnetic properties of various matrixes such as polycaprolactone (PCL) [2], polyaniline (PANI) [20], silica [21], and poly(methyl methacrylate) (PMMA) [22]. However, rFe2O3 nanoparticles have never been used as fillers in PTFE matrix for microwave absorption applications yet.
In this study, both CTE and ε were improved by incorporating rFe2O3 into a PTFE matrix. The rFe2O3 nanofiller with enhanced relative complex permittivity can be embedded with a non-conducting polymer matrix such as PTFE to prepare a novel absorber which could have promising attenuation properties for electromagnetic interference (EMI) suppression. This absorber can be further enhanced by the magnetic nature of the Fe2O3 nanoparticles and with their high interfacial density due to their good compactness [23].
Knowledge of the complex permittivity and complex permeability of materials has sparked a great interest in industrial and scientific applications [24]. The interaction between a dielectric sample and high frequency electromagnetic signal can be expressed by the relative complex permittivity equation: ε = ε j ε , where ε′ and ε″, respectively, represent the real and imaginary parts. The ratio of t a n δ = ε / ε represents the loss tangent of a sample and higher values indicate higher attenuation properties [25]. In Addition, the interaction effect between a specimen and the magnetic field component of EM waves can be characterized by the relative complex permeability (µ) which can be expressed by the equation: µ = µ j µ where µ′ and µ″ represent the real and imaginary parts, respectively [26]. The real part determines the amount of energy that the material has stored from an external magnetic field, while the imaginary part measures the attenuation of the magnetic field by the material. The magnetic loss tangent ( t a n δ µ )   is calculated using the equation t a n δ µ = µ µ [27], which represents the power lost versus power stored in a sample [28].
In this research, a low-cost, less complicated and non-chemical synthesis of recycled ferrite was done from mill scale waste. Then, the particle size of rFe2O3 decreased to nano-size via high energy ball milling (HEBM) in order to enhance the dielectric properties. The current study also involves the processes of synthesizing five nanocomposites of rFe2O3—PTFE by varying the rFe2O3 percentage in the nanocomposites. Afterwards, the resultant effects of rFe2O3 loadings on the phase composition, thermal expansion tensile strength, density, complex permittivity, and complex permeability of PTFE matrix were investigated.

2. Materials and Methods

2.1. Materials

The materials used for the preparation of the rFe2O3 nanoparticles and rFe2O3–PTFE nanocomposites were: Mill scale flakes (Perwaja Sdn. Bhd., Chukai, Terengganu, Malaysia) and PTFE molding powder (Fujian Sannong New Materials Co., LTD, Sanming, China) with average particle size 50–110 μm.

2.2. Synthesis of rFe2O3 Nanopartilces from Mill Scale

Mill scale waste was initially cleaned by removing the impurities and then crushed manually into powder using mortar. This was followed by the application of the magnetic separation technique (MST) and Curie temperature separation technique (CTST) to further purify the powdered mill scale. The materials used for these processing techniques were an electromagnet which produced 1 Tesla magnetic field intensity, a thin cylindrical glass tube open at both ends and deionized water of density 1 g/cm3. The CTST was used to separate the wustite (FeO) and magnetite (Fe3O4) contained in the mill scale slurry collected in the cold water separation process [23]. In this separation step, the clamped glass tube closed at the bottom end with a glass stopper, was filled with hot deionized water (100 °C) followed by a small quantity of the slurry. The particles that remained attracted to the magnetic field were inferred to be magnetite (Fe3O4) because of its higher Curie temperature of 585 °C. The rFe3O4 powder obtained was milled via the mechanical alloying technique using the high energy ball mill (SPEX Sample Prep 8000D, Metuchen, NJ, USA) operated by a 1425 rpm 50 Hz motor at a clamp speed of 875 cycles/minute. The powder to balls ratio of 1:10 was used. A total of 7 gm of the Fe3O4 powder was poured into each of the two vials containing the 70 g of steel balls and milled for 6 h to produce nanoparticles. During the ball milling Fe3O4 was converted to Fe2O3 due to high temperature and the content of oxygen in the vials. The preparation process of rFe2O3 nanoparticles is shown in Figure 1.

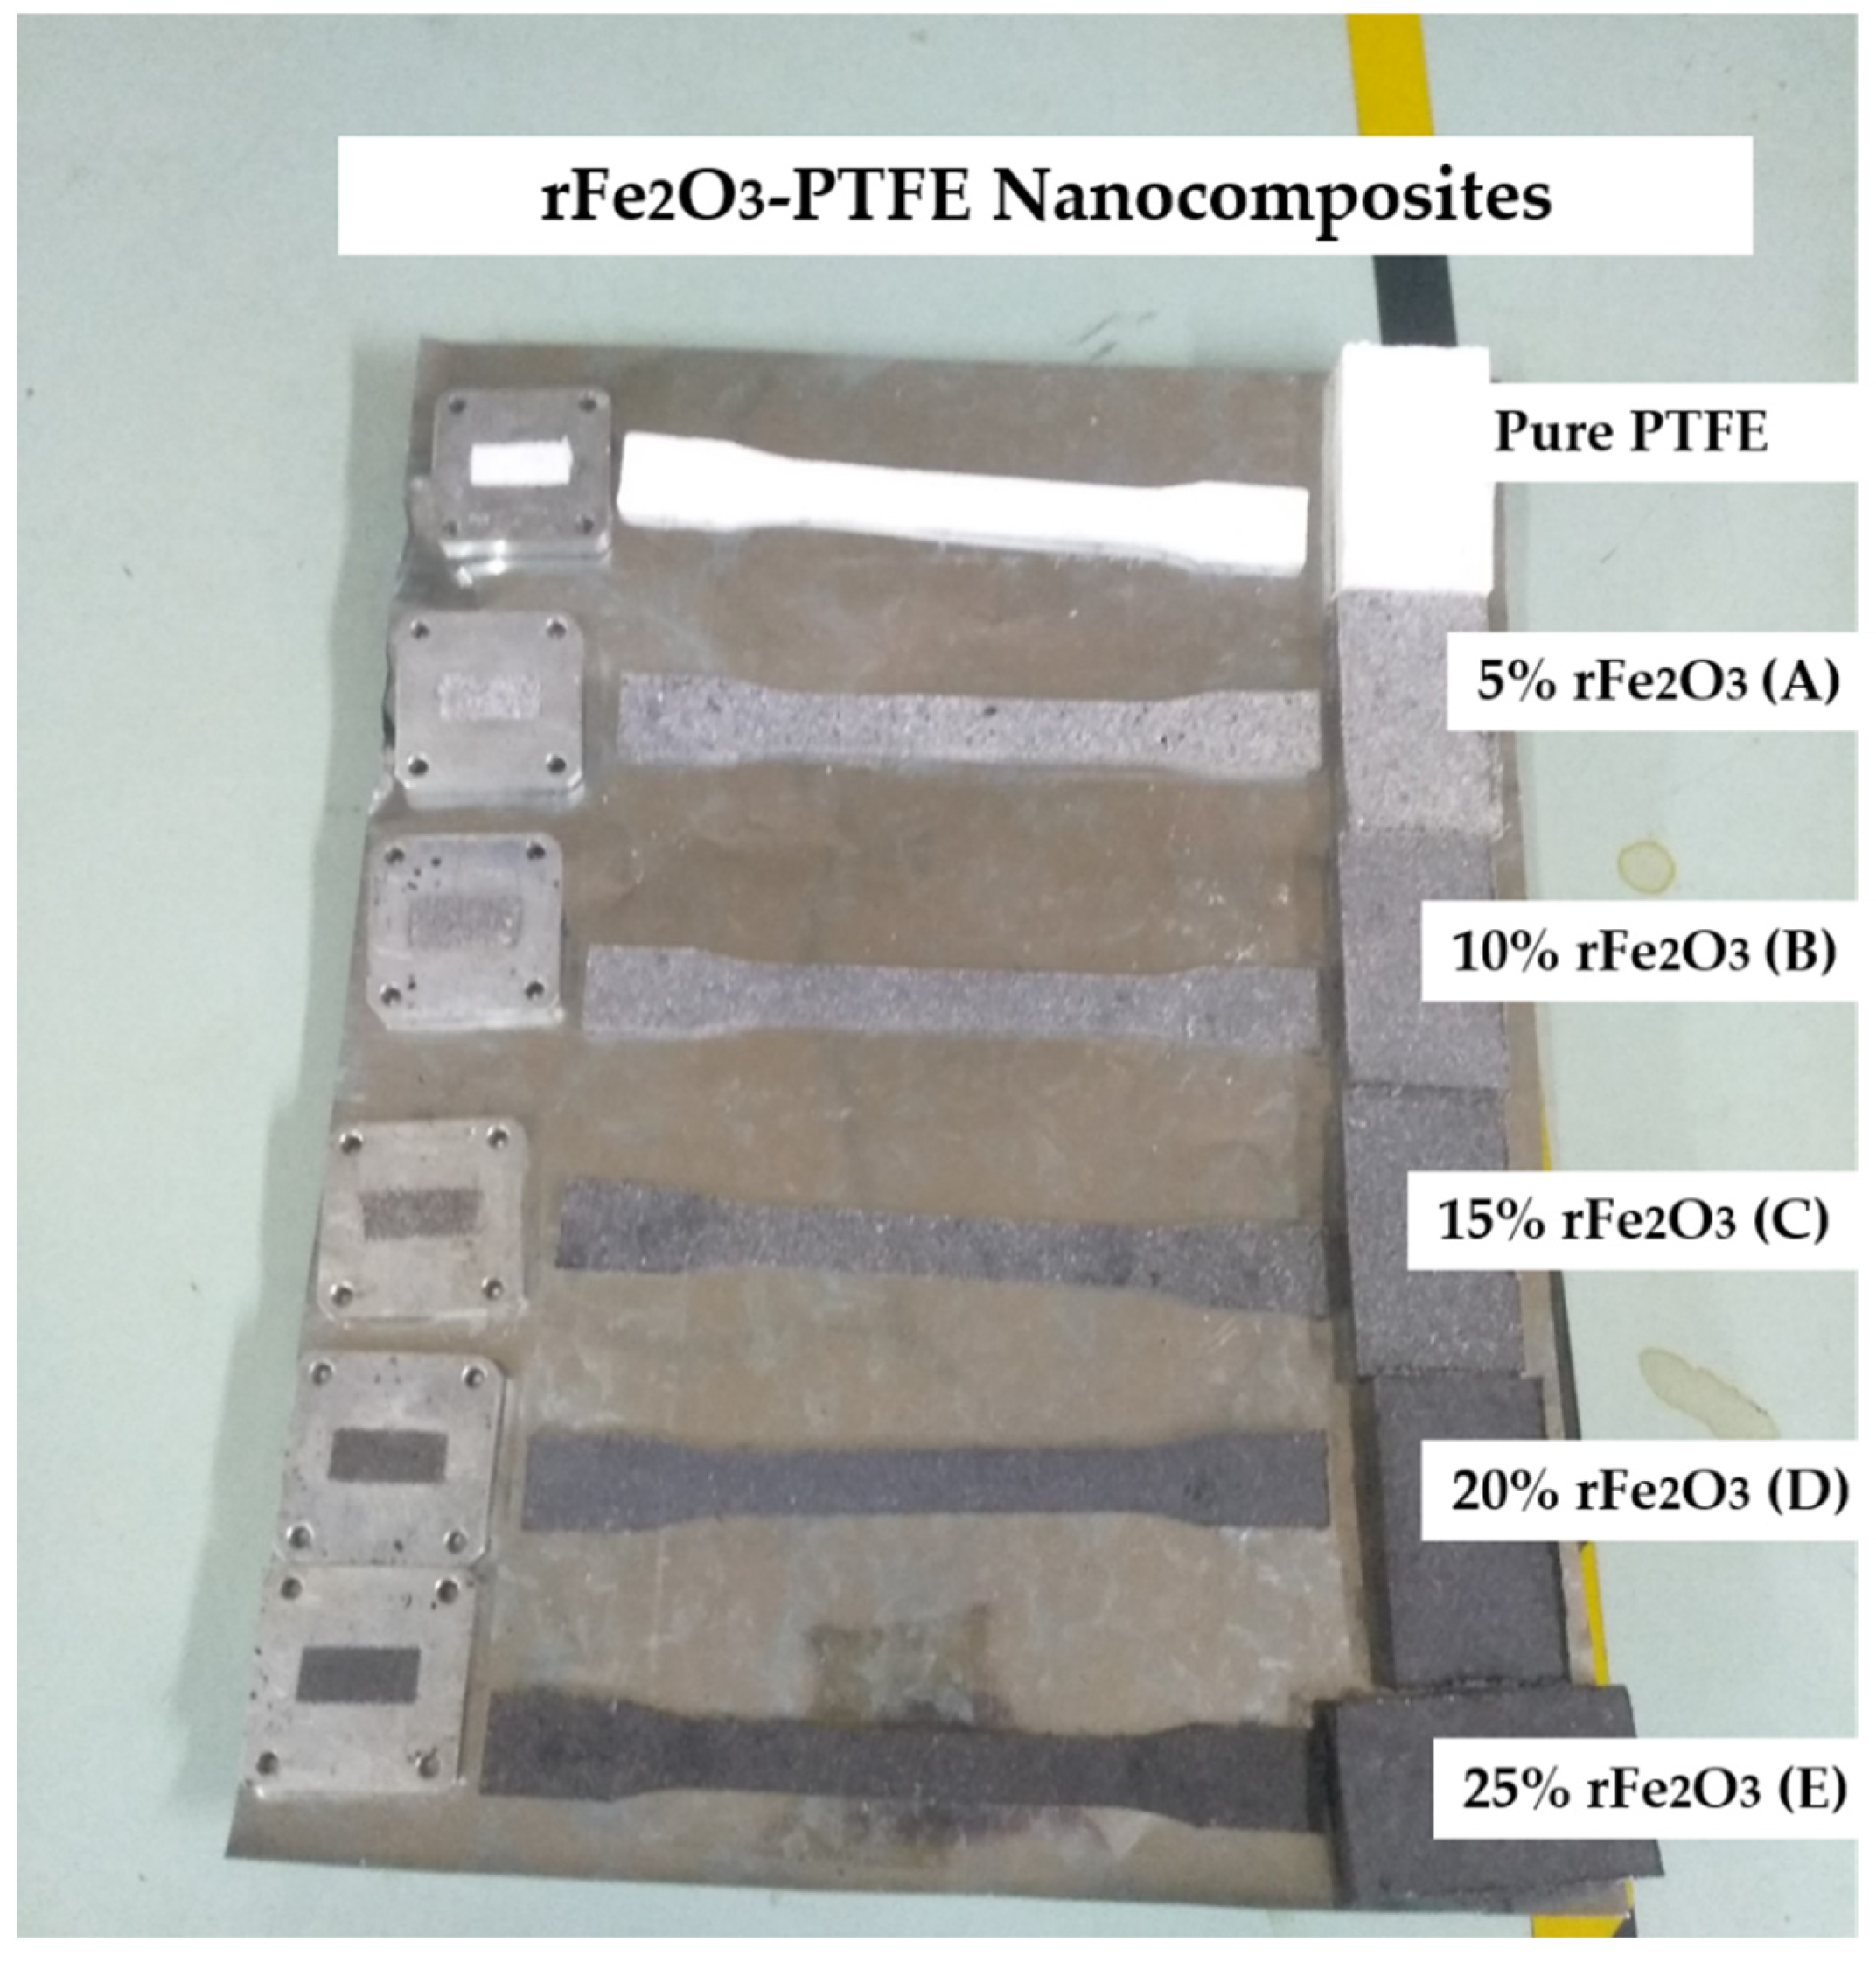
2.3. Fabrication of rFe2O3–PTFE Nanocomposites

The rFe2O3–PTFE nanocomposites shown in Figure 2 were fabricated by mixing PTFE powder with different mass percentages (5–25%) of the rFe2O3 nano-powder as listed in Table 1. The composites were prepared through a hydraulic pressing and sintering method.
Three different shapes of nanocomposites were fabricated for each mass percentage in order to suite different characterization apparatuses. The raw materials were weighed using analytical micro balance (A&D Company, Ltd., GR-200, Tokyo, Japan) which has an accuracy of ±0.00007 g. The mixing was performed via Wing mixer/blender for 10 min. Then, the mixed powders were placed into three different molds and pressed using a hydraulic pressing machine for 5 min under 10 MPa load. Finally, the compact rFe2O3–PTFE nanocomposites were sintered as follows: the compact nanocomposites were heated from room temperature to 380 °C in a furnace at 2.97 °C/min and then maintained for 1 h to allow the PTFE particles to coalesce completely. The cooling process was 1 °C/min from 380 °C to room temperature. The rFe2O3–PTFE nanocomposites preparation is shown in Figure 3. After cooling, the rFe2O3–PTFE nanocomposites were ready for characterizations.

2.4. Characterization

rFe2O3 nanoparticles, PTFE powder, rFe2O3–PTFE nanocomposites were characterized using the following techniques:

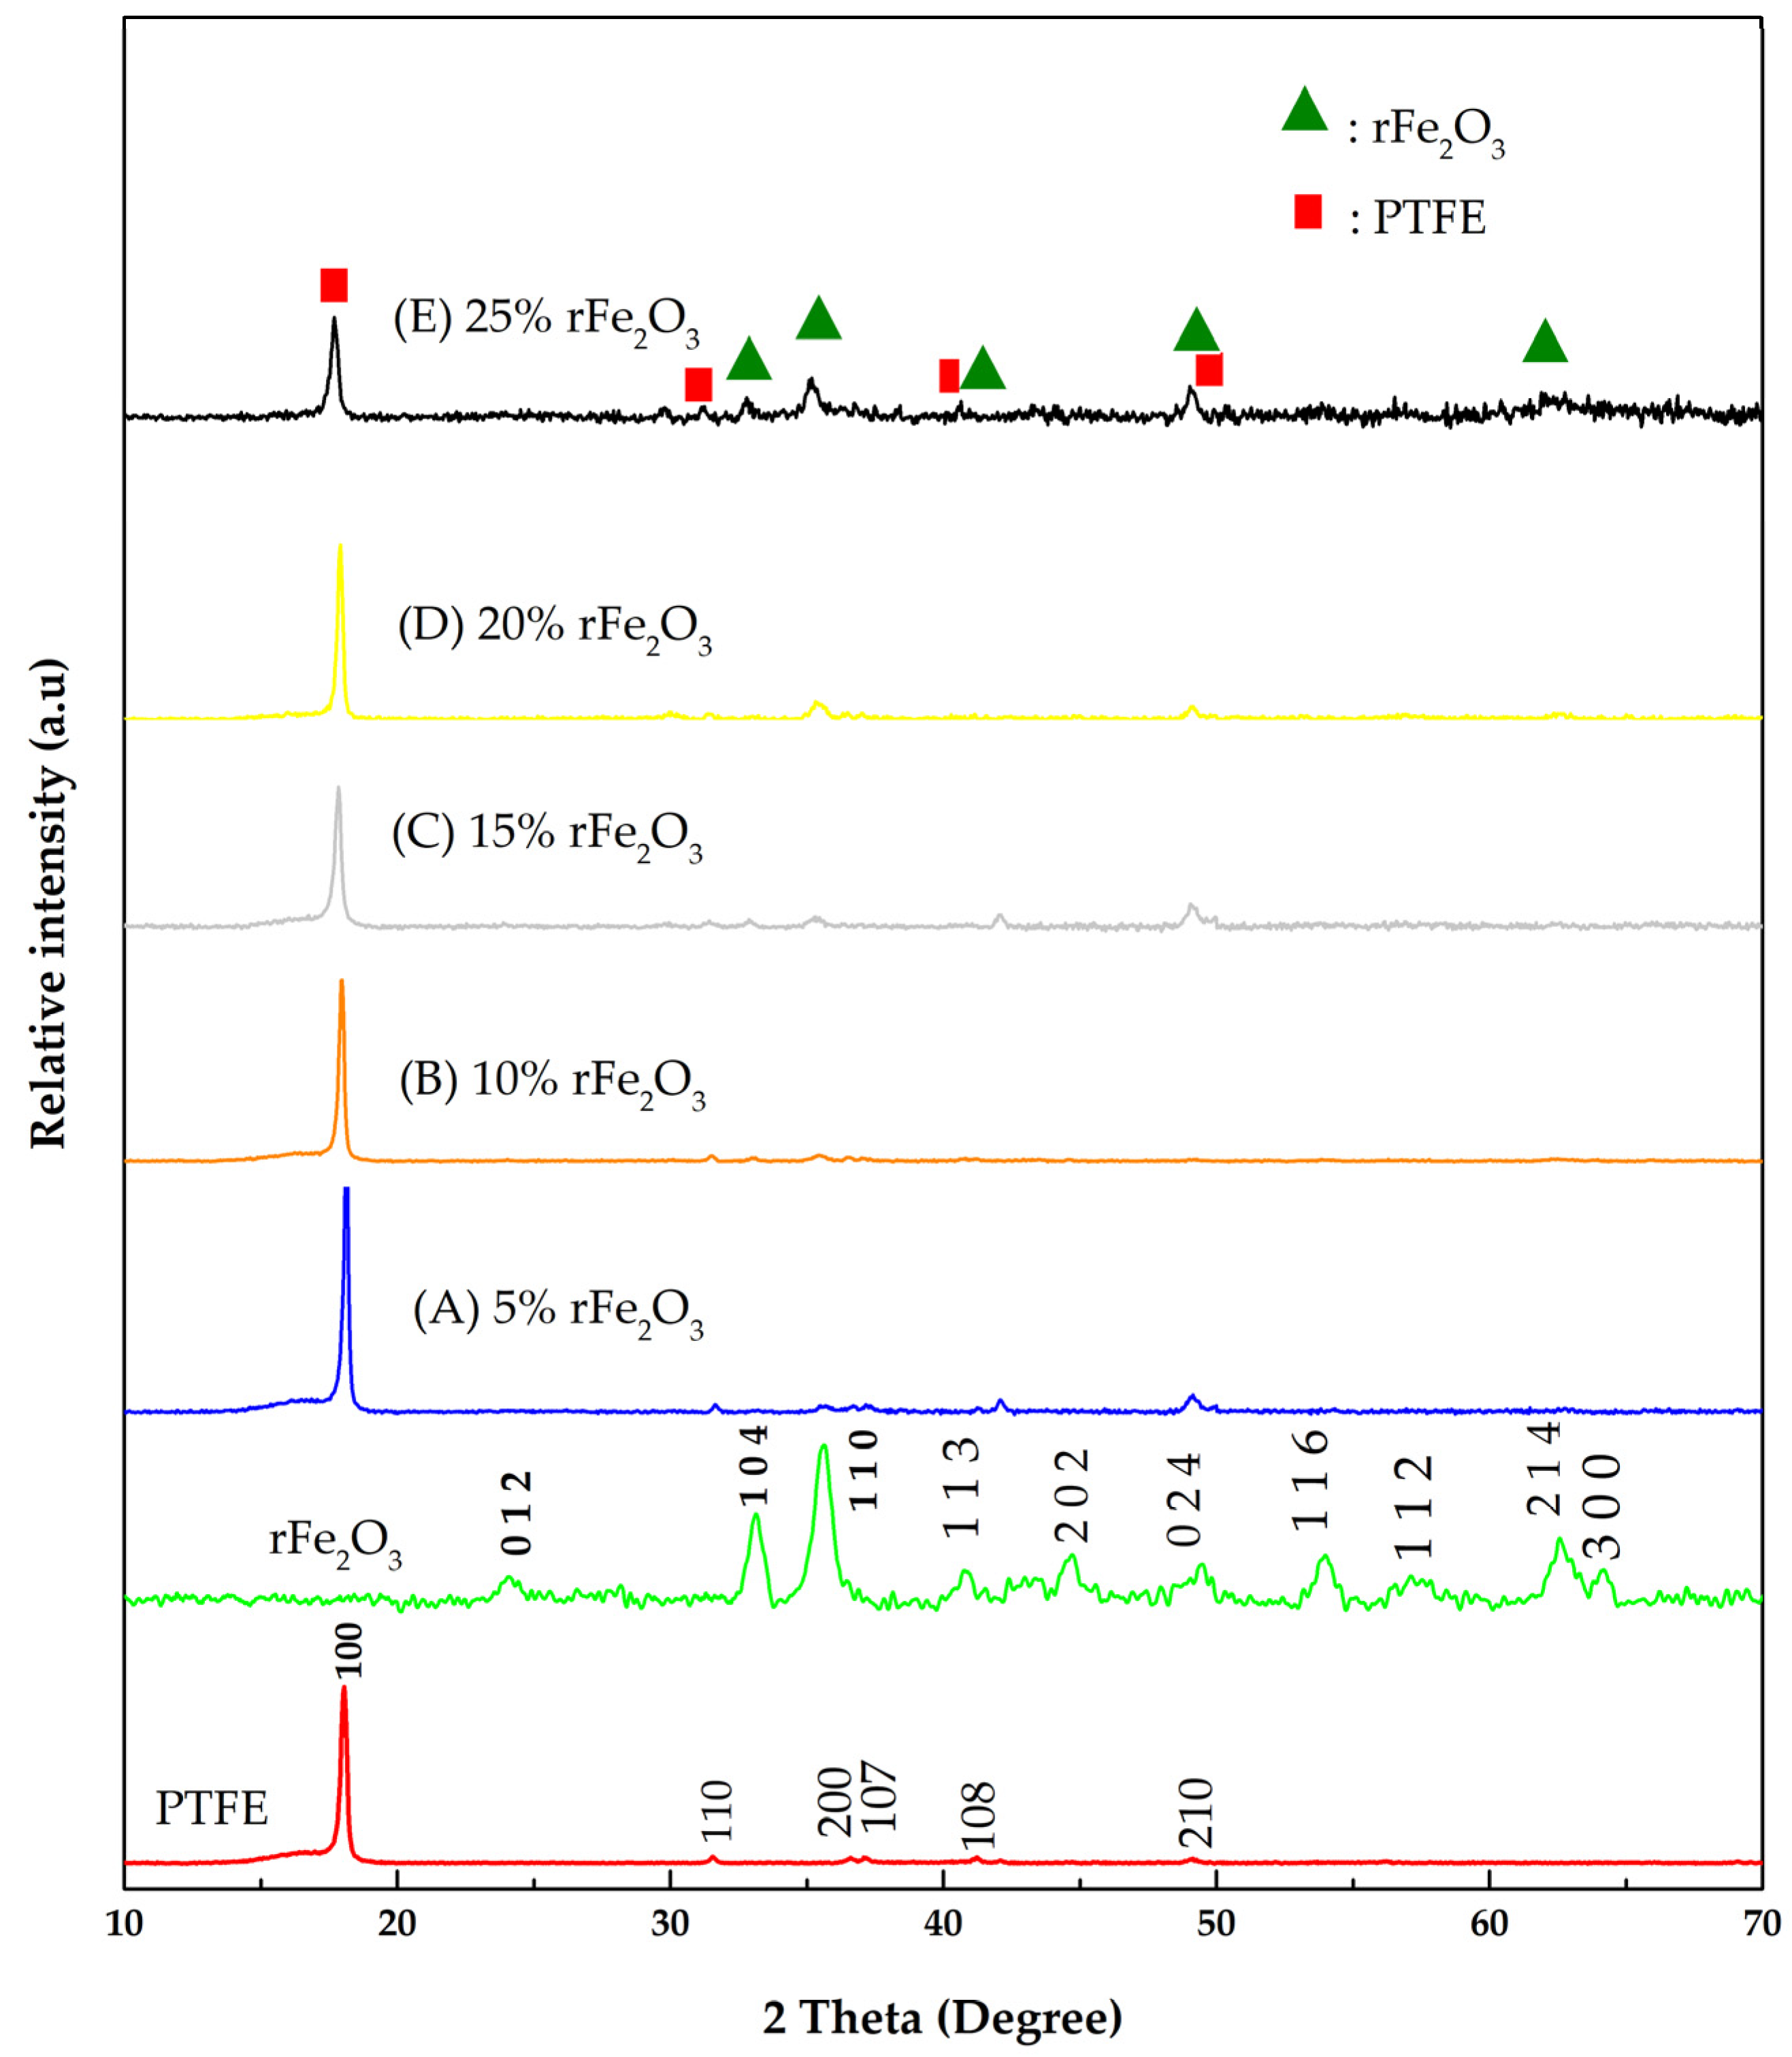
2.4.1. X-ray Diffraction (XRD)

The phase composition structure of the samples was analyzed using X-ray diffraction (XRD). The data were collected using a fully automated Philips X’pert system (Model PW3040/60 MPD, Amsterdam, The Netherlands) with Cu K α radiation operating at a current of 40 mA, a wavelength of 1.5405 Å, and a voltage of 40 kV. The diffraction patterns were recorded with a scanning speed of 2°/min in the 2 Ѳ range 10 to 70°. The collected data were subjected to the Rietveld analysis on PANalytic X’Pert Highscore Plus v.3.0 software (PANalytical B.V., Almelo, The Netherlands). The diffraction peaks were compared with the Inorganic Crystal Structure Database (ICSD). The rFe2O3–PTFE samples were cut from rFe2O3–PTFE nanocomposites prepared in advanced in a solid form, while the rFe2O3 was in the form of a fine powder.

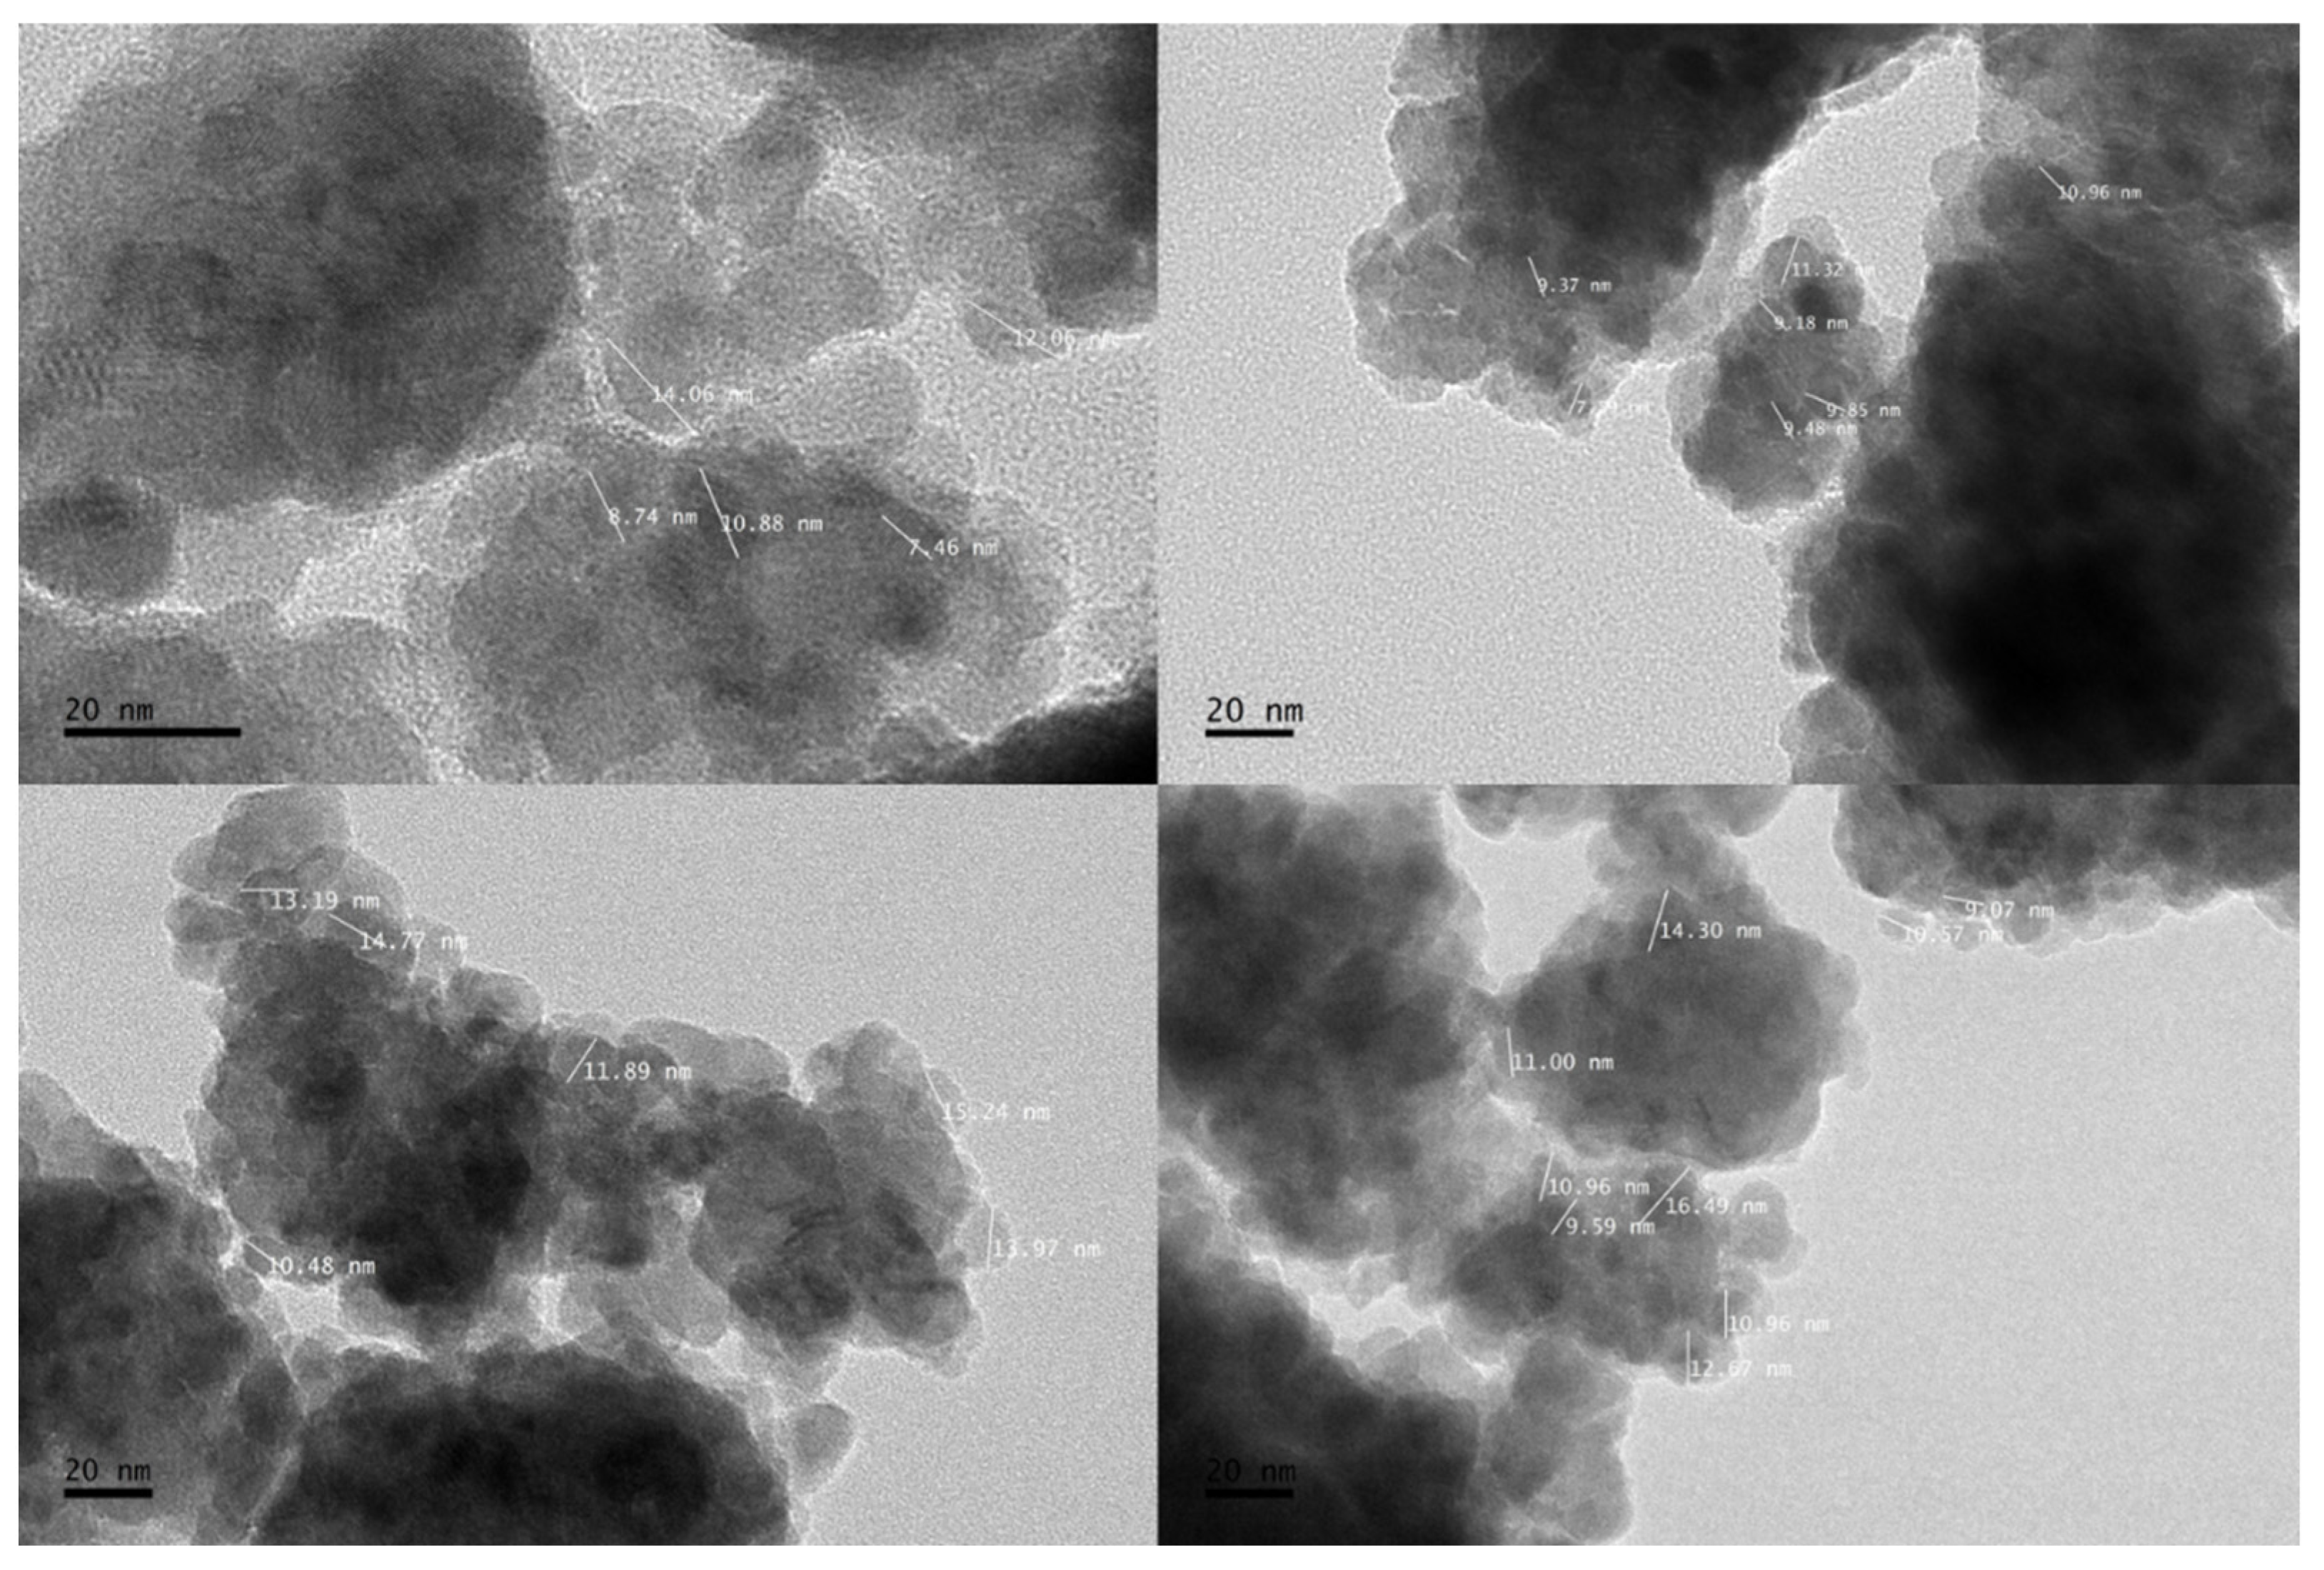
2.4.2. High-Resolution Transmission Electron Microscopy (HRTEM)

The size and shape of rFe2O3 nanoparticles were investigated using HRTEM (JEM-2100F, JEOL, Tokyo, Japan). Drops of rFe2O3 nanoparticles were dispersed and placed on TEM grids for drying. The dried specimen was then placed in a high-vacuum chamber of the microscope for viewing and analysis of the nanoparticles.

2.4.3. Field Emission Scanning Electron Microscopy (FESEM)

The dispersion of rFe2O3 nanoparticles in PTFE matrix was evaluated using FESEM (JEOL Ltd. JSM-7600, Tokyo, Japan). Carbon tapes were used to cover the aluminums stubs before placing the specimens on them. Then, the samples were coated with titanium using an auto-fine coater (JEOL Ltd. JEC-3000FC, Tokyo, Japan) to increase their conductivity and eliminate electromagnetic charges. Finally, the stubs were placed on the FESEM chamber for analysis.

2.4.4. Electronic Densitometer

The effects of rFe2O3 nanoparticles on the density of PTFE matrix was determined using electronic densitometer (Alfa Mirage Co., Ltd. Model MD-300S0, Osaka, Japan) which employs Archimedes’ principle in order to calculate the density. Distilled water was used as the immersion fluid. The density was determined using the following equation [29]:
ρ = W a i r × ρ d i s . w a t e r W a i r W d i s . w a t e r
where W d i s . w a t e r is the composite weight in distilled water, W a i r is the composite weight in air, and ρ d i s . w a t e r is the density of the distilled water (1 gm/cm3).

2.4.5. Dilatometer Linseis L75 Platinum

Dilatometer is one of the main techniques used for coefficients of thermal expansion (CTEs) measurements. In general, to determine the CTE, two physical quantities (temperature and displacement) must be measured on a specimen that is undergoing a thermal cycle. In this study, dilatometer (Linseis L75 Platinum, Selb, Germany) was used to determine the CTEs of composites. The sample was enclosed in the furnace and then heated up to 200 °C. When the sample expands, it pushes the central rod along the axis of the tube, and the relative movement can be characterized [30]. In addition, from an atomic perspective, the CTE represents the increment in the average distance among atoms with increasing temperature and, generally, weaker bonds have a higher CTE value [31].

2.4.6. Extensometer (Shimadzu AGS-X 100kN)

rFe2O3–PTFE nanocomposites were fabricated as per the ASTM-D638 standard in order to find out the ultimate tensile strength (UTS) [32]. The influence of rFe2O3 nanoparticles on the UTS of PTFE matrix was examined using the Shimadzu (AGS-X 100kN, Kyoto, Japan) with industry-leading (Shimadzu, TRAPEZIUM X, Kyoto, Japan) data processing software. The pneumatic grips were displaced with a rate of 5 mm/min at room temperature. The data were obtained from the software and data acquisition system monitor continuously until the specimen reached its UTS and broke.

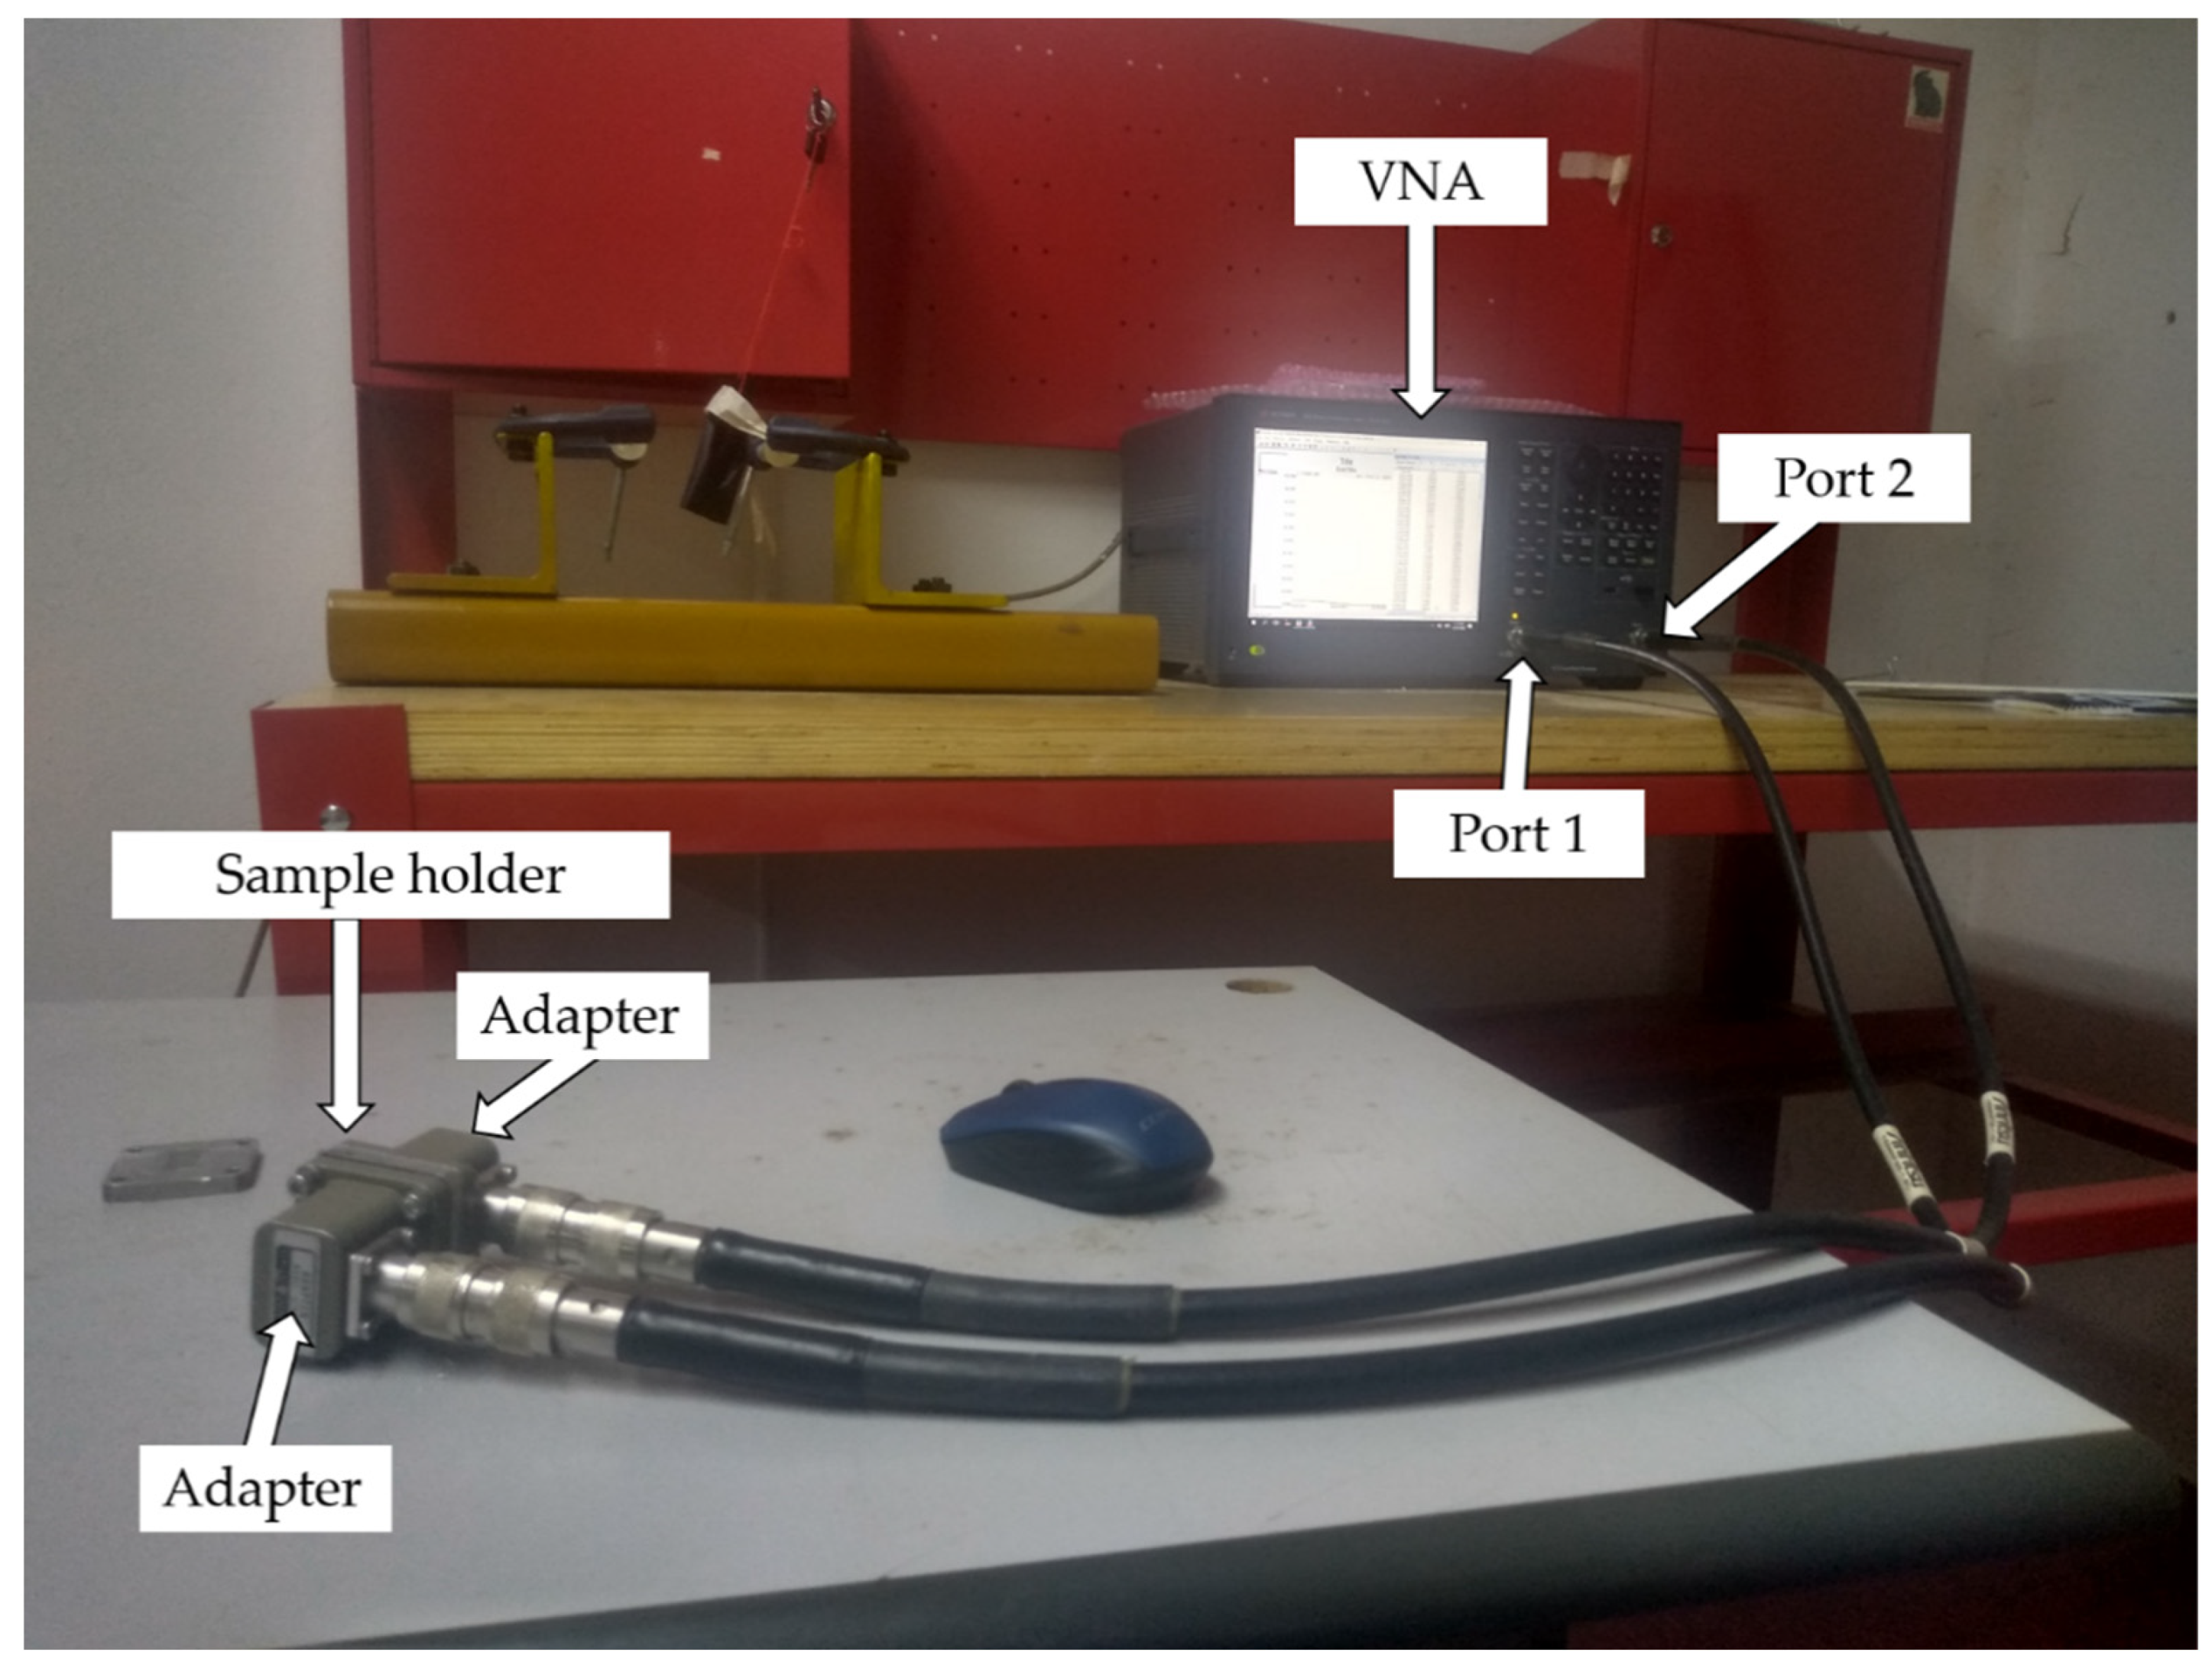
2.4.7. Rectangular Waveguide (RWG)

The measurements of relative complex permittivity and permeability were carried out in the frequency range of 8.2–12.4 GHz using rectangular waveguide (RWG) connected to a Keysight (E5063A) vector network analyzer (Keysight Technologies, Santa Rosa, CA, USA). As shown in Figure 4, the sample holder containing the sample was carefully attached to the flanges of RWG in order to totally avoid the air gap. The complex permittivity and permeability of the nanocomposites were deduced depending on the transmission and reflection of the waves throughout the composites. The measurement model of RWG to measure the permeability and permittivity was the poly-reflection–transmission µ and ε model. This model used an optimization technique which gives constant values for both ε and µ′ throughout the whole frequency range. The transmission–reflection method is widely used in the EMI characterization because of the field-focusing ability which ensures an accurate characterization at the microwave frequency. The VNA was calibrated by implementing a standard full two-port calibration technique for 201 frequency points in the frequency range 8.2 GHz to 12.4 at room temperature. The characterization procedures were also described in our previous study [33].

3. Results and Discussion

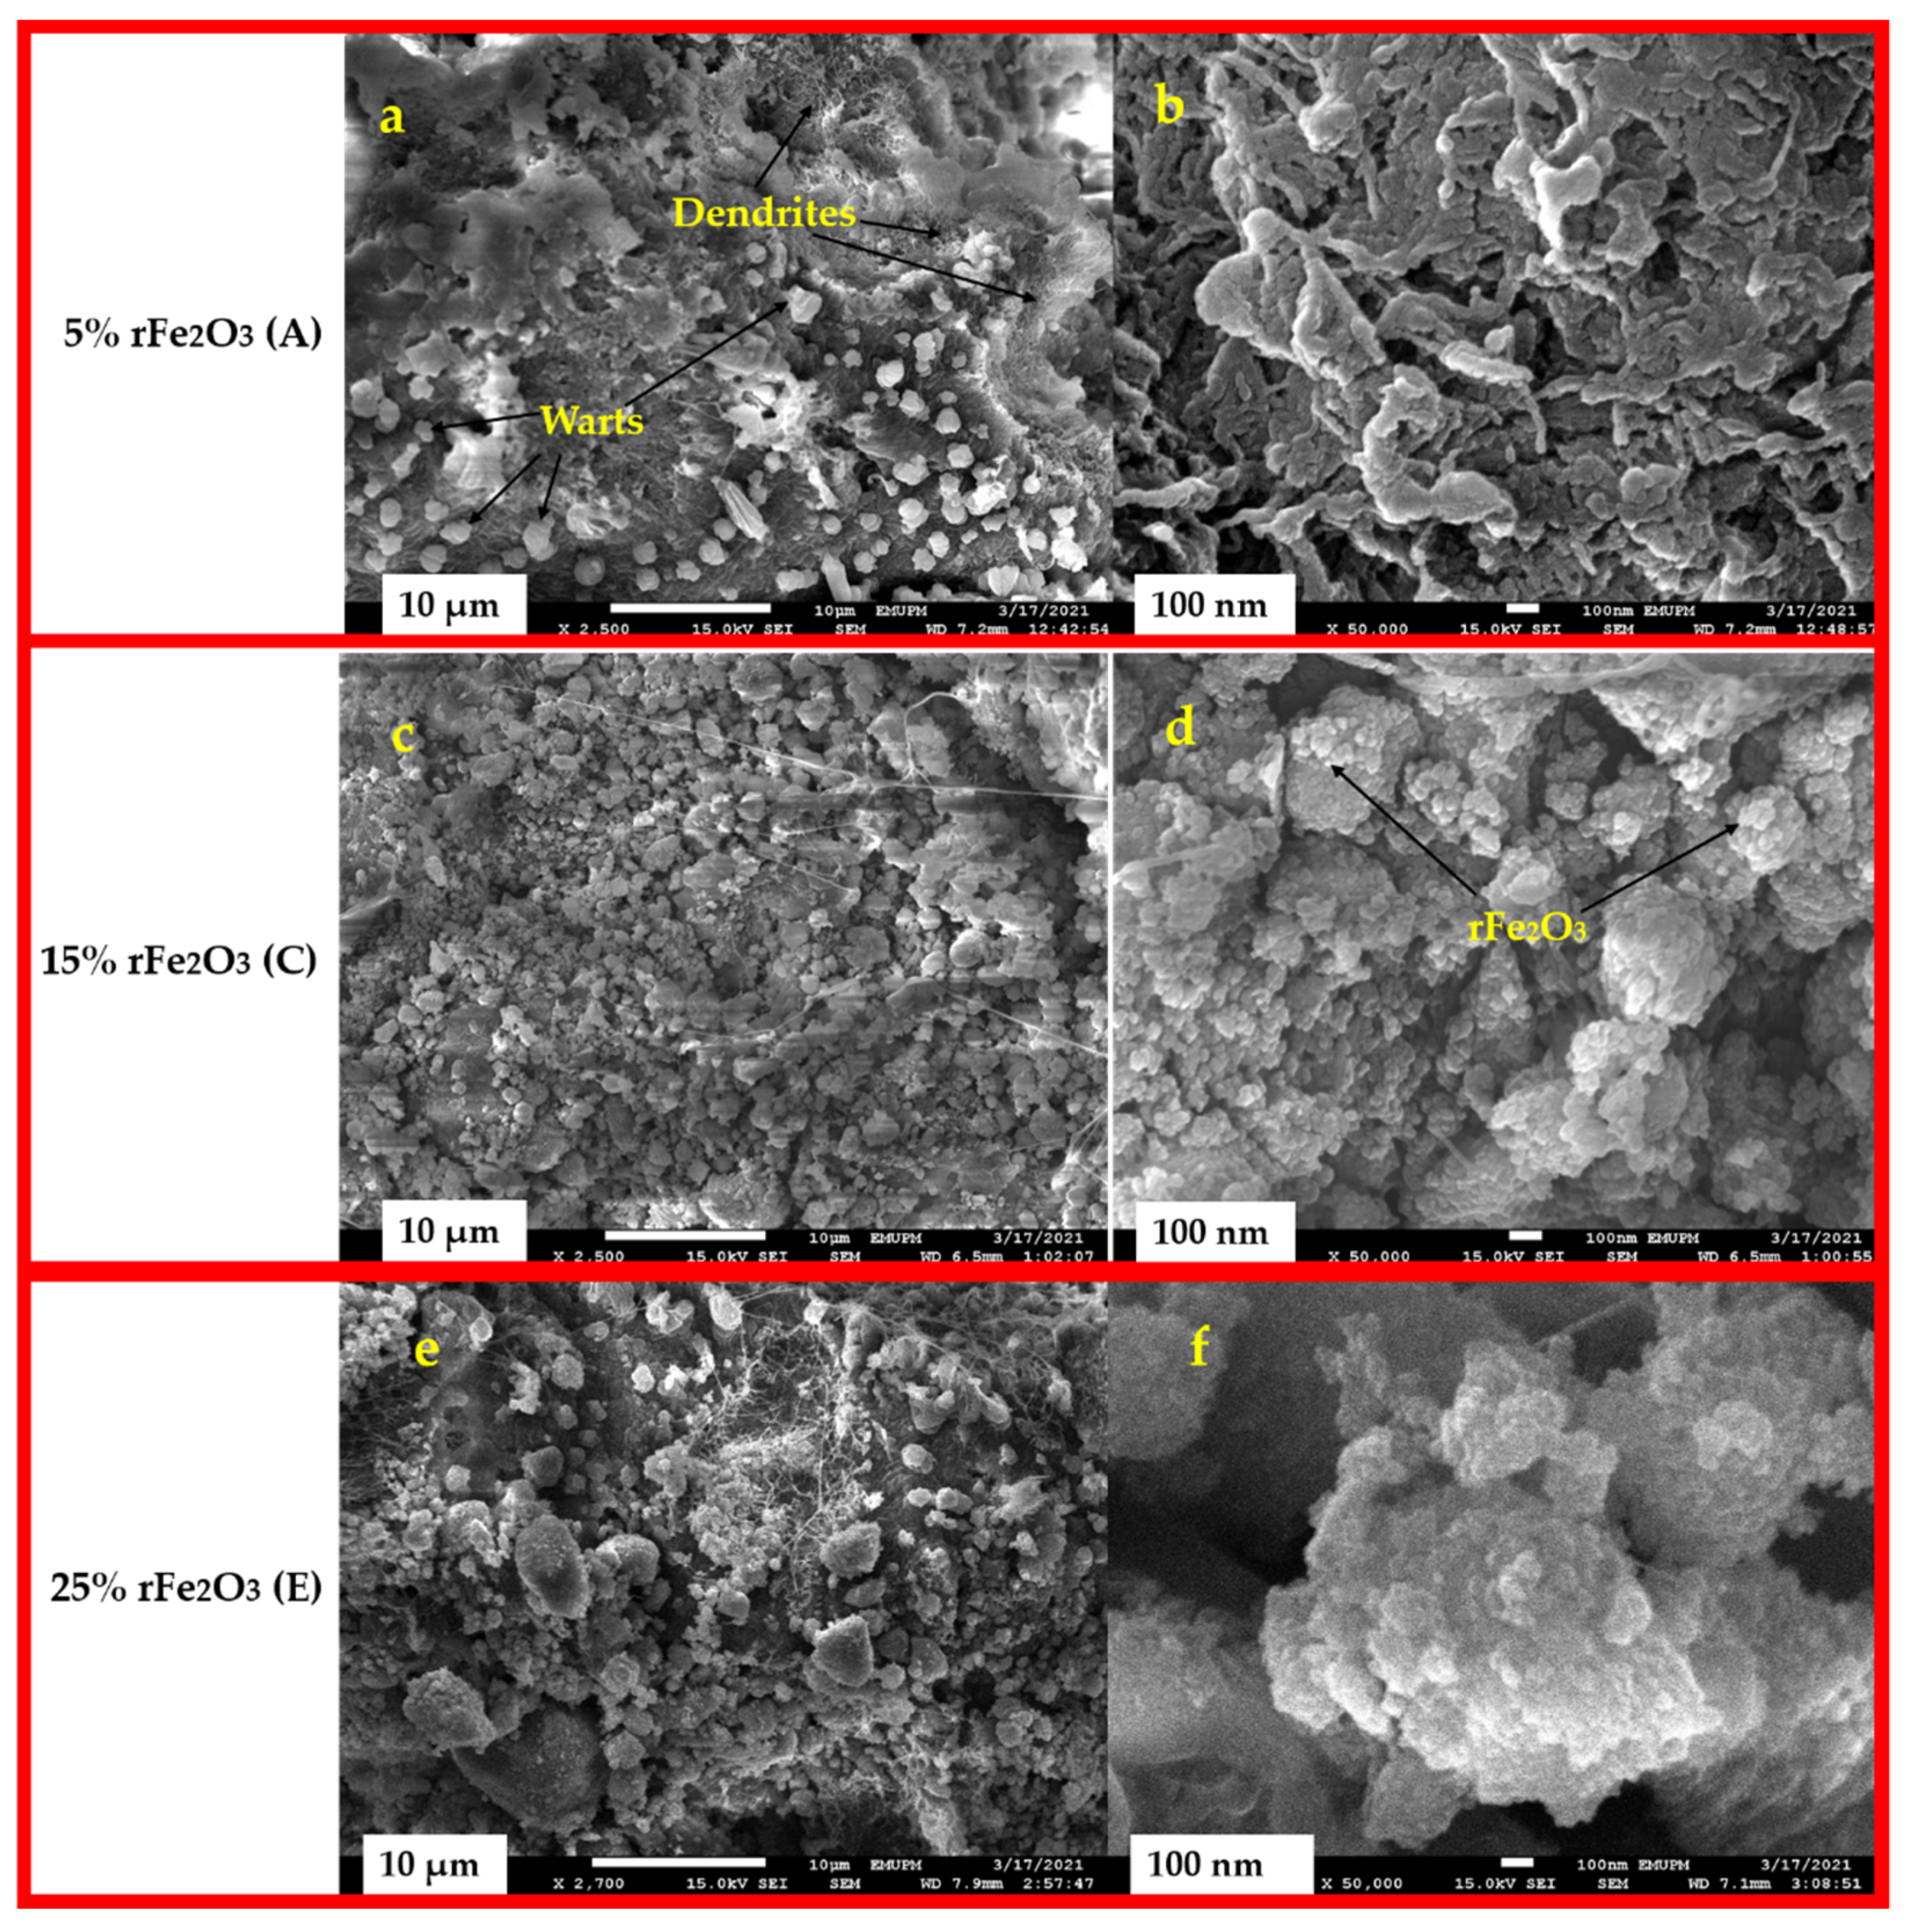
3.1. Microstructural Characterization

The X-ray diffraction (XRD) technique was used to confirm the phase structurers of PTFE matrix, rFe2O3 nanopowder, and rFe2O3–PTFE nanocomposites. The XRD results are shown in Figure 5. By comparing the obtained diffractograms with the standard patterns from the Inorganic Crystal Structure Database (ICSD), the Bragg peaks of obtained recycled powder were all identified as rhombohedral crystal structure of single phase hematite (Fe2O3, Reference code: 00-024-0072) with R—3 space group. The diffractogram of rFe2O3 nanopowder showed the following peaks in the pattern at 2Ѳ of 24.1°, 33.1°, 35.6°, 40.8°, 43.5°, 49.4°, 54°, 57.5°, 62.4°, and 63.9° corresponding to the miller indices (hkl): (012), (104), (110), (113), (202), (024), (116), (122), (214), and (300), respectively. On the other hand, the diffractogram of PTFE matrix showed six peaks in the pattern at 2Ѳ of 18.04°, 31.54°, 36.60°, 37°, 41.22°, and 49.11°, which agreed with the study carried out by Yamaguchi et al. [34]. The mentioned peaks corresponded to the miller indices (hkl): (100), (110), (200), (107), (108), and (210), respectively. The diffractograms of rFe2O3–PTFE nanocomposites show dominant crystalline phase characteristics of PTFE at low concentration of rFe2O3 content in the nanocomposites. However, the peaks corresponding to the rFe2O3 nanopowder increased in intensity as the content increased. All peaks shown in rFe2O3–PTFE profiles belongs to the materials used for the preparation of the composites. The patterns did not show new peaks suggesting the nanocomposites were pure and there was no conversion of PTFE or rFe2O3 nanopowder into other materials. The absence of any new peaks of the nanocomposites also suggests that the rFe2O3 nanoparticles did not chemically interact with the PTFE matrix and that the mixture was physical in nature.
The microstructure characterization of the rFe2O3 nanoparticles was performed using high resolution transmission electron microscopy (HRTEM) to investigate the size and shape of rFe2O3 particles. The HRTEM results confirmed that the nanoparticles were highly crystalline as shown in Figure 6, which agreed with the study conducted by Wen et al. [35]. It can also be seen in Figure 6 that the rFe2O3 nanoparticles are aggregated and spherical, which may be attributed to the long-range magnetic dipole–dipole interaction between the particles. This observation may also be caused by the drying process during TEM sample preparation [36]. The rFe2O3 nanoparticles sizes were within the range 7.4–15.24 nm after 6 h of ball milling with an average particle size of 11.3 nm.
The cross-sectional surface images of 5% rFe2O3 (A), 15% rFe2O3 (C), and 25% rFe2O3 (E) nanocomposite are shown in Figure 7. It can be seen in 5% nanocomposite (A) that there are two main types of patterns observed in PTFE structure. The first pattern is small outgrowths which are uniformly dispersed on the surface of PTFE and was called “warts”. The second pattern is “ribbon” like shapes which entirely cover the PTFE surface and was called “dendrites”. These observations are in accordance with the study conducted by Glaris et al. [37]. The images confirmed that with an increase in rFe2O3 loadings in the composites, the adhesion to PTFE matrix increased gradually. There were no agglomerates observed in rFe2O3–PTFE nanocomposites. The uniform dispersal of rFe2O3 nanoparticles in the PTFE matrix gives an indication that the nanoparticles were completely implanted in the nanocomposites and offered interfacial bonding which can enhance the complex permittivity and permeability.

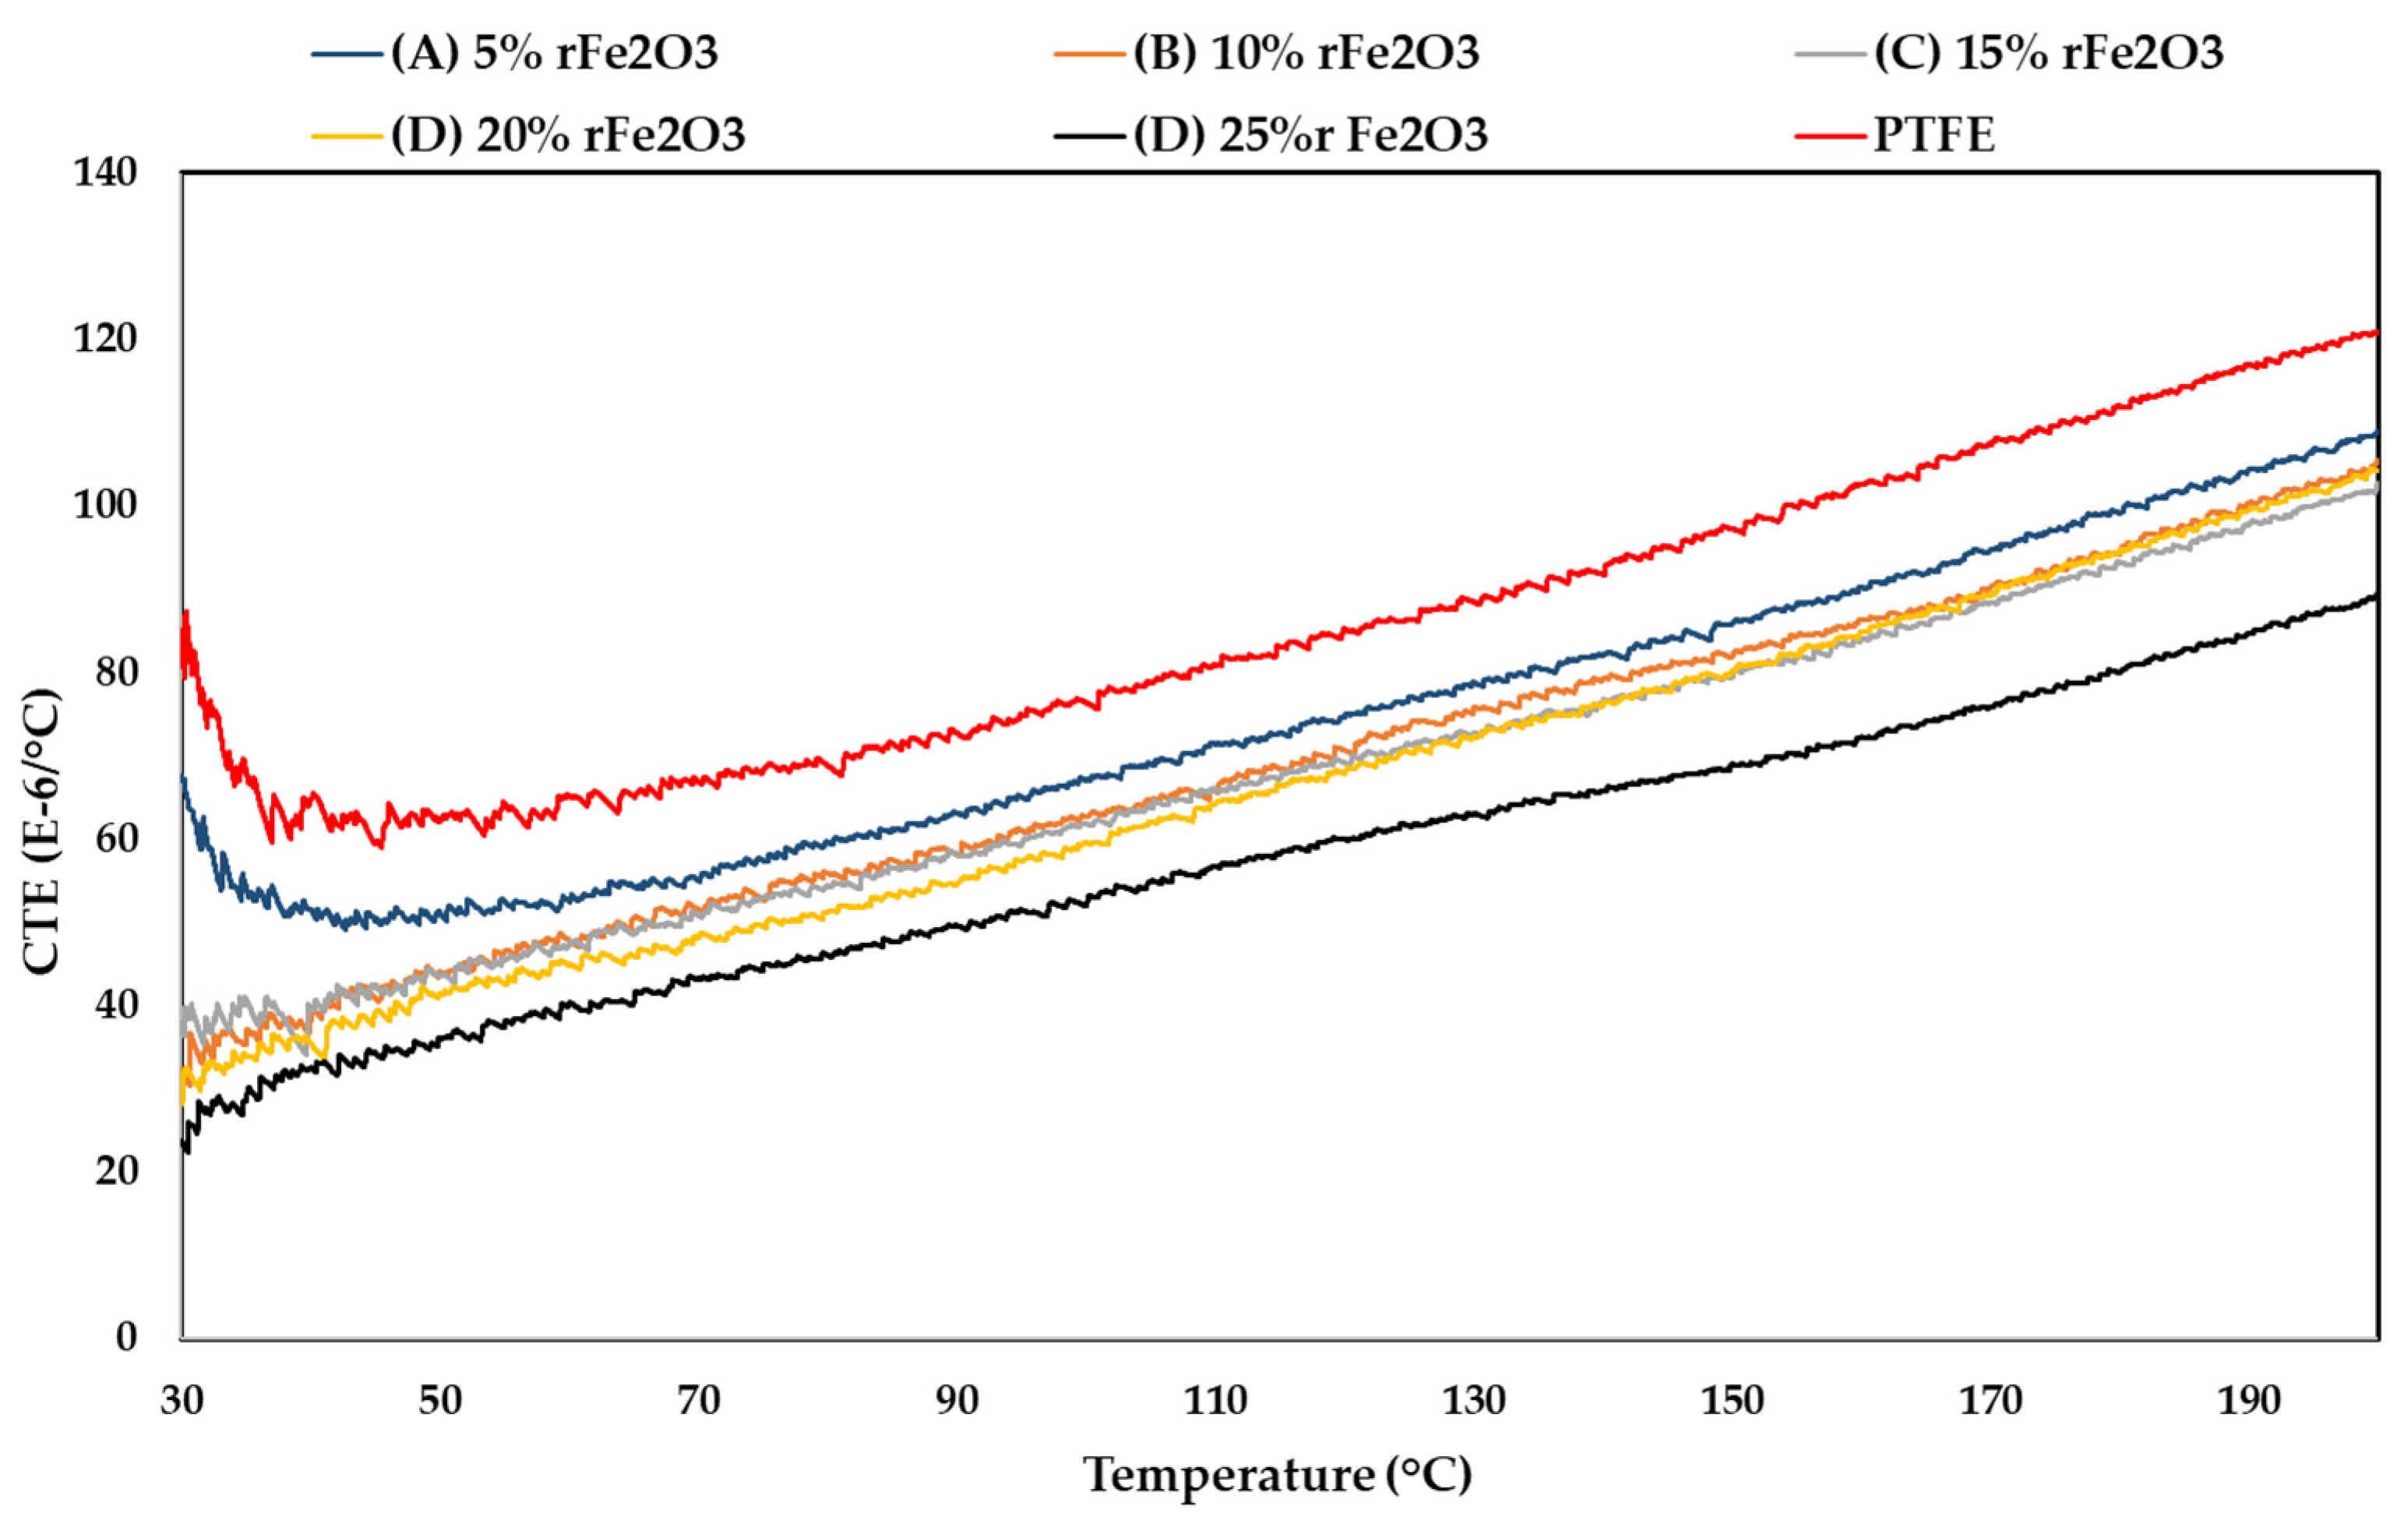
3.2. Coefficients of Linear Thermal Expansion (CTEs)

The variation in CTEs with temperature for rFe2O3–PTFE nanocomposites in the temperature range 30–200 °C is presented in Figure 8. It was observed that the values of CTEs were low for the nanocomposites with higher content of rFe2O3 nanofiller. The decrease in CTEs of rFe2O3–PTFE nanocomposites is due to the difference between the CTEs of PTFE matrix and rFe2O3 nanofiller (Fe2O3 has a lower CTE comparing to PTFE). Figure 8 also shows that the CTEs of all nanocomposites increased as temperature increased throughout the measurement range. This behavior can be attributed to the increase in molecular vibrations with temperature, and a linear relationship exists between the CTE and the thermal capacitance per unit volume. The incorporation of low-CTE rFe2O3 in the PTFE matrix increased the thermal stability of the nanocomposites over a wide temperature range. Composites with low CTE are highly desirable for precision structures [38] such as microwave applications, where temperature fluctuations at the operating environment could cause substantial change in dimensions leading to destruction in the application.

3.3. Tensile Strength and Density of rFe2O3–PTFE Nanocomposites

The variation in tensile strength with filler content for different rFe2O3–PTFE nanocomposites is presented in Figure 9. The tensile strength of polymer composites depends on the properties of nanoparticle–matrix interaction which plays an important role in the level of dissipated energy by different damaging mechanisms which take place at the nanoscale [39]. As shown in Figure 9, the tensile strength of nanocomposites decreased with increasing rFe2O3 nanofiller content. This behavior was expectable for polymer composites with inorganic filler and it was reported by a study conducted by Jiang et al. [40]. This decrease could be attributed to the rFe2O3 nanofiller which were not able to support the stress transferred from PTFE matrix which weakened the nanocomposite [14].
The variation of density values with different rFe2O3 wt % content in the PTFE matrix is shown in Figure 10. The 5% (A), 10% (B), 15% (C), 20% (D), and 25% (E) rFe2O3 nanocomposites had the respective density values of 2.2, 2.32, 2.4, 2.49, 2.53 gm/cm3. Therefore, increasing the rFe2O3 nanofiller corresponded to increased density values of rFe2O3–PTFE nanocomposites. The increase in density with the increase in Fe2O3 nanofiller is supported by a study carried out by Ghasemi-Kahrizsangi et al. [41]. This behavior can be attributed to the higher true density of Fe2O3 (5.24 gm/cm3) [42], in comparison to the PTFE (2.2 gm/cm3) [43]. The increase in density can cause an observed increase in dielectric constant [44]. Moreover, Leyland and Maharaj found that the relationship between density and dielectric constant is directly proportional for various materials [45]. The denser rFe2O3–PTFE nanocomposites results higher number of molecules per unit volume. A larger number of molecules per unit volume means that there is more interaction with the electric fields and therefore an increase in the complex permittivity.

3.4. Complex Permittivity of rFe2O3–PTFE Nanocomposites

The measured complex permittivity values (real and imaginary parts) of rFe2O3–PTFE nanocomposites in the frequency range of 8.2–12.4 GHz using rectangular waveguide are shown in Figure 11; Figure 12 while loss tangent is shown in Figure 13. The highest ε′ value of rFe2O3–PTFE nanocomposites was 3.1 for 25% rFe2O3 nanocomposite along the frequency range 8.2 GHz to 12.4 GHz while the lowest ε′ value was 2.01 for the PTFE sample. By increasing the rFe2O3 nanofiller in the nanocomposites, both ε′ and ε″ increased throughout the measurement range. It can be noticed that ε′ and ε″ increased from 2.29 and 0.10 for 5% rFe2O3 nanocomposite (A) to 2.39 and 0.14, respectively for 10% rFe2O3 nanocomposite (B) at 8.2 GHz. The same behavior of increasing complex permittivity by increasing the rFe2O3 nanofiller was observed in all nanocomposites. The ε′ and ε″ rely on the contribution of the atomic, electronic, interface, and orientation polarization in the sample [46]. The interface polarization increased due to the differences in polarization of the rFe2O3 nanofiller and PTFE matrix.
The increment in complex permittivity with increasing rFe2O3 nanofiller can be attributed to the polarization process due to the enhanced conductivity and interfacial polarization in the composite and hopping exchange of charges between localized states [23]. One more reason for the influence on the relative complex permittivity of the nanocomposites is the particle size of rFe2O3 nanofiller since the nano size had high specific surface area that enabled good contact between the particles and the matrix [47]. The increment in ε′ and ε″ at low frequency can be attributed to the dominant role of dipolar and interfacial polarization. However, the increment at high frequencies can be attributed to the electronic and ionic polarization of the system [48].
It can be also seen in Figure 12 that ε″ of rFe2O3–PTFE nanocomposites decreased by increasing the frequency from 8.2 to 12.4 GHz. This decrement can be attributed to the interfacial dipoles having less time to align in the direction of the external field. The molecules were able to do a complete orientation at low frequency but they were not able to achieve the same orientation at high frequency [49]. However, the ε″ of the PTFE sample did not change with frequency because PTFE is a nonpolar polymer [50], which means its complex permittivity is not dependent on frequency.

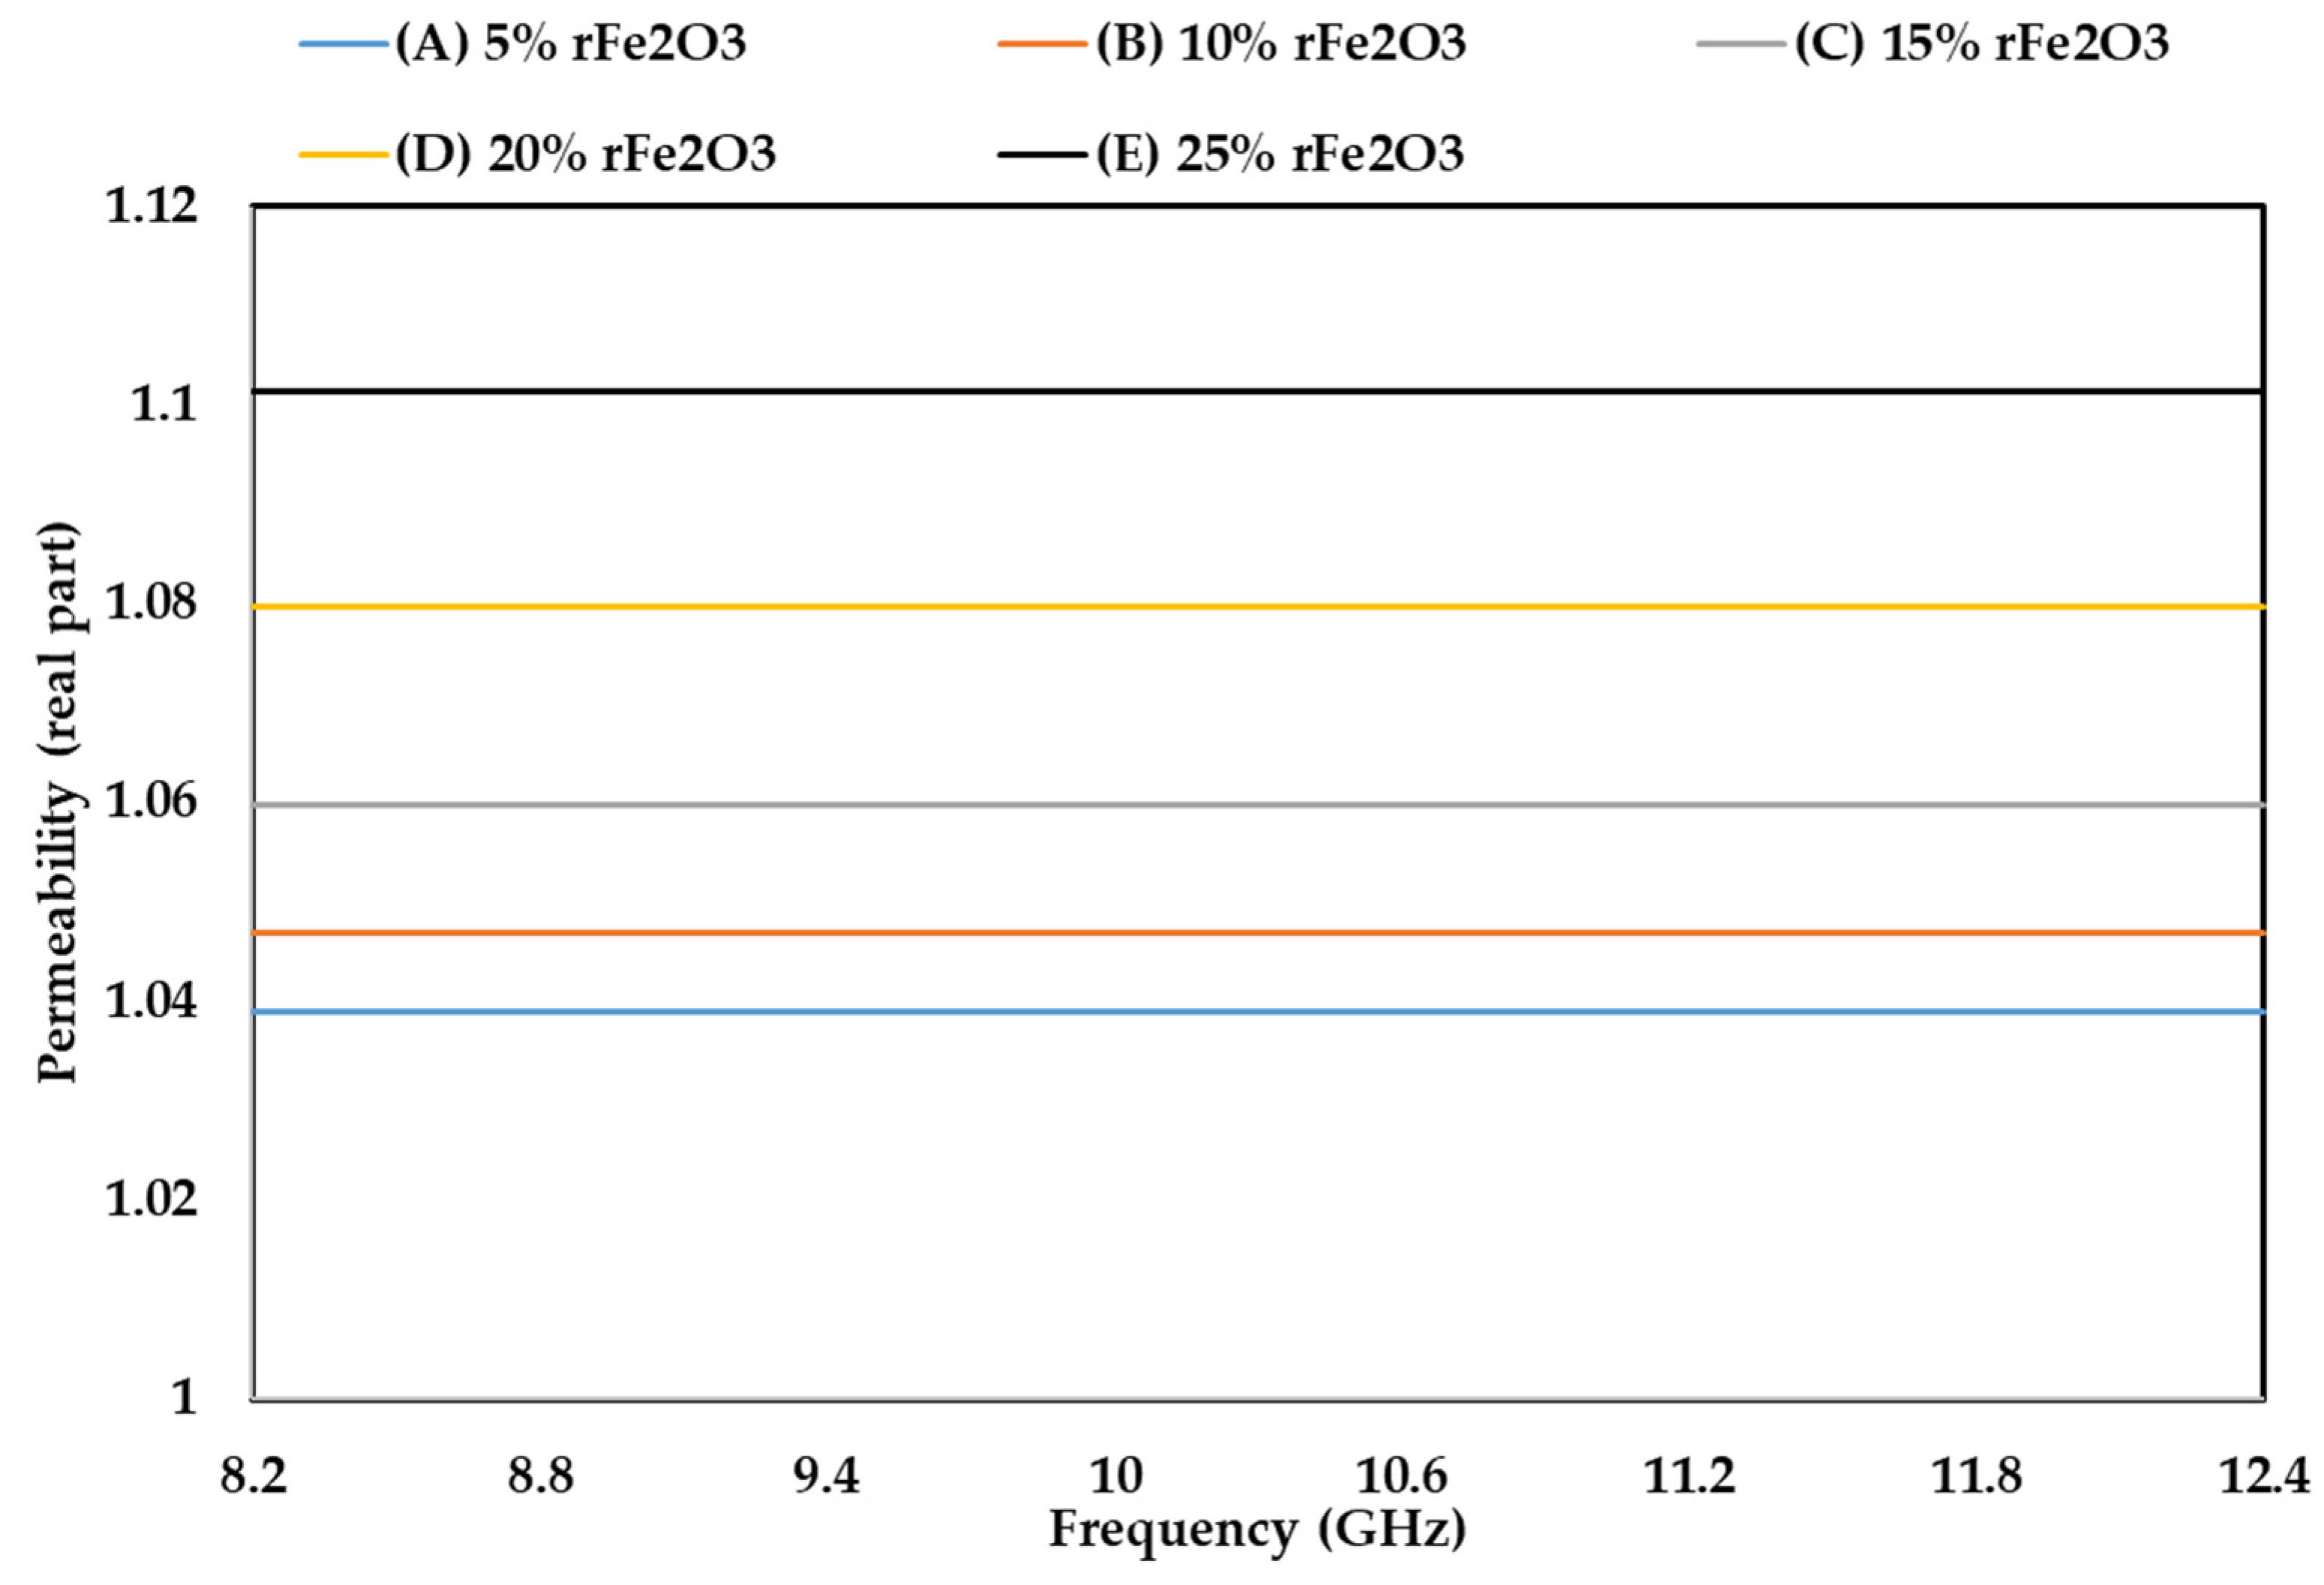
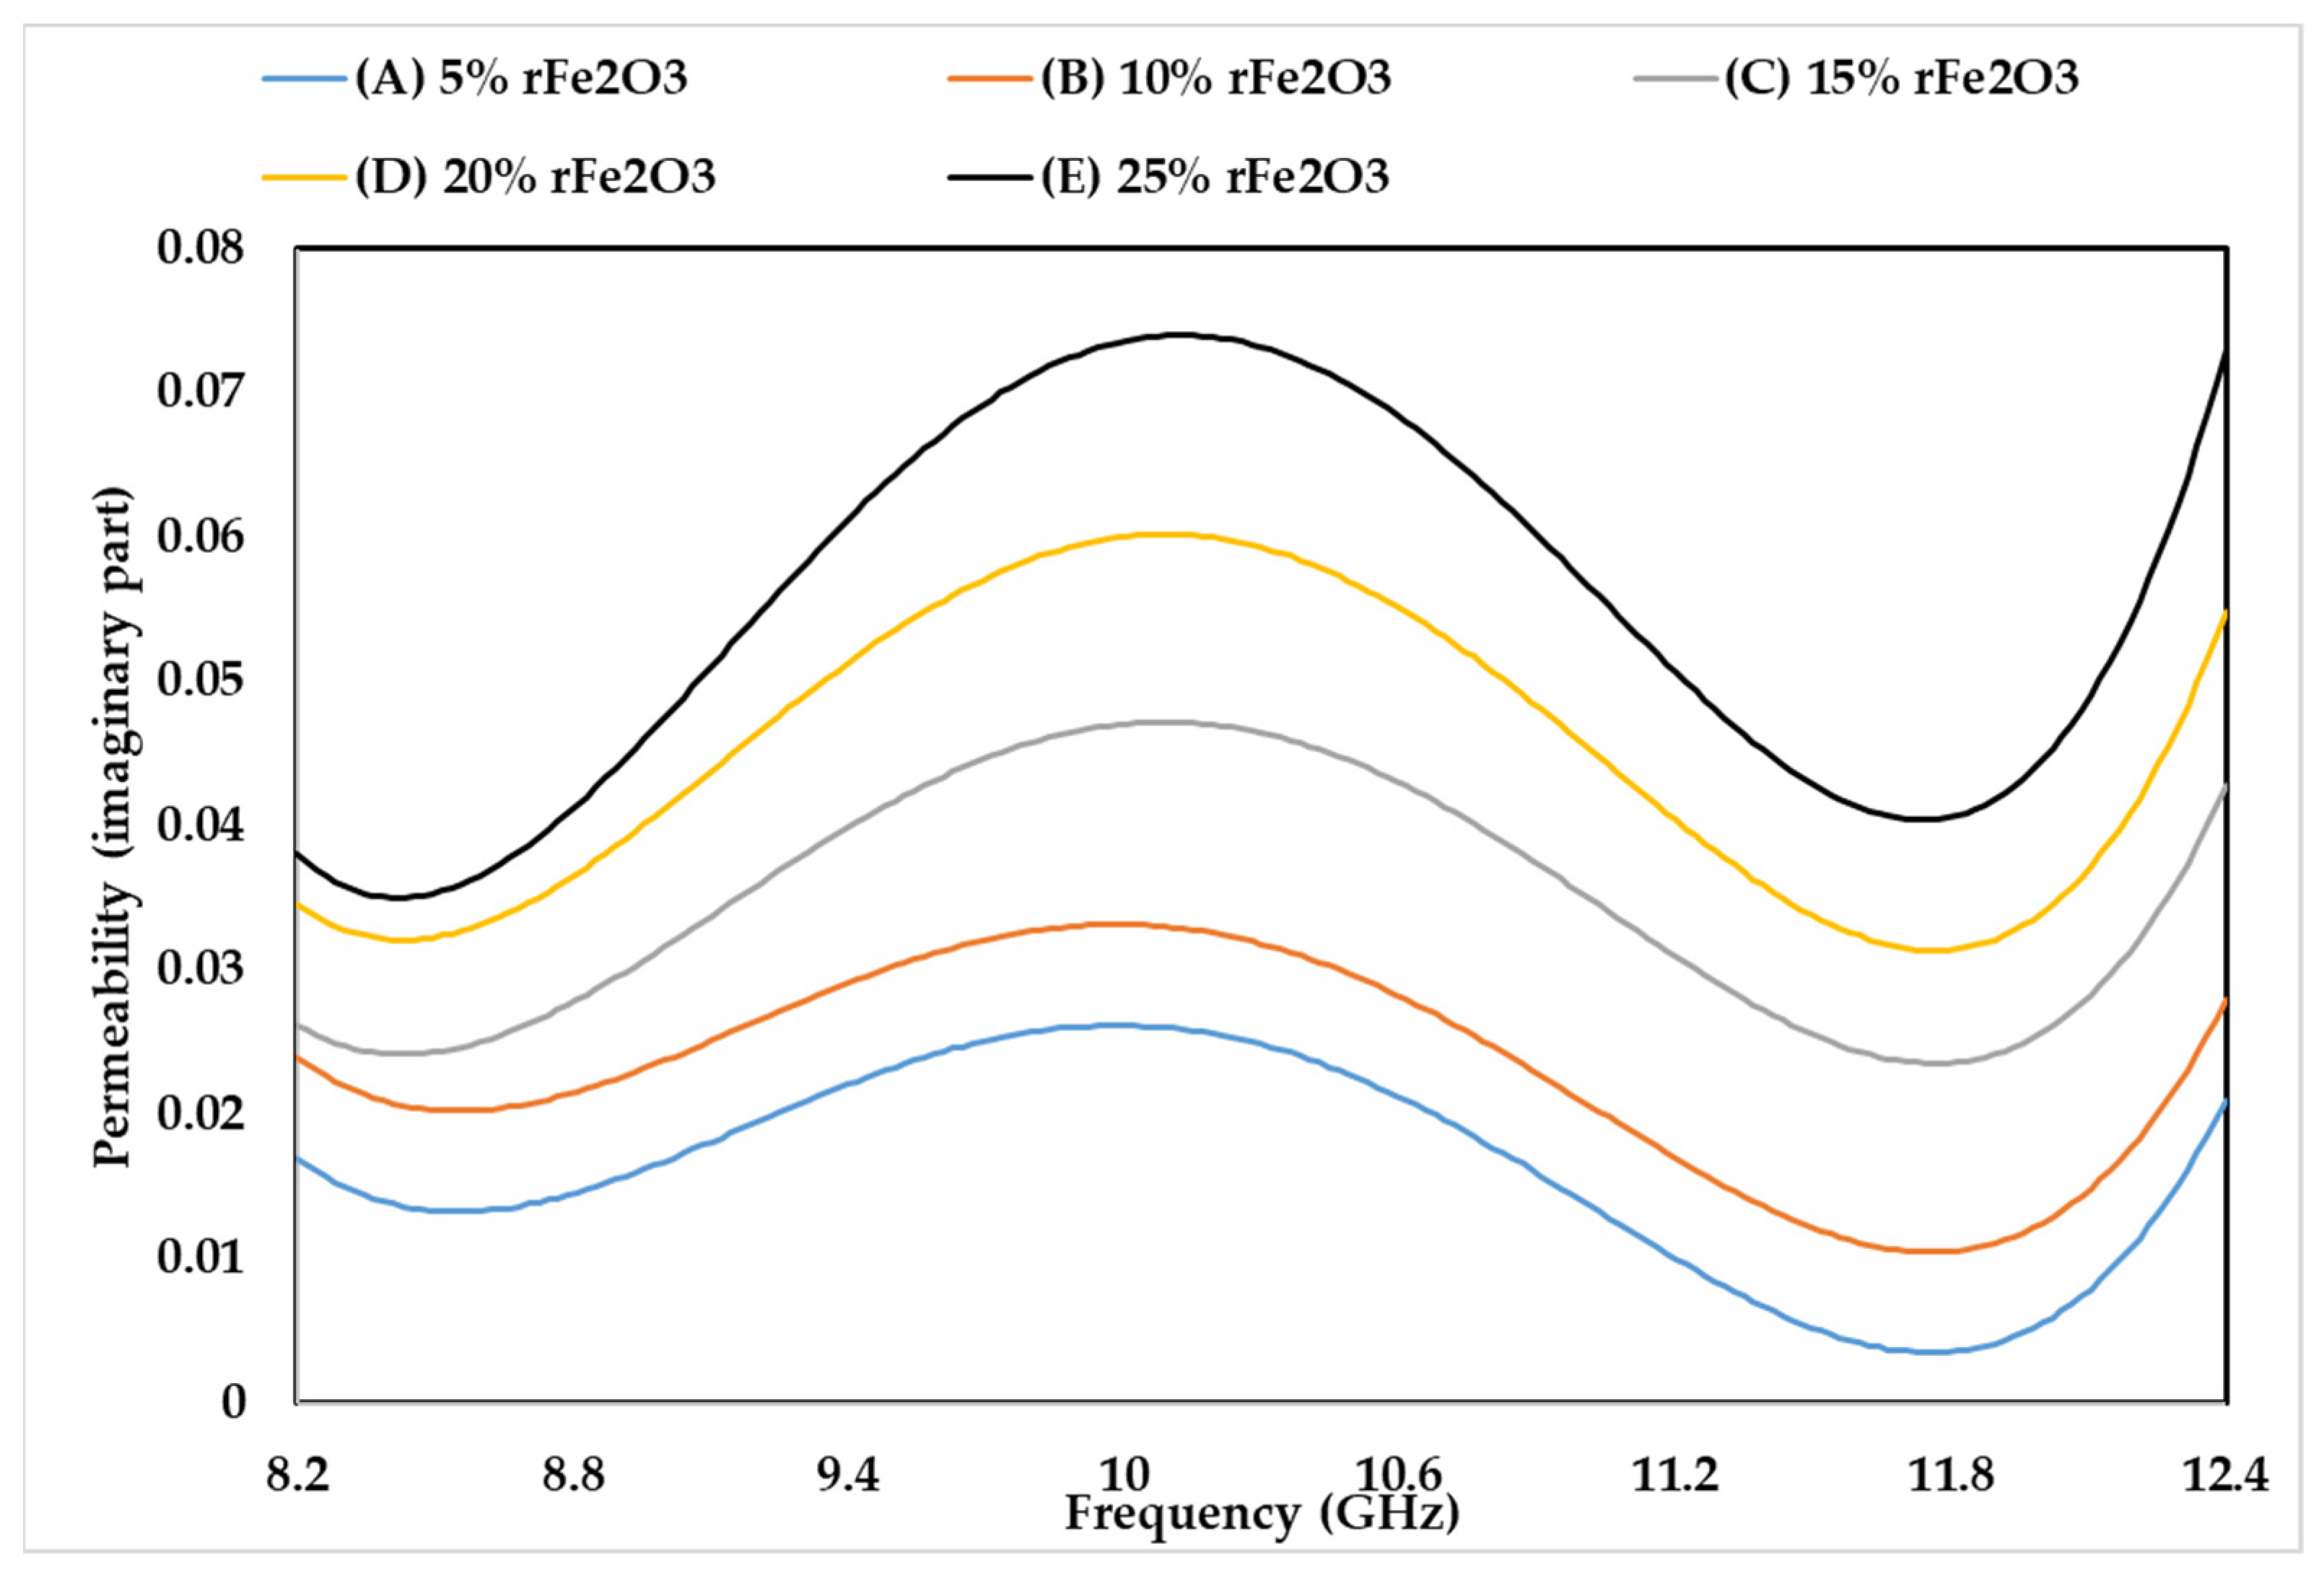
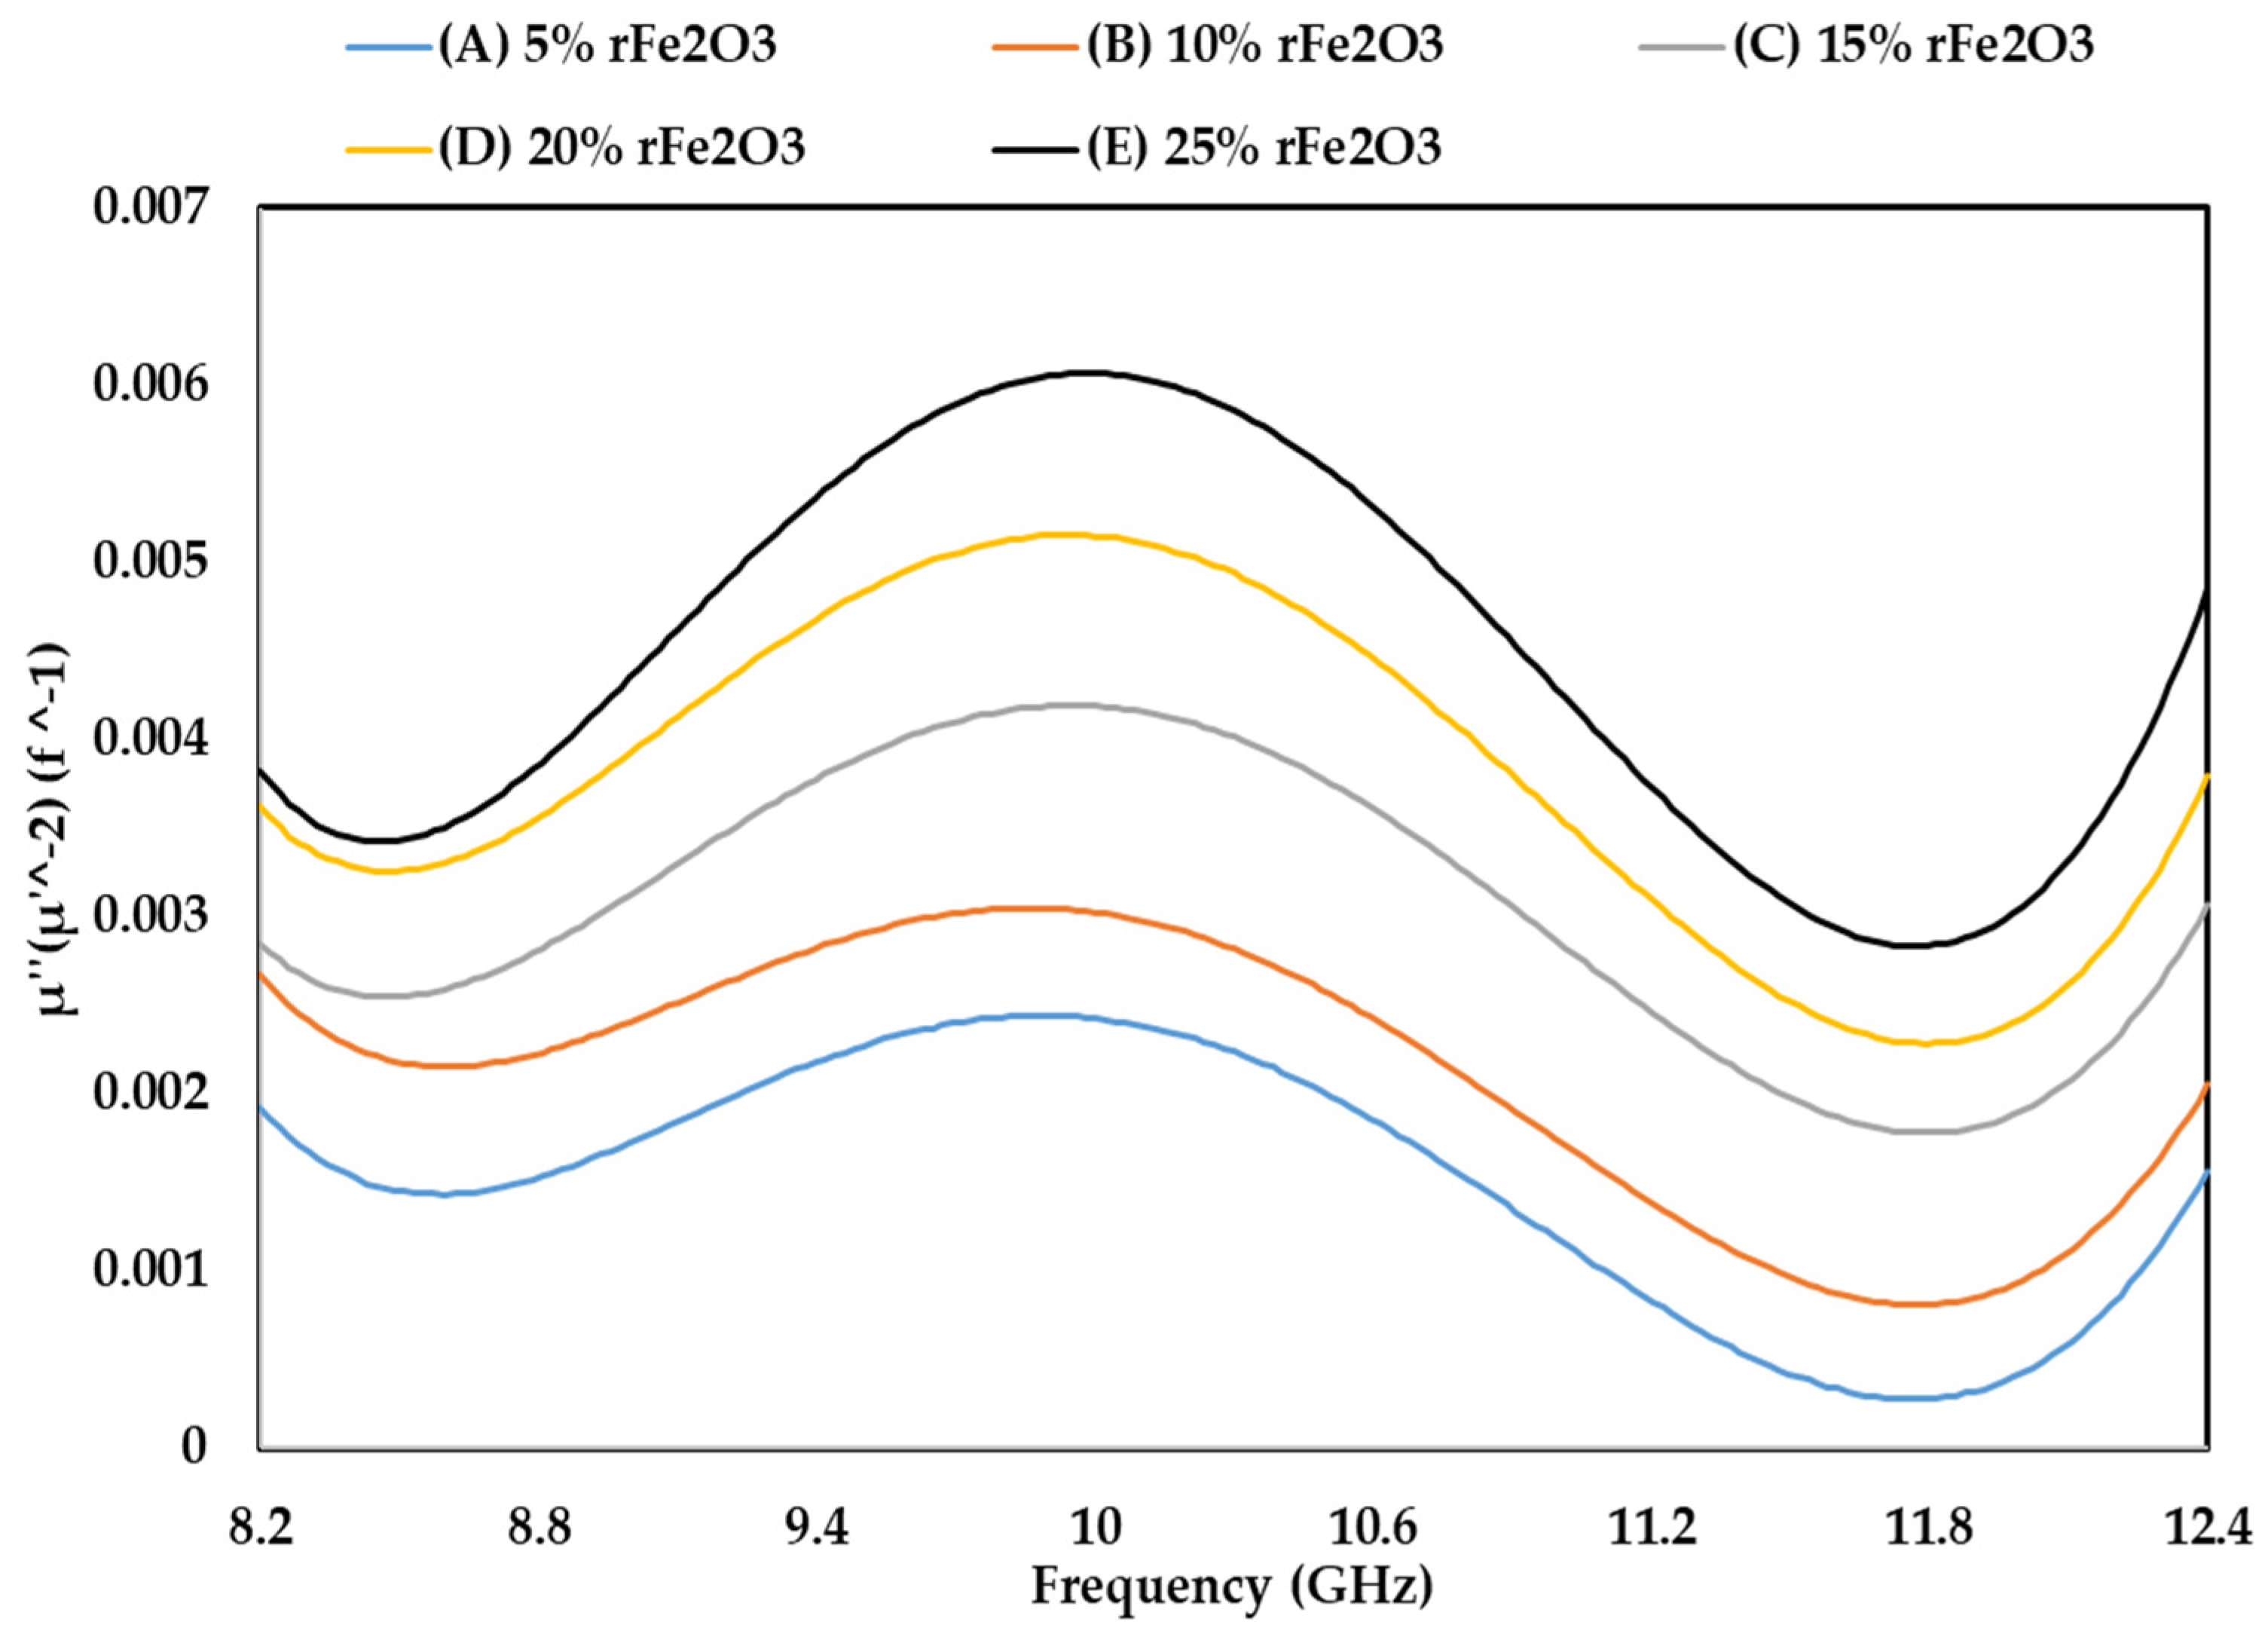
3.5. Complex Permeability of rFe2O3–PTFE Nanocomposites

The permeability characteristics of rFe2O3–PTFE nanocomposites can only be attributed to the rFe2O3 nanoparticles because PTFE is a non-magnetic material [51]. The variations in µ′, µ″, and t a n δ µ of rFe2O3–PTFE nanocomposites are shown in Figure 14, Figure 15 and Figure 16, respectively. It is clear that the values of µ′, µ″, and t a n δ µ were higher for rFe2O3–PTFE nanocomposites having higher rFe2O3 content.
As the content of rFe2O3 nanofiller increased in the rFe2O3–PTFE nanocomposites, the spacing in the nanocomposites reduced due to the high specific surface area of the rFe2O3 nanofiller. This made it more difficult for the magnetic field to pass through the rFe2O3–PTFE nanocomposites, thereby increasing the values of the relative complex permeability.
The real part (µ′) of the relative permeability values were 1.039, 1.047, 1.06, 1.8 and 1.1 for 5% (A), 10% (B), 15% (C), 20% (D) and 25% (E) rFe2O3 nanocomposites, respectively, within the frequency range of 8.2–12.4 GHz while the corresponding values of µ″ were 0.017, 0.023, 0.026, 0.034 and 0.038 at 8.2 GHz. A resonant peak can be clearly seen in each µ″ curve between 10 and 10.6 GHz. The increment in µ′ and µ″ of the polymer composites with increase in Fe2O3 is supported by studies conducted by Abdalhadi et al. [52] and Ahmad et al. [53]. In addition, the magnetic loss tangent in Figure 16 followed the behavior of µ″ because it was calculated using the equation t a n δ µ = µ µ .
It can be seen that µ′ in Figure 14 shows constant values while µ″ in Figure 15 shows non-steady behavior with the frequency. The µ′ is associated with the material storage capacity of the magnetic field [54], and it did not vary with frequency because of the RWG measurement model described in Section 2.4.7. On the other hand, the fluctuations in µ″ with the frequency can be attributed to the magnetic loss. In general, the magnetic loss of a sample originates because of one of these four reasons: the hysteresis loss, domain-wall resonance, eddy current effect, and natural resonance [55]. The first reason (hysteresis loss) which originates from the irreversible magnetization is negligible in a weak applied magnetization field [56]. The second reason (domain-wall resonance) normally occurs in the (1–100) MHz range, therefore, this reason can be excluded in this study [57]. The third reason (eddy current effect) can usually be estimated using the equation of C 0 = µ µ 2 f 1 . When the magnetic loss originates for this reason, the C 0   should be almost constant as the frequency varied. However, it can be seen in Figure 17 that the C 0 values for the rFe2O3–PTFE nanocomposites varied considerably with the frequency; so, this reason can also be excluded. Hence, these resonant peaks are associated with the natural ferromagnetic resonance [58]. The trend of µ″ is also supported by the study conducted by Liang [59].

4. Conclusions

In this research, rFe2O3–PTFE nanocomposites were successfully fabricated using rFe2O3 nanopowder as the filler and PTFE as the matrix. The effect of rFe2O3 loading on the structural, mechanical, thermal, dielectric, and magnetic properties of PTFE matrix was investigated. rFe2O3 nanofiller was dispersed uniformly with complete implantation in the PTFE matrix as presented in the FESEM results. The density increased but the tensile strength decreased with the increase of rF2O3 nanofiller in the nanocomposites. The rFe2O3 nanoparticles improved the thermal properties of the PTFE matrix. The complex permittivity and permeability were also enhanced by embedding rFe2O3 nanofiller in the matrix throughout the measurement range. The important dielectric, magnetic, thermal and mechanical properties of rFe2O3–PTFE nanocomposites linked to the content of the rFe2O3 in the nanocomposites can be employed in possible applications requiring tunable characteristics.

Author Contributions

Conceptualization, A.M.K. and Z.A.; methodology, R.S.A.; software, A.M.K. and E.E.M.; validation, Z.A and R.S.A.; formal analysis, A.M.K.; investigation, A.M.K. and I.A.A.; resources, Z.A. and R.S.A.; data curation, A.M.K. and I.A.A.; writing—original draft preparation, A.M.K.; writing—review and editing, A.M.K.; visualization, A.M.K.; supervision, Z.A.; project administration, Z.A.; funding acquisition, Z.A. All authors have read and agreed to the published version of the manuscript.

Funding

This work is supported by the Universiti Putra Malaysia (UPM) and Ministry of Higher Education (MOHE) Fundamental Research Grant Scheme FRGS/1/2015/ICT05/UPM/02/4.

Institutional Review Board Statement

Not applicable.

Informed Consent Statement

Not applicable.

Data Availability Statement

Not applicable.

Acknowledgments

The authors specially thank Physics Department (UPM), UPM Holdings & RMC for research management facilities, Sarra Gobal Sdn Bhd and MOSTI for AG TF0315D031 project, Sunkoo Machine Tech Ltd. for PTFE powder supply, and Ministry of Higher Education (MOHE) Fundamental Research Grant Scheme (FRGS).

Conflicts of Interest

The authors declare no conflict of interest.

References

  1. Liu, B.; Zhang, L.; Zhang, Y.; Han, G.; Zhang, B. Innovative methodology for co-treatment of mill scale scrap and manganese ore via oxidization roasting-magnetic separation for preparation of ferrite materials. Ceram. Int. 2021, 47, 6139–6153. [Google Scholar] [CrossRef]
  2. Mensah, E.E.; Abbas, Z.; Azis, R.S.; Ibrahim, N.A.; Khamis, A.M. Complex Permittivity and Microwave Absorption Properties of OPEFB Fiber–Polycaprolactone Composites Filled with Recycled Hematite (α-Fe2O3) Nanoparticles. Polymers 2019, 11, 918. [Google Scholar] [CrossRef] [PubMed] [Green Version]
  3. Eid, C.; Brioude, A.; Salles, V.; Plenet, J.-C.; Asmar, R.; Monteil, Y.; Khoury, R.; Khoury, A.; Miele, P. Iron-based 1D nanostructures by electrospinning process. Nanotechnology 2010, 21, 125701. [Google Scholar] [CrossRef] [PubMed] [Green Version]
  4. El-Leathy, A.; Danish, S.N.; Al-Ansary, H.; Jeter, S.; Al-Suhaibani, Z. Experimental study of compatibility of reduced metal oxides with thermal energy storage lining materials. In Proceedings of the AIP Conference Proceedings, Cape Town, South Africa, 13–16 October 2015; p. 050013. Available online: https://aip.scitation.org/toc/apc/1734/1?size=all (accessed on 31 May 2016).
  5. Müller, M.; Villalba, J.C.; Mariani, F.Q.; Dalpasquale, M.; Lemos, M.Z.; Huila, M.F.G.; Anaissi, F.J. Synthesis and characterization of iron oxide pigments through the method of the forced hydrolysis of inorganic salts. Dye. Pigment. 2015, 120, 271–278. [Google Scholar] [CrossRef]
  6. Shi, X.; Zhou, W.; Ma, D.; Ma, Q.; Bridges, D.; Ma, Y.; Hu, A. Electrospinning of nanofibers and their applications for energy devices. J. Nanomater. 2015, 2015, 122. [Google Scholar] [CrossRef] [Green Version]
  7. Bai, H.; Yin, P.; Lu, X.; Zhang, L.; Wu, W.; Feng, X.; Wang, J.; Dai, J. Recent advances of magnetism-based microwave absorbing composites: An insight from perspective of typical morphologies. J. Mater. Sci. Mater. Electron. 2020, 1–26. [Google Scholar] [CrossRef]
  8. Raveendran, A.; Sebastian, M.T.; Raman, S. Applications of microwave materials: A review. J. Electron. Mater. 2019, 48, 2601–2634. [Google Scholar] [CrossRef] [Green Version]
  9. Bhattacharya, P.; Das, C.K. In situ synthesis and characterization of CuFe10Al2O19/MWCNT nanocomposites for supercapacitor and microwave-absorbing applications. Ind. Eng. Chem. Res. 2013, 52, 9594–9606. [Google Scholar] [CrossRef]
  10. Oladele, I.O.; Omotosho, T.F.; Adediran, A.A. Polymer-Based Composites: An Indispensable Material for Present and Future Applications. Int. J. Polym. Sci. 2020, 2020, 8834518. [Google Scholar] [CrossRef]
  11. Chandra, R.J.; Shivamurthy, B.; Kulkarni, S.D.; Kumar, M.S. Hybrid polymer composites for EMI shielding application—A review. Mater. Res. Express 2019, 6, 082008. [Google Scholar]
  12. Wu, K.-T.; Yuan, Y.; Zhang, S.-R.; Yan, X.-Y.; Cui, Y.-R. ZrTi2O6 filled PTFE composites for microwave substrate applications. J. Polym. Res. 2013, 20, 223. [Google Scholar] [CrossRef]
  13. Murali, K.; Rajesh, S.; Prakash, O.; Kulkarni, A.; Ratheesh, R. Preparation and properties of silica filled PTFE flexible laminates for microwave circuit applications. Compos. Part A Appl. Sci. Manuf. 2009, 40, 1179–1185. [Google Scholar] [CrossRef]
  14. Chen, Y.-C.; Lin, H.-C.; Lee, Y.-D. The effects of filler content and size on the properties of PTFE/SiO2 composites. J. Polym. Res. 2003, 10, 247–258. [Google Scholar] [CrossRef]
  15. Xie, C.; Liang, F.; Ma, M.; Chen, X.; Lu, W.; Jia, Y. Microstructure and dielectric properties of PTFE-based composites filled by micron/submicron-blended CCTO. Crystals 2017, 7, 126. [Google Scholar]
  16. Madusanka, H.; Samarasekara, P.; Fernando, C. Polytetrafluoroethylene bindered hematite (α—Fe2O3) nanostructure for ammonia gas detection at room temperature. Mater. Res. Express 2018, 5, 125002. [Google Scholar] [CrossRef]
  17. Kang, W.; Li, F.; Zhao, Y.; Qiao, C.; Ju, J.; Cheng, B. Fabrication of porous Fe2O3/PTFE nanofiber membranes and their application as a catalyst for dye degradation. RSC Adv. 2016, 6, 32646–32652. [Google Scholar] [CrossRef]
  18. Huang, J.-Y.; Fang, X.; Li, Y.-C.; Feng, B.; Wang, H.-X.; Du, K. The mechanical and reaction behavior of PTFE/Al/Fe2O3 under impact and quasi-static compression. Adv. Mater. Sci. Eng. 2017, 2017, 3540320. [Google Scholar] [CrossRef] [Green Version]
  19. Ai, Z.; Mei, T.; Liu, J.; Li, J.; Jia, F.; Zhang, L.; Qiu, J. Fe@ Fe2O3 core-shell nanowires as an iron reagent. 3. Their combination with CNTs as an effective oxygen-fed gas diffusion electrode in a neutral electro-Fenton system. J. Phys. Chem. C 2007, 111, 14799–14803. [Google Scholar] [CrossRef]
  20. Singh, K.; Ohlan, A.; Kotnala, R.; Bakhshi, A.; Dhawan, S. Dielectric and magnetic properties of conducting ferromagnetic composite of polyaniline with γ-Fe2O3 nanoparticles. Mater. Chem. Phys. 2008, 112, 651–658. [Google Scholar] [CrossRef]
  21. Reda, S. electric and dielectric properties of Fe2O3/silica nanocomposites. Int. J. Nano Sci. Technol. 2013, 1, 17–28. [Google Scholar]
  22. Ul-Haq, Y.; Murtaza, I.; Mazhar, S.; Ullah, R.; Iqbal, M.; Qarni, A.A.; Amin, S. Dielectric, thermal and mechanical properties of hybrid PMMA/RGO/Fe2O3 nanocomposites fabricated by in-situ polymerization. Ceram. Int. 2020, 46, 5828–5840. [Google Scholar] [CrossRef]
  23. Mensah, E.E.; Abbas, Z.; Ibrahim, N.A.; Khamis, A.M.; Abdalhadi, D.M. Complex permittivity and power loss characteristics of α-Fe2O3/polycaprolactone (PCL) nanocomposites: Effect of recycled α-Fe2O3 nanofiller. Heliyon 2020, 6, e05595. [Google Scholar] [CrossRef]
  24. Paula, A.L.D.; Rezende, M.C.; Barroso, J.J. Experimental measurements and numerical simulation of permittivity and permeability of Teflon in X band. J. Aerosp. Technol. Manag. 2011, 3, 59–64. [Google Scholar] [CrossRef]
  25. Mensah, E.E.; Abbas, Z.; Azis, R.a.S.; Khamis, A.M. Enhancement of complex permittivity and attenuation properties of recycled hematite (α-Fe2O3) using nanoparticles prepared via ball milling technique. Materials 2019, 12, 1696. [Google Scholar] [CrossRef] [Green Version]
  26. Yusoff, A.; Abdullah, M. Microwave electromagnetic and absorption properties of some LiZn ferrites. J. Magn. Magn. Mater. 2004, 269, 271–280. [Google Scholar] [CrossRef]
  27. Wang, Y.; Wang, L.; Wu, H. Enhanced microwave absorption properties of α-Fe2O3-filled ordered mesoporous carbon nanorods. Materials 2013, 6, 1520–1529. [Google Scholar] [CrossRef] [Green Version]
  28. Hong, Y.-K.; Lee, J. Ferrites for RF passive devices. Solid State Phys. 2013, 64, 237–329. [Google Scholar]
  29. Ismail, N.Q.A.; Saat, N.K.; Zaid, M.H.M. Effect of soda lime silica glass doping on ZnO varistor ceramics: Dry milling method. J. Asian Ceram. Soc. 2020, 8, 909–914. [Google Scholar] [CrossRef]
  30. James, J.; Spittle, J.; Brown, S.; Evans, R. A review of measurement techniques for the thermal expansion coefficient of metals and alloys at elevated temperatures. Meas. Sci. Technol. 2001, 12, R1. [Google Scholar] [CrossRef]
  31. Wool, R. Bio-Based Composites from Soybean Oil and Chicken Feathers; Elsevier: Amsterdam, The Netherlands, 2005. [Google Scholar]
  32. Shabana, R.; Sarojini, J.; Vikram, K.A.; Lakshmi, V. Evaluating the mechanical properties of commonly used 3D printed ABS and PLA polymers with multi layered polymers. Int. J. Eng. Adv. Technol. 2019, 8, 2351–2356. [Google Scholar]
  33. Khamis, A.; Abbas, Z.; Ahmad, A.; Azis, R.S.; Abdalhadi, D.; Mensah, E.E. Experimental and Computational Study on Epoxy Resin Reinforced with Micro-Sized OPEFB Using Rectangular Waveguide and Finite Element Method. IET Microw. Antennas Propag. 2020, 14, 752–758. [Google Scholar] [CrossRef]
  34. Yamaguchi, A.; Kido, H.; Ukita, Y.; Kishihara, M.; Utsumi, Y. Anisotropic pyrochemical microetching of poly (tetrafluoroethylene) initiated by synchrotron radiation-induced scission of molecule bonds. Appl. Phys. Lett. 2016, 108, 051610. [Google Scholar] [CrossRef]
  35. Wen, B.; Li, J.; Lin, Y.; Liu, X.; Fu, J.; Miao, H.; Zhang, Q. A novel preparation method for γ-Fe2O3 nanoparticles and their characterization. Mater. Chem. Phys. 2011, 128, 35–38. [Google Scholar] [CrossRef]
  36. Ang, B.; Yaacob, I.; Nurdin, I. Investigation of Fe2O3/SiO2 nanocomposite by FESEM and TEM. J. Nanomater. 2013, 2013, 980390. [Google Scholar] [CrossRef] [Green Version]
  37. Glaris, P.; Coulon, J.-F.; Dorget, M.; Poncin-Epaillard, F. Thermal annealing as a new simple method for PTFE texturing. Polymer 2013, 54, 5858–5864. [Google Scholar] [CrossRef]
  38. Abusafieh, A.A.; Federico, D.R.; Connell, S.J.; Cohen, E.J.; Willis, P.B. Dimensional stability of CFRP composites for space-based reflectors. In Proceedings of the Optomechanical Design and Engineering 2001, San Diego, CA, USA, 29 July–3 August 2001; pp. 9–16. [Google Scholar]
  39. Jahan, M.; Inakpenu, R.O.; Li, K.; Zhao, G. Enhancing the mechanical strength for a microwave absorption composite based on graphene nanoplatelet/epoxy with carbon fibers. Open J. Compos. Mater. 2019, 9, 230. [Google Scholar] [CrossRef] [Green Version]
  40. Jiang, Z.; Yuan, Y. Effects of particle size distribution of silica on properties of PTFE/SiO2 composites. Mater. Res. Express 2018, 5, 066306. [Google Scholar] [CrossRef]
  41. Ghasemi-Kahrizsangi, S.; Nemati, A.; Shahraki, A.; Farooghi, M. Densification and properties of Fe2O3 nanoparticles added CaO refractories. Ceram. Int. 2016, 42, 12270–12275. [Google Scholar] [CrossRef]
  42. Jedrzejewska, A.; Sibera, D.; Narkiewicz, U.; Pełech, R.; Jedrzejewski, R. Effect of Synthesis Parameters of Graphene/Fe2O3 Nanocomposites on Their Structural and Electrical Conductivity Properties. Acta Phys. Pol. A 2017, 132, 1424–1429. [Google Scholar] [CrossRef]
  43. Gorshkov, N.; Goffman, V.; Vikulova, M.; Burmistrov, I.; Kovnev, A.; Gorokhovsky, A. Dielectric properties of the polymer–matrix composites based on the system of Co-modified potassium titanate–polytetrafluorethylene. J. Compos. Mater. 2018, 52, 135–144. [Google Scholar] [CrossRef]
  44. Lanza, V.; Herrmann, D. The density dependence of the dielectric constant of polyethylene. J. Polym. Sci. 1958, 28, 622–625. [Google Scholar] [CrossRef]
  45. Leyland, R.; Maharaj, A. Dielectric constant as a means of assessing the properties of road construction materials. SATC 2010, 2010, 487–498. [Google Scholar]
  46. Fahad Ahmad, A.; Aziz, S.H.A.; Abbas, Z.; Mohammad Abdalhadi, D.; Khamis, A.M.; Aliyu, U.S.A. Computational and Experimental Approaches for Determining Scattering Parameters of OPEFB/PLA Composites to Calculate the Absorption and Attenuation Values at Microwave Frequencies. Polymers 2020, 12, 1919. [Google Scholar] [CrossRef] [PubMed]
  47. Przybyszewska, M.; Zaborski, M. The effect of zinc oxide nanoparticle morphology on activity in crosslinking of carboxylated nitrile elastomer. Express Polym. Lett 2009, 3, 542–552. [Google Scholar] [CrossRef]
  48. Mandal, S.; Singh, S.; Dey, P.; Roy, J.; Mandal, P.; Nath, T. Frequency and temperature dependence of dielectric and electrical properties of TFe2O4 (T=Ni, Zn, Zn0.5Ni0.5) ferrite nanocrystals. J. Alloys Compd. 2016, 656, 887–896. [Google Scholar] [CrossRef]
  49. Ahmad, A.F.; Ab Aziz, S.; Abbas, Z.; Obaiys, S.J.; Khamis, A.M.; Hussain, I.R.; Zaid, M.H.M. Preparation of a chemically reduced graphene oxide reinforced epoxy resin polymer as a composite for electromagnetic interference shielding and microwave-absorbing applications. Polymers 2018, 10, 1180. [Google Scholar] [CrossRef] [Green Version]
  50. Giacometti, J.A.; Wisniewski, C.; Ribeiro, P.A.; Moura, W.A. Electric measurements with constant current: A practical method for characterizing dielectric films. Rev. Sci. Instrum. 2001, 72, 4223–4227. [Google Scholar] [CrossRef] [Green Version]
  51. Huashen, W.; Shan, J.; Guodong, W.; Ke, X. Electromagnetic parameters test system based on a refined NRW transmission/reflection algorithm. In Proceedings of the 2007 International Symposium on Microwave, Antenna, Propagation and EMC Technologies for Wireless Communications, Hangzhou, China, 16–17 August 2007; pp. 1276–1280. [Google Scholar]
  52. Abdalhadi, D.M.; Abbas, Z.; Ahmad, A.F.; Matori, K.A.; Esa, F. Controlling the properties of OPEFB/PLA polymer composite by using Fe2O3 for microwave applications. Fibers Polym. 2018, 19, 1513–1521. [Google Scholar] [CrossRef]
  53. Ahmad, A.F.; Abbas, Z.; Obaiys, S.J.; Abdalhadi, D.M. Improvement of dielectric, magnetic and thermal properties of OPEFB fibre–polycaprolactone composite by adding Ni–Zn ferrite. Polymers 2017, 9, 12. [Google Scholar] [CrossRef] [Green Version]
  54. Barba, A.; Clausell, C.; Jarque, J.; Nuño, L. Magnetic complex permeability (imaginary part) dependence on the microstructure of a Cu-doped Ni–Zn-polycrystalline sintered ferrite. Ceram. Int. 2020, 46, 14558–14566. [Google Scholar] [CrossRef]
  55. Luo, J.; Shen, P.; Yao, W.; Jiang, C.; Xu, J. Synthesis, characterization, and microwave absorption properties of reduced graphene oxide/strontium ferrite/polyaniline nanocomposites. Nanoscale Res. Lett. 2016, 11, 141. [Google Scholar] [CrossRef] [Green Version]
  56. Li, W.; Qiu, T.; Wang, L.; Ren, S.; Zhang, J.; He, L.; Li, X. Preparation and electromagnetic properties of core/shell polystyrene@ polypyrrole@ nickel composite microspheres. ACS Appl. Mater. Interfaces 2013, 5, 883–891. [Google Scholar] [CrossRef]
  57. Liu, P.; Huang, Y.; Yan, J.; Zhao, Y. Magnetic graphene@ PANI@ porous TiO2 ternary composites for high-performance electromagnetic wave absorption. J. Mater. Chem. C 2016, 4, 6362–6370. [Google Scholar] [CrossRef]
  58. Li, C.; Ji, S.; Jiang, X.; Waterhouse, G.I.; Zhang, Z.; Yu, L. Microwave absorption by watermelon-like microspheres composed of γ-Fe2O3, microporous silica and polypyrrole. J. Mater. Sci. 2018, 53, 9635–9649. [Google Scholar] [CrossRef]
  59. Liang, K.; Qiao, X.-J.; Sun, Z.-G.; Guo, X.-D.; Wei, L.; Qu, Y. Preparation and microwave absorbing properties of graphene oxides/ferrite composites. Appl. Phys. A 2017, 123, 445. [Google Scholar] [CrossRef]
Figure 1. Preparation process of rFe2O3 nanoparticles.
Polymers 13 02332 g001
Figure 2. rFe2O3–PTFE nanocomposites.
Polymers 13 02332 g002
Figure 3. rFe2O3–PTFE nanocomposites preparation.
Polymers 13 02332 g003
Figure 4. Measurement of complex permeability and permittivity using rectangular waveguide technique.
Polymers 13 02332 g004
Figure 5. XRD diffractograms of the rFe2O3 nanoparticles, PTFE, and rFe2O3–PTFE nanocomposites.
Polymers 13 02332 g005
Figure 6. HRTEM images of rFe2O3 nanoparticles.
Polymers 13 02332 g006
Figure 7. FESEM of rFe2O3–PTFE nanocomposites: 5% rFe2O3 (A) nanocomposite (a,b), 15% rFe2O3 (C) nanocomposite (c,d), and 25% rFe2O3 (E) nanocomposite (e,f).
Polymers 13 02332 g007
Figure 8. Thermal expansion coefficients of rFe2O3–PTFE nanocomposites.
Polymers 13 02332 g008
Figure 9. Tensile strength vs. various rFe2O3 nanofiller content for rFe2O3–PTFE nanocomposites.
Polymers 13 02332 g009
Figure 10. Density vs. various rFe2O3 nanofiller content for rFe2O3–PTFE nanocomposites.
Polymers 13 02332 g010
Figure 11. Variation in permittivity (real part) of rFe2O3–PTFE nanocomposites using rectangular waveguide.
Polymers 13 02332 g011
Figure 12. Variation in permittivity (imaginary part) of rFe2O3–PTFE nanocomposites using rectangular waveguide.
Polymers 13 02332 g012
Figure 13. Variation in loss tangent of rFe2O3–PTFE nanocomposites.
Polymers 13 02332 g013
Figure 14. Variation in permeability (real part) of rFe2O3–PTFE nanocomposites using rectangular waveguide.
Polymers 13 02332 g014
Figure 15. Variation in permeability (imaginary part) of rFe2O3–PTFE nanocomposites using rectangular waveguide.
Polymers 13 02332 g015
Figure 16. Variation in magnetic loss tangent of rFe2O3–PTFE nanocomposites.
Polymers 13 02332 g016
Figure 17. The values of µ µ 2 f 1 as a function of frequency for rFe2O3–PTFE nanocomposites.
Polymers 13 02332 g017
Table 1. Composition of rFe2O3–PTFE nanocomposites.
Composite CodeRecycled Fe2O3 Nano-PowderPTFETotal Mass
(g)
Percentage %Mass (g)Percentage %Mass (g)
Control001006060
A53955760
B106905460
C159855160
D2012804860
E2515754560
Publisher’s Note: MDPI stays neutral with regard to jurisdictional claims in published maps and institutional affiliations.

