Article

Fe-Doped g-C3N4: High-Performance Photocatalysts in Rhodamine B Decomposition

1
Center for Nano Science and Technology, Hanoi National University of Education, 136 Xuan Thuy Road, Cau Giay District, Hanoi 100000, Vietnam
2
Department of Physics, Hanoi National University of Education, 136 Xuan Thuy Road, Cau Giay District, Hanoi 100000, Vietnam
3
Faculty of Basic Sciences, Hanoi University of Natural Resources and Environment, 41A Phu Dien Road, North Tu Liem, Hanoi 100000, Vietnam
4
Nguyen Trai Specialized Senior High School, Haiduong 03000, Vietnam
5
Department of Physics, Hanoi University of Mining and Geology, Duc Thang ward, North Tu Liem District, Hanoi 100000, Vietnam
6
Military Science Academy, 322 Le Trong Tan street, Dinh Cong, Hoang Mai, Hanoi 100000, Vietnam
*
Author to whom correspondence should be addressed.
Polymers 2020, 12(9), 1963; https://doi.org/10.3390/polym12091963
Submission received: 29 July 2020 / Revised: 21 August 2020 / Accepted: 22 August 2020 / Published: 30 August 2020
(This article belongs to the Section Polymer Chemistry)

Abstract

:
Herein, Fe-doped C3N4 high-performance photocatalysts, synthesized by a facile and cost effective heat stirring method, were investigated systematically using powder X-ray diffraction (XRD), Fourier transform infrared (FTIR), scanning electron microscopy (SEM) and Brunauer–Emmett–Teller (BET) surface area measurement, X-ray photoelectron (XPS), UV–Vis diffusion reflectance (DRS) and photoluminescence (PL) spectroscopy. The results showed that Fe ions incorporated into a g-C3N4 nanosheet in both +3 and +2 oxidation states and in interstitial configuration. Absorption edge shifted slightly toward the red light along with an increase of absorbance in the wavelength range of 430–570 nm. Specific surface area increased with the incorporation of Fe into g-C3N4 lattice, reaching the highest value at the sample doped with 7 mol% Fe (FeCN7). A sharp decrease in PL intensity with increasing Fe content is an indirect evidence showing that electron-hole pair recombination rate decreased. Interestingly, Fe-doped g-C3N4 nanosheets present a superior photocatalytic activity compared to pure g-C3N4 in decomposing RhB solution. FeCN7 sample exhibits the highest photocatalytic efficiency, decomposing almost completely RhB 10 ppm solution after 30 min of xenon lamp illumination with a reaction rate approximately ten times greater than that of pure g-C3N4 nanosheet. This is in an agreement with the BET measurement and photoluminescence result which shows that FeCN7 possesses the largest specific surface area and low electron-hole recombination rate. The mechanism of photocatalytic enhancement is mainly explained through the charge transfer processes related to Fe2+/Fe3+ impurity in g-C3N4 crystal lattice.

Graphical Abstract

1. Introduction

Humanity and other life forms on the earth are facing serious threats due to the exhaustion of fossil fuel resources together with the problem of environmental pollution caused by human activities in industry and life [1,2]. Therefore, the search for alternative resources of fuel, both abundant and environmentally friendly, is a vital task of humanity [3]. In addition, research on finding new materials to treat hazardous waste from industry and life such as liquid waste, exhaust gas, solid waste is also an essential task [4,5].
The advanced oxidation processes (AOPs) [6,7,8] have been well known to be the effective method in removing toxic organic materials from water, gas and soil, as well as in producing hydrogen fuel gas form water. The characteristic of this process is the photochemical reaction between semiconductors and light (visible or ultraviolet), creating photogenerated electron-hole pairs. These particles oxidize and reduce either organic pollutions directly or in the other hand react with oxygen and water molecules to form oxidative radicals of super oxides (O2) and hydroxyl (OH). These chemical species can oxidize and mineralize organic substances into CO2 and water or at least promote the conversion of toxic organic contaminations into non-toxic organic substances such as destroying the aromatic ring [9].
Semiconductors that possess attractive properties such as low cost, non-toxic, mechanically and thermally durable, high efficiency of electron-hole pairs production, low electron-hole recombination rate have been targeted as the best and most flexible for AOPs for several decades [10,11,12,13,14]. In particular, several typical compounds can be mentioned as titanium dioxide TiO2 [15,16], perovskite materials ABO3 [17,18,19,20], zinc oxide ZnO [21,22], zinc tungsten oxide ZnWO4 [23,24,25] and so forth. However, a common feature of this semiconductor generation is the large band gap (Eg~3.2 eV) which restricts the efficiency of sunlight in stimulating photochemical reactions. Recently, graphitic carbon nitride g-C3N4 has emerged as a non-metallic semiconductor with many outstanding advantages, satisfying the requirements of an efficient photocatalytic semiconductor to generate the large number of electron-hole pairs and the application of sunlight in photochemical reactions due to the narrow optical band gap (Eg~2.7 eV) [26,27]. In addition, the nanosheet structure of g-C3N4 with high porosity and large specific surface area also supports for photocatalytic application of this material. However, studies showed that photogenerated electrons in g-C3N4 are localized in each heptazine unit, resulting to a high recombination rate of electron-hole pairs and preventing photocatalytic activity of material [28].
Studies based on g-C3N4 have been mostly carried out in attempt to reduce the recombination rate of photogenerated electron-hole pairs, in addition to reduce the energy band gap. Effective procedures may be referred to as—(i) creating heterojunctions like semiconductor-semiconductor [29,30,31] or metal-semiconductor [32,33,34] in order to effectively separate electrons and holes; (ii) doping metallic elements into g-C3N4 as electron trapping centers [35,36], leaving highly oxidized holes. Recent works showed that the incorporation of metal ions into g-C3N4 polymerization network not only improves charge carrier lifetime and mobilities but also reduces the band gap of g-C3N4. In g-C3N4 network, tri-s-triazine units connected by 3-fold N-bridges create a large space with six lone-pair electron nitrogen atoms, which can serve as an ideal coordination for accommodation of transition metal ion (Figure 1).
Since Wang et al. observed the modify of functionality of g-C3N4 as doped with some metals including Fe in 2009 [37], Fe-doped g-C3N4 nanosheets have been studied to find out highly effective photocatalysts as well as explore the mechanism to improve their photocatalytic activity. In 2014, Fe-doped g-C3N4 nanosheets synthesized from melamine and FeCl3 by a two-step method was studied by Tonda et al. [38]. The significant improvement of photocatalytic performance for Rhodamine B degradation was explained by the role of Fe3+ as the trap of photogenerated electrons. In 2019, Ma et al. reported on Fe-doped g-C3N4 photocatalyst synthesized by one-step thermal condensation of iron nitrate nonahydrate (Fe(NO3)3·9H2O) and melamine [35] in which the authors emphasized the pivotal role of Fe3+/Fe2+ couple in the photocatalytic reaction. In addition, studies on (Fe, P) co-doped g-C3N4 also shown significant improvement in photocatalytic efficiency [39,40]. Evidence of the improvement of photocatalytic efficiency as well as its mechanism in Fe-doped g-C3N4 material remains to be confirmed, contributing greatly to the discovery of high-performance photocatalyst in particular and solar energy conversion material in general.
In this study, Fe-doped g-C3N4 was synthesized from urea and FeCl3 by a two-step method. The study will provide the evidence of Fe impurity position in g-C3N4 host lattice, demonstrate the presence of Fe3+/Fe2+ couple as well as discuss their role in photocatalytic performance enhancing.

2. Materials and Methods

2.1. Synthesis of g-C3N4 Nanosheets

An appropriate amount of urea (NH2CONH2, >99%, Sigma-Aldrich, China) contained in a sealed glass was heated at 550 °C for 2 h in air atmosphere. The bright yellow g-C3N4 product [41,42] was dispersed in distilled water, ultrasonicated for 3 h and then dried to obtain g-C3N4 nanosheets.

2.2. Synthesis of Fe-dope g-C3N4 Nanosheets

To synthesize Fe-doped g-C3N4, 0.5 g of g-C3N4 nanosheets was dispersed in 50 mL of distilled water by magnetically stirring for 30 min and then ultrasonicating for 1 h to obtain a suspension of g-C3N4 nanosheets. An appropriate amount of ferric chloride hexahydrate (FeCl3.6H2O, >98%, Sigma-Aldrich, China) corresponding to 3, 5, 7, 8, 10 mol% of Fe was added to above solution which was continuously heated for 12 h at temperature of 90 °C under magnetically stirring condition in order to allow Fe atoms to insert into appropriate interstitial positions in g-C3N4 crystal lattice. The suspension was rinsed with ethanol and centrifuged at 6000 rpm for 10 min for 3 times to remove excess contaminations from the solution. The remaining material was dried at 80 °C for 5 h to achieve Fe-doped g-C3N4 nanosheets.
For a convenient, g-C3N4 photocatalysts doped with 3, 5, 6, 7, 8 and 10 mol% of Fe were denoted as FeCN3, FeCN5, FeCN6, FeCN7, FeCN8 and FeCN10, respectively.

2.3. Characterizations

X-ray diffraction (XRD) patterns of Fe-doped g-C3N4 nanosheets were recorded by a D8 Advance diffractometer (Bruker, Germany) using Cu-Kα radiation. Lattice parameters were calculated by using UnitCell software. IR Prestige-21 FTIR/NIR spectrometer (Shimadzu, Japan) was used to carry out Fourier transform infrared spectra (FTIR) of as-synthesized samples. Scanning electron spectroscopy (SEM) images of fabricated samples were obtained using a S-4800 NIHE microscope (Hitachi, Japan). The Brunauer–Emmett–Teller (BET) surface area was measured by a 3Flex (Micromeritics, America). UV–Vis diffuse reflectance spectra (DRS) was performed on a V670 UV–Vis spectrophotometer (Jasco, Japan). Multilab-2000 spectrometer with an Al Kα monochromatized source was used to measured X-ray photoelectron spectroscopy (XPS). Photoluminescence (PL) spectra were performed on a Nanolog iHR 320 fluorescence spectrophotometer (Horiba, Japan) using an excitation wavelength of 350 nm.

2.4. Photocatalytic Process

Rhodamine B chemical compound was chosen as a degradation agent in determining photocatalytic activity of Fe-doped g-C3N4 nanosheets. Firstly, a solution of RhB 20 ppm was prepared. Fe-doped g-C3N4 photocatalyst was weighed with appropriate amount of 0.06 g and dispersed in 30 mL of distilled water DI under ultrasound vibration for 1 h. Due to nanosheet morphology of sample the solution was formed as opaque with tiny particle suspended. Next, dissolving 30 mL of RhB 20 ppm solution into 30 mL of above g-C3N4 contained solution under magnetically stirring condition. The solution was stirred for 30 min in the dark to reach equilibrium state of adsorption-desorption. To check for equilibrium, 3 mL of solution was removed after each 10 min of dark stirring to determine the remaining concentration of RhB. After that, the solution was stirring under irradiating condition of a 300 W xenon lamp at a distance of 10 cm from lamp to liquid surface (or under sunlight illumination). A piece of glass was used to block ultraviolet irradiation from xenon lamp entering the photocatalytic solution. An amount of 3 mL of solution was removed after each 10 min of exposure and filtered g-C3N4 nanosheets to measure UV–Vis absorption spectra. The absorbance of 554 nm peak of RhB was used to determine the remaining content of RhB in the solution at a time by using a standard curve that represents the relationship between RhB concentration and absorbance.

3. Results and Discussions

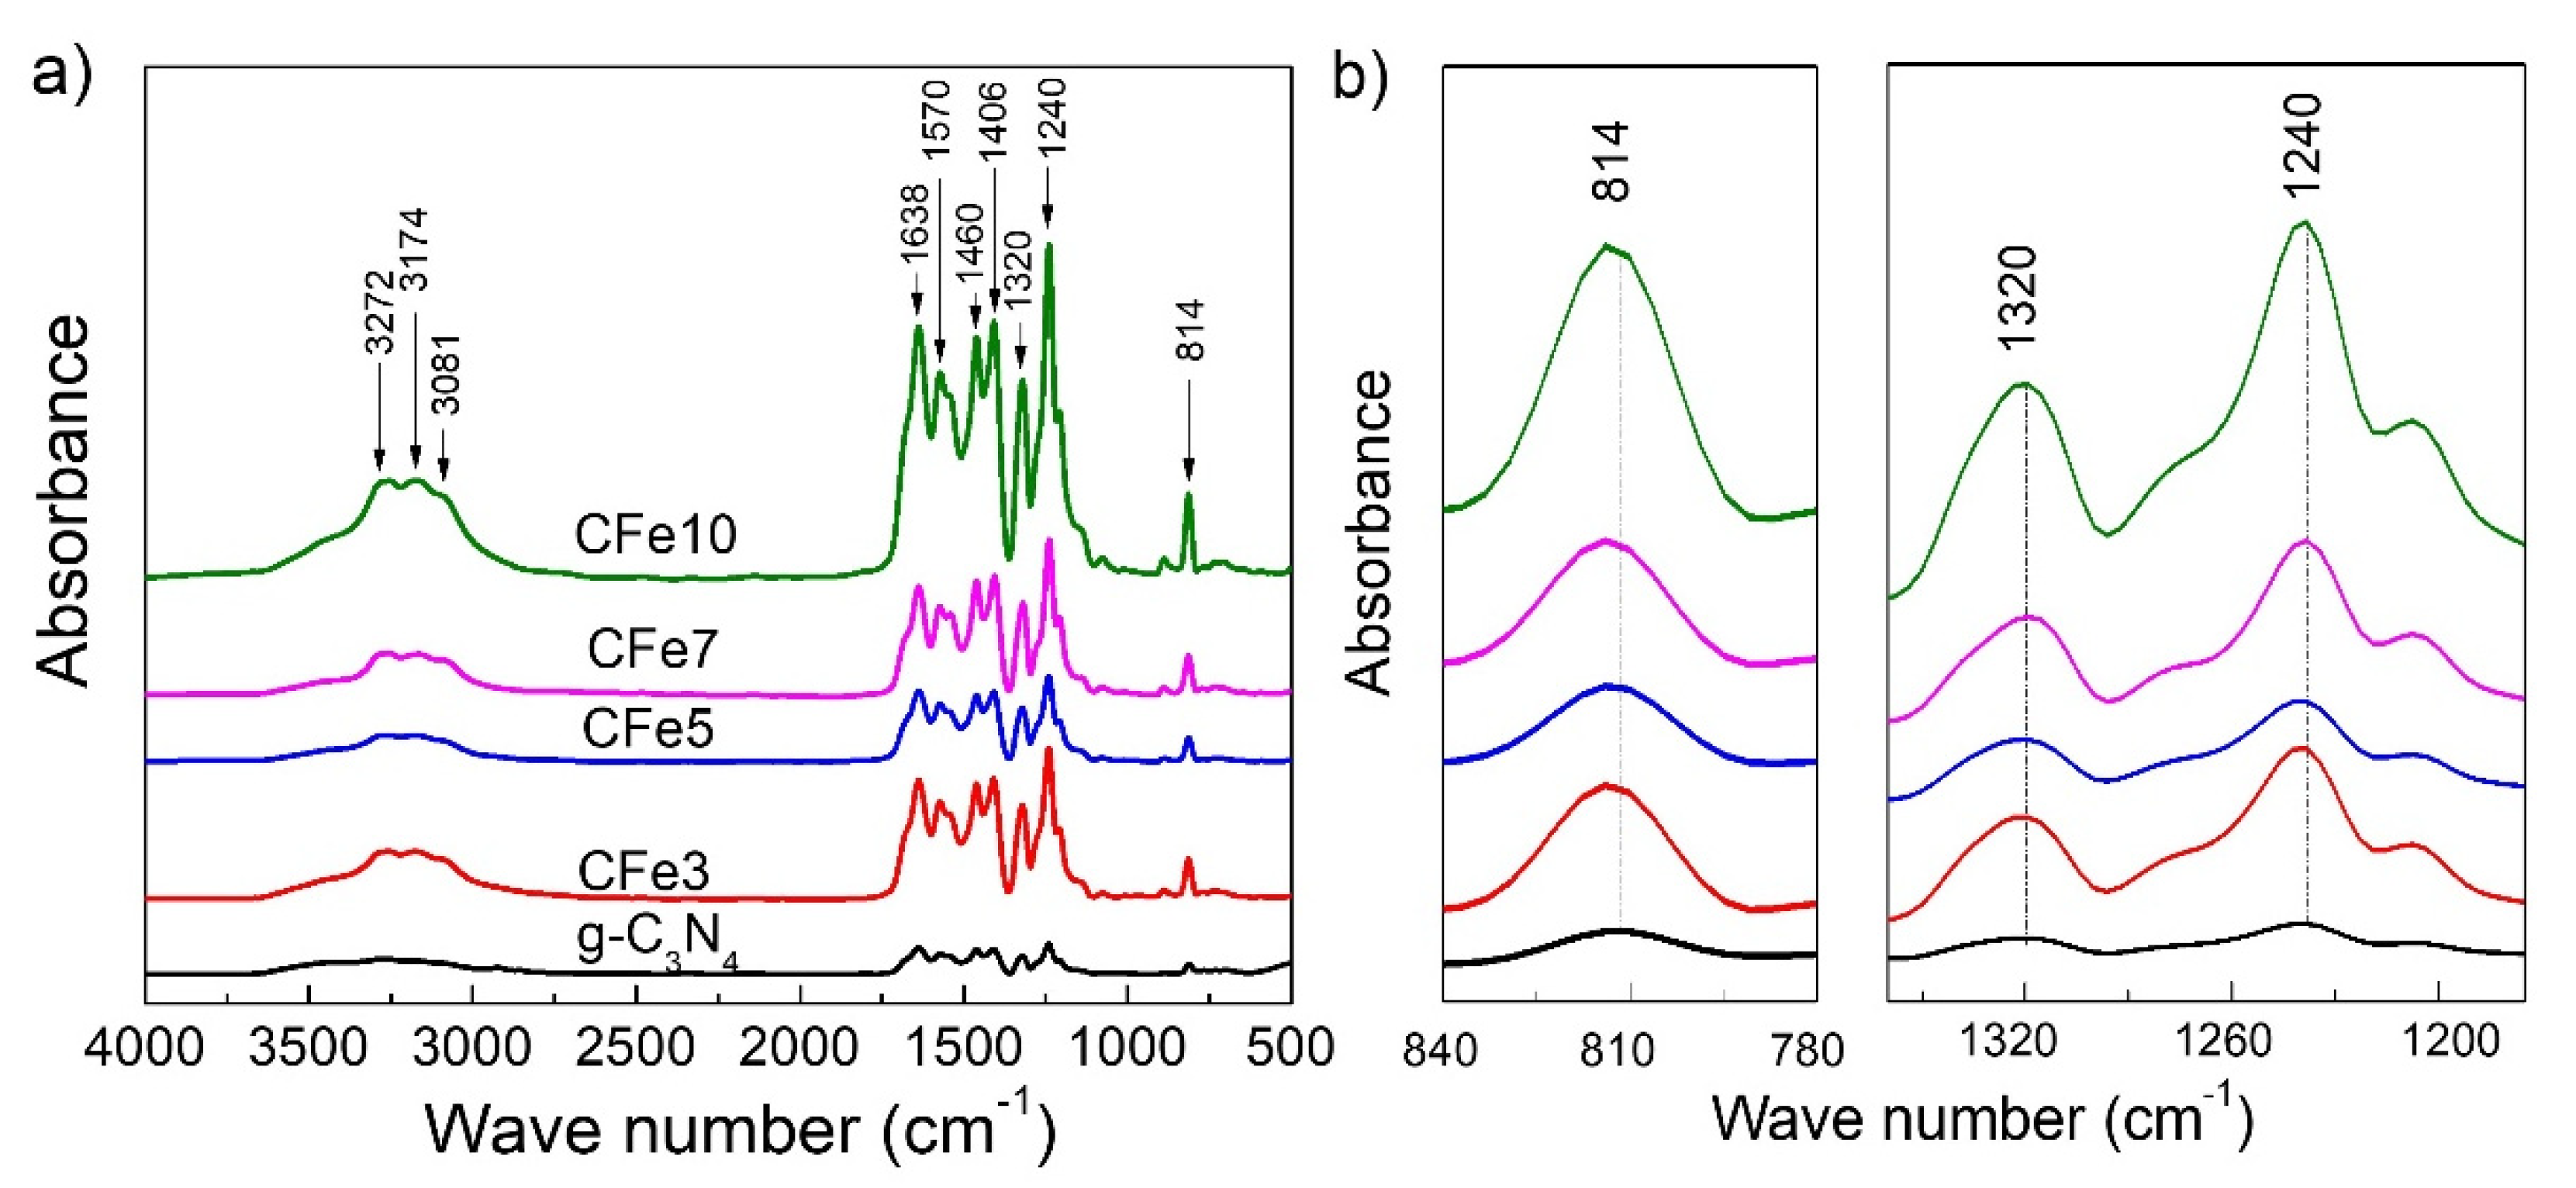
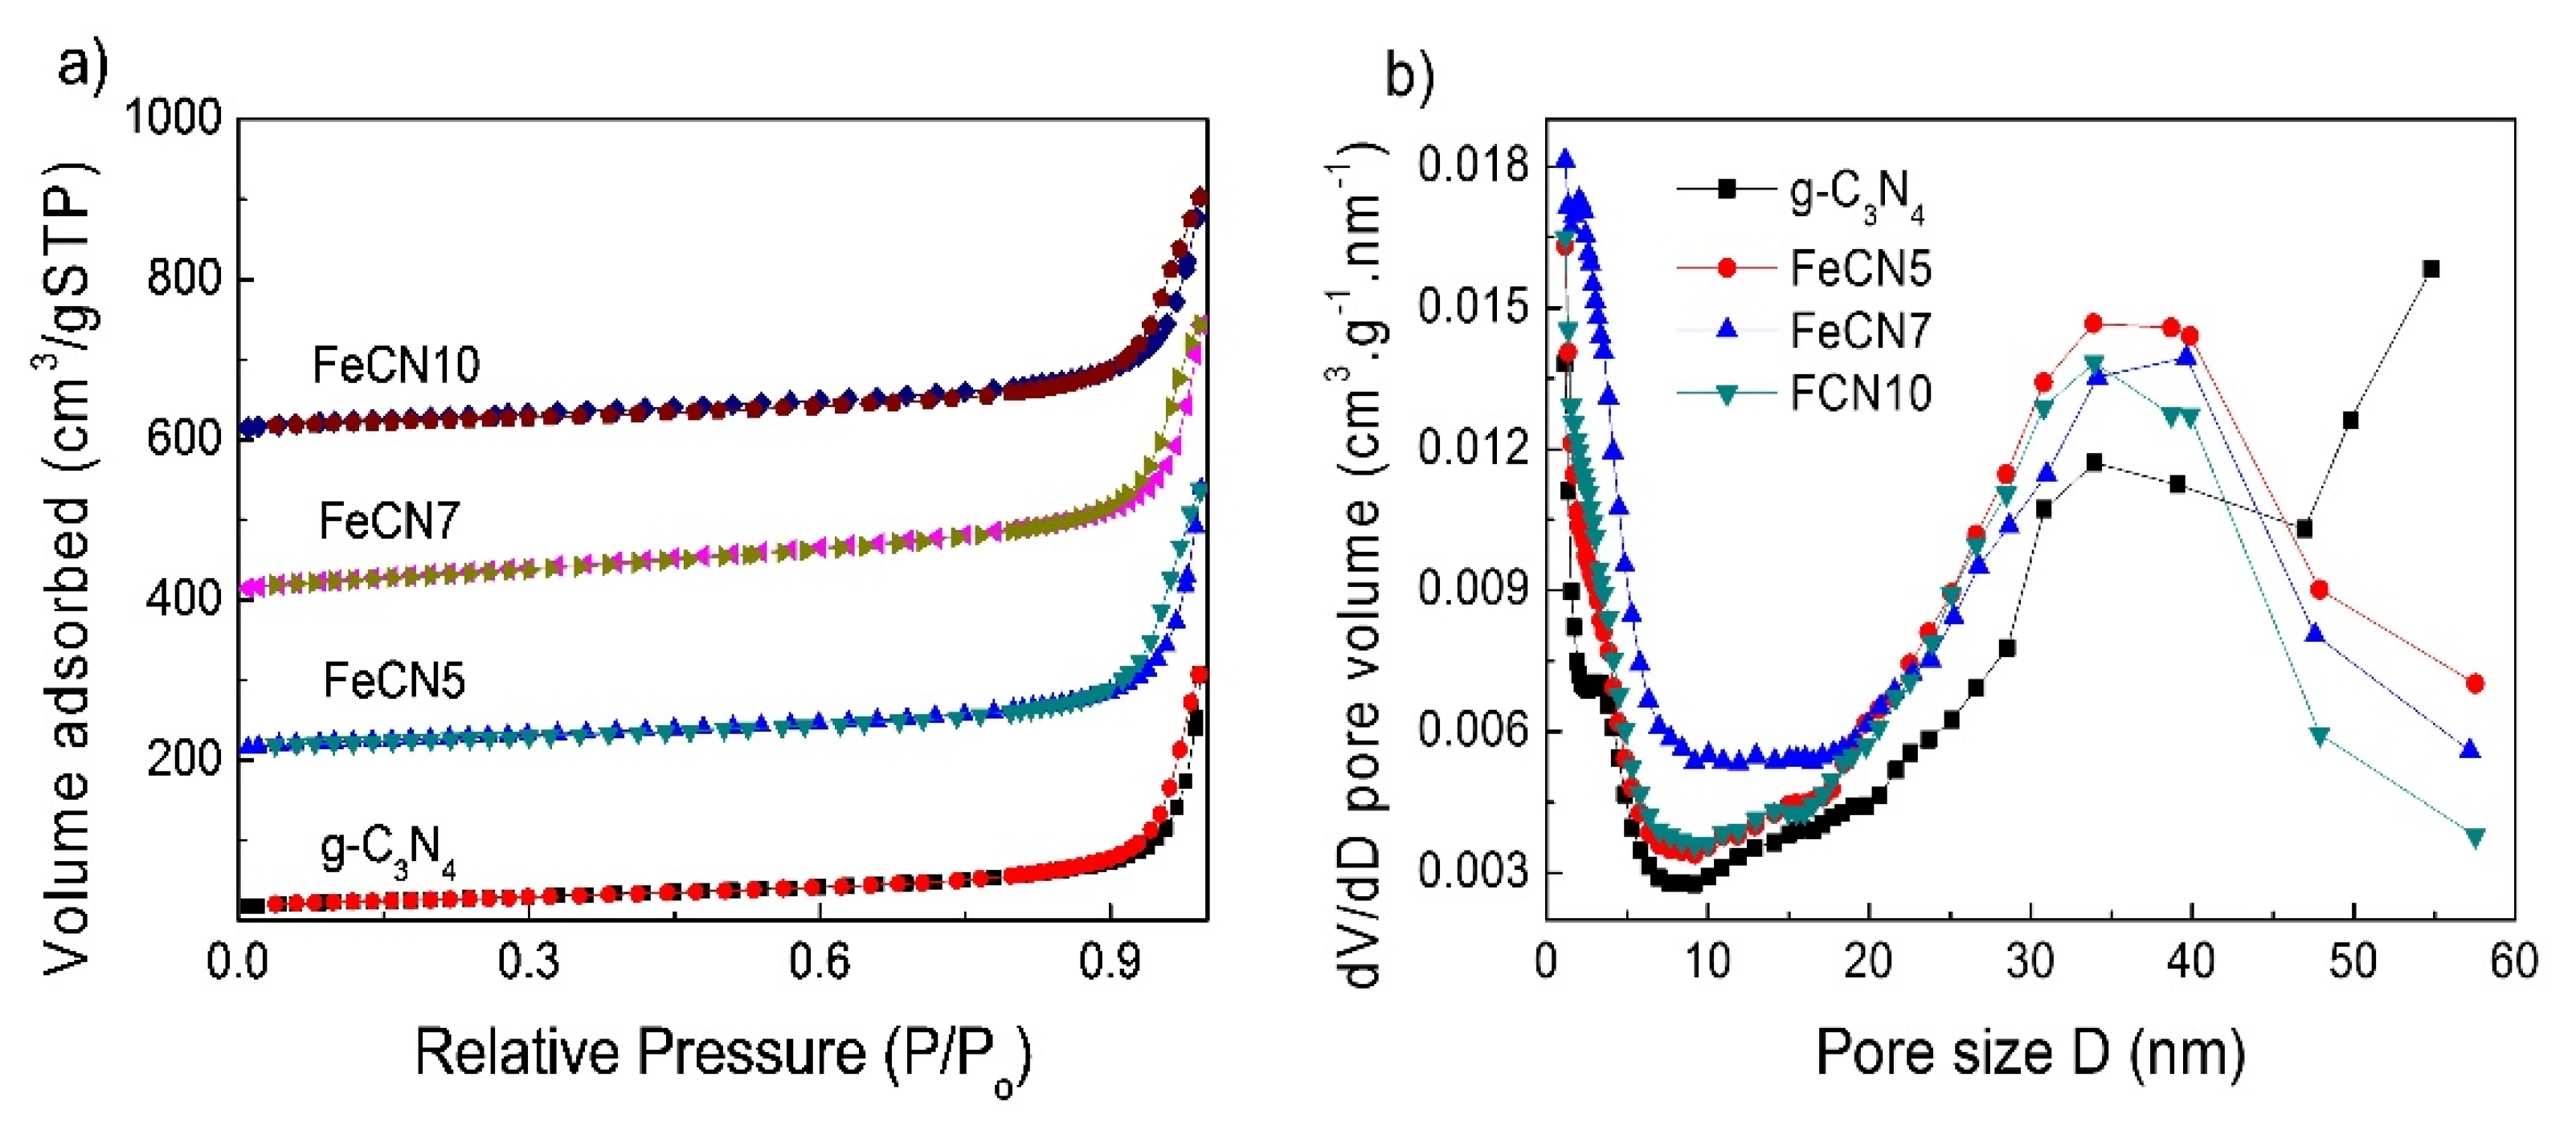
3.1. Structural Property Analysis

Figure 2a shows XRD patterns of Fe-doped g-C3N4 with different Fe concentrations which reveals the existence of three XRD peaks at 12.90°, 24.90° and 27.62°. This confirms that as-synthesized samples are graphitic carbon nitride with hexagonal structure (JCPDS card no. 87-1526) in which observed diffraction planes are (001), (101) and (002), respectively. Lattice parameters calculated from the position of XRD peaks are a = b = 4.96 Å and c = 6.46 Å (the interlayer stacking distance equals c/2 = 3.23 Å). All samples do not show any trace of Fe species within the detection limit of conventional XRD. In addition, (101) and (002) diffraction peaks slightly shift to the left side as Fe concentration increase (Figure 2b). Lattice parameters were calculated as (a = b = 4.97, c = 6.47) and (a = b = 4.98, c = 6.48) for FeCN3 and FeCN5 photocatalysts, respectively. The increase in lattice parameters reveals a certain lattice disorder of g-C3N4 as doping Fe, leading to a less dense packing fashion in crystal lattice. This change can be attributed to the interstitial doping configuration of large radius Fe ions in g-C3N4 by chemically coordinating with six lone-pair electron nitrogen atoms as shown in Figure 1, resulting in the lattice expansion.
Figure 3a displays Fourier transform infrared (FTIR) absorption spectra of pure g-C3N4 and Fe-doped g-C3N4 with different Fe concentrations. The broad absorption band at 3170 cm−1 could be assigned to the stretching vibrational modes of residual N–H components associated with uncompensated amino groups. The peak at 1638 cm−1 is indexed for stretching vibrational modes while bands at 1570, 1406, 1320 and 1240 cm−1 are associated with aromatic C–N stretching vibrations. The sharp characteristic peak at 814 cm−1 corresponds to the breathing mode of the s-triazine ring. The intensity of all peaks increases with increasing Fe content. The magnification of FTIR absorption (Figure 3b) peaks indicates the slight shift of 814 cm−1 peak towards the higher wavenumber as Fe content increases to 812.1, 813.4 and 813.9 cm−1 for g-C3N4, FeCN5 and FeCN7, respectively while the peaks at 1240 cm−1 and 1320 cm−1 almost do not change the position. This continues to reveal the influence of Fe-doping on g-C3N4 crystal lattice, albeit very small, leading to the slight expansion of the benzene ring as observed in XRD analysis.

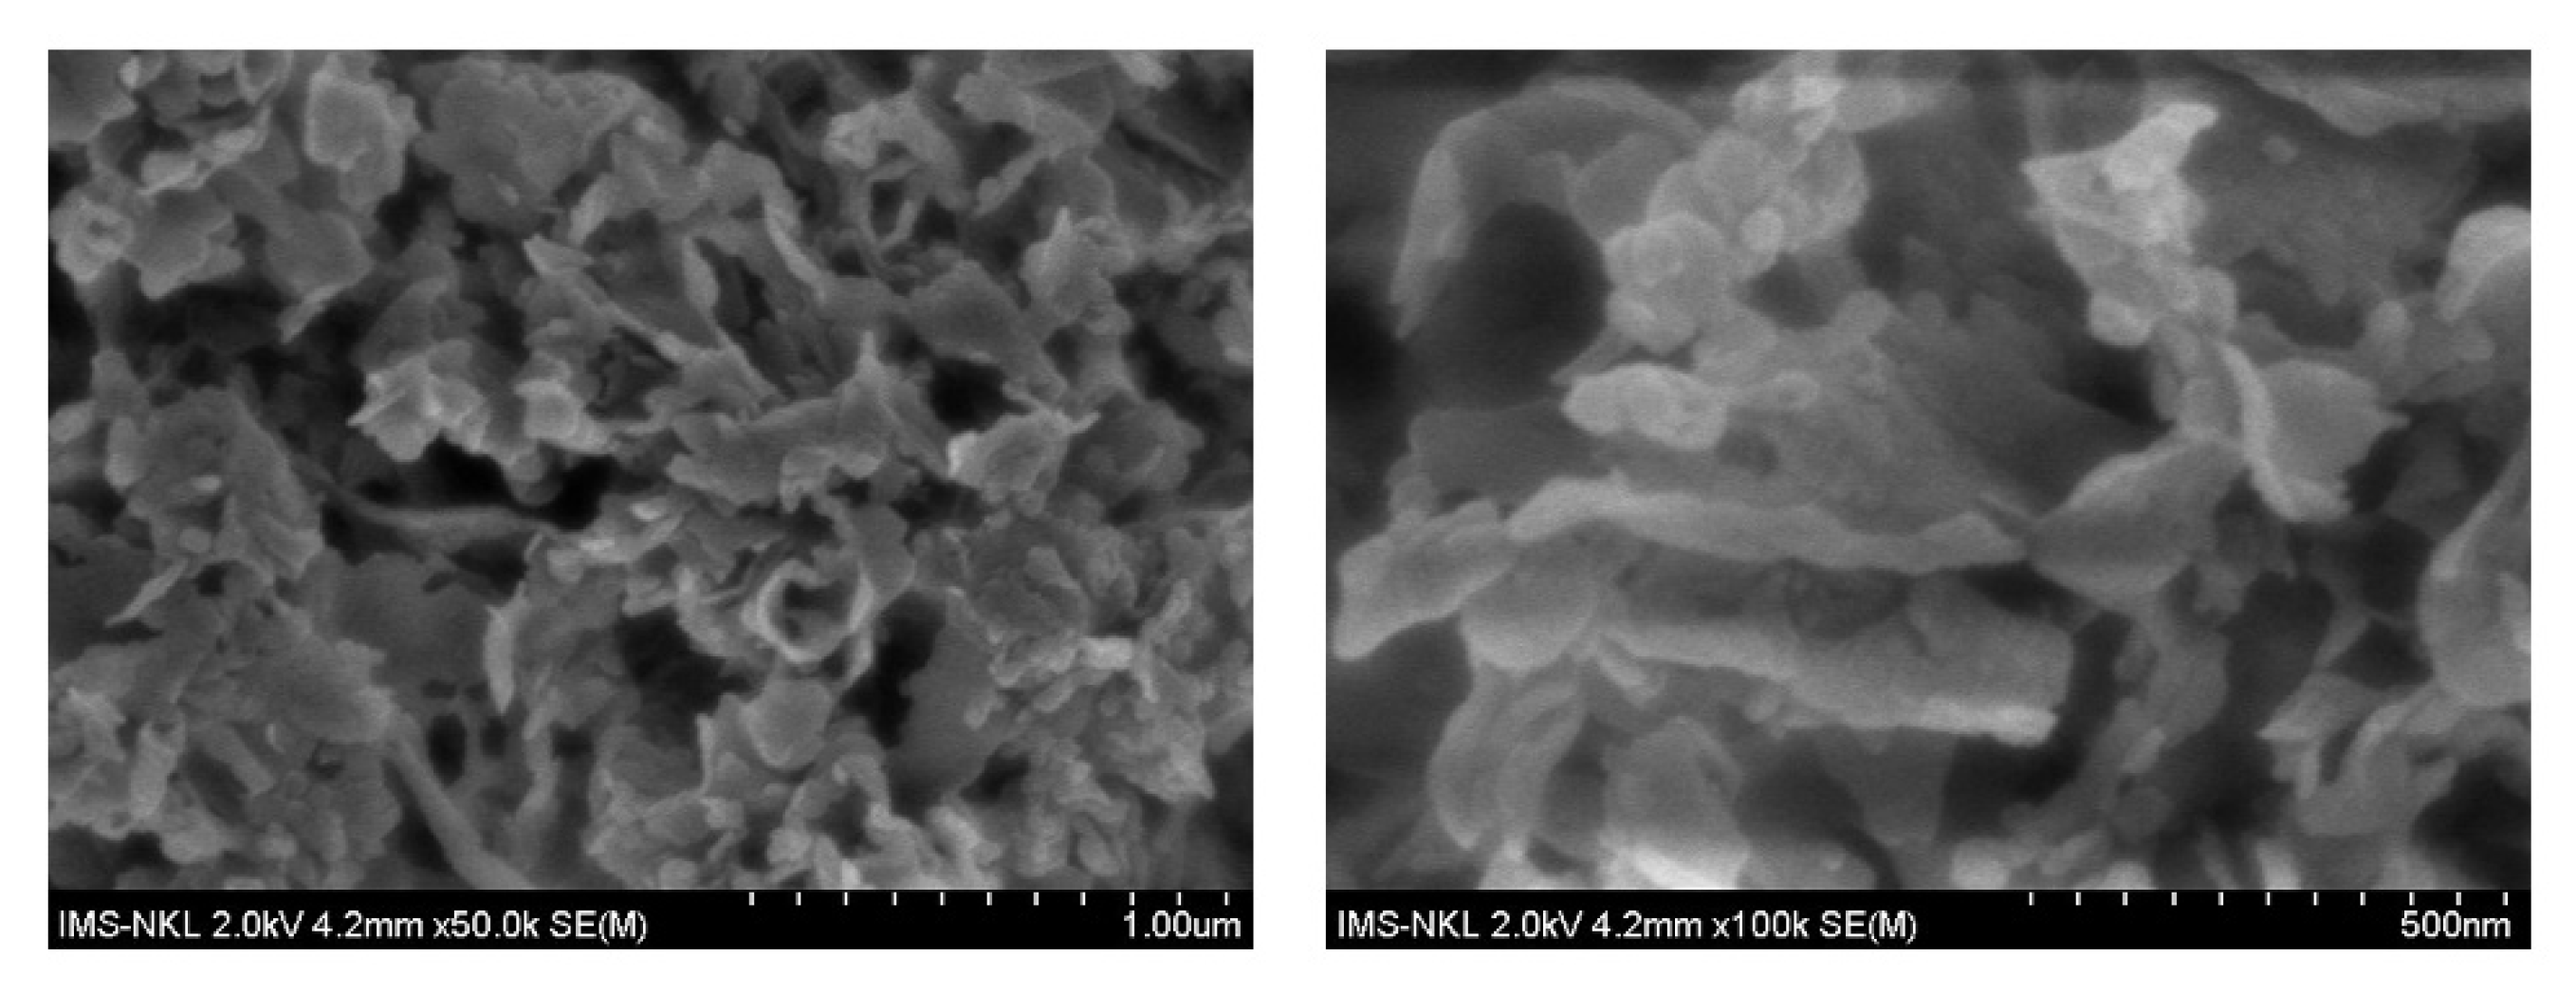
3.2. Morphology Analysis

Field emission scanning electron microscopy (FE-SEM) images of pure g-C3N4 sample are shown in Figure 4 which reveal the nanosheet morphology of as-synthesized g-C3N4 in air atmosphere. The nanosheets are very thin, about of 10 nm in thickness, ranging in width from several tens to several hundreds of nanometers. SEM images show that the sample has a high porosity, the nano sheets have a certain curvature, stacked on top of each other, creating the slit-shaped pores with several tens of nanometer in diameter which is convenient for contacting between photocatalyst and organic molecules in photocatalytic process.
Specific surface area and pore size distributions of pure g-C3N4, FeCN5, FeCN7 and FeCN10 photocatalysts were measured by nitrogen adsorption isotherm analysis (N2-absorbtion/desorption) and presented in Figure 5 and Table 1. Figure 5a shows that all samples have IV-type isotherm with H3 hysteresis loop of a mesoporous structure where slit shaped pores are created from non-uniform size and/or shape plates as g-C3N4 nanosheets [43]. High-pressure hysteresis loop with P/Po > 0.9 responses for macropores. The BET surface area is 91 m2/g, 100 m2/g, 132 m2/g and 104 m2/g for g-C3N4, FeCN5, FeCN7 and FeCN10, respectively, which indicates that specific surface area increases with the incorporation of Fe into g-C3N4 lattice. Since large specific surface area is benefit for photocatalytic activity, FeCN7 with largest BET surface area will be expected to have a high photocatalytic performance. All samples exhibit a wide range of pore size distribution (Figure 5b) and a large average pore width in the range of 35–40 nm.

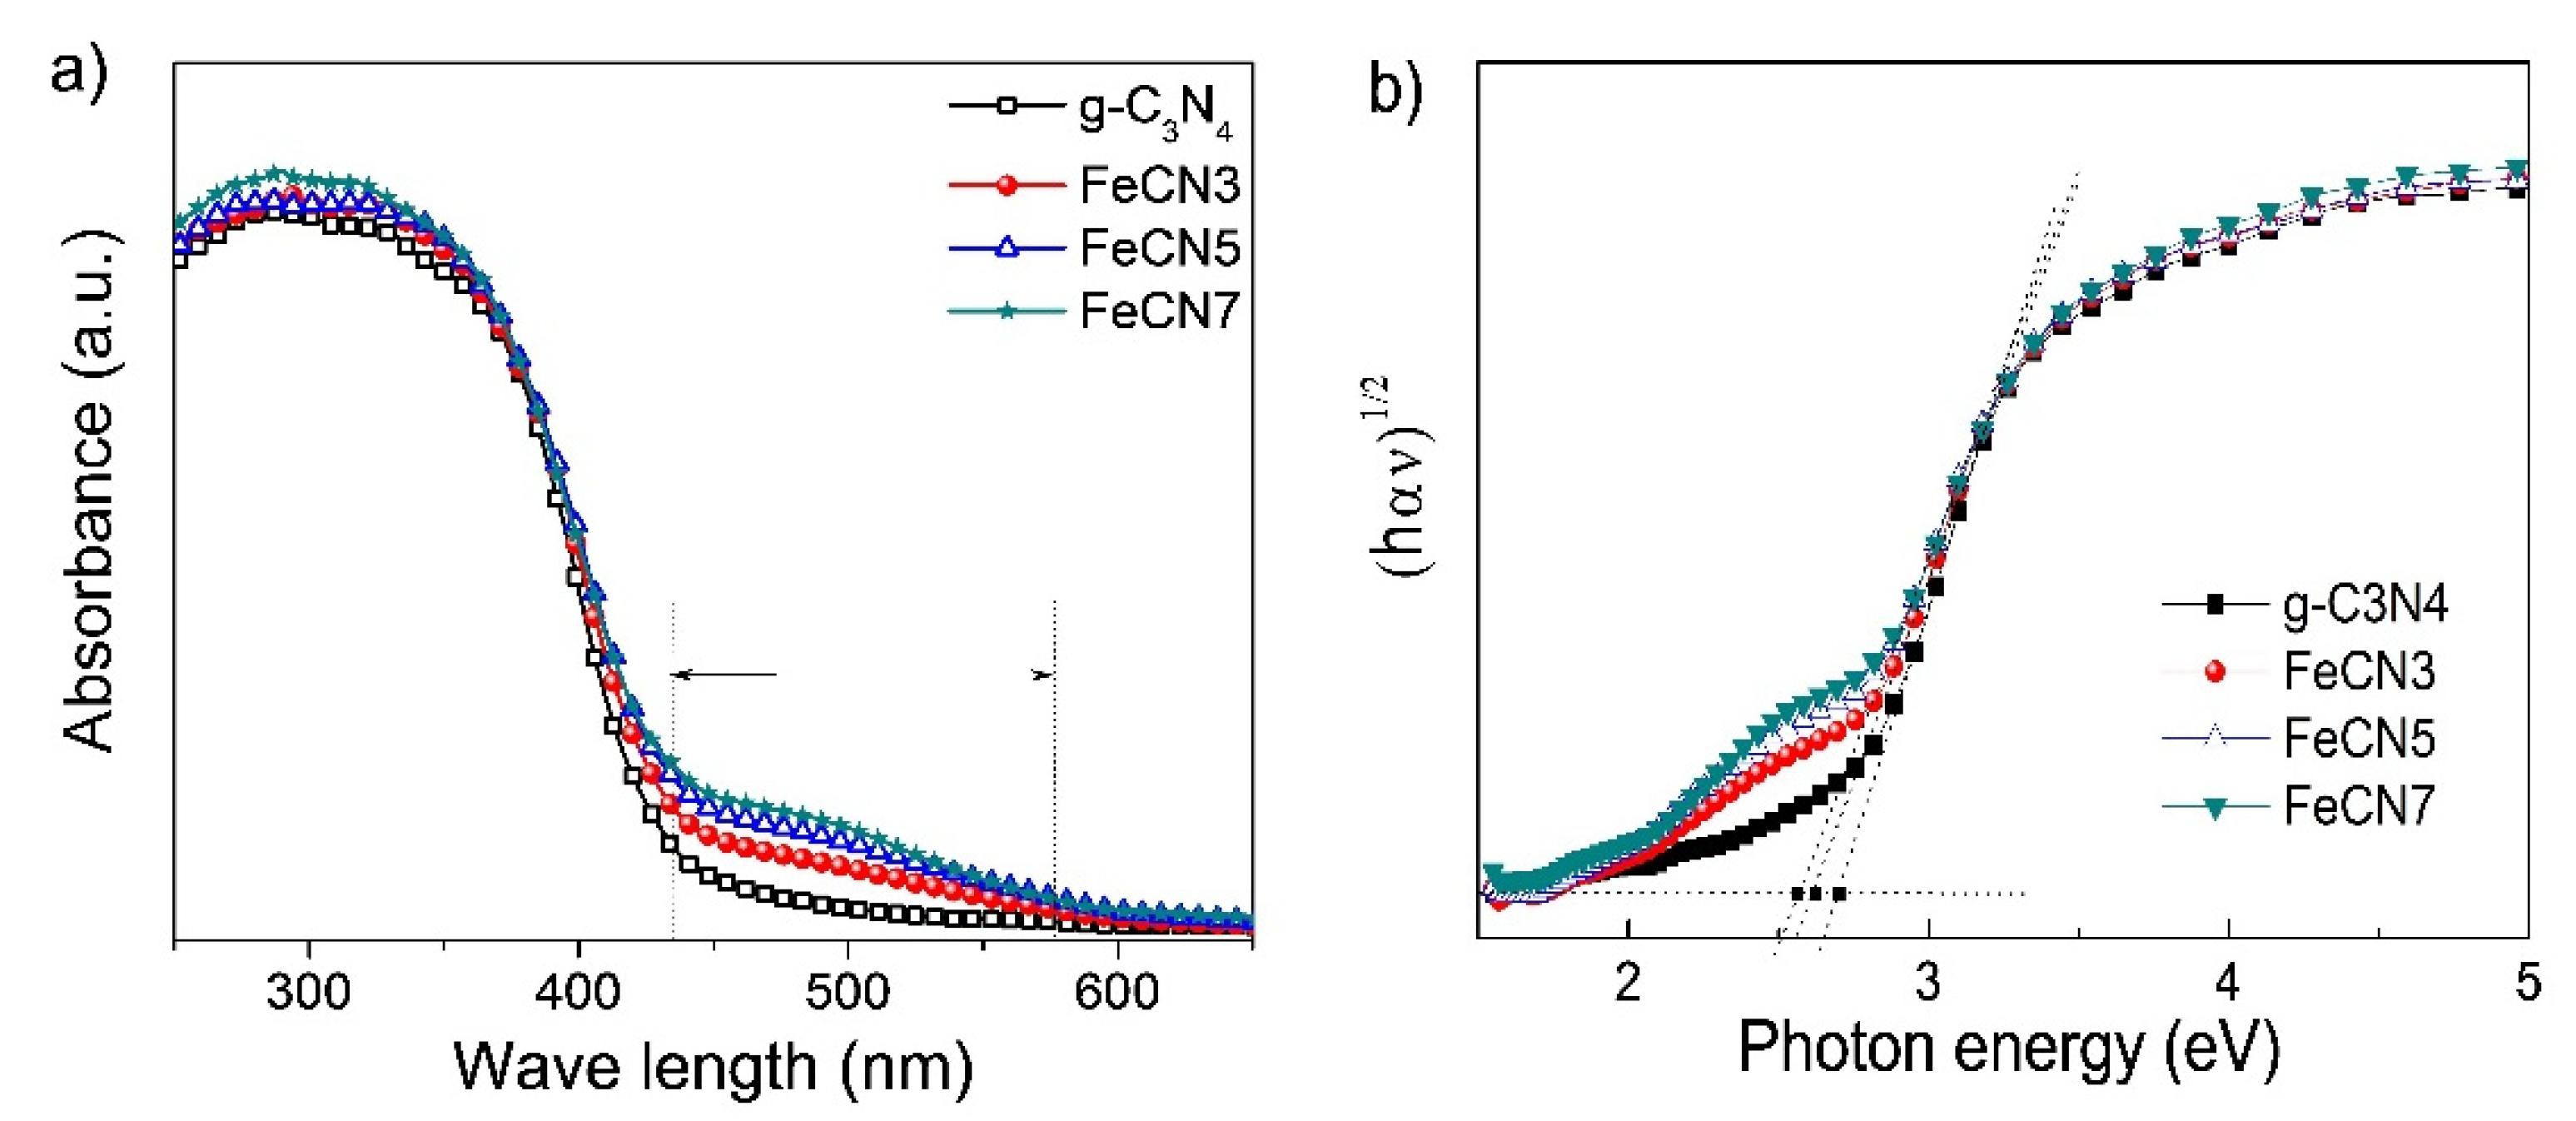
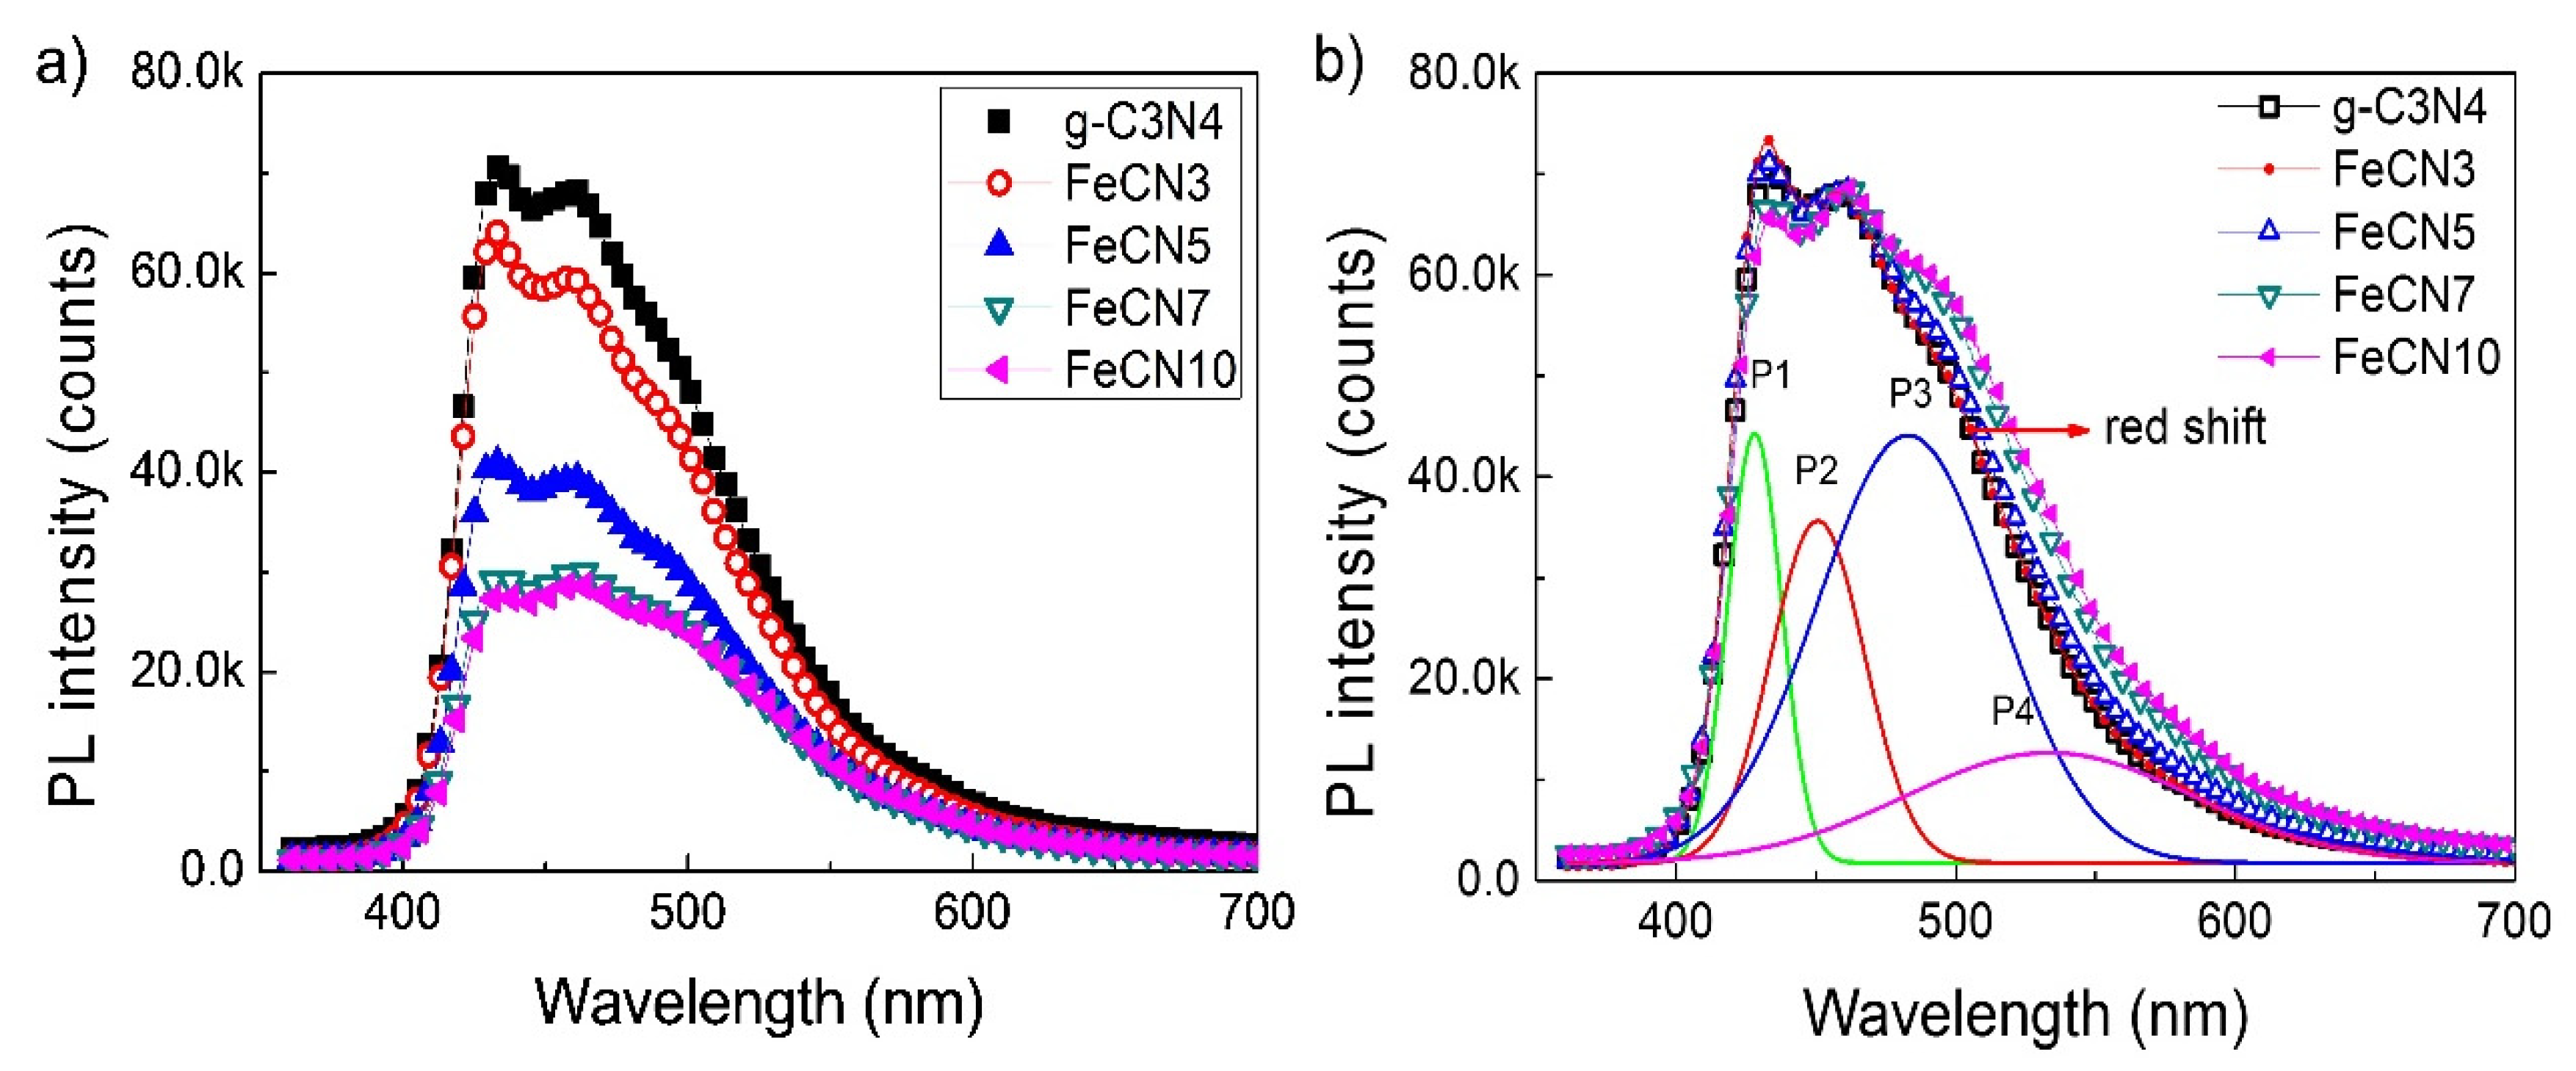
3.3. Optical Property Analysis

UV–Vis diffusion reflectance spectra (DRS) was used to evaluate the influence of Fe corporation on optical property and energy structure of host g-C3N4 material (Figure 6a). All samples display an absorption edge at about of 430 nm in wavelength, corresponding to an energy bandgap of 2.7 eV, which can be estimated by using Wood-Tauc plot on the graph of (αhυ)1/2 as a function of photon energy (hυ) as shown in Figure 6b. The difference between samples with different Fe concentrations is mainly at the long tail of absorption spectrum, in the range of 430-600 nm (the two-way arrow in Figure 6a). The absorbance of this tail increases gradually with increasing Fe content which can be explained appropriately due to the incorporation of Fe into the g-C3N4 lattice, resulting in the formation of impurity energy levels in the band gap. Therefore, electrons can absorb the photon and transfer between impurity energy level and conduction/valence band. In addition, Figure 6a also shows the slight red shift of absorption edge, resulting in a reduction of the calculated band gap from 2.7 eV for pure g-C3N4 to 2.63 eV for FeCN3 and 2.57 eV for FeCN5 samples.
In order to investigate the influence of Fe content on the separation behavior of electron-hole pairs in Fe-doped g-C3N4 nanosheets, PL spectra were carried out at room temperature using an excited wavelength at 350 nm (Figure 7a). All samples exhibit photoluminescence emission in the range of 400–600 nm which is consistent with the 430 nm absorption edge. It is obvious that PL intensity of Fe-doped gC3N4 sample decreases significantly compared to that of pure g-C3N4 nanosheets. Since the photoluminescence intensity reflects recombination rate of electron–hole pairs, the lower the PL intensity is, the higher the recombination rate is, the sharp decrease in PL intensity as observed indirectly indicates the high separation efficiency of electron–hole pairs which is essential for improving photocatalytic performance. The cause of the reduction in electron–hole pair recombination rate can be attributed to the presence of Fe2+/Fe3+ ions in g-C3N4 crystal lattice which acts as electron capture centers. As it is excited, electron receives energy from a photon and transfers from the top of the valence band to the bottom of the conduction band to become a free electron which then easily hop to impurity level of Fe3+ due to its position at the middle of the bandgap. As a result, the lifetime of electron-hole pair increases that benefits for photocatalytic performance. Gaussian fitting has been carried out to identify the constituent PL peaks, which shows four major PL centers, including P1 (428 nm, 2.90 eV), P2 (451 nm, 2.75 eV), P3 (483 nm, 2.57 eV), P4 (533 nm, 2.33 eV) (Figure 7b), in accordance with those of previous g-C3N4 synthesized in Ar atmosphere [44]. As the Fe-doping content increases, the PL band extents slightly towards longer wavelength as shown by horizontal arrow in Figure 7b (Table 2). For example, peak P4 shifts from 533 nm to 534 nm, 436 nm, 540 and 542 nm for g-C3N4, FeCN3, FeCN5, FeCN7 and FeCN10 samples, respectively, which agrees well with the red shift of absorption edge in Figure 6a. This observation once again identifies certain influence of Fe impurity on the crystal structure and hence optical properties of g-C3N4 nanosheets.

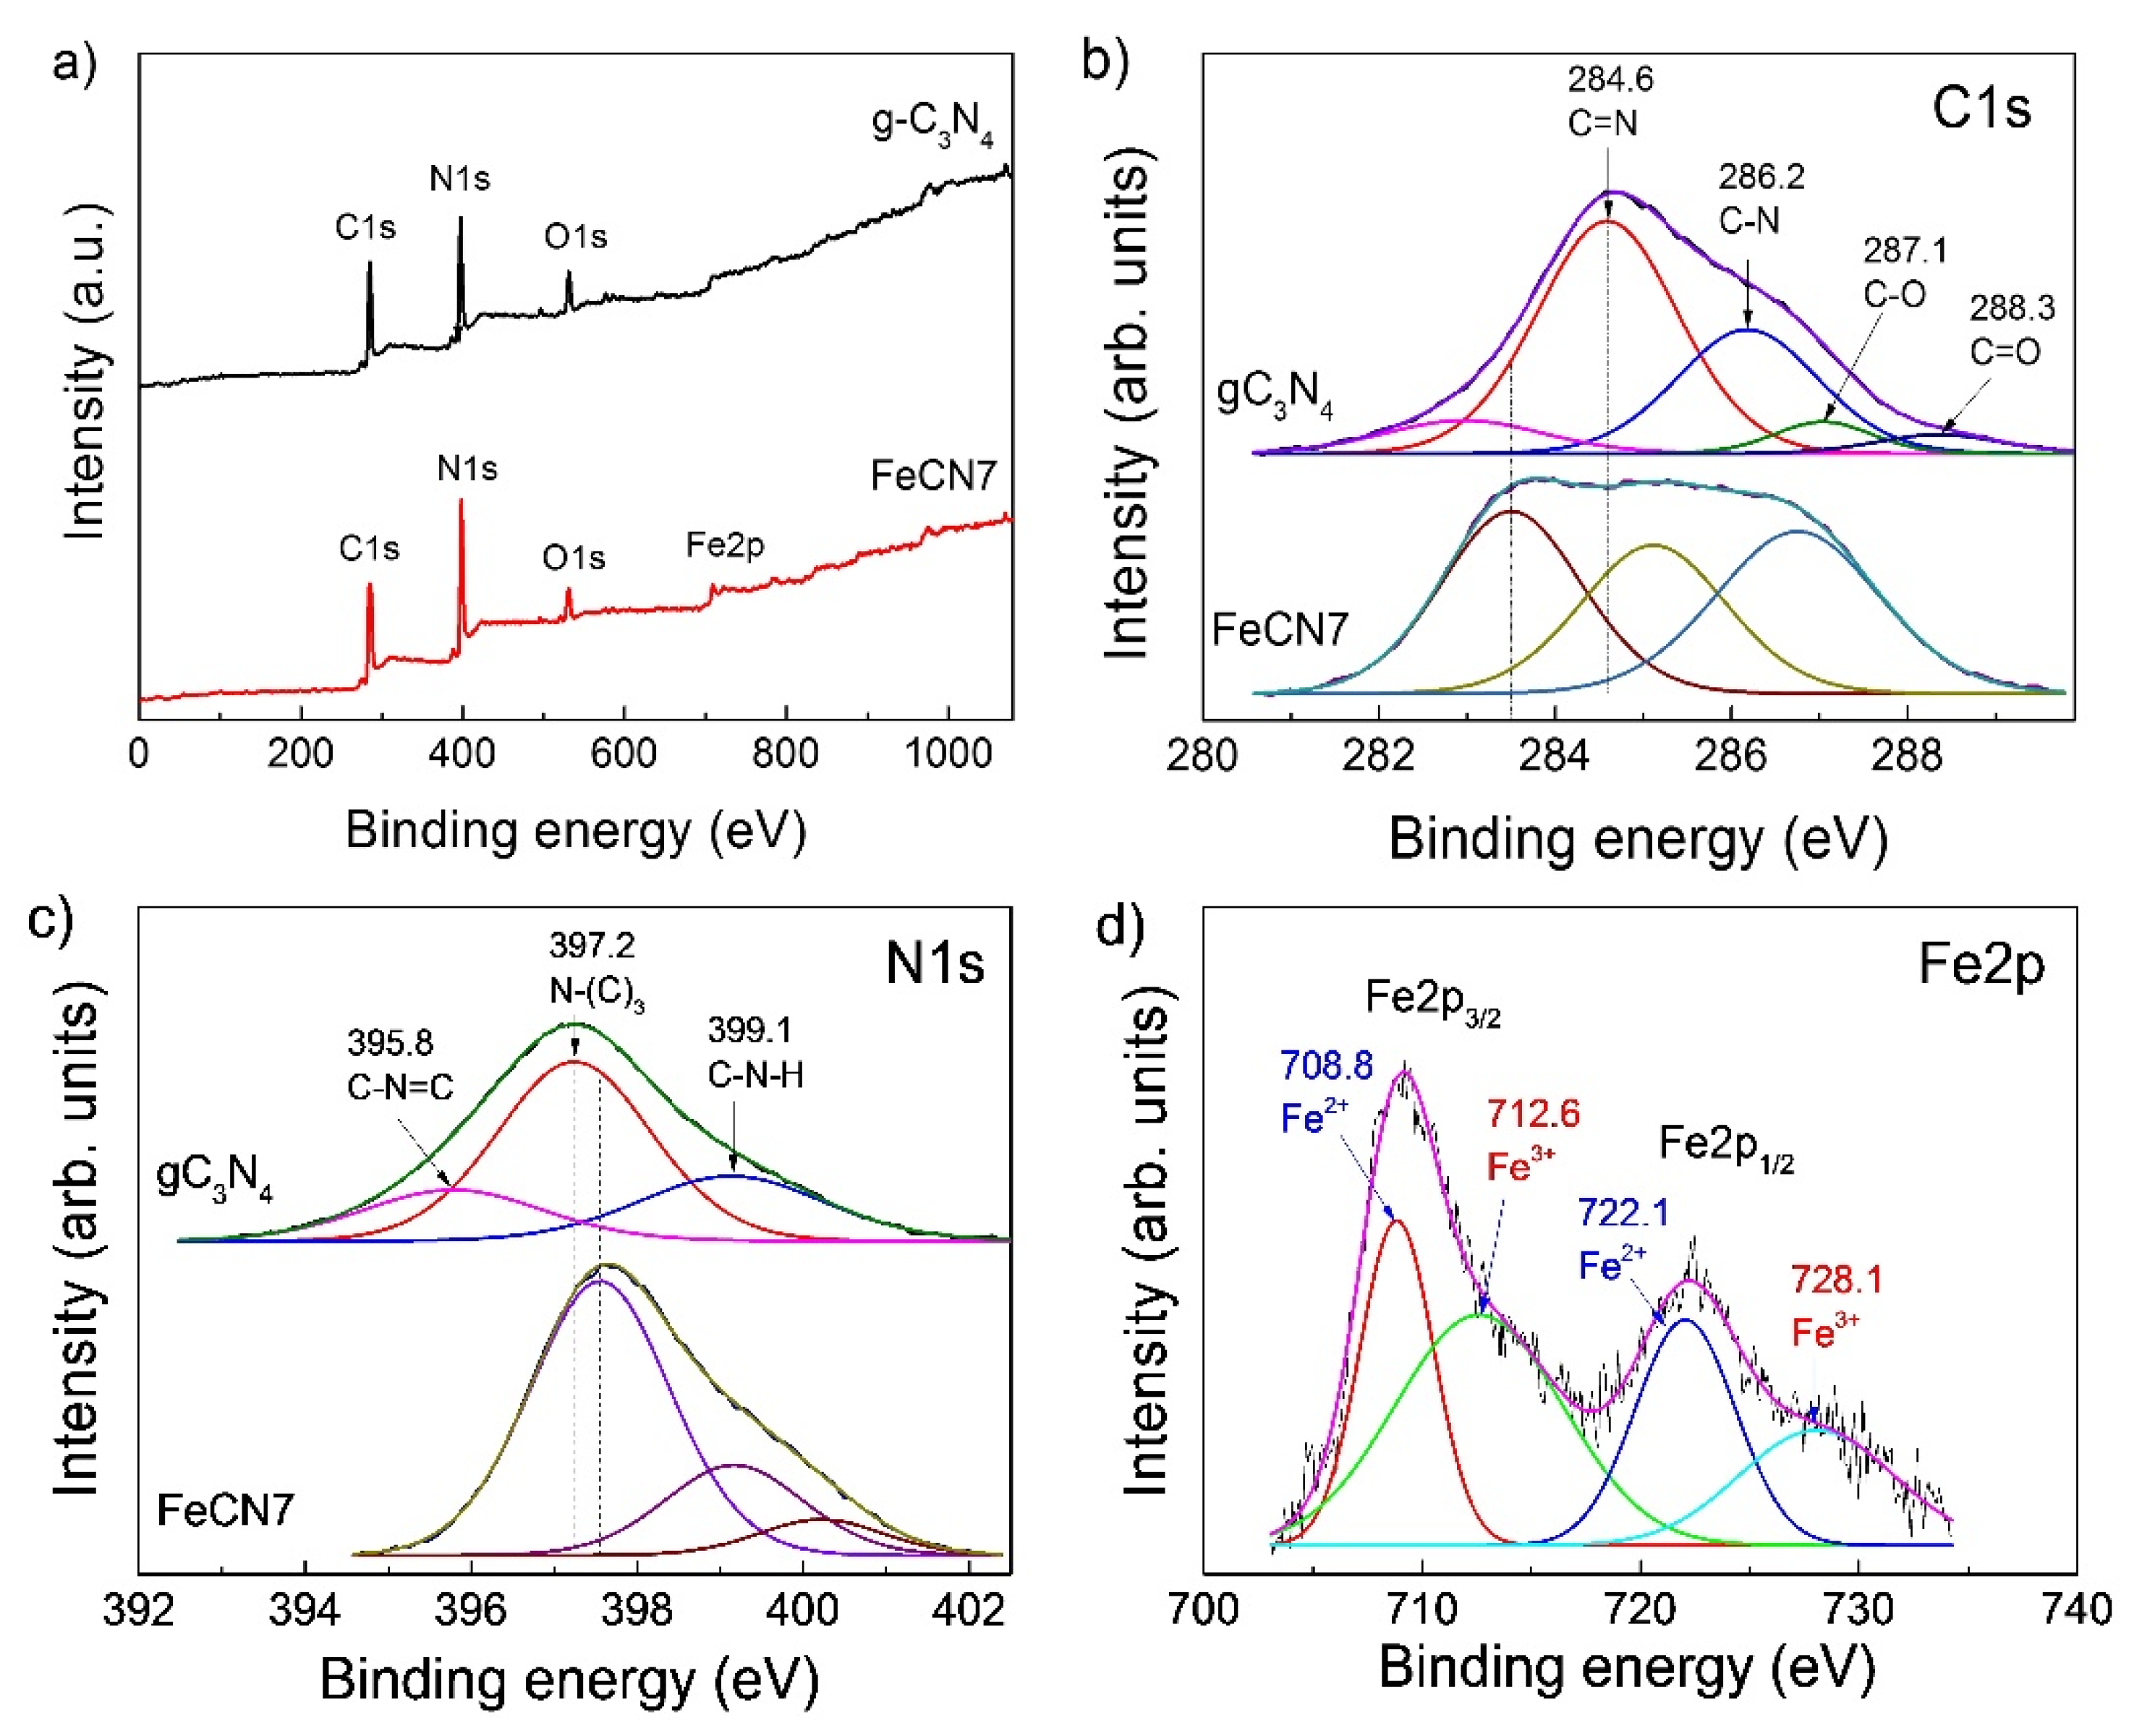
3.4. Chemical Composition Analysis

Chemical composition of Fe-doped g-C3N4 nanosheets and their electronic energy states were determined using X-ray photoelectron spectroscopy (XPS). Figure 8a presents the survey scan XPS spectra of pure g-C3N4 and FeCN7 samples which shows that g-C3N4 nanosheet exhibits characteristic peaks of C, N and O respectively at 284 eV, 397 eV and 532 eV while FeCN7 photocatalyst displays one more sharp photoelectron peak at about 710 eV. The high resolution of C1s XPS spectrum is shown in Figure 8b. C1s XPS spectrum of g-C3N4 nanosheet contains four sub-peaks at binding energy of 284.6 eV, 286.2 eV, 287.1 eV and 288.3 eV which are assigned to C=N sp2, C–N sp3, C–O and C=O bonding, respectively [45,46]. These XPS peaks shift to lower binding energy as embedding Fe3+ into host crystal (as shown by dash vertical lines in Figure 8b). Figure 8c displays high resolution of N1s XPS spectrum of pure g-C3N4 and FeCN7 which is separated into three sub-peaks at 395.8 eV, 397.2 eV and 399.1 eV. These peaks can be assigned to C1s states in C–N=C, N–(C)3 and C–N–H bonding. In contrast to C1s XPS spectrum, N1s XPS peaks slightly shift towards to higher energy binding, indirectly indicating that Fe3+ ion binds to N atom rather than C atom as doped into g-C3N4 (Figure 1). The presence of Fe3+ ions on the surface of g-C3N4 nanosheets is also verified by high resolution XPS spectrum in binding energy region of 700–740 eV. Two main peaks at 709 eV and 722 eV correspond to multiplet splitting of high spin Fe2p1/2 and Fe2p3/2 which in turn are separated into two sub-peaks at (708.8 eV, 712.6 eV) and (722.1 eV, 728.1 eV) due to the difference in oxidation states of Fe (Fe2+ and Fe3+) as shown in Figure 8d. The ratio of oxidation state Fe3+:Fe2+ can be estimated at 62:38 for FeCN7 photocatalyst.

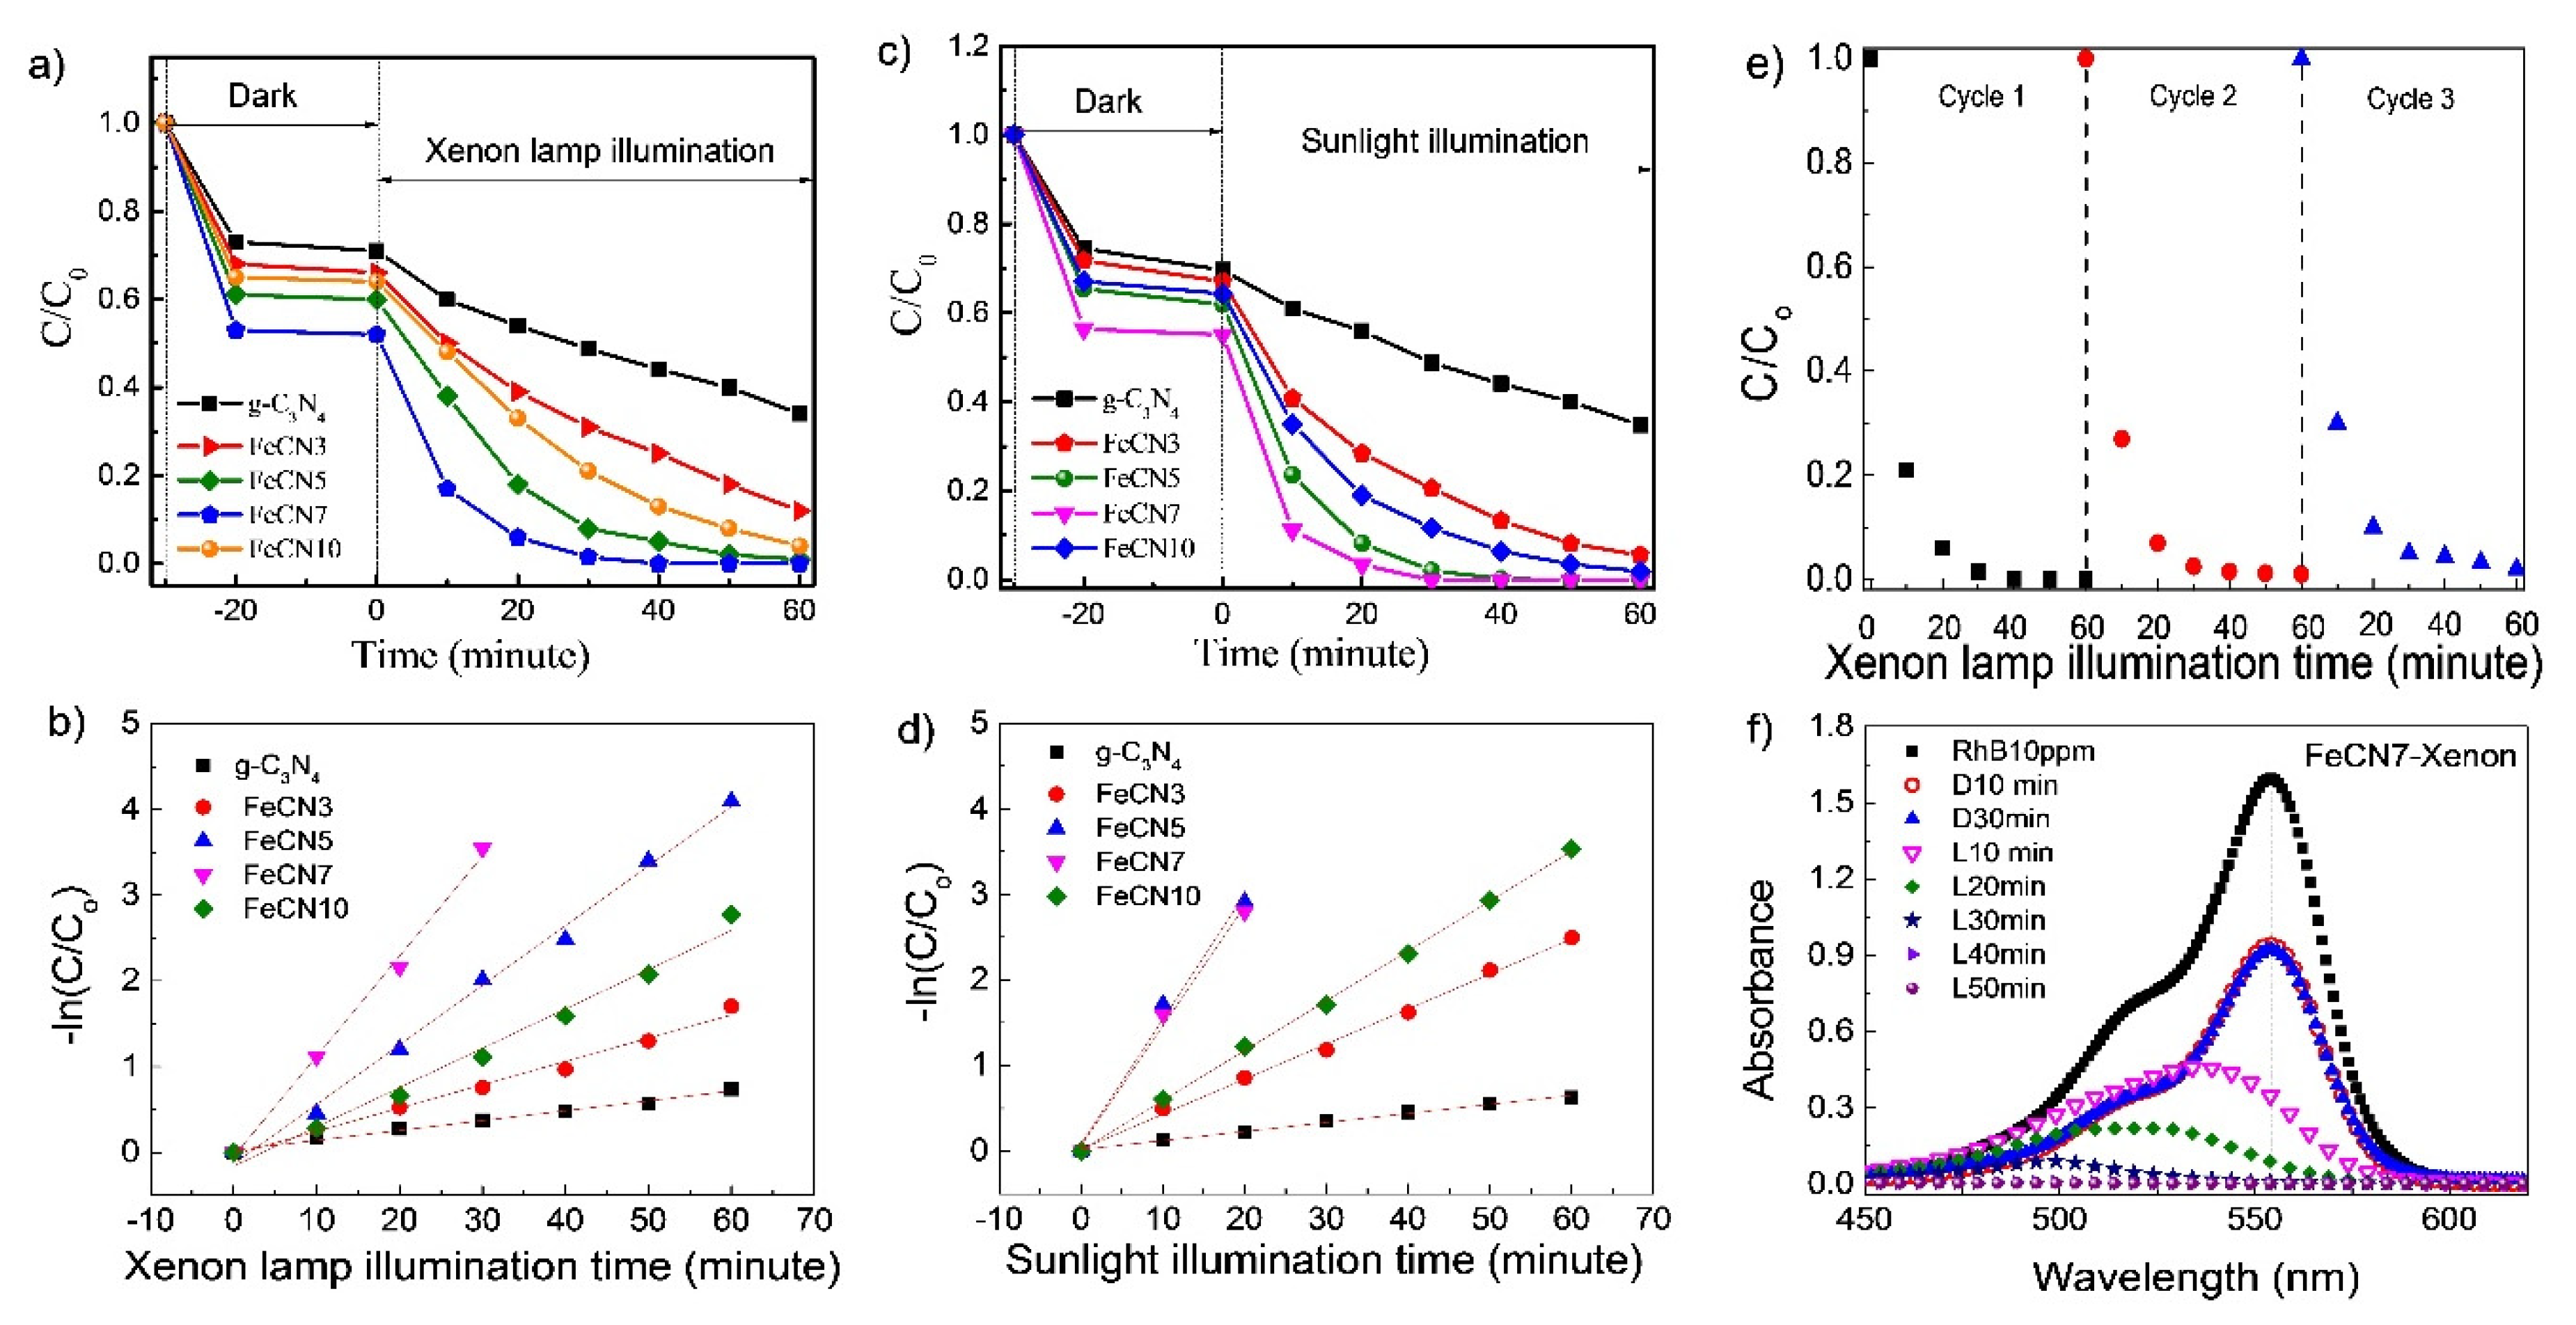
3.5. Photocatalytic Activity Analysis

Photocatalytic performance of the synthesized Fe-doped g-C3N4 for degradation of RhB under xenon lamp illumination (illuminance Ev~2500 lx) is shown in Figure 9a. The results indicate that adsorption-desorption equilibrium can be achieved after less than 10 min of stirring in the dark for all samples. After 30 min of stirring in dark, FeCN7 shows the strongest adsorption capacity, reducing RhB concentration by 43%. This can be explained reasonably by the largest specific surface area of FeCN7 as analyzed in BET result. With the presence of pure g-C3N4 photocatalyst, the degradation of RhB under xenon light irradiation is only of 60% after 60 min of xenon lamp illumination while the photocatalytic performance of Fe-doped g-C3N4 is improved obviously. The degradation conversion of RhB by Fe-doped g-C3N4 photocatalyst increases gradually with Fe-doping content, reaches the highest value for FeCN7 and then decreases with further increase of Fe content. Almost 100% of RhB is decomposed after 30 min of xenon lamp exposure for FeCN7 sample. The pseudo-first-order kinetic model is used to determine photocatalytic reaction rate, ln(Co/C) = kt, where the rate constant k can be achieved from the slope of the linear relationship of the plot ln(Co/C) versus reaction time (Figure 9b). The catalyst FeCN7 exhibits the largest reaction rate constant (k~0.117), which is about ten times greater than that of pure g-C3N4 (k~0.012). To demonstrate the ability to use sunlight during photocatalytic processes of Fe-doped g-C3N4 nanosheets, photocatalytic performance under sunlight illumination (illuminance Ev~7500 lx) was carried out and presented in Figure 9c,d. This also reveals the strongest photocatalytic performance of FeCN7 sample with reaction rate k~0.140, thirteen times larger than that of pure g-C3N4 nanosheet. This suggests the potential of g-C3N4-modified photocatalysts in green technique, utilizing and converting solar energy into other forms.
In order to check the reusability of as-prepared Fe-doped g-C3N4 photocatalyst, the recycling test under xenon lamp illumination was carried out for FeCN7 sample as shown in Figure 9e. It is obvious that as-synthesized Fe-doped well remained photocatalytic performance or possesses good stability, the photodegradation percentage of RhB is >95% after three cycles. Figure 9f shows the temporal evolution of RhB absorption spectrum under xenon lamp irradiation for FeCN7 sample. Besides the significant decrease in the absorbance of RhB over time, the blue shift of the wavelength of absorption maximum was also observed as illuminated by a xenon lamp, which reveals the deethylation of RhB, occurring on the surface of the photocatalyst. It is well known that the blue shift is due to the absorption maxima of intermediate products of RhB deethylation process—RhB (554 nm); N,N,N′-Triethyl-rhodamine (539 nm); N,N′-Diethyl-rhodamine (522 nm); N-Ethyl-rhodamine (510 nm) and finally rhodamine (497 nm) [47,48]. In this case, the blue shift together with the sharp decrease of absorption maxima indicates that there are two photodegradation pathways for RhB coexist and compete—(i) cleavage of the whole conjugated chromophore structure and (ii) N-deethylation.
It is well known that the highest occupied molecular orbital (HOMO) is distributed on N2 atoms and the lowest unoccupied molecular orbital (LUMO) is located at C and N2 atoms [28,49], photo-generated electrons are difficult to transfer between different heptazine units in g-C3N4 crystal lattice, resulting to a high recombination rate of electron-hole pairs and limited photocatalytic efficiency. Fe-doping into crystal lattice of g-C3N4 in interstitial configuration created Fe3+ electron-trapped centers which keep important role in photocatalytic activity. Therefore, the mechanism of enhancing RhB decomposition can be explained by the contribution of electron transfer processes (Figure 1) as follows—(i) An electron in valence band absorbs a photon to transfer to conduction band, becoming a free electron and leaving positively charged hole in the valence band. Both electron and hole are free charge carriers and can take part in redox reaction to decompose organic chemical. (ii) Highly oxidized Fe3+ ion traps photogenerated electron from N2 and C atoms, leading to the longer lifetime of positive charge holes which can oxidize OH into OH. (iii) After trapping electron, Fe3+ ion becomes Fe2+ itself can reduce O2 into O2•− and transform to Fe3+. The consequence of this is a low recombination rate of photogenerated electron-hole pairs as demonstrated by PL results. (iv) A part of electrons on Fe2+ energy states easily absorb photon in visible range to transfer to conduction band which can reduce O2 into O2•− and leaving highly oxidized Fe3+ ion (Figure 1). This is manifested in the absorption spectra where absorbance increases gradually in the range of 430–600 nm when Fe concentration increases. The enhancement in photocatalytic activity is also supported by the BET measurement which indicates that the specific surface area and pore volume is largest for FeCN7 photocatalyst.

4. Conclusions

Fe impurity has been successfully doped into crystal lattice of g-C3N4 nanosheets in interstitial doping configuration. The incorporation of Fe ions into g-C3N4 resulted in a slight expansion of crystal lattice, a reduction in energy band gap, an increase in specific surface area and a decrease in photoluminescence intensity. In addition, the analysis showed that Fe impurity existed in g-C3N4 nanosheets under two different oxidation states Fe2+ and/or Fe3+ which can be considered as the main causes leading to the reduction of photoluminescence and the enhancement of photocatalytic activity. Fe-doped g-C3N4 nanosheets exhibited superior photocatalytic performance compared to pure g-C3N4. In particular, g-C3N4 nanosheet doped with 7 mol% Fe exhibited strongest photocatalytic activity with reaction rate 10 times higher than that of pure sample, decomposed almost 100% RhB 10ppm solution after 30 min of xenon lamp illumination. A similar result was achieved when decomposing RhB using Fe-doped g-C3N4 photocatalyst under sunlight, FeCN7 photocatalyst decomposed almost 100% RhB after 30 min, 14 times faster than pure sample, indicating the potential of g-C3N4 modified photocatalyst in energy conversion field.

Author Contributions

Methodology and experiment, H.L.T., C.P.M.; formal analysis, D.P.T.; investigation, C.P.D., B.D.D.; writing—original draft preparation, O.L.T.M., H.N.M.; writing—review and editing, O.L.T.M., M.N.V.; supervision, M.N.V. All authors have read and agreed to the published version of the manuscript.

Funding

This research was funded by a scientific and technological project at the level of Ministry of Education, grand number B2018-SPH-06-CTrVL.

Conflicts of Interest

The authors declare no conflict of interest.

References

  1. Höök, M.; Tang, X. Depletion of Fossil Fuels and Anthropogenic Climate Change—A Review. Energy Policy 2013, 52, 797–809. [Google Scholar] [CrossRef] [Green Version]
  2. Capellán-Pérez, I.; Mediavilla, M.; de Castro, C.; Carpintero, Ó.; Miguel, L.J. Fossil Fuel Depletion and Socio-Economic Scenarios: An Integrated Approach. Energy 2014, 77, 641–666. [Google Scholar] [CrossRef]
  3. Abas, N.; Kalair, A.; Khan, N. Review of Fossil Fuels and Future Energy Technologies. Futures 2015, 69, 31–49. [Google Scholar] [CrossRef]
  4. Hoffmann, M.R.; Martin, S.T.; Choi, W.; Bahnemann, D.W. Environmental Applications of Semiconductor Photocatalysis. Chem. Rev. 1995, 95, 69–96. [Google Scholar] [CrossRef]
  5. Mills, A.; Hunte, S.L. An Overview of Semiconductor Photocatalysis. J. Photochem. Photobiol. A Chem. 1998, 108, 1–35. [Google Scholar] [CrossRef]
  6. Sharma, A.; Ahmad, J.; Flora, S.J.S. Application of Advanced Oxidation Processes and Toxicity Assessment of Transformation Products. Environ. Res. 2018, 167, 223–233. [Google Scholar] [CrossRef]
  7. Jimenez, S.; Andreozzi, M.; Mico, M.M.; Alvarez, M.G.; Contreras, S. Produced Water Treatment by Advanced Oxidation Processes. Sci. Total Environ. 2019, 666, 12–21. [Google Scholar] [CrossRef]
  8. Deng, Y.; Zhao, R. Advanced Oxidation Processes (AOPs) in Wastewater Treatment. Curr. Pollut. Rep. 2015, 1, 167–176. [Google Scholar] [CrossRef] [Green Version]
  9. Machulek, A.; Dantas, R.F.; GIMÉNEZ, J.; Oliveira, M.R.; Oliveira, S.L.; de Oliveira, S.; ARAKAKI, A.; de Oliveira, L.C.S.; Casagrande, G.A.; Martines, M.A.U. Environmental Applications of Semiconductor Photocatalysis for Reducing Pollution. In Environmental Science and Engineering: Industrial Processing and Nanotechnology; Studium Press LLC: Houston, TX, USA, 2017. [Google Scholar]
  10. Xu, C.; Anusuyadevi, P.R.; Aymonier, C.; Luquecd, R.; Marre, S. Nanostructured Materials for Photocatalysis. Chem. Soc. Rev. 2019, 48, 3868–3902. [Google Scholar] [CrossRef]
  11. Ibhadon, A.; Fitzpatrick, P. Heterogeneous Photocatalysis: Recent Advances and Applications. Catalysts 2013, 3, 189–218. [Google Scholar] [CrossRef] [Green Version]
  12. Herrmann, J.-M. Heterogeneous Photocatalysis: Fundamentals and Applications to the Removal of Various Types of Aqueous Pollutants. Catal. Today 1999, 53, 115–129. [Google Scholar] [CrossRef]
  13. Gangu, K.K.; Maddila, S.; Jonnalagadda, S.B. A Review on Novel Composites of MWCNTs Mediated Semiconducting Materials as Photocatalysts in Water Treatment. Sci. Total Environ. 2019, 646, 1398–1412. [Google Scholar] [CrossRef]
  14. Luceno-Sanchez, J.A.; Diez-Pascual, A.M.; Pena Capilla, R. Materials for Photovoltaics: State of Art and Recent Developments. Int. J. Mol. Sci. 2019, 20, 976. [Google Scholar] [CrossRef] [Green Version]
  15. Ni, M.; Leung, M.K.H.; Leung, D.Y.C.; Sumathy, K. A Review and Recent Developments in Photocatalytic Water-Splitting Using TiO2 for Hydrogen Production. Renew. Sustain. Energy Rev. 2007, 11, 401–425. [Google Scholar] [CrossRef]
  16. Chen, C.; Zhao, D.; Zhou, Q.; Wu, Y.; Zhou, X.; Wang, H. Facile Preparation and Characterization of Polyaniline and CeO2 Co-Decorated TiO2 Nanotube Array and Its Highly Efficient Photoelectrocatalytic Activity. Nanoscale Res. Lett. 2019, 14, 60. [Google Scholar] [CrossRef] [PubMed] [Green Version]
  17. Shi, J.; Guo, L. ABO3-Based Photocatalysts for Water Splitting. Prog. Nat. Sci. Mater. Int. 2012, 22, 592–615. [Google Scholar] [CrossRef] [Green Version]
  18. Zeng, S.; Kar, P.; Thakur, U.K.; Shankar, K. A Review on Photocatalytic CO2 Reduction Using Perovskite Oxide Nanomaterials. Nanotechnology 2018, 29, 052001. [Google Scholar] [CrossRef]
  19. Zhu, J.; Li, H.; Zhong, L.; Xiao, P.; Xu, X.; Yang, X.; Zhao, Z.; Li, J. Perovskite Oxides: Preparation, Characterizations, and Applications in Heterogeneous Catalysis. ACS Catal. 2014, 4, 2917–2940. [Google Scholar] [CrossRef]
  20. Labhasetwar, N.; Saravanan, G.; Kumar Megarajan, S.; Manwar, N.; Khobragade, R.; Doggali, P.; Grasset, F. Perovskite-Type Catalytic Materials for Environmental Applications. Sci. Technol. Adv. Mater. 2015, 16, 036002. [Google Scholar] [CrossRef] [PubMed]
  21. Kegel, J.; Povey, I.M.; Pemble, M.E. Zinc Oxide for Solar Water Splitting: A Brief Review of the Material’s Challenges and Associated Opportunities. Nano Energy 2018, 54, 409–428. [Google Scholar] [CrossRef]
  22. Wang, M.; Ren, F.; Zhou, J.; Cai, G.; Cai, L.; Hu, Y.; Wang, D.; Liu, Y.; Guo, L.; Shen, S. N Doping to ZnO Nanorods for Photoelectrochemical Water Splitting under Visible Light: Engineered Impurity Distribution and Terraced Band Structure. Sci. Rep. 2015, 5, 12925. [Google Scholar] [CrossRef] [PubMed] [Green Version]
  23. Yan, W.; Liu, X.; Houa, S.; Wang, X. Study on Micro-Nanocrystalline Structure Control and Performance of ZnWO4 photocatalysts. Catal. Sci. Technol. 2019, 9, 1141–1153. [Google Scholar] [CrossRef]
  24. Tian, L.; Rui, Y.; Sun, K.; Cui, W.; An, W. Surface Decoration of Znwo4 Nanorods with Cu2O Nanoparticles to Build Heterostructure with Enhanced Photocatalysis. Nanomaterials 2018, 8, 33. [Google Scholar] [CrossRef] [Green Version]
  25. Zhang, C.; Zhang, H.; Zhang, K.; Li, X.; Leng, Q.; Hu, C. Photocatalytic Activity of ZnWO4: Band Structure, Morphology and Surface Modification. ACS Appl. Mater. Interfaces 2014, 6, 14423–14432. [Google Scholar] [CrossRef]
  26. Ye, S.; Wang, R.; Wu, M.-Z.; Yuan, Y.-P. A Review on g-C3N4 for Photocatalytic Water Splitting and CO2 Reduction. Appl. Surf. Sci. 2015, 358, 15–27. [Google Scholar] [CrossRef]
  27. Patnaik, S.; Martha, S.; Parida, K.M. An Overview of the Structural, Textural and Morphological Modulations of g-C3N4 towards Photocatalytic Hydrogen Production. Rsc Adv. 2016, 6, 46929–46951. [Google Scholar] [CrossRef]
  28. Zhu, B.; Cheng, B.; Zhang, L.; Yu, J. Review on DFT Calculation of s-Riazine-Based Carbon Nitride. Carbon Energy 2019, 1, 32–56. [Google Scholar] [CrossRef] [Green Version]
  29. Fagan, R.; McCormack, D.E.; Hinder, S.J.; Pillai, S.C. Photocatalytic Properties of g-C3N4-TiO2 Heterojunctions under UV and Visible Light Conditions. Materials 2016, 9, 286. [Google Scholar] [CrossRef]
  30. Zeng, P.; Ji, X.; Su, Z.; Zhang, S. Ws2/g-C3N4 Composite as an Efficient Heterojunction Photocatalyst for Biocatalyzed Artificial Photosynthesis. Rsc Adv. 2018, 8, 20557–20567. [Google Scholar] [CrossRef] [Green Version]
  31. Weng, G.M.; Xie, Y.; Wang, H.; Karpovich, C.; Lipton, J.; Zhu, J.; Kong, J.; Pfefferle, L.D.; Taylor, A.D. A Promising Carbon/g-C3N4 Composite Negative Electrode for a Long-Life Sodium-Ion Battery. Angew. Chem. 2019, 58, 13727–13733. [Google Scholar] [CrossRef]
  32. Ong, W.J.; Tan, L.L.; Chai, S.P.; Yong, S.T. Heterojunction Engineering of Graphitic Carbon Nitride (g-C3N4) via Pt Loading with Improved Daylight-Induced Photocatalytic Reduction of Carbon Dioxide to Methane. Dalton Trans. 2015, 44, 1249–1257. [Google Scholar] [CrossRef] [PubMed]
  33. Qi, K.; Li, Y.; Xie, Y.; Liu, S.Y.; Zheng, K.; Chen, Z.; Wang, R. Ag Loading Enhanced Photocatalytic Activity of g-C3N4 Porous Nanosheets for Decomposition of Organic Pollutants. Front. Chem. 2019, 7, 91–97. [Google Scholar] [CrossRef]
  34. Le, T.M.O.; Lam, T.H.; Pham, T.N.; Ngo, T.C.; Lai, N.D.; Do, D.B.; Nguyen, V.M. Enhancement of Rhodamine B Degradation by Ag Nanoclusters-Loaded g-C3N4 Nanosheets. Polymers 2018, 10, 633. [Google Scholar] [CrossRef] [PubMed] [Green Version]
  35. Ma, T.; Shen, Q.; Xue, B.Z.J.; Guan, R.; Liu, X.; Jia, H.; Xu, B. Facile Synthesis of Fe-Doped g-C3N4 for Enhanced Visible-Light Photocatalytic Activity. Inorg. Chem. Commun. 2019, 107, 107451. [Google Scholar] [CrossRef]
  36. Wang, N.; Wang, J.; Hu, J.; Lu, X.; Sun, J.; Shi, F.; Liu, Z.-H.; Lei, Z.; Jiang, R. Design of Palladium-Doped g-C3N4 for Enhanced Photocatalytic Activity toward Hydrogen Evolution Reaction. ACS Appl. Energy Mater. 2018, 1, 2866–2873. [Google Scholar] [CrossRef]
  37. Wang, X.; Chen, X.; Thomas, A.; Fu, X.; Antonietti, M. Metal-Containing Carbon Nitride Compounds: A New Functional Organic-Metal Hybrid Material. Adv. Mater. 2009, 21, 1609–1612. [Google Scholar] [CrossRef]
  38. Tonda, S.; Kumar, S.; Kandula, S.; Shanker, V. Fe-Doped and -Mediated Graphitic Carbon Nitride Nanosheets for Enhanced Photocatalytic Performance under Natural Sunlight. J. Mater. Chem. A 2014, 2, 6772–6780. [Google Scholar] [CrossRef]
  39. Hu, S.; Ma, L.; You, J.; Li, F.; Fan, Z.; Lu, G.; Liu, D.; Gui, J. Enhanced Visible Light Photocatalytic Performance of g-C3N4 Photocatalysts Co-Doped with Iron and Phosphorus. Appl. Surf. Sci. 2014, 311, 164–171. [Google Scholar] [CrossRef]
  40. Li, Z.; Kong, C.; Lu, G. Visible Photocatalytic Water Splitting and Photocatalytic Two-Electron Oxygen Formation over Cu- and Fe-Doped g-C3N4. J. Phys. Chem. C 2015, 120, 56–63. [Google Scholar] [CrossRef]
  41. Feng, D.; Cheng, Y.; He, J.; Zheng, L.; Shao, D.; Wang, W.; Wang, W.; Lu, F.; Dong, H.; Liu, H.; et al. Enhanced Photocatalytic Activities of g-C3N4 with Large Specific Surface Area via a Facile One-Step Synthesis Process. Carbon 2017, 125, 454–463. [Google Scholar] [CrossRef]
  42. Kharlamov, A.; Bondarenko, M.; Kharlamova, G.; Gubareni, N. Features of the Synthesis of Carbon Nitride Oxide (g-C3N4)O at Urea Pyrolysis. Diam. Relat. Mater. 2016, 66, 16–22. [Google Scholar] [CrossRef]
  43. Hung, N.M.; Mai Oanh, L.T.; Hang, L.T.; Chung, P.D.; Duyen, P.T.; Thang, D.V.; Van Minh, N. Effect of Heating Time on Structural, Morphology, Optical, and Photocatalytic Properties of g-C3N4 Nanosheets. Chin. Phys. B 2020, 29, 057801. [Google Scholar] [CrossRef]
  44. Mai Oanh, L.T.; Hang, L.T.; Lai, N.D.; Phuong, N.T.; Thang, D.V.; Hung, N.M.; Danh Bich, D.; Minh, N.V. Influence of Annealing Temperature on Physical Properties and Photocatalytic Ability of g-C3N4 Nanosheets Synthesized through Urea Polymerization in Ar Atmosphere. Phys. B Condens. Matter 2018, 532, 48–53. [Google Scholar] [CrossRef]
  45. Kang, D.Y.; Kim, C.; Park, G.; Moon, J.H. Liquid Immersion Thermal Crosslinking of 3D Polymer Nanopatterns for Direct Carbonisation with High Structural Integrity. Sci. Rep. 2015, 5, 18185. [Google Scholar] [CrossRef] [PubMed] [Green Version]
  46. Jerng, S.-K.; Yu, D.S.; Lee, J.H.; Kim, C.; Yoon, S.; Chun, S.-H. Graphitic Carbon Growth on Crystalline and Amorphous Oxide Substrates Using Molecular Beam Epitaxy. Nanoscale Res. Lett. 2011, 6, 565. [Google Scholar] [CrossRef] [Green Version]
  47. Pica, M.; Nocchetti, M.; Ridolfi, B.; Donnadio, A.; Costantino, F.; Gentili, P.L.; Casciola, M. Nanosized Zirconium Phosphate/AgCl Composite Materials: A New Synergy for Efficient Photocatalytic Degradation of Organic Dye Pollutants. J. Mater. Chem. A 2015, 3, 5525–5534. [Google Scholar] [CrossRef]
  48. Fan, Y.; Chen, G.; Li, D.; Luo, Y.; Lock, N.; Jensen, A.P.; Mamakhel, A.; Mi, J.-L.; Iversen, S.B.; Meng, Q.; et al. Highly Selective Deethylation of Rhodamine B on Prepared in Supercritical Fluids. Int. J. Photoenergy 2012, 2012, 1–7. [Google Scholar] [CrossRef]
  49. Zhu, B.; Zhang, L.; Cheng, B.; Yu, J. First-principle calculation study of tri-s-triazine-based g-C3N4: A Review. Appl. Catal. B. 2018, 224, 983–999. [Google Scholar] [CrossRef]
Figure 1. Charge transfer processes in photocatalytic performance of Fe-doped g-C3N4.
Polymers 12 01963 g001
Figure 2. (a) X-ray diffraction (XRD) patterns of Fe-doped g-C3N4 nanosheets with different Fe concentrations; (b) The comparison of (101) and (002) XRD peak position.
Polymers 12 01963 g002
Figure 3. (a) Fourier-transform infrared (FT-IR) spectra of Fe-doped g-C3N4 nanosheets with different Fe concentrations and (b) The shift of FTIR peak position.
Polymers 12 01963 g003
Figure 4. Field emission scanning electron microscopy (FE-SEM) images of pure g-C3N4 nanosheets with different magnifications.
Polymers 12 01963 g004
Figure 5. (a) N2 adsorption-desorption isotherms of Fe-doped g-C3N4 nanosheets with different Fe concentrations and (b) Barrett-Joyner-Halenda (BJH) pore size distribution plots.
Polymers 12 01963 g005
Figure 6. (a) Absorption spectra of Fe-doped g-C3N4 nanosheets with different Fe concentrations and (b) Wood-Tauc method in determining the band gap energy of indirect semiconductor.
Polymers 12 01963 g006
Figure 7. (a) Photoluminescence (PL) spectra of Fe-doped g-C3N4 nanosheets with different Fe concentrations and (b) The normalized PL spectra and the Gaussian fitting for pure g-C3N4.
Polymers 12 01963 g007
Figure 8. (a) X-ray photoelectron (XPS) survey spectra and (b) XPS spectra of C1s, (c) N1s and (d) Fe2p of pure g-C3N4 and FeCN7 photocatalyst.
Polymers 12 01963 g008
Figure 9. Photocatalytic activities and reaction rate of Fe-doped g-C3N4 nanosheets with different Fe concentrations in decomposing RhB solution under (a,b) Xenon lamp illumination and (c,d) sunlight illumination; (e) the reusability of as-prepared Fe-doped g-C3N4 photocatalyst and (f) the change of absorption maxima and absorption intensity of RhB solution at different times.
Polymers 12 01963 g009
Table 1. The Data of Brunauer–Emmett–Teller (BET) Surface Area, Pore Volume and Pore Size of Fe-Doped g-C3N4 Nanosheets with Different Fe Concentrations.
Sampleg-C3N4FeCN5FeCN7FeCN10
BET surface area
(m2/g)
91100132104
Pore volume
(cm3/g)
0.4750.52230.5320.465
Pore size
(nm)
21211618
Table 2. The Position of Photoluminescence Peaks P1, P2, P3, P4 of Fe-Doped g-C3N4 Nanosheets with Different Fe Concentrations.
Sampleg-C3N4FeCN5FeCN5FeCN7FeCN10
Peak 1
(nm)
431.73429.72429.15429.2429.11
Peak 2
(nm)
453.85452.24451.93451.75451.63
Peak 3
(nm)
488.88488.27487.77489.11488.48
Peak 4
(nm)
538.17539.56539.15540.44539.31

