Article

Shrinkage and Warpage Minimization of Glass-Fiber-Reinforced Polyamide 6 Parts by Microcellular Foam Injection Molding

Department of Mechanical Engineering, Yonsei University, 50, Yonsei-ro, Seodaemun-gu, Seoul 03722, Korea
*
Author to whom correspondence should be addressed.
Polymers 2020, 12(4), 889; https://doi.org/10.3390/polym12040889
Submission received: 30 March 2020 / Accepted: 9 April 2020 / Published: 11 April 2020
(This article belongs to the Special Issue Advances on Injection Molding of Polymers)

Abstract

:
Shrinkage and warpage of injection-molded parts can be minimized by applying microcellular foaming technology to the injection molding process. However, unlike the conventional injection molding process, the optimal conditions of the microcellular foam injection molding process are elusive because of core differences such as gas injection. Therefore, this study aims to derive process conditions to minimize the shrinkage and warpage of microcellular foam injection-molded parts made of glass fiber reinforced polyamide 6 (PA6/GF). Process factors and levels were first determined, with experiments planned accordingly. We simulated designed experiments using injection molding analysis software, and the results were analyzed using the Taguchi method, analysis of variance (ANOVA), and response surface methodology (RSM), with the ANOVA analysis being ultimately demonstrating the influence of the factors. We derived and verified the optimal combination of process factors and levels for minimizing both shrinkage and warpage using the Taguchi method and RSM. In addition, the mechanical properties and cell morphology of PA6/GF, which change with microcellular foam injection molding, were confirmed.

1. Introduction

The automotive industry is attempting to reduce automobile weight by replacing metal parts with plastic ones to improve gas mileage [1]. Injection molding is a suitable process for manufacturing automobile plastic parts with complex shapes [2]. This process consists of plastic resin pellets placed in an injection molding machine’s hopper, followed by entering a heated barrel containing the rotating screw to be melted. The melted resin is then transferred to the barrel’s front by rotation of the screw. Finally, the resin is injected into a mold of the desired shape and, after cooling, taken out as the solidified product [3].
There have been many studies on manufacturing plastic automobile parts using injection molding mainly using polypropylene (PP) and polyamide 6 (PA6)-based materials [4,5,6,7,8,9,10]. Whiteside et al. predicted the fiber orientation distribution of a clutch pedal made with glass fiber reinforced PA6 by using simulation software and confirmed that the distribution matched the experimental results [4]. Panthapulakkal et al. proposed the applicability of hemp/glass fiber reinforced PP composites for automotive parts by determining mechanical, thermal, and water absorption properties of the composites [6]. Park et al. minimized the weight and post-injection deformation of front body structure parts made of PA6 reinforced with 30 wt % short glass fiber [10].
Furthermore, the microcellular foaming process has been proposed to reduce the weight of the injection-molded product [11,12,13]. Microcellular foamed plastics are known to not only reduce the weight of any products compared to unfoamed products, but also to reduce shrinkage and warpage [14,15,16,17]. Kramschuster et al. measured the shrinkage and warpage of box-shaped PP parts using conventional and microcellular foam injection molding. In the case of microcellular foam injection molding, shrinkage, and warpage of the parts were reduced when compared with the conventional injection molding process [14]. Zafar et al. confirmed that shrinkage of ASTM standard rod-shaped parts gradually decreased as the weight of the samples decreased by microcellular foam injection molding. Glass-fiber-filled and unfilled acetal copolymers were used as the materials in the experiment, and they found that the shrinkage of both types reduces with increasing weight reduction [15]. Kim et al. studied the shrinkage and warpage of plate-shaped glass fiber-reinforced PP parts by using the microcellular foam injection molding process. When using this process, both shrinkage and warpage were reduced compared with unfoamed parts, especially in a direction perpendicular to the flow direction [16]. These advantages are useful to the automotive industry, where the dimensional stability of components is important.
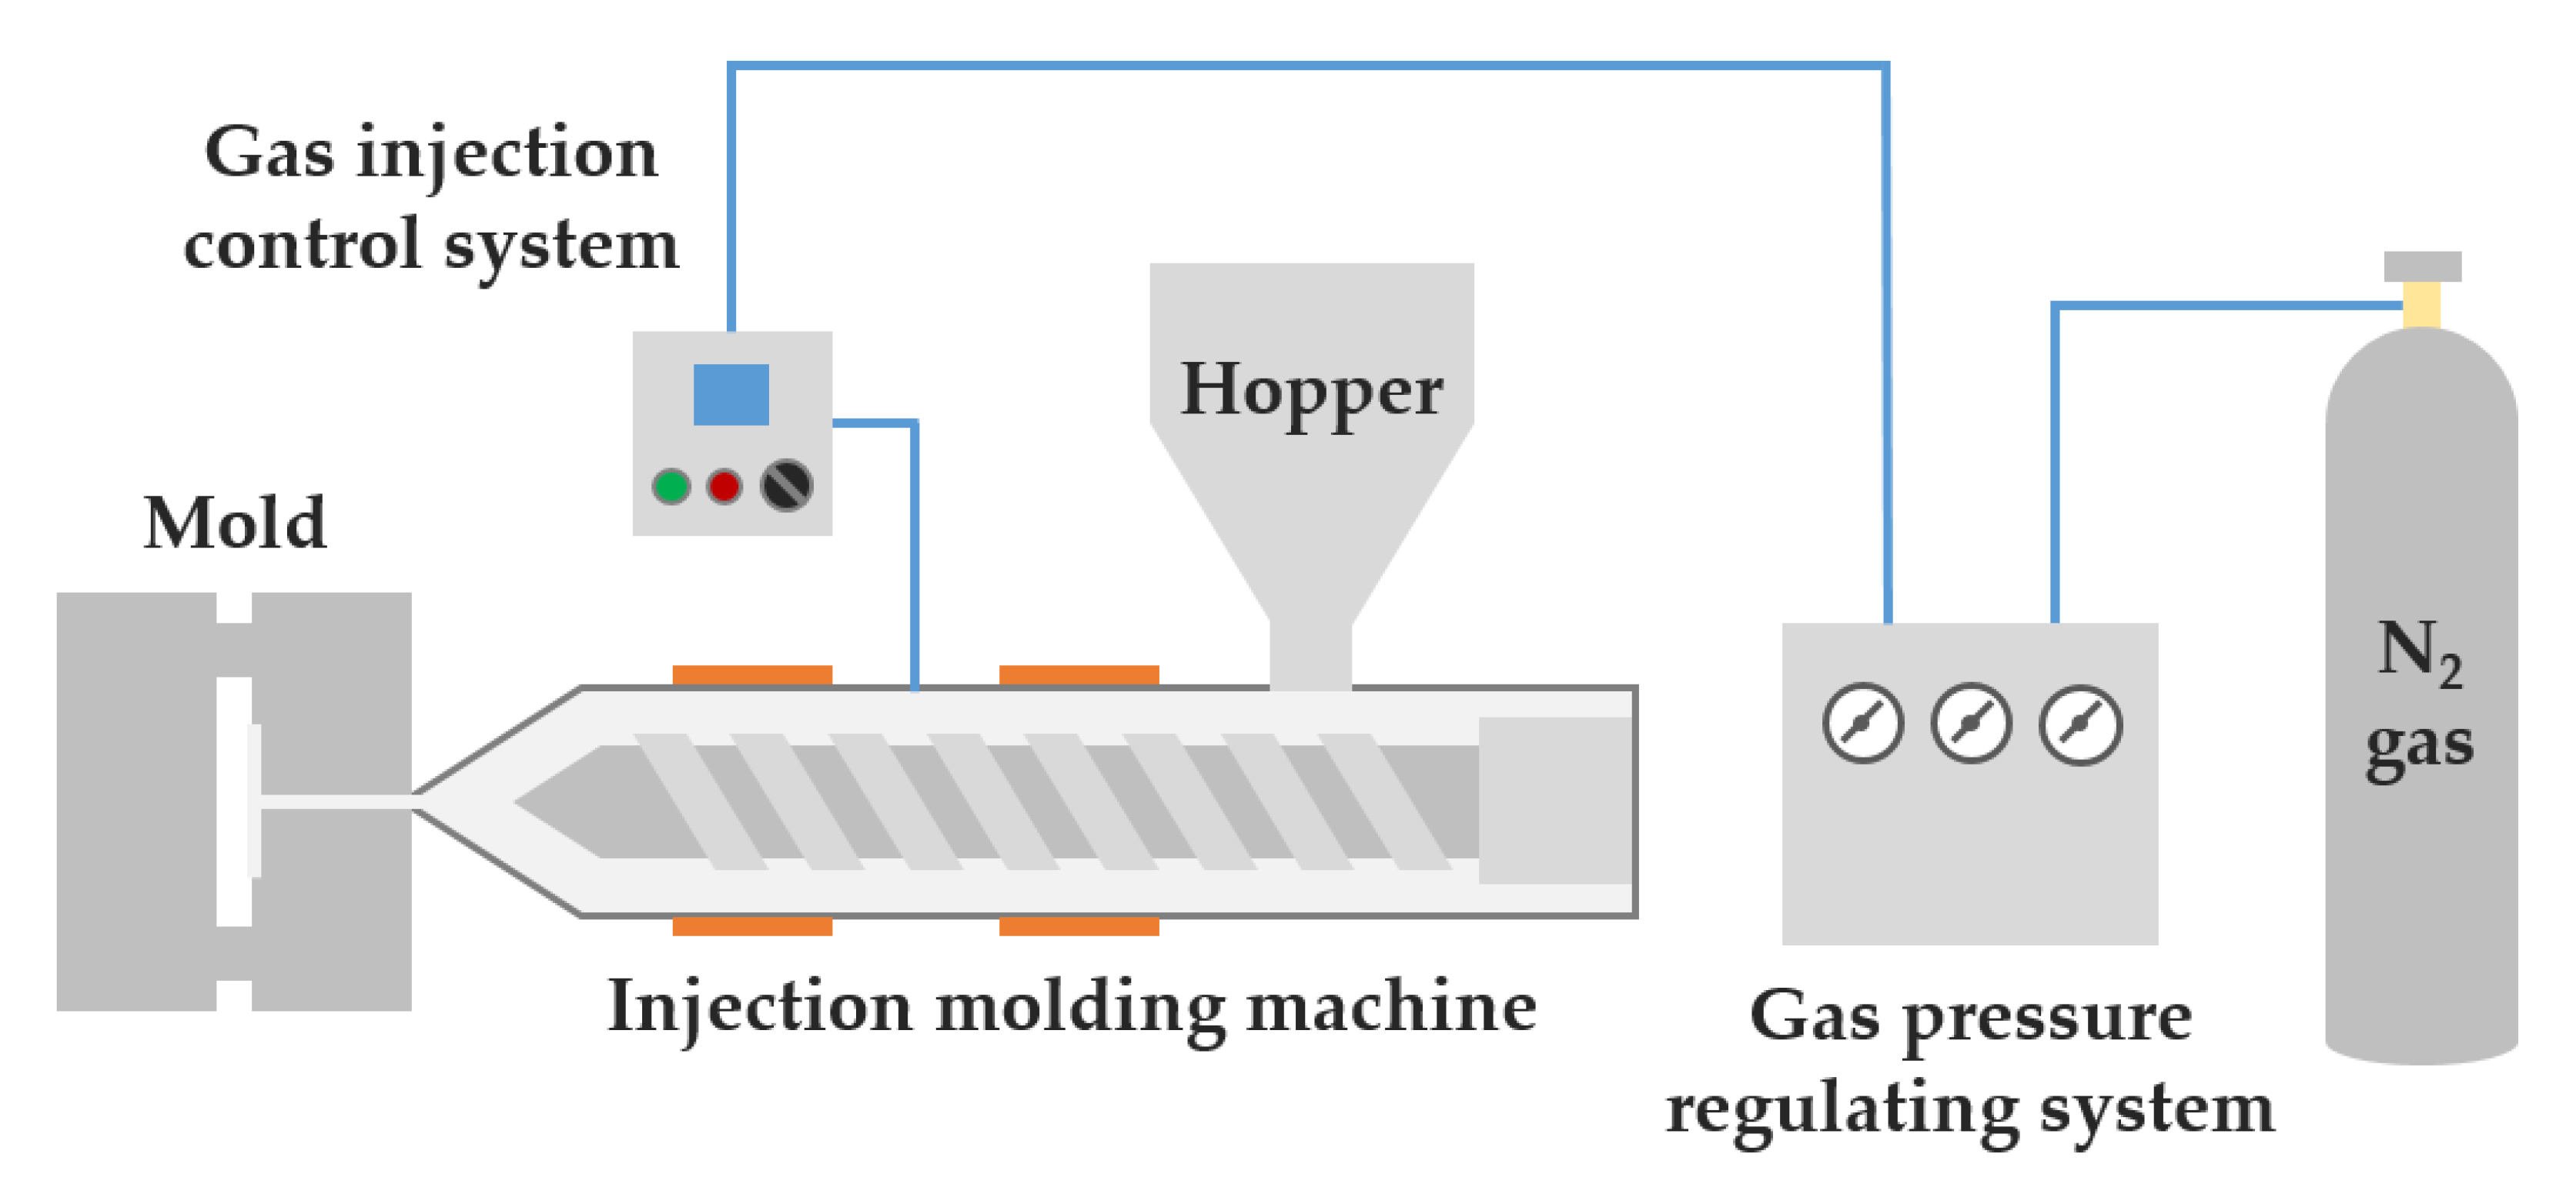
The microcellular foam injection molding process starts with an injection of inert gas (e.g., N2) into the molten polymer resin, which is in a supercritical fluid state, and the gas and the resin subsequently form a single-phase in the form of a polymer-gas solution. As the solution is injected into the injection mold, a sudden pressure drop occurs, which causes the formation of microcells. Research on manufacturing automotive parts using this process is ongoing [18,19,20,21,22,23,24]. Kharbas et al. compared thermoplastic polyurethane foams made using supercritical gas-laden pellets with either a chemical blowing agent, a physical blowing agent, or co-physical blowing agents [22]. Comparison results showed that co-physical blowing agents lead to lower bulk density, better microstructure, and lower hysteresis loss ratios. Wang et al. confirmed the cell morphology and mechanical properties of the injection-molded microcellular foamed PP/talc composite and found that the addition of nano talc improved cell structure, strength, and stiffness and toughness when compared to pure PP foam [23]. Volpe et al. investigated the thermo-mechanical properties, density, and cell morphology of polyamide 66 (PA66) reinforced with glass fiber as a function of injection temperature, cavity thickness, and gas injection pressure [24]. In addition, analysis of variance (ANOVA) revealed that higher injection temperature, higher gas injection pressure, and increased thickness led to homogeneous foam and better mechanical properties.
Since gas is injected, unlike conventional injection molding processes, microcellular foam injection molding requires alternative processing conditions. Therefore, research to optimize these conditions is required. However, existing studies on the optimized microcellular foam injection molding process of PA6 for minimizing shrinkage and warpage are still insufficient.
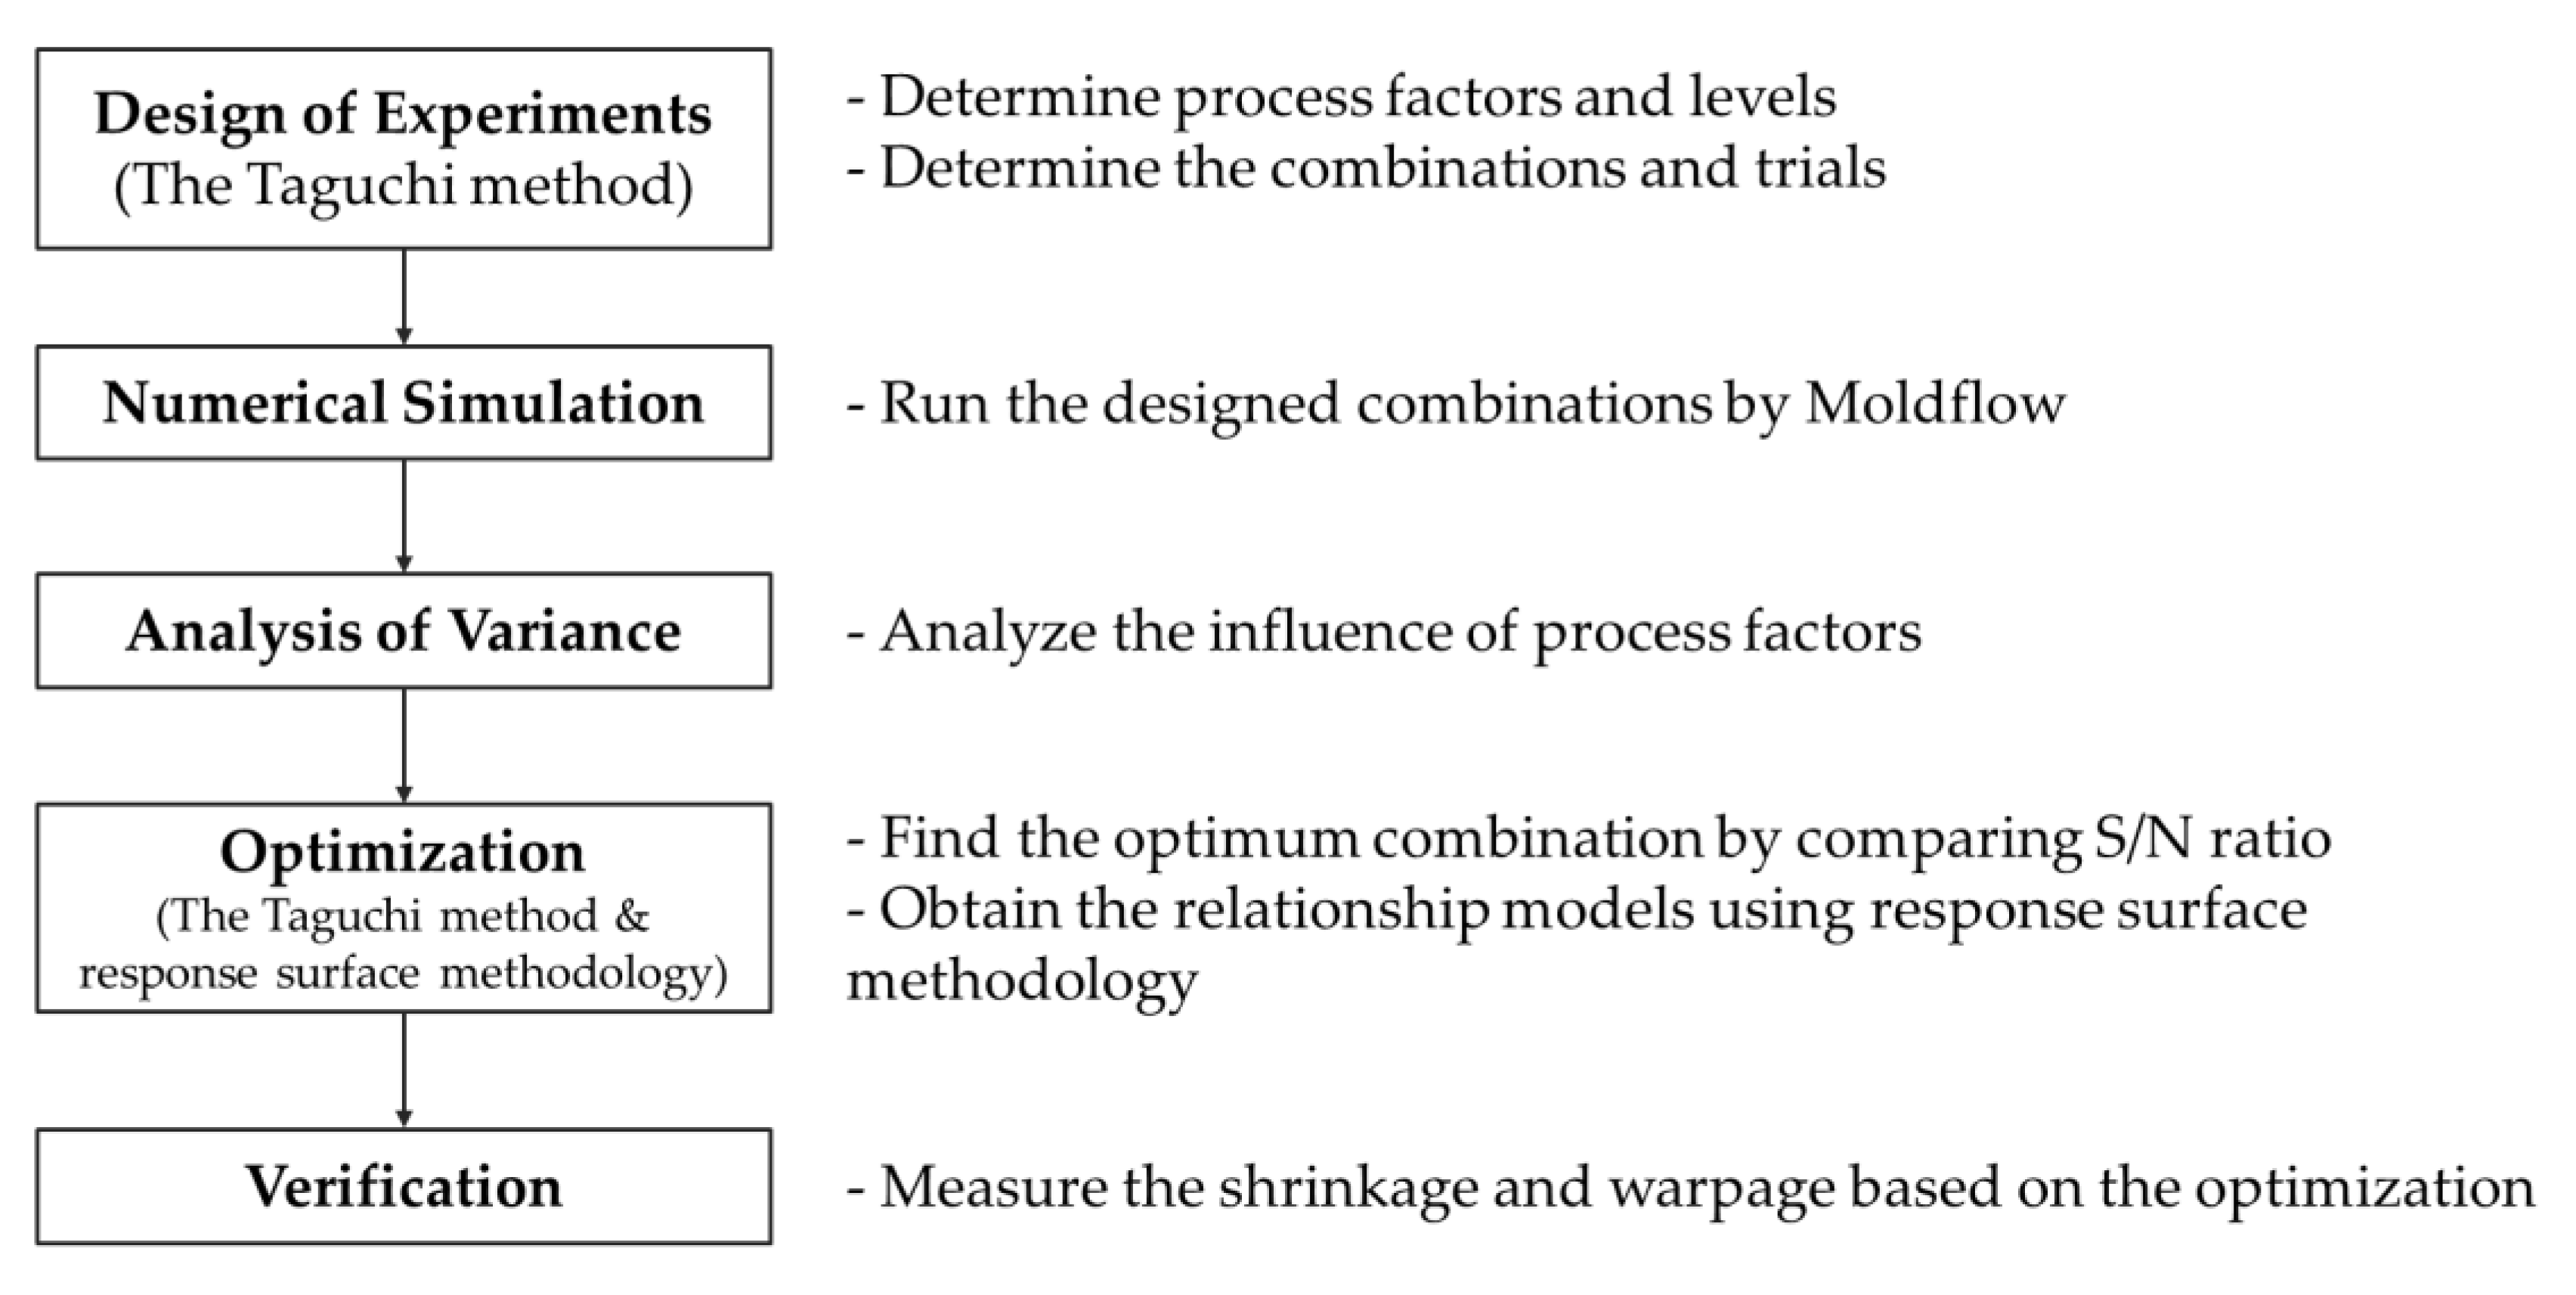
In this study, microcellular foam injection molding process of glass fiber-reinforced PA6 was optimized to minimize the shrinkage and warpage of the injection-molded parts. Because PA6 is mainly used for automotive exterior parts, it must be optimized for the production of microcellular foamed parts. We predict that shrinkage and warpage depend on process factors considered to be important in microcellular foam injection molding process, such as melt and mold temperatures, packing and cooling times, and gas content. The experiments were designed considering each factor and level, and the results were analyzed using ANOVA, the Taguchi method, and response surface methodology (RSM).

2. Materials and Methods

2.1. Materials

PA6 reinforced with 18 wt% of glass fiber and 22 wt% of minerals was used as the test material. The polymer composite was manufactured by Kolon Plastics Inc. (KOPA6 KN133HBRR, Gyeongsang, Korea) and has the characteristics shown in Table 1.

2.2. Methods

In order to achieve the purposed goal of this study, process optimization was carried out in several steps (Figure 1), using techniques such as design of experiments (DOE), ANOVA, the Taguchi method, and RSM.

2.2.1. The Taguchi Method

The Taguchi method is a robust design method used for noise factors that cannot be controlled. Therefore, the concept of signal-to-noise ratio (S/N ratio) is introduced, and the condition where the S/N ratio is large is optimal. The equation for the S/N ratio in which the smaller value is a better characteristic is as follows [25]:
S i g n a l N o i s e = S N = 10 l o g 10 i = 1 n y i 2 n
where n is the number of data sets, and y i is the quantitative value of the data sets. In this study, n is the number of simulations, and y i corresponds to the value of shrinkage and warpage.

2.2.2. Analysis of Variance

ANOVA compares the variance from each factor with the variance of the error, determining which factor is significant [26]. The influence of factors such as the degree of freedom (f), sum of squares (SS), and variance can be compared by calculating their contribution (%) as follows [27]:
D e g r e e   o f   f r e e d o m   f o r   f a c t o r   A = f A = k A 1
T o t a l   d e g r e e   o f   f r e e d o m = f t = k t 1
where k A is the number of results for factor A, and k t is the total number of results.
S S A = (   A 1 ) 2 k A + (   A 2 ) 2 k A + (   A 3 ) 2 k A ( y 1 + y 2 + + y k t ) 2 k t
S S T =   ( S S A + S S B + + S S E )
where SS is the sum of squares and   A i is the sum of the y i when the level of factor A is i th.
V a r i a n c e   f o r   f a c t o r   A = S S A f A
C o n t r i b u t i o n   ( % ) = S S A S S T × 100

2.2.3. Response Surface Methodology

RSM analyzes the relationship several factors have with their result. Using RSM, we can determine the relationship between design factors and result values using the relationship equation and the response surface plot, ultimately finding the optimal response. The equation, called the response surface model, is expressed as a regression model as follows [28]:
Y = a 0 + i = 1 k a i x i + i = 1 k a i i x i x i + i j k a i j x i x j
where Y is the response output (shrinkage and warpage) by the response surface model, and a corresponds to coefficients, x is level of factor, and k is the number of the factors.

2.2.4. Experimental Setup

Simulations were performed using injection molding analysis software Autodesk Moldflow Insight (Framingham, The Commonwealth of Massachusetts, USA) to analyze the shrinkage and warpage of the injection-molded parts as a function of the process factors [29]. In order to compare the shrinkage and warpage tendency, we selected a thin rectangular shape as a test sample model for simulation, with a width, length, and thickness of 148, 98 mm, and 1.8 mm, respectively. The sample mesh in Moldflow consists of a total of 19,180 small triangles (Figure 2a). The generated mesh shows a match percentage of 94.6% compared with the shape of the sample model. Shrinkage in the flow direction (FD) was calculated based on the average value of the two lengths in the flow direction parallel to the flow of the resin (Figure 2b). Shrinkage in the transverse direction (TD) was calculated based on the average value of the two lengths in the transverse direction perpendicular to the flow direction (Figure 2b). Warpage was calculated as the average of three points on the left edge and three points on the right edge that showed the greatest warpage in the test sample model (Figure 2b).
Based on the factors expected to have an effect on shrinkage and warpage in microcellular foam injection molding process, we selected five factors and three levels (Table 2). The levels of melt temperature, mold temperature, and cooling time were selected as the recommended range for the material. The levels of gas content were selected by dividing the range (less than 1 wt %) mainly used in microcellular injection molding [30,31]. In this type of injection molding, the pressure and time of packing are set relatively small, because of the expanding gas in the melt resin [13]. Therefore, the packing pressure was fixed at 20% of the injection pressure, and the packing time was set between 0 and 2 s in this experiment. There are two types of microcellular foam injection molding processes: the full-shot process, in which the mold cavity is filled completely (similar as that for the conventional injection molding process), and the short-shot process, in which the mold cavity is partially filled. In the case of the short-shot process, the empty cavity is filled through the growth of the cells. In this study, the full-shot process was used for comparison with unfoamed conditions.
The experiment was designed using an orthogonal array table considering the selected factors and levels [32]. Table 3 shows a total of 27 designed experiments that were simulated by Moldflow. Next, the simulation results were analyzed by ANOVA, the Taguchi method, and RSM using the data analysis software Minitab in order to determine the optimal conditions for minimizing shrinkage and warpage of injection-molded parts [33].

2.2.5. Experimental Verification

We injection-molded using a 120 tons clamping force injection molding machine (Woojin Plaimm Co., Ltd, Woojin Selex-E120, Chungcheong, Korea) to test the shrinkage and warpage of the unfoamed and microcellular foamed samples after drying the material (80 °C, 4 h). For the microcellular foam injection molding process, a gas injection port for injecting N2 gas (10 MPa) in a supercritical fluid state was connected to the barrel of the conventional injection molding machine (Figure 3).
Shrinkage and warpage of the test specimen were measured 48 h after injection molding and 10 samples were used in the measurement of each condition. The shrinkage and warpage values of each condition were calculated by excluding the maximum and minimum values and averaging over the remaining eight values. The shrinkage was derived using the following equation.
S h r i n k a g e   ( % ) = l m o l d l p a r t l m o l d × 100
where l m o l d represents the length of the mold, and l p a r t represents the length of the injection-molded parts. When the sample was placed on the floor, we measured the maximum height (mm) of the bending as warpage.

2.2.6. Mechanical Properties

In order to compare the mechanical properties of unfoamed and microcellular foamed parts, test specimens of tensile strength, flexural strength, and impact strength were injection-molded. The mechanical properties of ten test samples for each condition were measured, and the average strength was calculated, excluding the maximum and minimum values. We used a universal testing machine (QMESYS Co., Ltd., QM-100T, Gyeonggi, Korea) to measure the tensile strength and flexural modulus, and an Izod impact tester (Salt Co., Ltd., ST-120, Incheon, Korea) to measure impact strength. Mechanical properties were measured by applying methods specified by the American Society for Testing and Materials (ASTM). Tensile strength was derived by tensioning test specimens of type 1 (165 mm × 19 mm × 3.3 mm) as per the ASTM D638 method. Flexural modulus and impact strength were measured with the ASTM D790 and ASTM D256 methods, respectively.

2.2.7. Cell Morphology

A scanning electron microscope (SEM) (JEOL Ltd, JEOL-7001F, Tokyo, Japan) was used to observe the cell morphology by enlarging the cross-sections of the unfoamed and microcellular foamed specimens. The average cell diameter was calculated by averaging the diameters of all cells in the SEM image, and the cell diameters were measured using ImageJ, an image analysis software. The foaming ratio is calculated by the following equations from the density of the unfoamed sample and the density of the foamed sample.
F o a m i n g   r a t i o   ( % ) = ρ u n f o a m e d ρ f o a m e d ρ u n f o a m e d × 100
where ρ u n f o a m e d represents the density of the unfoamed parts, and ρ f o a m e d represents the density of the foamed parts.

3. Results and Discussion

3.1. The Taguchi Method

Table 4 shows shrinkage in the FD, shrinkage in the TD, warpage, and S/N ratios for each combination. The 27 simulations showed an average shrinkage in the FD of 0.589%, average shrinkage in the TD of 0.888%, and warpage of 0.7501 mm. The difference of the S/N ratio between each factor and level is shown in Figure 4, Figure 5, Figure 6. The larger the S/N ratio, the more optimal the level.
The optimum combination for obtaining the smallest shrinkage in the FD is a melt temperature of 260 °C, mold temperature of 60 °C, cooling time of 20 s, packing time of 0 s, and gas content of 0.2 wt % (Figure 4). The optimum combination for obtaining the smallest shrinkage in the TD is a melt temperature of 260 °C, mold temperature of 60 °C, cooling time of 30 s, packing time of 0 s, and gas content of 0.6 wt % (Figure 5). In contrast, the optimum combination for the smallest warpage is a melt temperature of 260 °C, mold temperature of 60 °C, cooling time of 20 s, packing time of 2 s, and gas content of 0.6 wt % (Figure 6).
Both, shrinkage and warpage showed the most optimal results at a melt temperature of 260 °C and mold temperature of 60 °C. This tendency is similar to the conventional injection molding in which the shrinkage is smaller as melt temperature increase, and as mold temperature decrease [34].
However, the minimum shrinkage conditions were different from the warpage conditions in terms of the cooling time, packing time, and gas content. There were existing studies that the optimum condition for the shrinkage and that for the warpage is different [35]. First, the shrinkage and warpage did not decrease further, as the cooling time continued to increase. This is because the longer the cooling time, the longer the cell growth time of the microcells. As the cell size increases, the uniformity of the overall cell size decreases, and the possibility of causing warpage increases. Also, as the injected gas takes the place of the packing pressure role, the packing time at which shrinkage and warpage is minimized does not show a certain trend. Lastly, the gas content tended to move away from the optimum condition when it exceeded a certain content. Previous studies show that the cell size increases with an increase of gas content [36]. As the cell size increases, the warpage also increases because of increased cell non-uniformity.
Table 5 shows the optimal combinations of shrinkage and warpage by the Taguchi method, where the average levels of both were used to minimize both shrinkage and warpage.

3.2. Analysis of Variance

In ANOVA, if the P-value is less than 0.05, the factor is considered statistically significant. For the shrinkage in the FD, melt and mold temperatures were considered significant factors (Table 6). Regarding significant factors, mold temperature had by far the biggest influence, followed by melt temperature. In contrast, cooling time, packing time, and gas content were not significant factors.
For the shrinkage in the TD, melt and mold temperatures and gas content were the significant factors (Table 7). The significance of these factors is in the order of gas content, mold temperature, and melt temperature. The contribution of gas content to the shrinkage in the TD was 49.19%, which was critical compared to other process factors. Here, it can be seen how large the effect of gas content on the shrinkage in comparison to other process factors in microcellular foam injection molding is. In particular, the effect of gas content on the shrinkage in the TD was larger than that on the shrinkage in the FD. This is because incorporated glass fiber in PA6/GF reduces shrinkage in the FD by alignment with the flow direction before foam affects the shrinkage in the FD. Therefore, the effect of foaming on the shrinkage in the TD is relatively larger than that on the shrinkage in the FD. Cooling time and packing time were not significant factors for shrinkage in the FD.
For warpage, melt temperature, mold temperature, and gas content were the significant factors, similar as that for shrinkage in the TD (Table 8). However, the significance of these factors shows a different order to the shrinkage in the TD. The significance of the factors is in the order of mold temperature, melt temperature, and gas content. Cooling time and packing time were not significant factors for warpage.
In previous studies, the influence of each factor was analyzed to change according to the properties of the material. Ozcelik et al. confirmed that mold and melt temperatures, packing pressure, and cooling time are all significant factors when simulating the warpage of injection-molded thin shell plastic parts made of polyoxymethylene (POM) [37]. In their study, the influence of packing and cooling times is the smallest among all factors, but these factors are still significant. In another study, melt temperature and cooling time were significant for shrinkage, but mold temperature was found to be insignificant when simulating the shrinkage of injection-molded DVD cover products made with acrylonitrile butadiene styrene (ABS) [38]. In Chen’s research, packing and cooling times were significant factors for the warpage of injection-molded polybutylene terephthalate (PBT) samples, but melt temperature was insignificant [39].

3.3. Response Surface Methodology

The relationship between the process factors and result values (shrinkage and warpage) were obtained by using RSM Equations (11), (12), and (13). The relationship between two process factors and response values is shown in Figure 7. We selected and plotted the two factors that had the greatest effect on each result. The shrinkage in the FD is minimized as melt and mold temperatures decrease, while the shrinkage in TD is minimized as the mold temperature decreases and gas content approaches 0.6 wt%. The warpage is minimized as the melt and mold temperatures decrease.
Table 9 shows the optimal combination derived using RSM. Optimal combinations are divided into minimizing only shrinkage, minimizing only warpage, and minimizing both.
Y s h r i n k a g e _ F D = 0.483 + 0.00092 x 1 + 0.00018 x 2 + 0.000375 x 3 + 0.00076 x 4 + 0.0240 x 5 0.000003 x 1 x 1 + 0.000006 x 2 x 2 0.000003 x 3 x 3 0.00028 x 4 x 4 0.00174 x 5 x 5 0.000208 x 2 x 5 0.000208 x 3 x 5 + 0.00104 x 4 x 5
Y s h r i n k a g e _ T D = 2.55 0.01251 x 1 + 0.00320 x 2 0.00138 x 3 + 0.00604 x 4 0.4431 x 5 + 0.000022 x 1 x 1 0.000019 x 2 x 2 + 0.000022 x 3 x 3 0.00194 x 4 x 4 + 0.1337 x 5 x 5 + 0.000937 x 1 x 5 + 0.000729 x 2 x 5 0.000104 x 3 x 5 0.00313 x 4 x 5
Y w a r p a g e = 1.233 0.00267 x 1 0.00022 x 2 0.000187 x 3 + 0.00112 x 4 0.3055 x 5 + 0.000003 x 1 x 1 + 0.000005 x 2 x 2 + 0.000004 x 3 x 3 0.00073 x 4 x 4 + 0.06821 x 5 x 5 + 0.000784 x 1 x 5 + 0.000390 x 2 x 5 + 0.000038 x 3 x 5 0.00092 x 4 x 5

3.4. Optimization Comparison

Previously, the Taguchi method and RSM were used to derive the optimum combination of process factors and levels for minimizing shrinkage and warpage. Two additional simulations were performed to confirm the optimum combinations by the two methods (Table 10). The resulting combinations yielded values smaller than the average shrinkage and warpage of the 27 simulations (where the average shrinkage in the FD is 0.589%, and the average shrinkage in the TD is 0.888%, and the average warpage is 0.7501 mm). The Taguchi method minimized the shrinkage in the TD and warpage more than RSM. Therefore, the Taguchi method is more optimized for reducing the shrinkage and warpage than RSM.

3.5. Experimental Verification

When comparing the optimization methods previously, we found that a combination with the Taguchi method is the most optimal combination. Therefore, the simulation and experimental results were compared with the optimal combination by the Taguchi method. Table 11 shows the comparison of the simulation and experimental results. In the case of shrinkage, the experimental results were smaller than those of the simulation. The experimental shrinkage in the FD was approximately 0.189% smaller than that observed in the simulation, and the experimental shrinkage in the TD was approximately 0.252% smaller than that in the simulation. However, in the case of warpage, the simulation and experimental results were similar. The difference between the two was only 0.0061 mm. In the simulation, one constant cell size will occur by microcellular foaming, but various cell sizes occur in actual foaming. In addition, the amounts of gas dissolution and diffusion applied to the simulation may be different from the actual experiment as per experimental conditions. Therefore, we analyzed that errors occurred between the simulation and experimental values due to these points.

3.6. Effects of Microcellular Foaming

To confirm the effect of microcellular foaming, we compared shrinkage, warpage, mechanical properties, and SEM images of unfoamed and microcellular foamed PA6/GF samples under optimal conditions. The only difference in the process conditions between unfoamed and foamed samples was the gas content.
First, the shrinkage in the FD, which was 0.449% when not foamed, decreased by approximately 0.063% to 0.386% after foaming (Figure 8). In addition, the shrinkage in the TD, which was 0.649% when not foamed, decreased by approximately 0.051% to 0.598% after foaming (Figure 8). Lastly, when not foamed, the warpage was 11.825 mm, but after foaming, it decreased by about 11.11 mm to 0.715 mm. There was a significant improvement effect on the reduction of warpage rather than the shrinkage. Therefore, microcellular foaming is expected to be a great help in improving the dimensional stability of the injection-molded PA6/GF parts.
The tensile strength of the PA6/GF sample decreased by about 4.6% from 98.0 to 93.5 MPa after foaming, and the flexural modulus decreased by about 2.1% from 4522 to 4427 MPa after foaming (Figure 9a,b). In contrast, the impact strength increased approximately 21.4% from 105.4 to 128.0 J/m after foaming (Figure 9c). Although the tensile strength and flexural modulus decreased slightly by foaming, the impact strength increased relatively, so it is expected that microcellular foaming would be useful to improve the impact strength of unfoamed parts. In the case of existing research, it was analyzed that the impact strength of injection-molded parts can be improved by using microcellular foam injection molding for brittle materials [40,41]. As PA6/GF is also a brittle material, it was analyzed that the impact strength is greatly improved by foaming.
We observed enlarged images of the cross-sections of the unfoamed and microcellular foamed samples using SEM (Figure 10). First, in the case of the unfoamed sample, there were no cells in the cross-section and the glass fibers had a diameter of about 10 µm. However, in the case of the foamed sample, cells were visible in the cross-section of the foamed sample. Based on the SEM image of Figure 10d, the average cell diameter is 9.87 µm. Additionally, the average foaming ratio of the foamed samples is 8.39%.

4. Conclusions

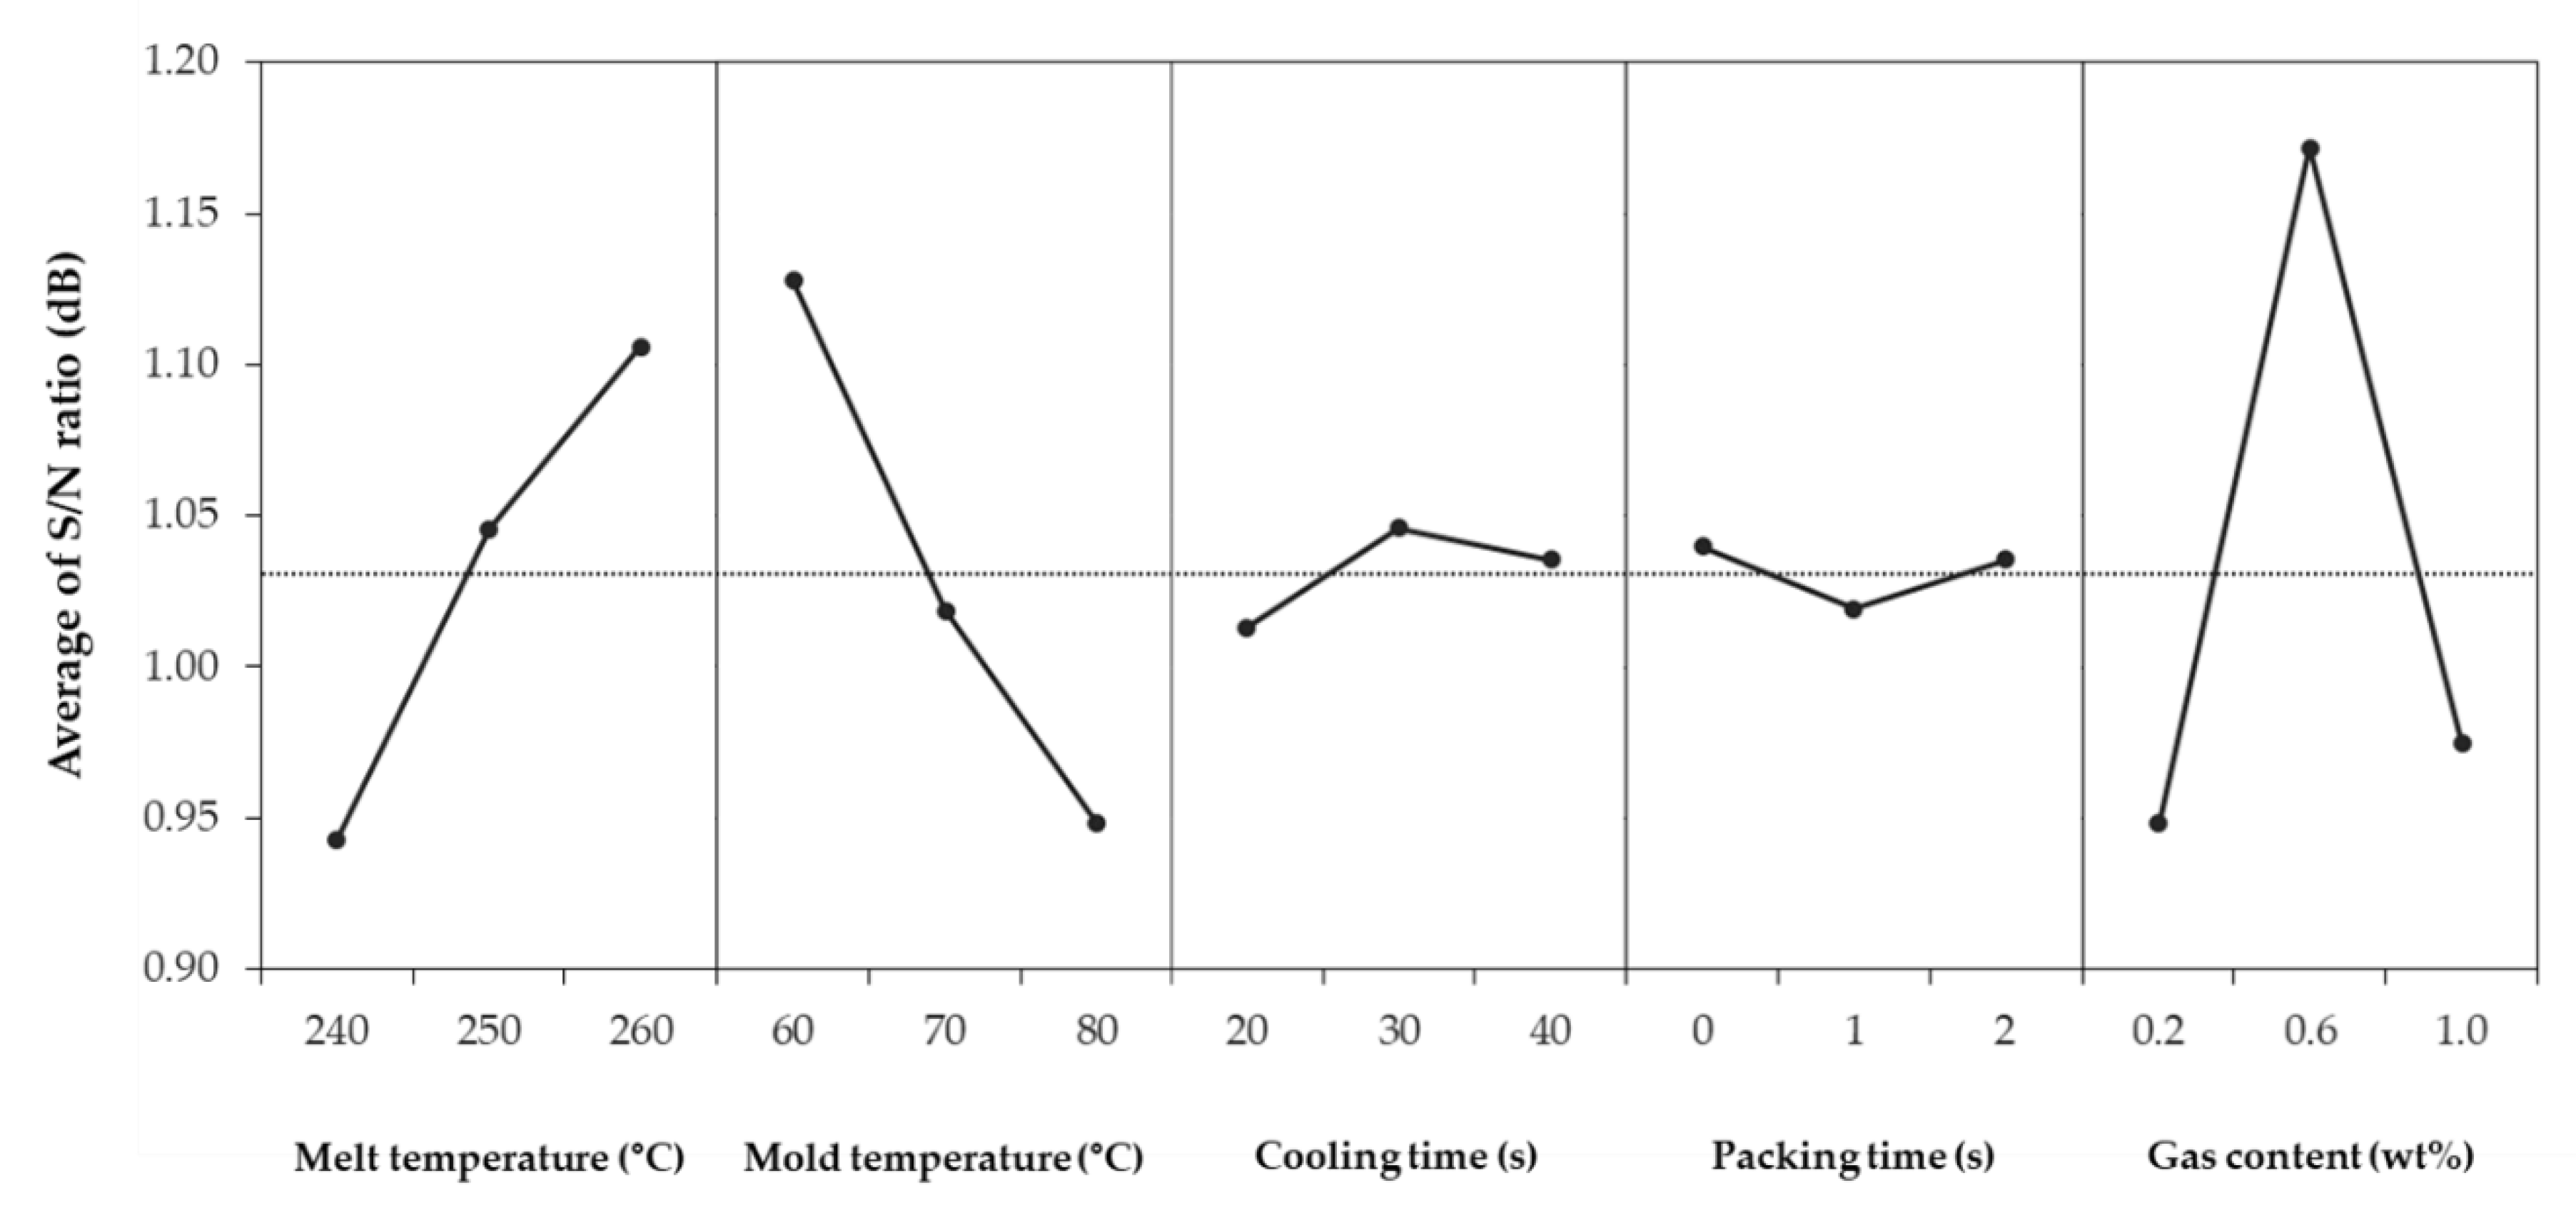
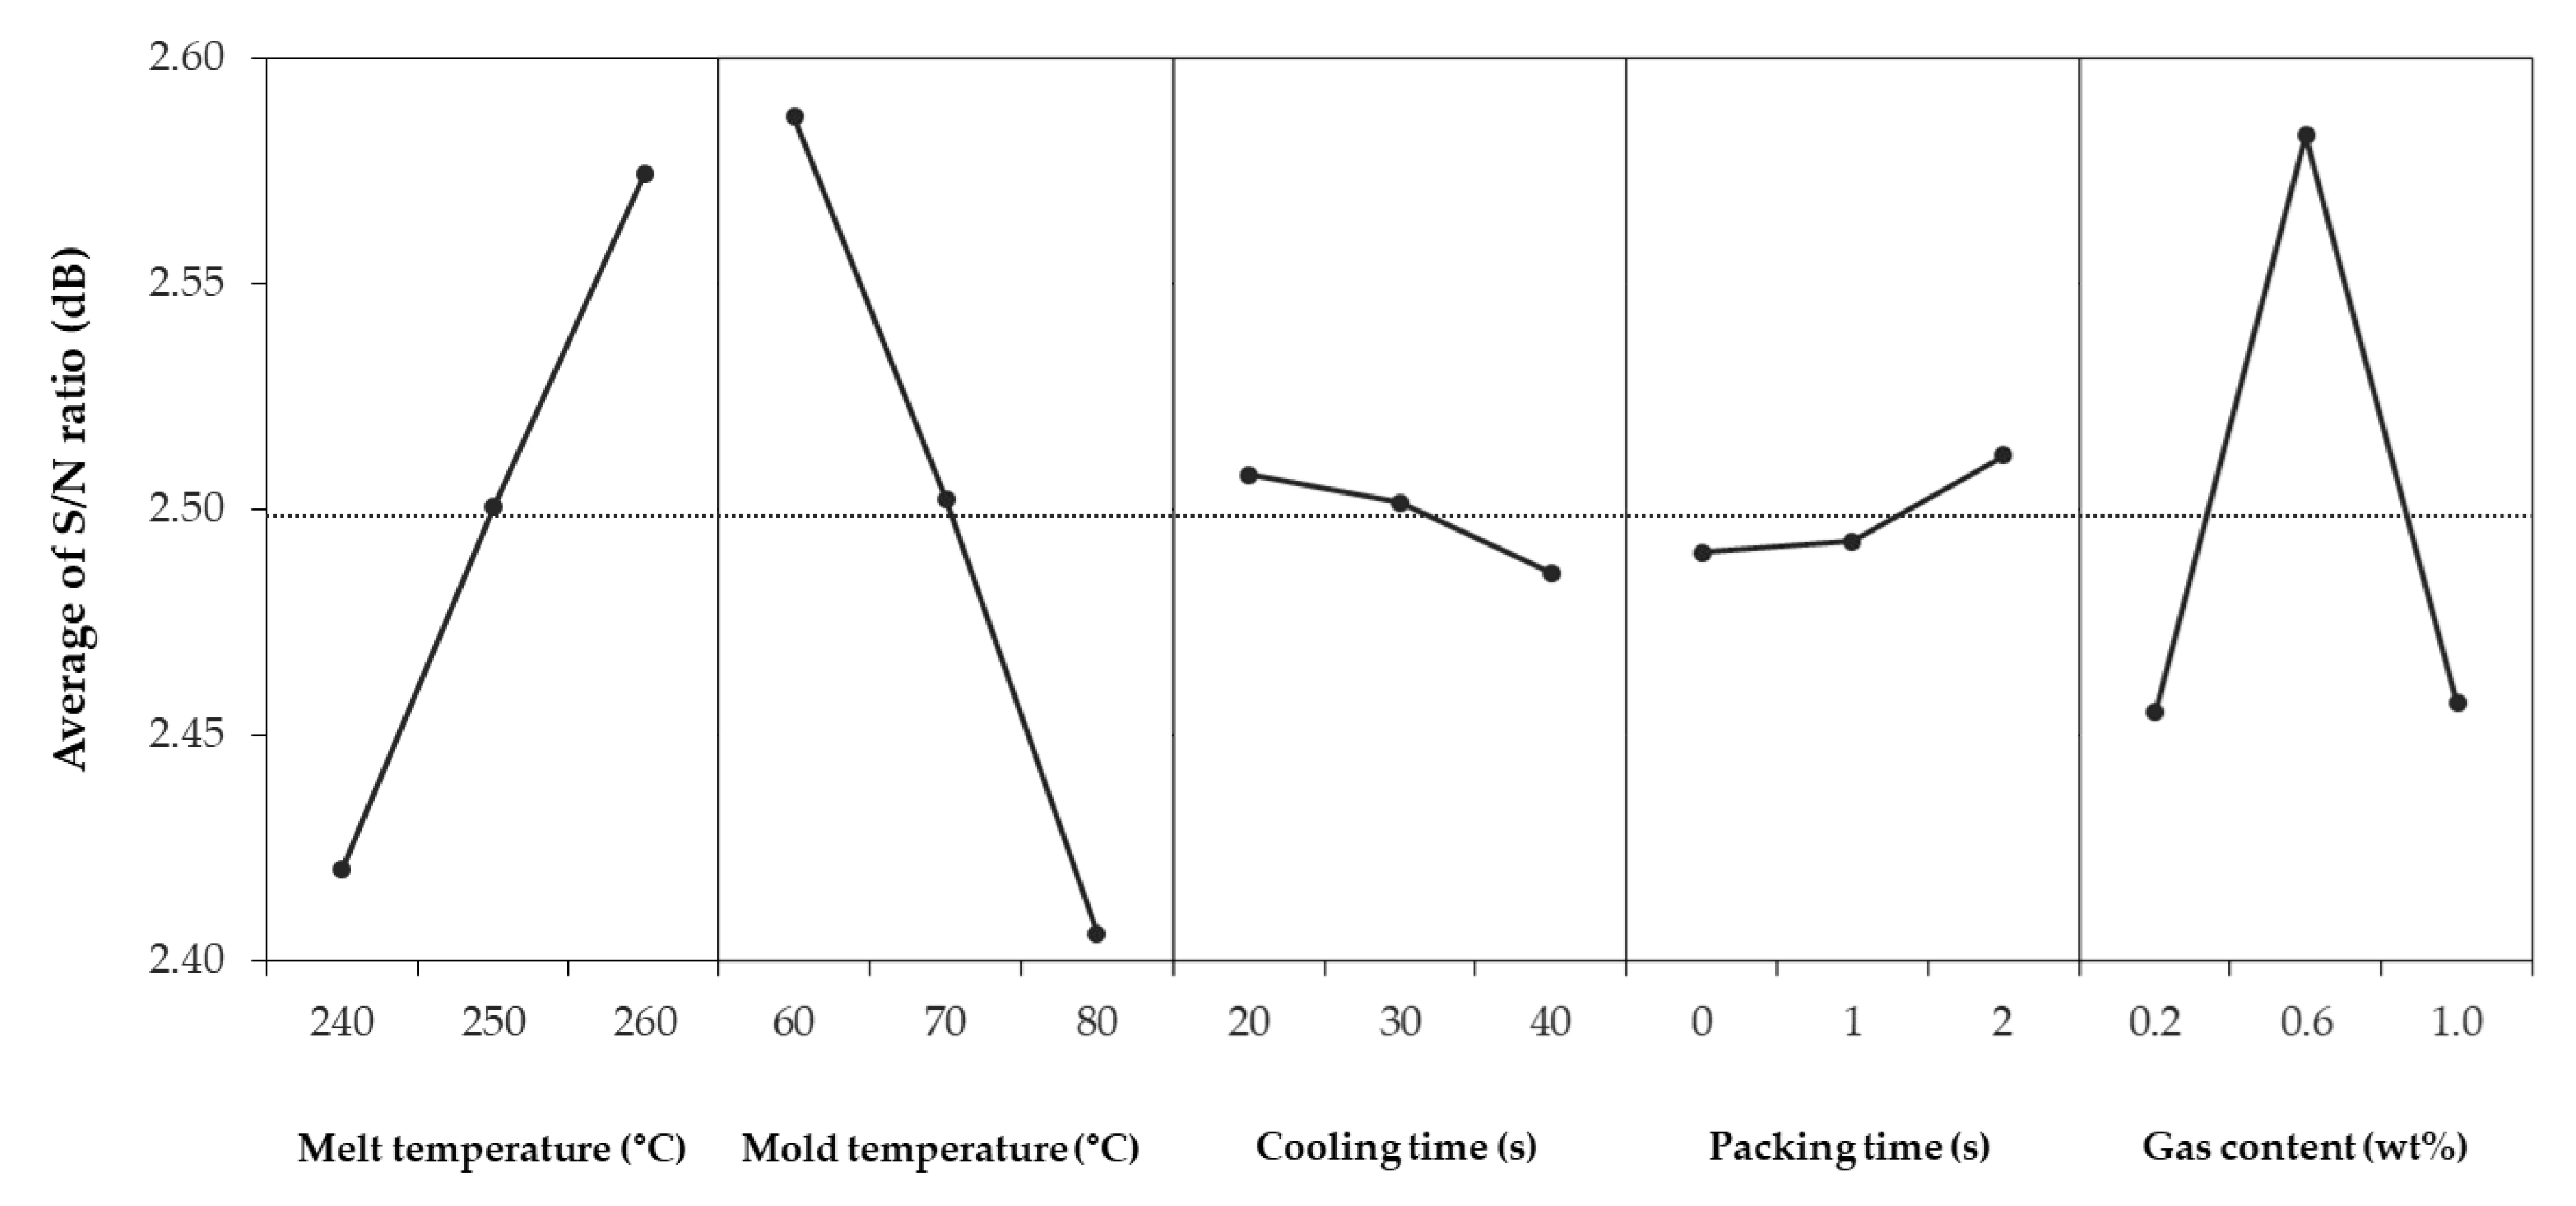
In this study, process factors were selected with the objective of minimizing the shrinkage and warpage of PA6/GF in microcellular foam injection molding process. These factors were melt temperature, mold temperature, cooling time, packing time, and gas content. Additionally, three levels of each factor were determined according to the recommended level range.
Based on the selected factors and levels, DOE was used, and 27 simulations were performed through the injection molding analysis software Autodesk Moldflow Insight. The results were analyzed using the Taguchi method, ANOVA and RSM to determine the influence and optimal combination of process factors.
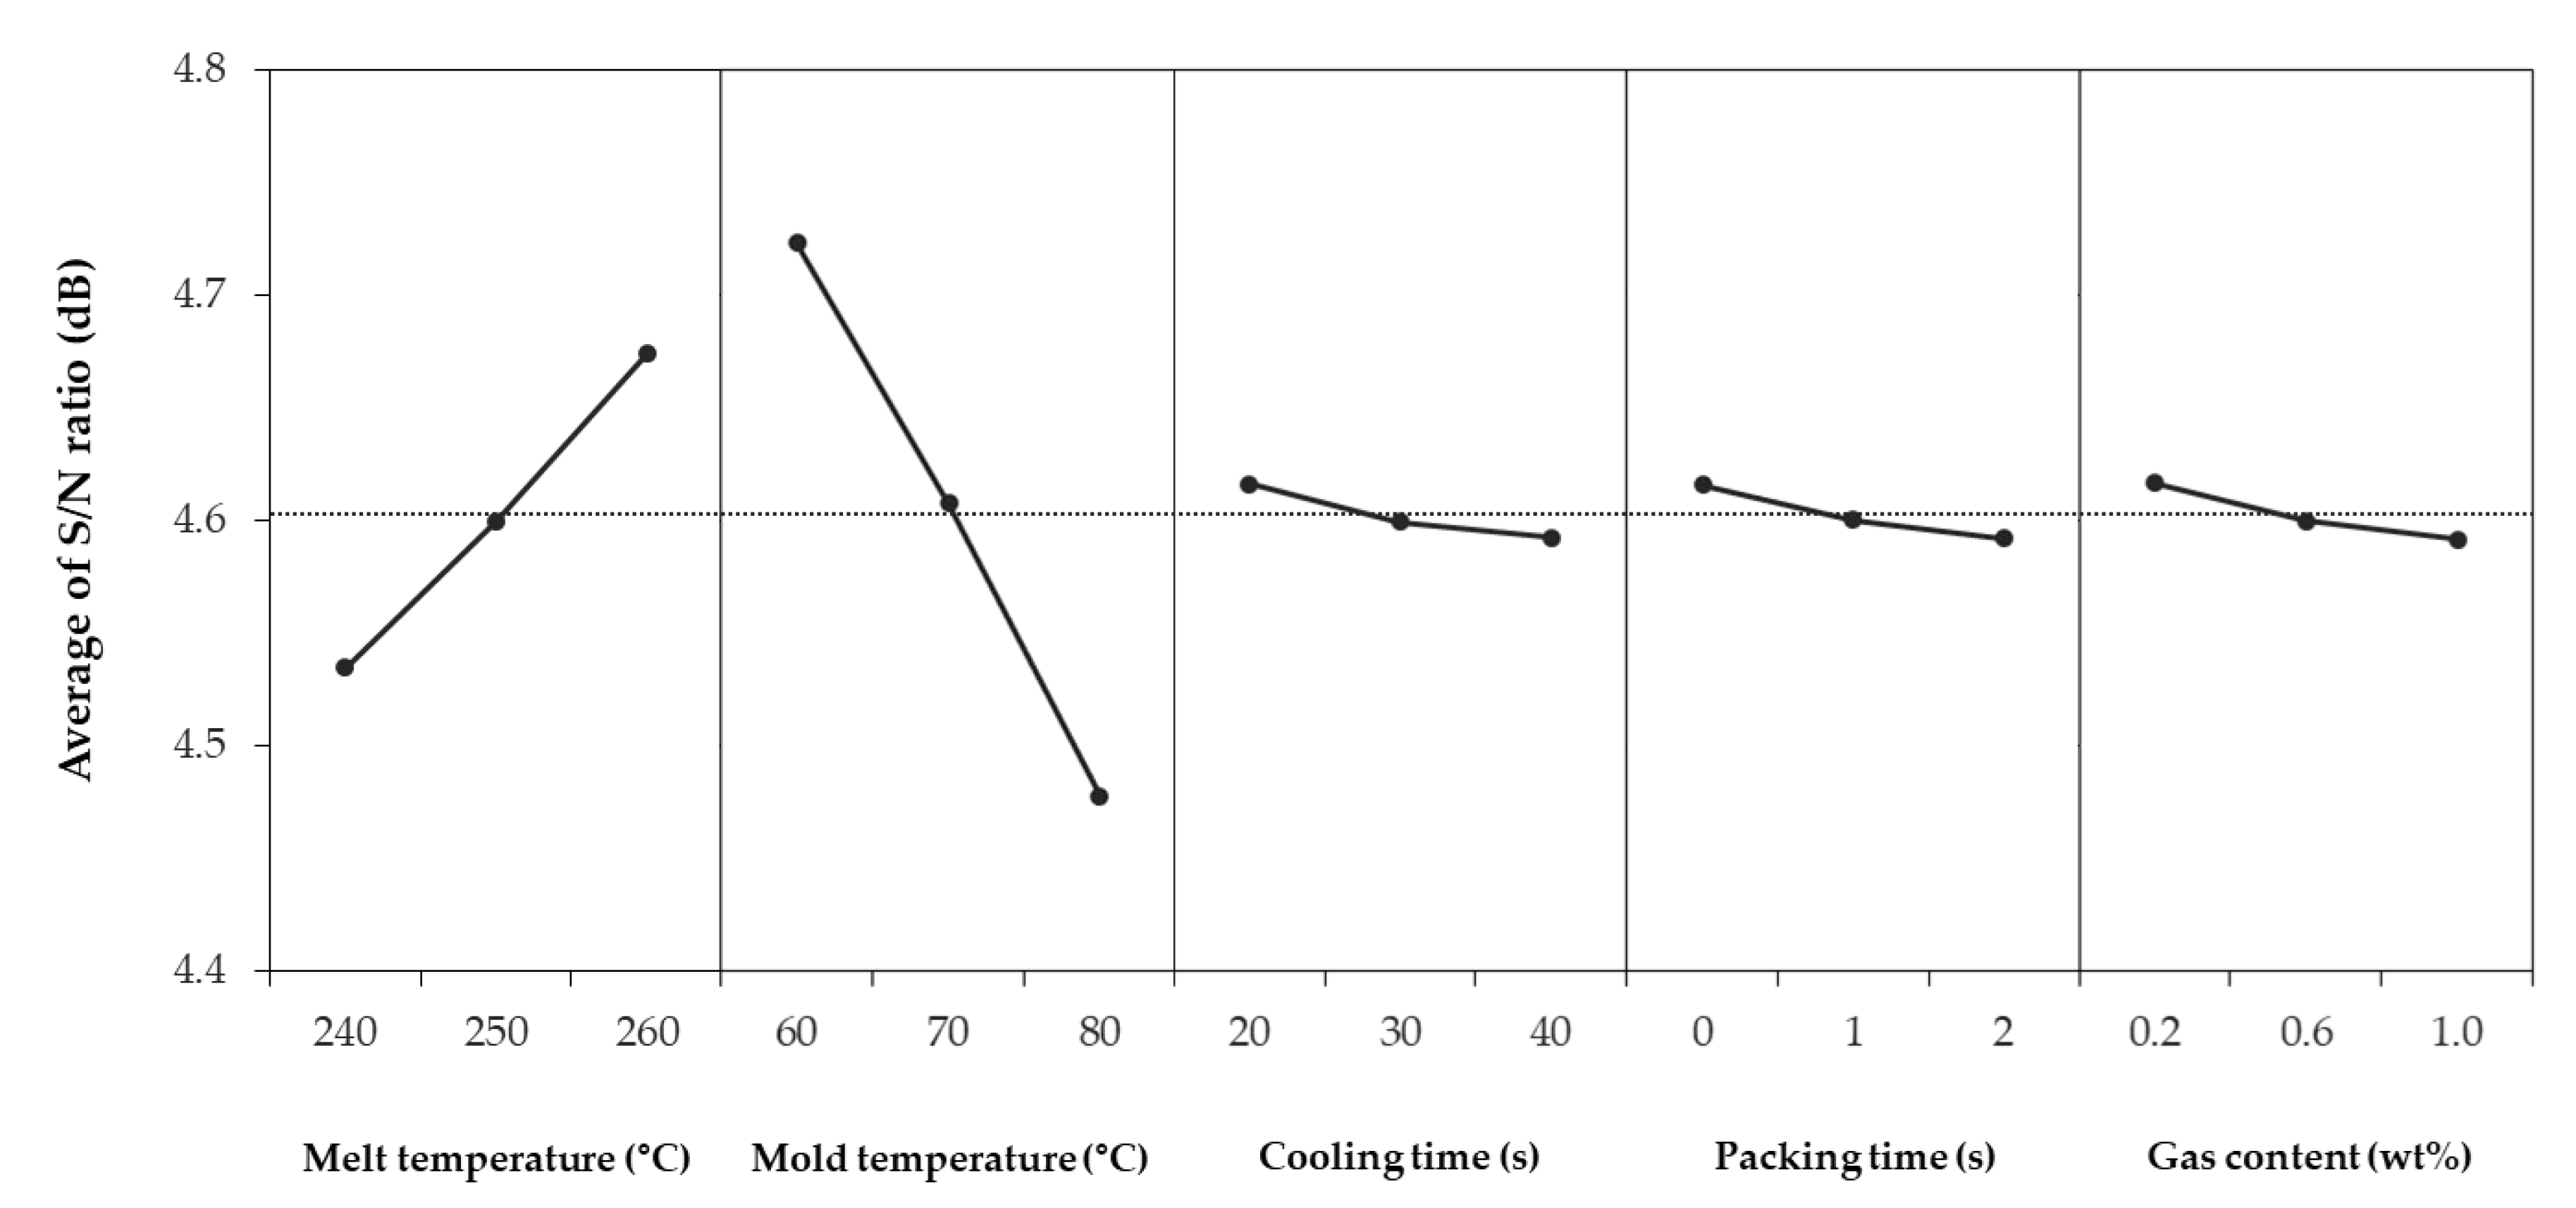
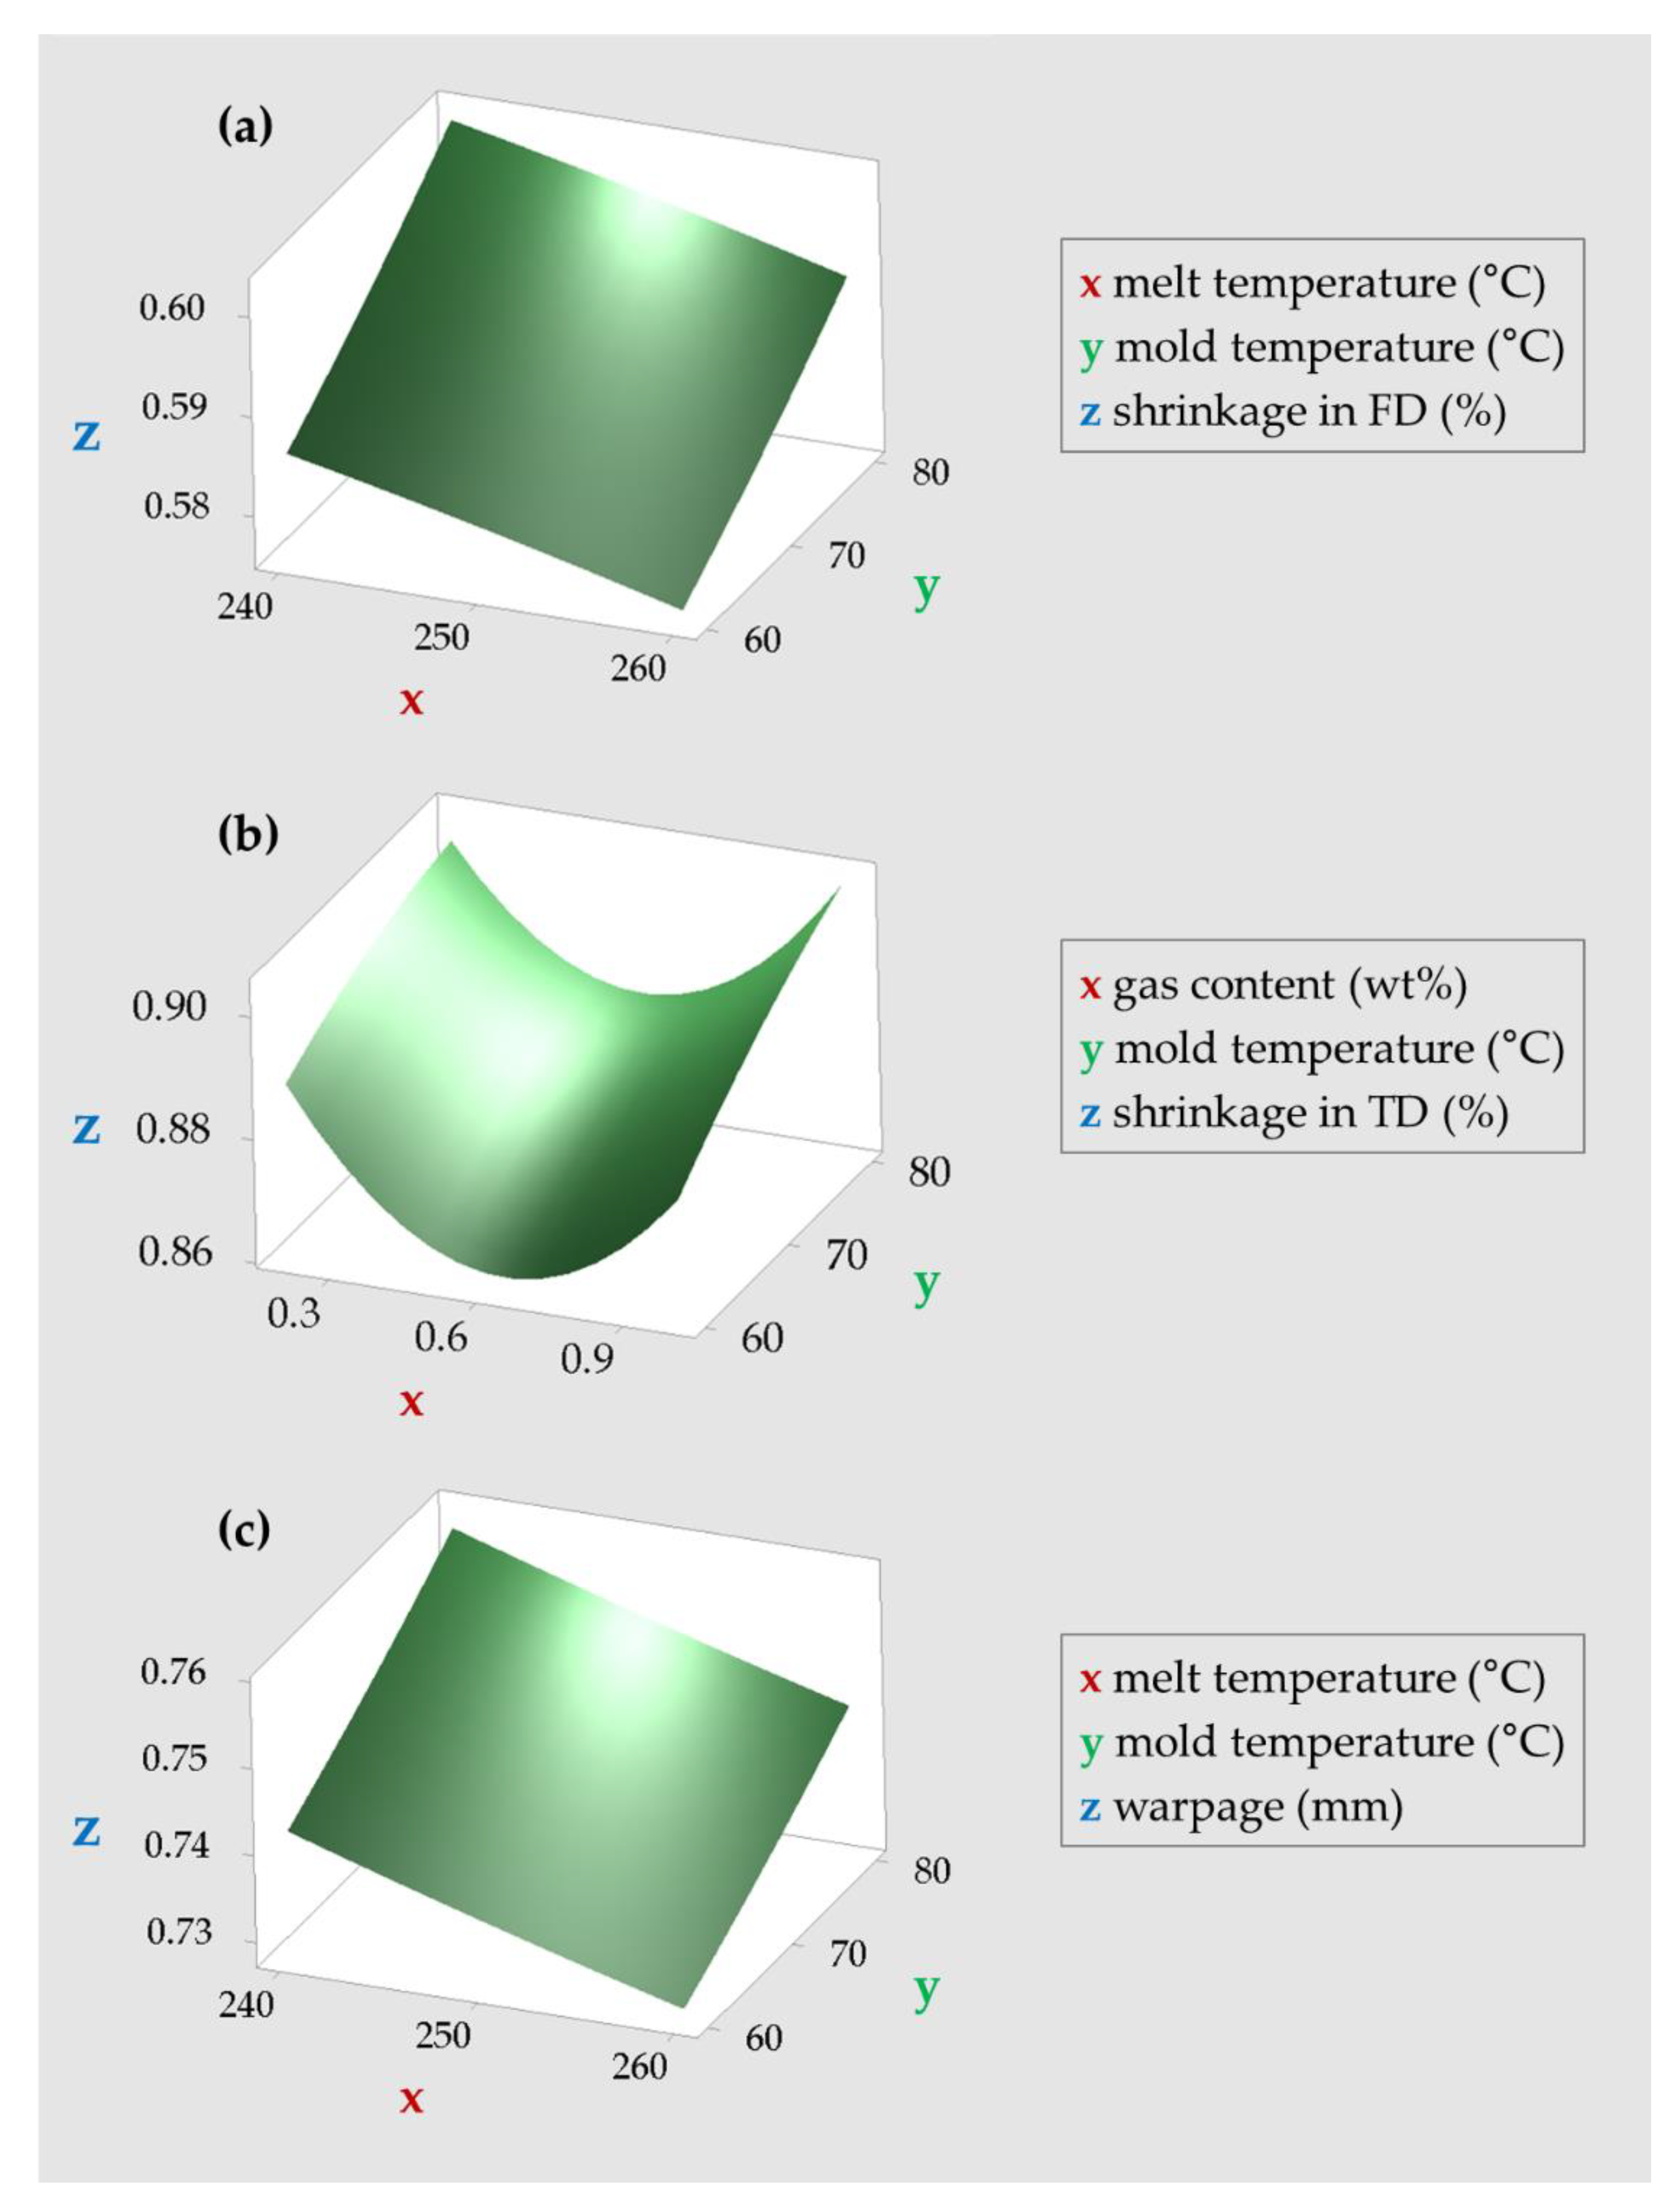
In case of the Taguchi method, both shrinkage and warpage were minimized when the melt temperature was 260 °C, mold temperature was 60 °C, cooling time was 23.33 s, packing time was 0.67 s, and gas content was 0.47 wt%. As a result of analyzing the influence of each factor by ANOVA, it was observed that the mold and melt temperatures had a significant effect on shrinkage and warpage overall; except in the case of the shrinkage in the FD, gas content was also significant. For the microcellular foam injection molding process, it was found that the influence of gas content is as important as the existing injection molding process factors. In contrast, cooling and packing times were determined to be relatively insignificant. For RSM, shrinkage and warpage were minimized at a melt temperature of 260 °C, a mold temperature of 60 °C, a cooling time of 26.26 s, a packing time of 0 s, and a gas content of 0.56 wt%.
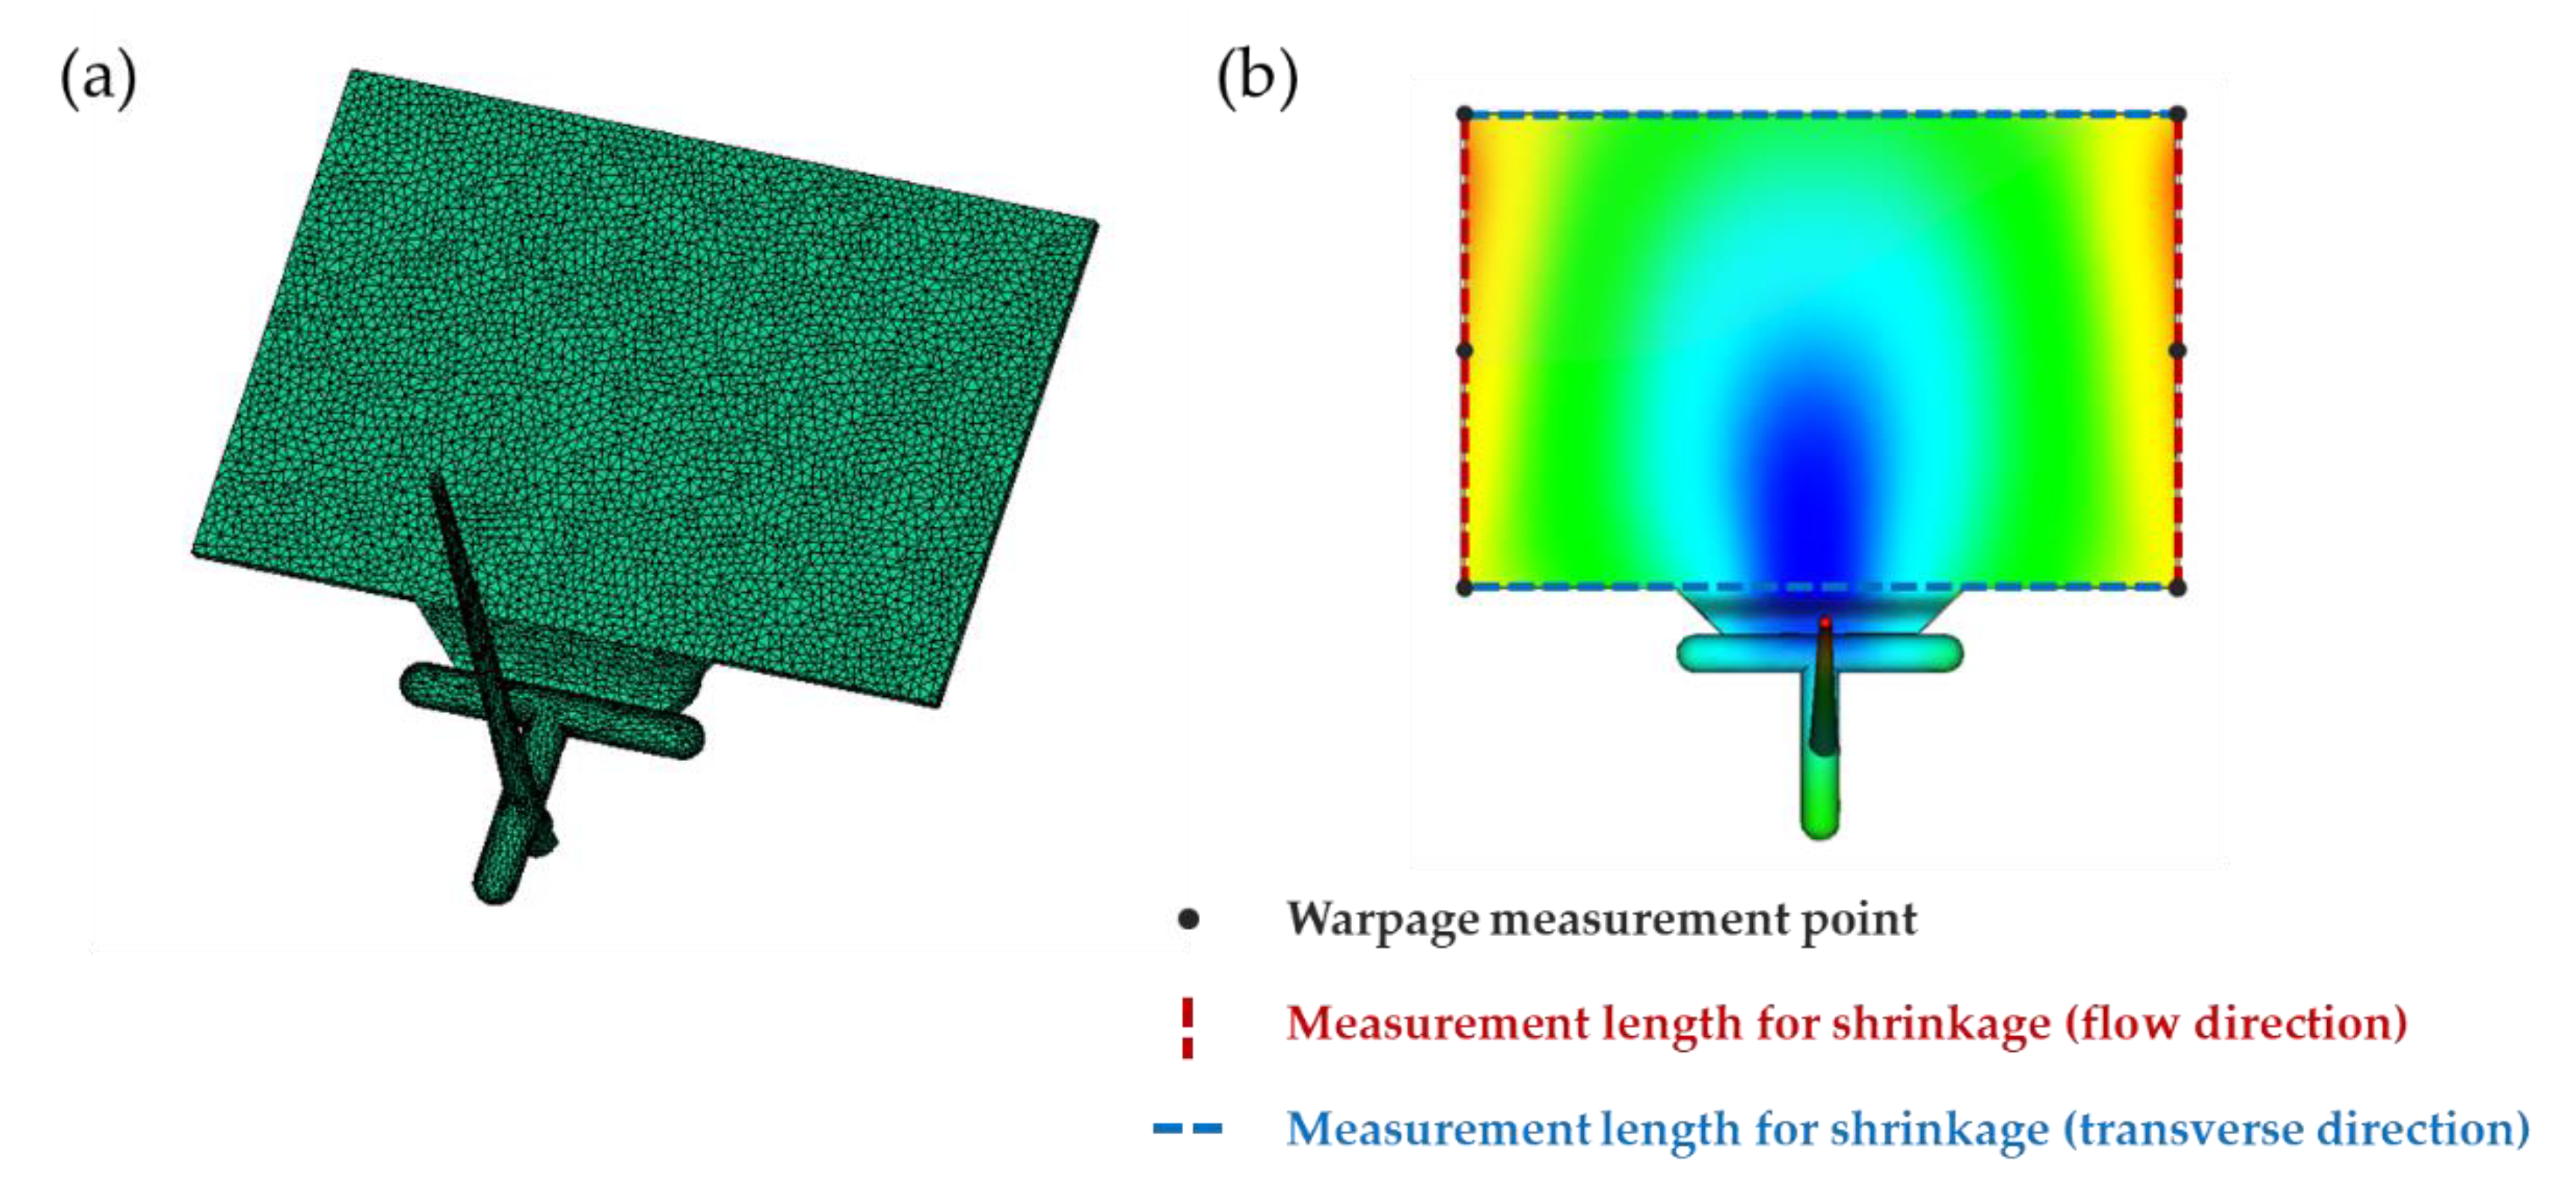
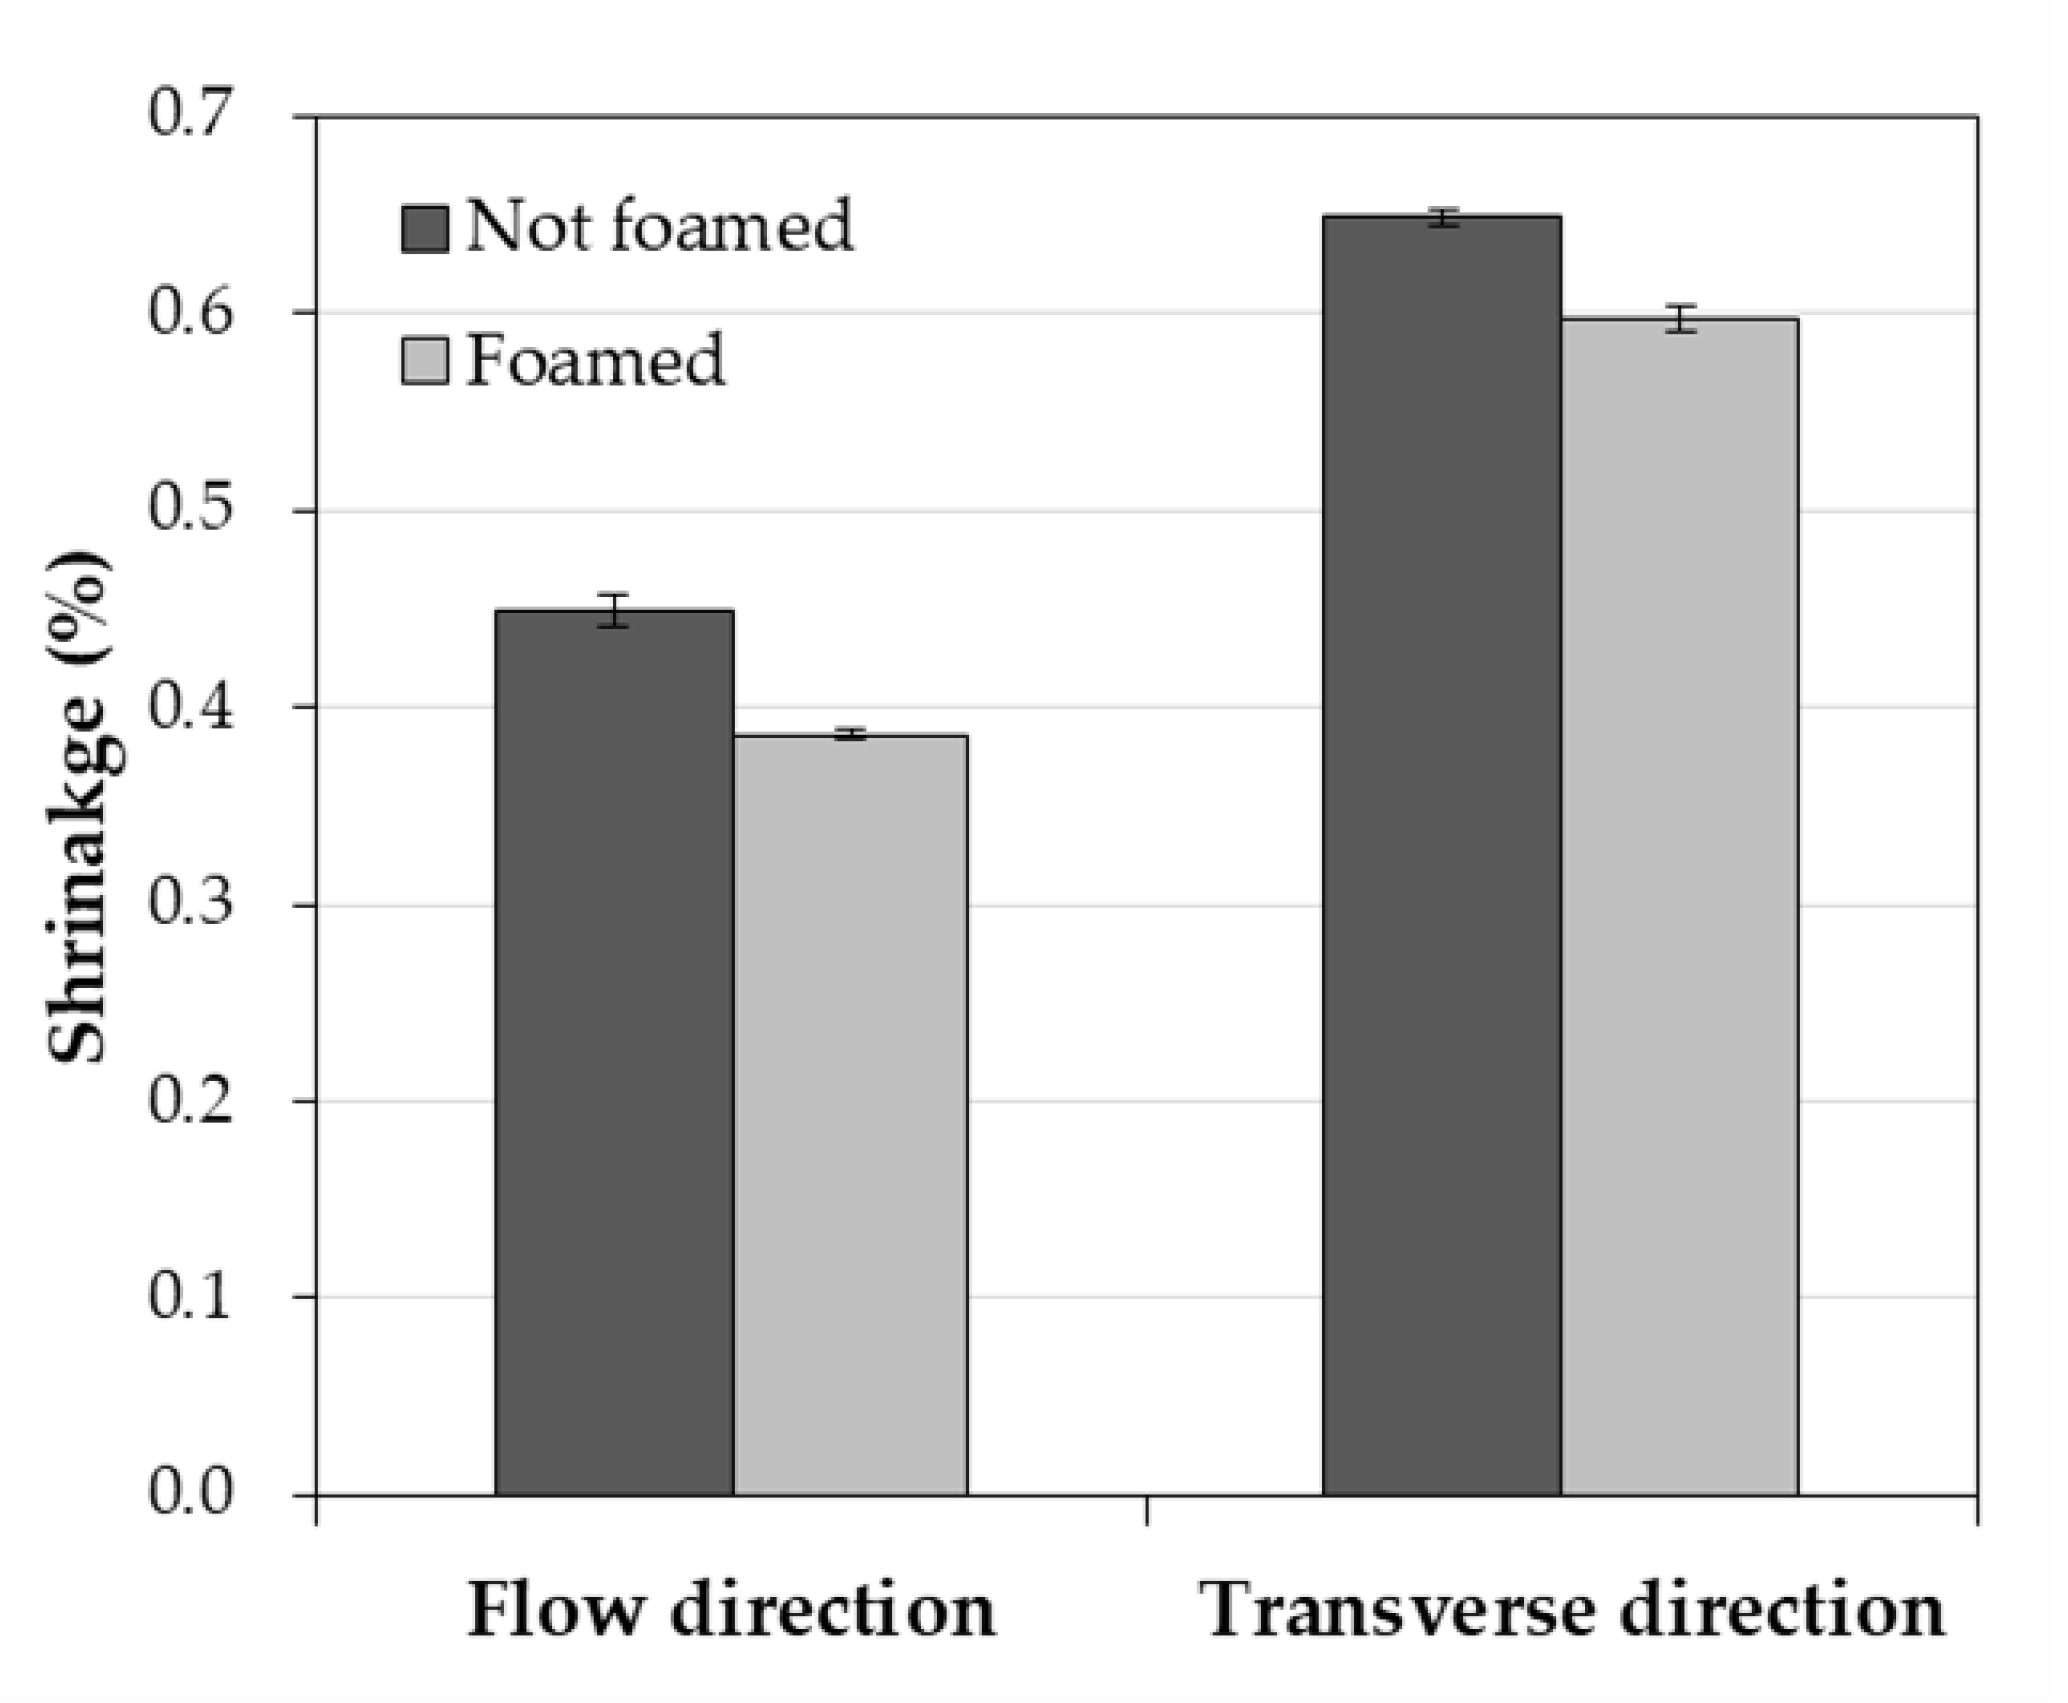
When comparing the shrinkage and warpage under the two conditions derived from the Taguchi method and RSM, the combination derived from the Taguchi method showed smaller shrinkage and warpage in the simulation. In conclusion, the combination from the Taguchi method was the optimum condition in comparison with RSM. The measured shrinkage and warpage of the optimal combination are as follows: the shrinkage in the FD was 0.386%, the shrinkage in the TD was 0.598%, and the warpage was 0.715 mm.
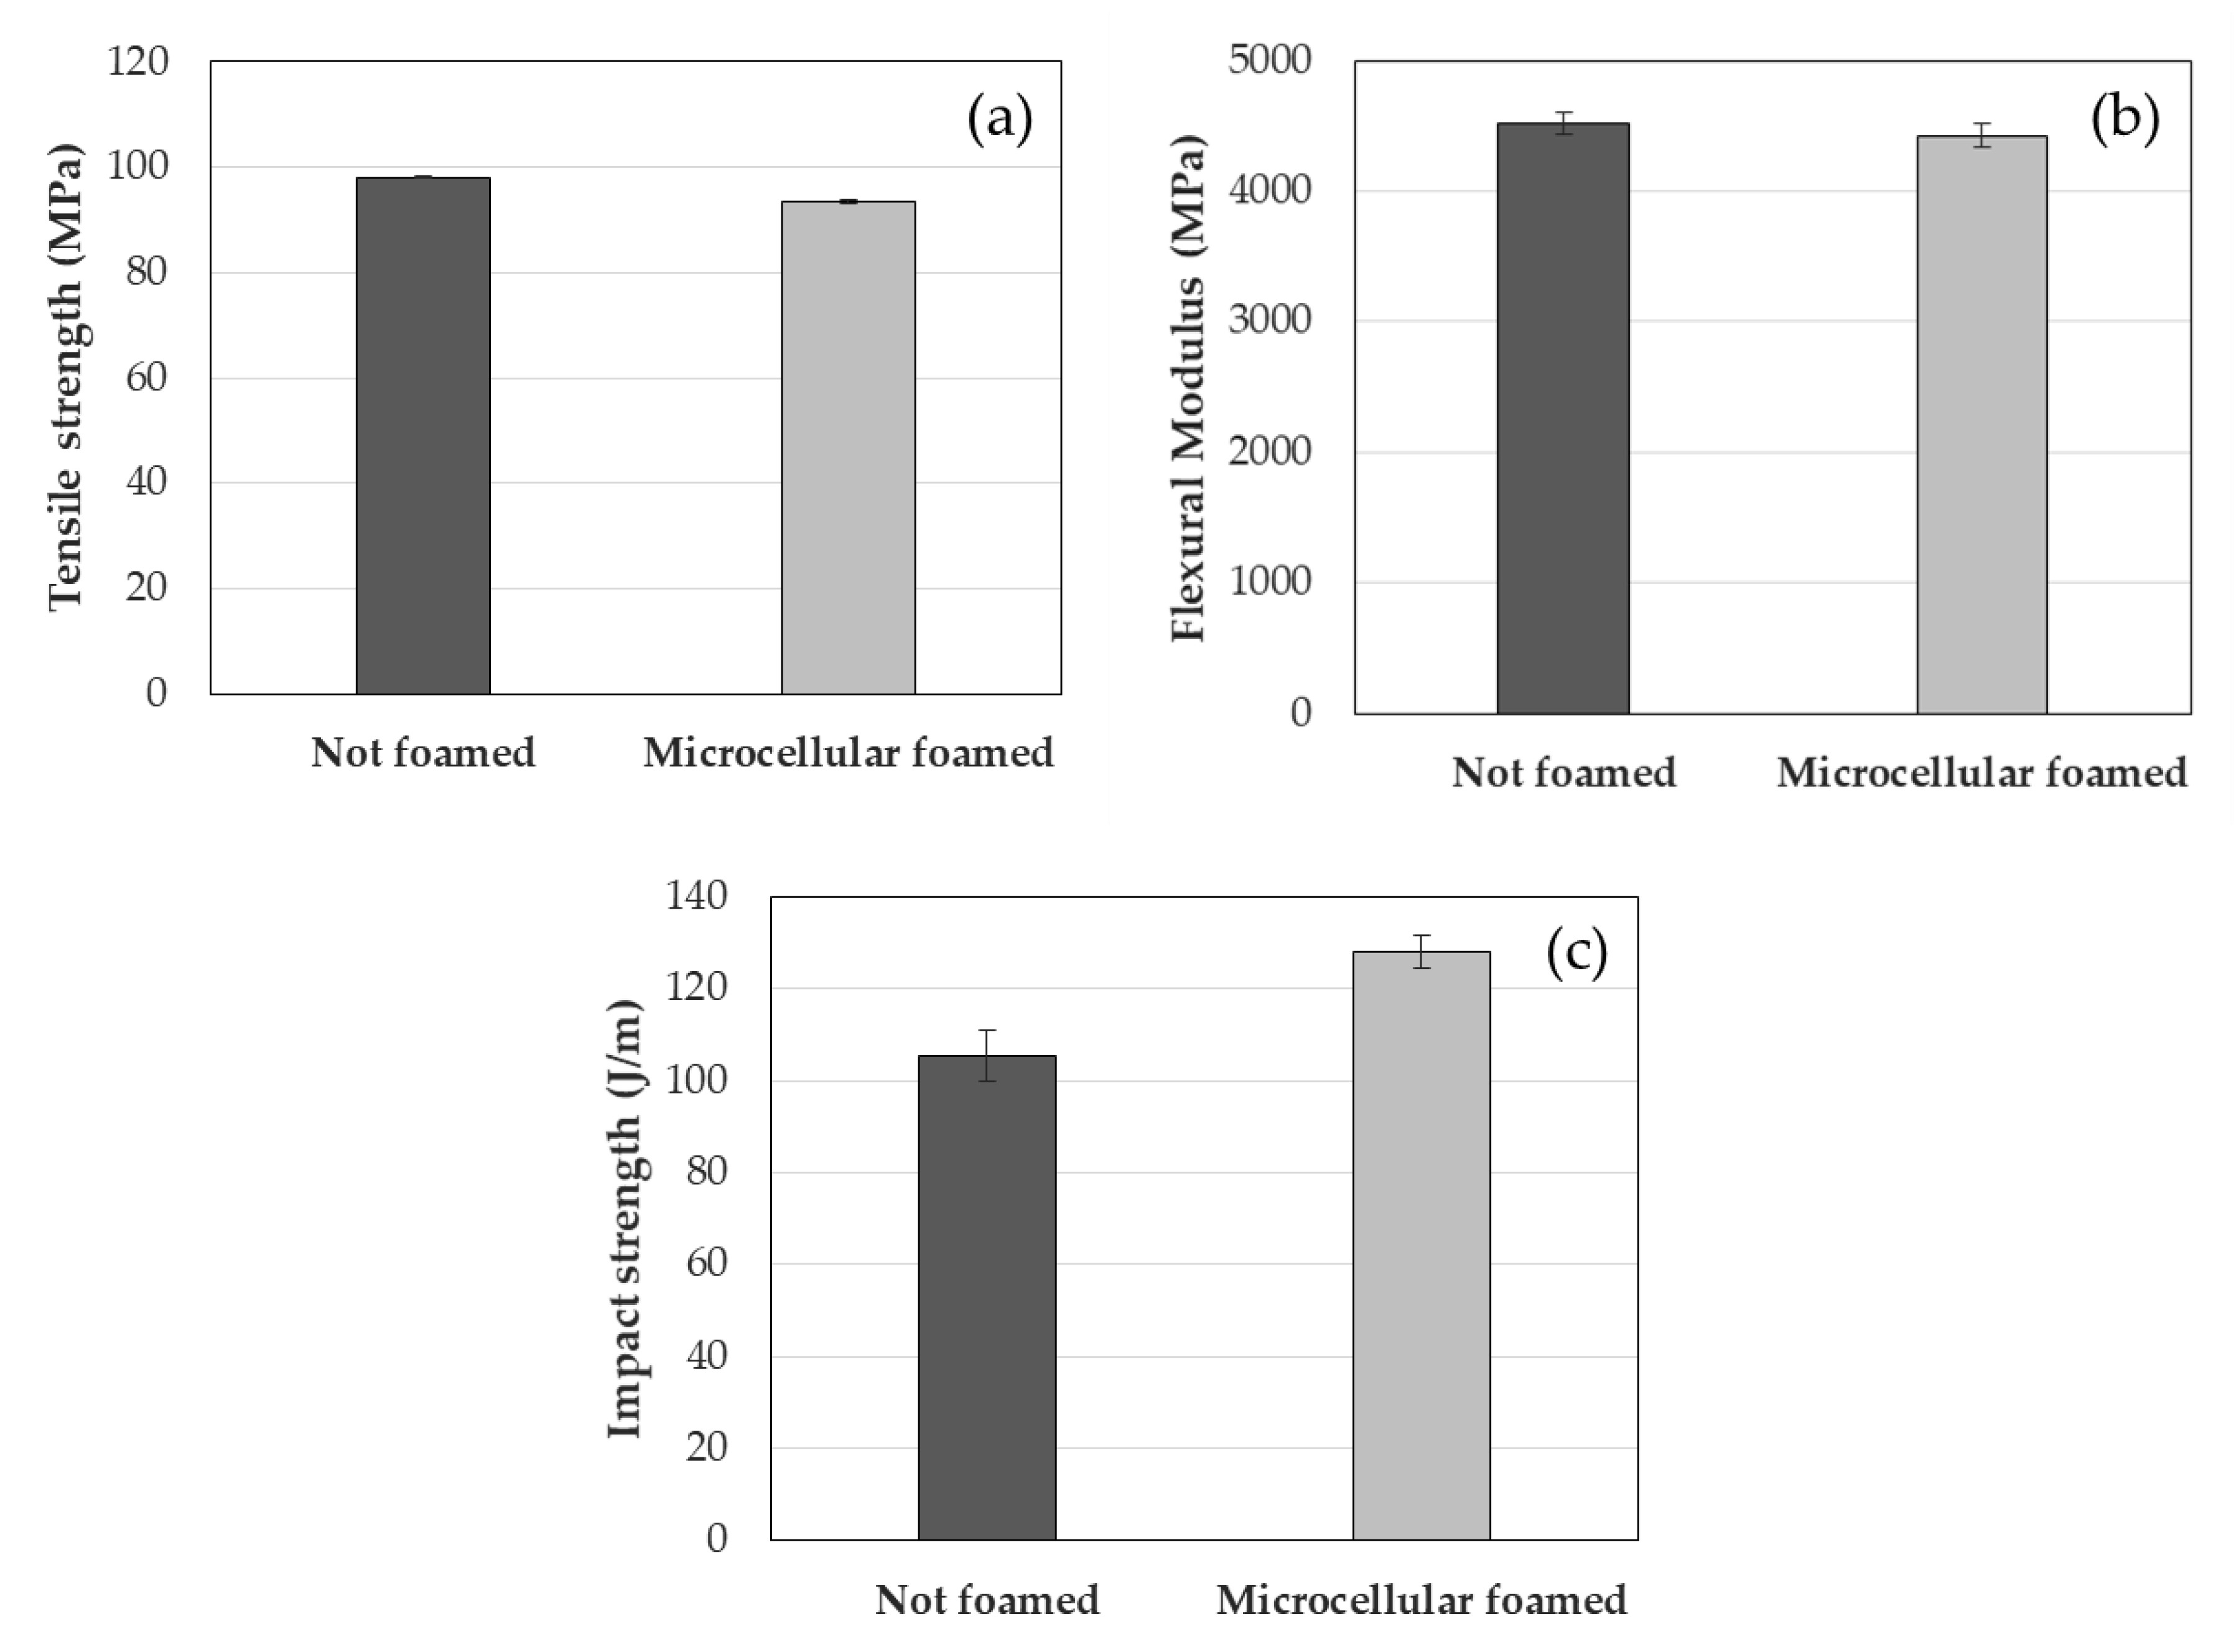
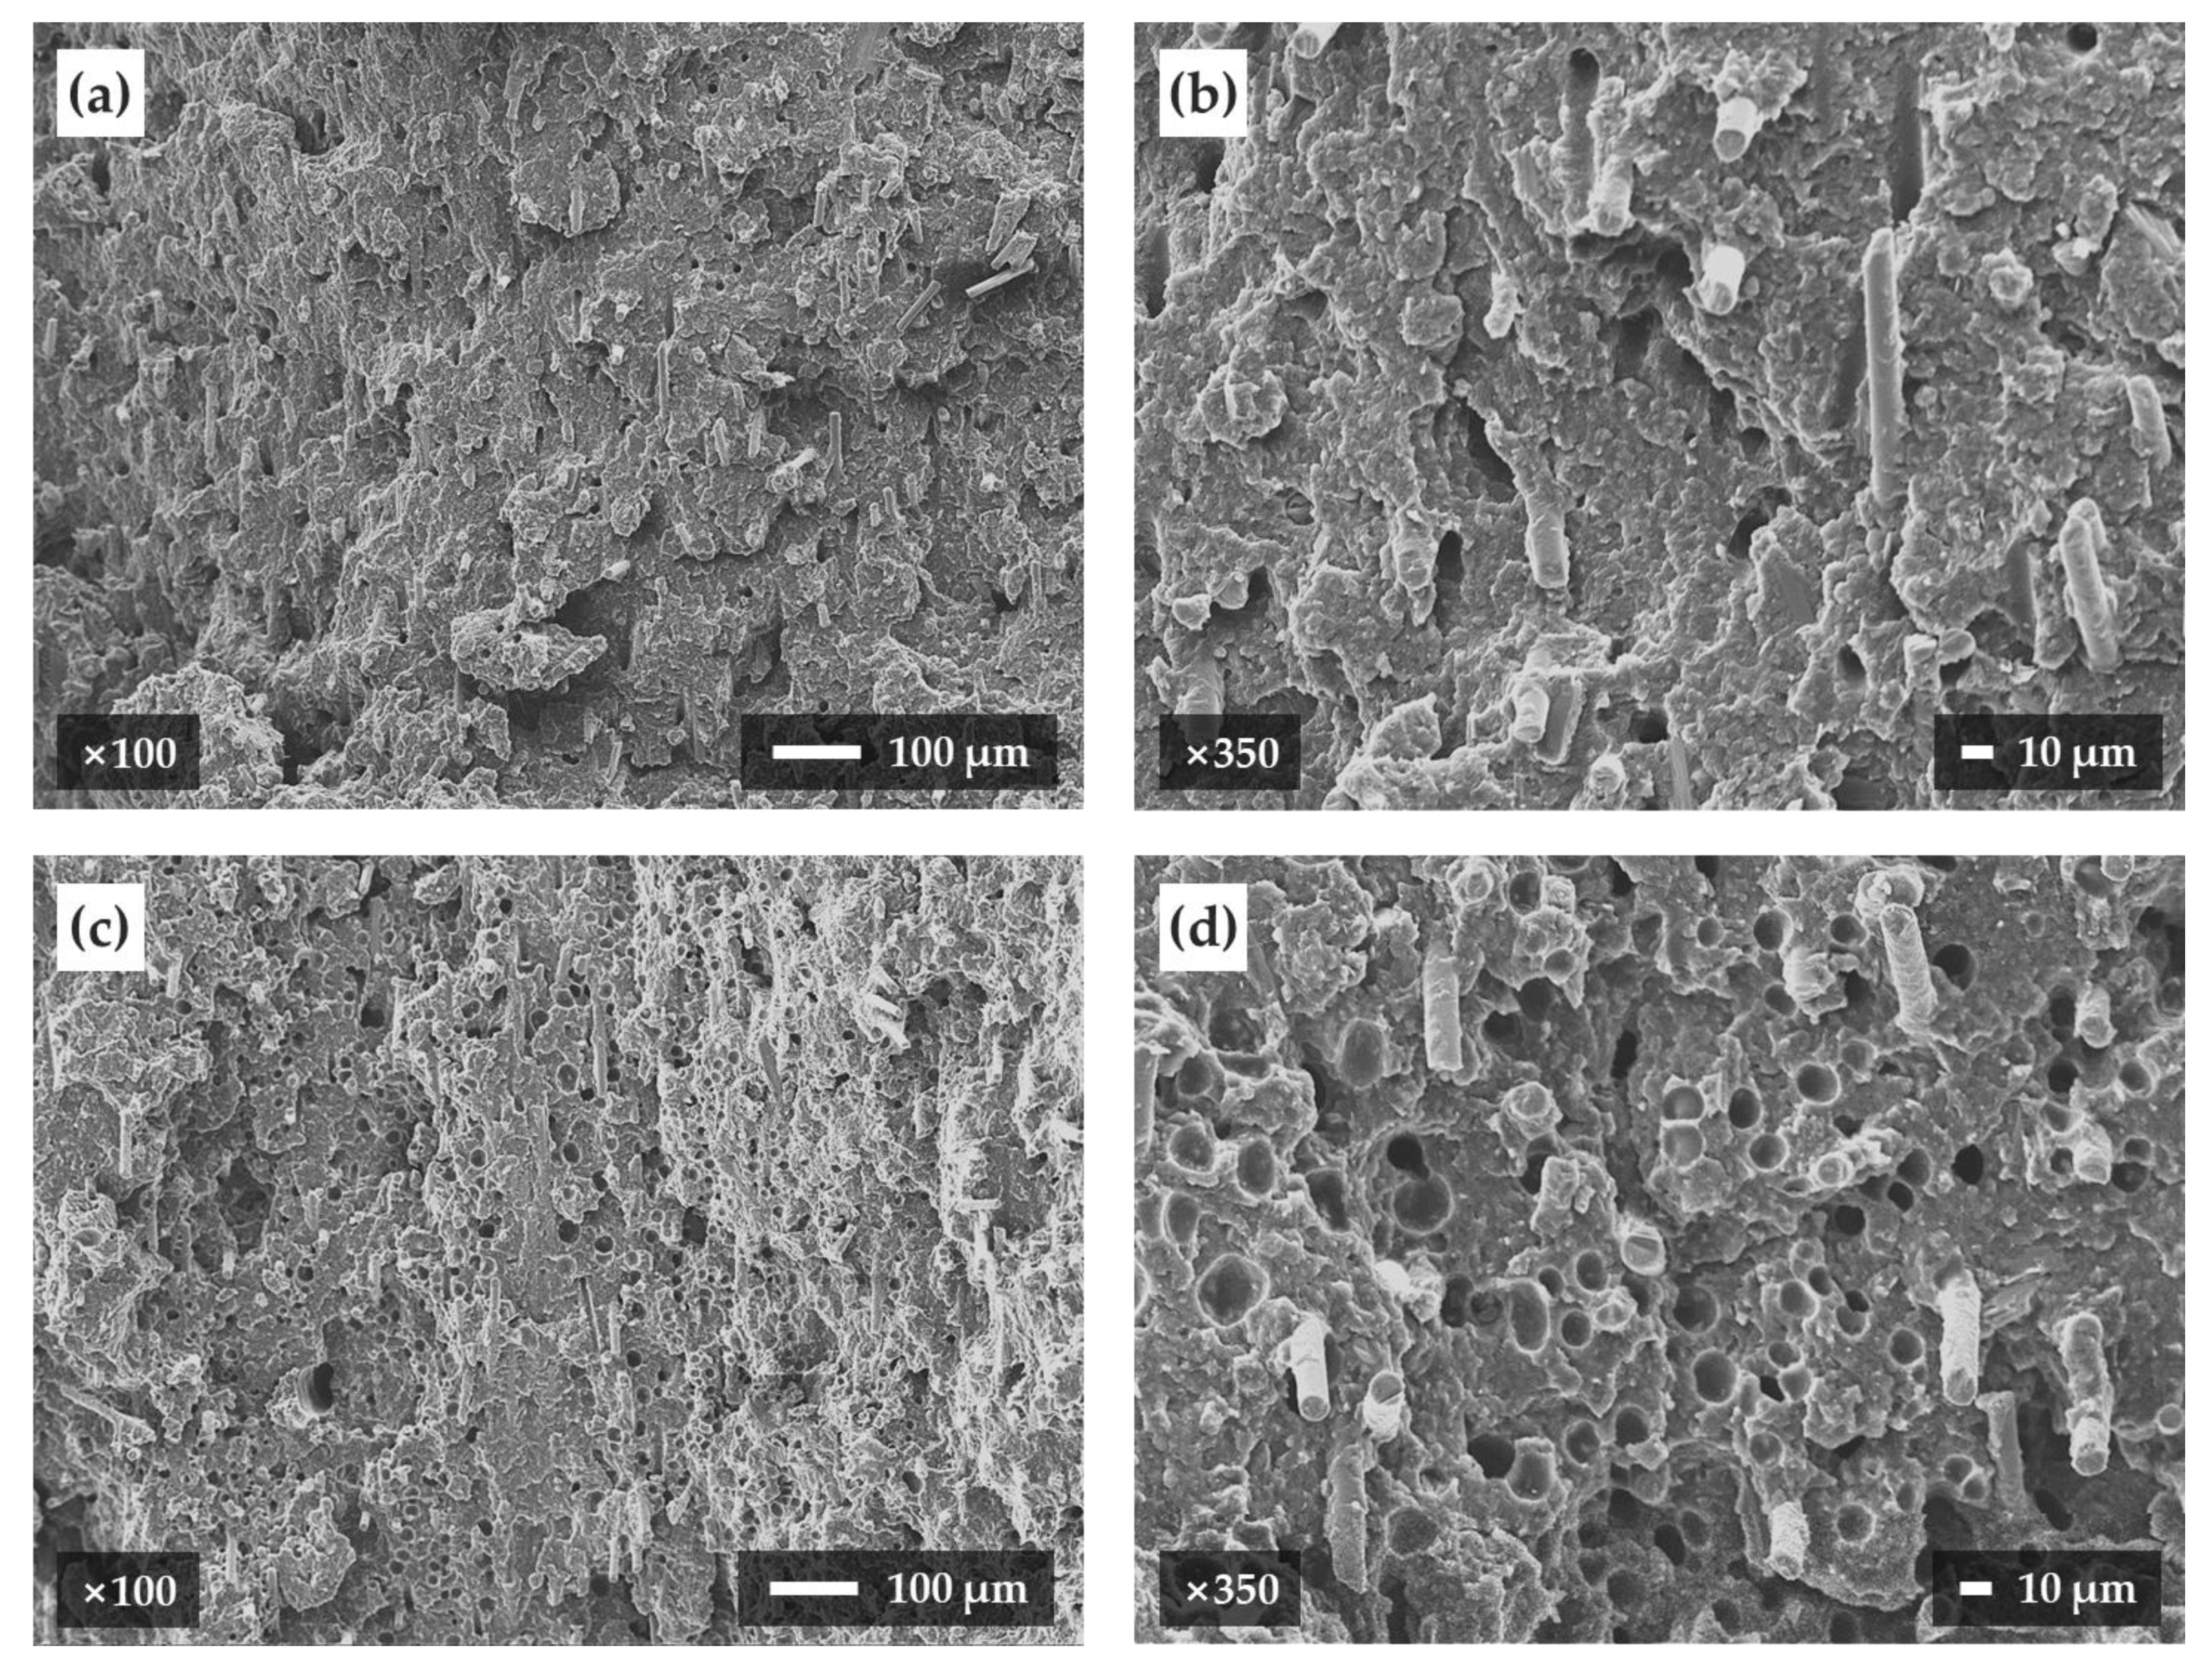
Additionally, the unfoamed and microcellular foamed samples were compared experimentally to confirm shrinkage, warpage, mechanical properties, and cell morphology. The foamed samples exhibited reduced shrinkage and warpage relative to the unfoamed samples, and an improved impact strength. Lastly, it was confirmed that microcells having on average size of 9.87 µm were formed in the cross-section of the foamed sample.

Author Contributions

Conceptualization, Y.R.; methodology, Y.R.; software, Y.R.; formal analysis, Y.R.; investigation, C.-S.Y.; data curation, C.-S.Y.; writing—original draft preparation, Y.R.; writing—review and editing, S.W.C. and J.S.S.; visualization, J.S.S.; supervision, S.W.C. All authors have read and agreed to the published version of the manuscript.

Funding

This research was supported by Basic Science Research Program through the National Research Foundation of Korea (NRF) funded by the Ministry of Education (No. NRF-2018R1D1A1B07049405).

Acknowledgments

The authors would like to acknowledge Kolon Plastics Inc. for supporting the materials used in the experiment.

Conflicts of Interest

The authors declare no conflict of interest.

References

  1. Taub, A.I.; Luo, A.A. Advanced lightweight materials and manufacturing processes for automotive applications. MRS Bull. 2015, 40, 1045–1053. [Google Scholar] [CrossRef] [Green Version]
  2. Mallick, P.K. Thermoplastics and thermoplastic-matrix composites for lightweight automotive structures. In Materials, Design and Manufacturing for Lightweight Vehicles; Elsevier Ltd.: Amsterdam, The Netherlands, 2010; pp. 174–207. [Google Scholar]
  3. Khosravani, M.R.; Nasiri, S. Injection molding manufacturing process: Review of case-based reasoning applications. J. Intell. Manuf. 2019. [Google Scholar] [CrossRef]
  4. Whiteside, B.R.; Coates, P.D.; Hine, P.J.; Duckett, R.A. Glass fibre orientation within injection moulded automotive pedal simulation and experimental studies. Plast. Rubber Compos. Process. Appl. 2000, 29, 38–45. [Google Scholar] [CrossRef]
  5. Spina, R. Injection moulding of automotive components: Comparison between hot runner systems for a case study. J. Mater.Process. Technol. 2004, 155, 1497–1504. [Google Scholar] [CrossRef]
  6. Panthapulakkal, S.; Sain, M. Injection-molded short hemp fiber/glass fiber-reinforced polypropylene hybrid composites -mechanical, water absorption and thermal properties. J. Appl. Polym. Sci. 2007, 103, 2432–2441. [Google Scholar] [CrossRef]
  7. Park, H.S.; Pham, N.H. Design of conformal cooling channels for an automotive part. Int. J. Autom. Technol. 2009, 10, 87–93. [Google Scholar] [CrossRef]
  8. Farshi, B.; Gheshmi, S.; Miandoabchi, E. Optimization of injection molding process parameters using sequential simplex algorithm. Mater. Des. 2011, 32, 414–423. [Google Scholar] [CrossRef]
  9. Kuram, E. Micro-machinability of injection molded polyamide 6 polymer and glass-fiber reinforced polyamide 6 composite. Compos. Part Eng. 2016, 88, 85–100. [Google Scholar] [CrossRef]
  10. Park, S.W.; Choi, J.H.; Lee, B.C. Multi-objective optimization of an automotive body component with fiber-reinforced composites. Struct. Multidiscip. Optim. 2018, 58, 2203–2217. [Google Scholar] [CrossRef]
  11. Pierick, D.; Jacobsen, K. Injection molding innovation: The microcellular foam process. Plast. Eng. 2001, 57, 46–51. [Google Scholar]
  12. Okolieocha, C.; Raps, D.; Subramaniam, K.; Altstädt, V. Microcellular to nanocellular polymer foams: Progress (2004-2015) and future directions—A review. Eur. Polym. J. 2015, 73, 500–519. [Google Scholar] [CrossRef]
  13. Rohleder, M.; Jakob, F. 2—Foam Injection Molding. In Specialized Injection Molding Techniques; Heim, H.-P., Ed.; William Andrew Publishing: Norwich, NY, USA, 2016; pp. 53–106. [Google Scholar]
  14. Kramschuster, A.; Cavitt, R.; Ermer, D.; Chen, Z.; Turng, L.S. Quantitative study of shrinkage and warpage behavior for microcellular and conventional injection molding. Polym. Eng. Sci. 2005, 45, 1408–1418. [Google Scholar] [CrossRef]
  15. Zafar, R.; Lee, K.S.; Kim, H.B.; Jeon, B.J.; Cha, S.W. Effect of increased weight reduction on shrinkage of injection-molded parts using microcellular foaming process. Polym. Plast. Technol. Eng. 2008, 47, 1187–1192. [Google Scholar] [CrossRef]
  16. Kim, H.K.; Sohn, J.S.; Ryu, Y.; Kim, S.W.; Cha, S.W. Warpage reduction of glass fiber reinforced plastic using microcellular foaming process applied injection molding. Polymers 2019, 11, 360. [Google Scholar] [CrossRef] [Green Version]
  17. Cho, S.H.; Kim, H.K.; Sohn, J.S.; Ryu, Y.; Cha, S.W. Effect of foaming processes on the reduction of warpage in glass fiber reinforced plastic composites. J. Mech. Sci. Technol. 2019, 33, 4227–4232. [Google Scholar] [CrossRef]
  18. Bledzki, A.K.; Zhang, W.; Faruk, O. Microfoaming of flax and wood fibre reinforced polypropylene composites. Holz Roh Werkstoff 2005, 63, 30–37. [Google Scholar] [CrossRef]
  19. Cha, S.W.; Yoon, J.D. Label behavior property attached on microcellular foamed parts. J. Appl. Polym. Sci. 2005, 98, 289–293. [Google Scholar] [CrossRef]
  20. Bledzki, A.K.; Faruk, O. Influence of processing temperature on microcellular injection-moulded wood-polypropylene composites. Macromol. Mater. Eng. 2006, 291, 1226–1232. [Google Scholar] [CrossRef]
  21. Sun, X.; Kharbas, H.; Turng, L.S. Fabrication of highly expanded thermoplastic polyurethane foams using microcellular injection molding and gas-laden pellets. Polym. Eng. Sci. 2015, 55, 2643–2652. [Google Scholar] [CrossRef]
  22. Kharbas, H.A.; McNulty, J.D.; Ellingham, T.; Thompson, C.; Manitiu, M.; Scholz, G.; Turng, L.S. Comparative study of chemical and physical foaming methods for injection-molded thermoplastic polyurethane. J. Cell. Plast. 2017, 53, 373–388. [Google Scholar] [CrossRef]
  23. Wang, G.; Zhao, G.; Dong, G.; Mu, Y.; Park, C.B. Lightweight and strong microcellular injection molded PP/talc nanocomposite. Compos. Sci. Technol. 2018, 168, 38–46. [Google Scholar] [CrossRef]
  24. Volpe, V.; Lanzillo, S.; Affinita, G.; Villacci, B.; Macchiarolo, I.; Pantani, R. Lightweight high-performance polymer composite for automotive applications. Polymers 2019, 11, 326. [Google Scholar] [CrossRef] [Green Version]
  25. Taguchi, G. System of Experimental Design: Engineering Methods to Optimize Quality and Minimize Costs; UNIPUB/Kraus International Publications: White Plains, NY, USA, 1987. [Google Scholar]
  26. Fisher, R.A. Statistical Methods for Research Workers; Oliver and Boyd: Edinburgh, UK, 1932. [Google Scholar]
  27. Oliaei, E.; Heidari, B.S.; Davachi, S.M.; Bahrami, M.; Davoodi, S.; Hejazi, I.; Seyfi, J. Warpage and Shrinkage Optimization of Injection-Molded Plastic Spoon Parts for Biodegradable Polymers Using Taguchi, ANOVA and Artificial Neural Network Methods. J. Mater. Sci. Technol. 2016, 32, 710–720. [Google Scholar] [CrossRef]
  28. Box, G.E.P.; Wilson, K.B. On the Experimental Attainment of Optimum Conditions. J. R. Stat. Soc. Ser. B (Methodol.) 1951, 13, 1–45. [Google Scholar] [CrossRef]
  29. Moldflow | Plastic Injection Molding Software | Autodesk. Available online: https://www.autodesk.com/products/moldflow/overview (accessed on 21 November 2019).
  30. Li, S.; Zhao, G.; Dong, G.; Wang, J. Study on reducing sink mark depth of a microcellular injection molded part with many reinforcing ribs. J. Cell. Plast. 2016, 52, 479–502. [Google Scholar] [CrossRef]
  31. Wang, G.; Zhao, G.; Dong, G.; Song, L.; Park, C.B. Lightweight, thermally insulating, and low dielectric microcellular high-impact polystyrene (HIPS) foams fabricated by high-pressure foam injection molding with mold opening. J. Mater. Chem. C 2018, 6, 12294–12305. [Google Scholar] [CrossRef]
  32. Rao, C.R. Factorial Experiments Derivable from Combinatorial Arrangements of Arrays. Suppl. J. R. Stat. Soc. 1947, 9, 128–139. [Google Scholar] [CrossRef]
  33. Data Analysis, Statistical & Process Improvement Tools | Minitab. Available online: https://www.minitab.com (accessed on 21 November 2019).
  34. Annicchiarico, D.; Alcock, J.R. Review of factors that affect shrinkage of molded part in injection molding. Mater. Manuf. Process. 2014, 29, 662–682. [Google Scholar] [CrossRef]
  35. Azad, R.; Shahrajabian, H. Experimental study of warpage and shrinkage in injection molding of HDPE/rPET/wood composites with multiobjective optimization. Mater. Manuf. Process. 2019, 34, 274–282. [Google Scholar] [CrossRef]
  36. Yuan, M.; Winardi, A.; Gong, S.; Turng, L.S. Effects of nano- And micro-fillers and processing parameters on injection-molded microcellular composites. Polym. Eng. Sci. 2005, 45, 773–788. [Google Scholar] [CrossRef]
  37. Ozcelik, B.; Erzurumlu, T. Comparison of the warpage optimization in the plastic injection molding using ANOVA, neural network model and genetic algorithm. J. Mater. Process. Technol. 2006, 171, 437–445. [Google Scholar] [CrossRef]
  38. Öktem, H. Modeling and Analysis of Process Parameters for Evaluating Shrinkage Problems During Plastic Injection Molding of a DVD-ROM Cover. J. Mater. Eng. Perform. 2012, 21, 25–32. [Google Scholar] [CrossRef]
  39. Chen, W.C.; Nguyen, M.H.; Chiu, W.H.; Chen, T.N.; Tai, P.H. Optimization of the plastic injection molding process using the Taguchi method, RSM, and hybrid GA-PSO. Int. J. Adv. Manuf. Technol. 2016, 83, 1873–1886. [Google Scholar] [CrossRef]
  40. Bledzki, A.K.; Faruk, O. Microcellular wood fiber reinforced PP composites: Cell morphology, surface roughness, impact, and odor properties. J. Cell. Plast. 2005, 41, 539–550. [Google Scholar] [CrossRef]
  41. Bledzki, A.K.; Rohleder, M.; Kirschling, H.; Chate, A. Microcellular polycarbonate with improved notched impact strength produced by injection moulding with physical blowing agent. Cell. Polym. 2008, 27, 327–345. [Google Scholar] [CrossRef]
Figure 1. Flowchart of process optimization.
Polymers 12 00889 g001
Figure 2. Shape of the test sample model: (a) mesh model, and (b) measurement points of shrinkage and warpage.
Polymers 12 00889 g002
Figure 3. Schematic diagram of the microcellular foam injection molding process.
Polymers 12 00889 g003
Figure 4. Average of S/N ratio for shrinkage in the flow direction.
Polymers 12 00889 g004
Figure 5. Average of S/N ratio for shrinkage in the transverse direction.
Polymers 12 00889 g005
Figure 6. Average of S/N ratio for warpage.
Polymers 12 00889 g006
Figure 7. Surface plots of (a) shrinkage in the flow direction, (b) shrinkage in the transverse direction, and (c) warpage.
Polymers 12 00889 g007
Figure 8. Measured shrinkages in the flow direction and the transverse direction.
Polymers 12 00889 g008
Figure 9. Mechanical properties of unfoamed and microcellular foamed PA6/GF: (a) tensile strength, (b) flexural modulus, and (c) impact strength.
Polymers 12 00889 g009
Figure 10. Cross-section images of samples taken by a scanning electron microscope: (a) unfoamed sample magnified 100 times, (b) unfoamed sample magnified 350 times, (c) foamed sample magnified 100 times, and (d) foamed sample magnified 350 times.
Polymers 12 00889 g010
Table 1. Material properties.
PropertyValue
Melt density (g/cm3)1.3024
Solid density (g/cm3)1.4824
Elastic modulus, 1st principal direction (MPa)8529
Elastic modulus, 2nd principal direction (MPa)5572
Shear modulus (MPa)2215
Recommended melt temperature range (°C)240–260
Table 2. Selected factors and levels.
LevelFactor
Melt Temperature (°C)Mold Temperature (°C)Cooling Time
(s)
Packing Time
(s)
Gas Content (wt %)
ABCDE
1240602000.2
2250703010.6
3260804021.0
Table 3. Design of experiments.
No.ABCDE
1240602000.2
2240602000.6
3240602001.0
4240703010.2
5240703010.6
6240703011.0
7240804020.2
8240804020.6
9240804021.0
10250603020.2
11250603020.6
12250603021.0
13250704000.2
14250704000.6
15250704001.0
16250802010.2
17250802010.6
18250802011.0
19260604010.2
20260604010.6
21260604011.0
22260702020.2
23260702020.6
24260702021.0
25260803000.2
26260803000.6
27260803001.0
Table 4. Experimental results and S/N ratios.
No.Shrinkage in the Flow Direction (%)S/N RatioShrinkage in the Transverse Direction (%)S/N RatioWarpage (mm)S/N Ratio
10.5804.731440.9000.915150.75502.44068
20.5854.656880.8751.159840.74462.56173
30.5854.656880.8901.012200.74742.52874
40.5904.582960.9150.771580.76352.34382
50.5954.509660.8851.061130.75162.48007
60.5954.509660.8950.963540.75492.44260
70.6054.364890.9150.771580.77042.26567
80.6004.436970.8901.012200.75592.43052
90.6054.364890.9100.819170.76822.29089
100.5804.731440.8851.061130.74552.55085
110.5804.731440.8601.310030.73162.71433
120.5854.656880.8801.110350.74542.55241
130.5904.582960.8901.012200.75502.44144
140.5904.582960.8751.159840.74352.57496
150.5854.656880.8950.963540.75542.43646
160.6004.436970.9050.867030.76202.36109
170.5954.509660.8851.061130.75112.48566
180.5954.509660.9050.867030.75952.38906
190.5754.806640.8851.061130.74242.58763
200.5804.731440.8551.360680.72882.74783
210.5754.806640.8751.159840.74142.59914
220.5804.731440.8901.012200.74272.58354
230.5854.656880.8651.259680.73292.69970
240.5854.656880.8950.963540.74822.52003
250.5904.582960.8851.061130.74782.52390
260.5904.582960.8751.159840.74542.55241
270.5954.509660.9000.915150.76252.35520
Table 5. Optimum condition defined by the Taguchi method.
OptimizationABCDE
Shrinkage in the flow direction260602000.2
Shrinkage in the transverse direction260603000.6
Warpage260602020.6
Shrinkage and warpage2606023.330.670.47
Table 6. Analysis of variance for shrinkage in the flow direction.
Design ParametersDegree of FreedomSum of SquaresMean SquaresF-Ratio (%)P-ValueContribution (%)
A20.0871060.04355323.400.00023.72
B20.2719230.13596173.060.00074.07
C20.0026430.0013210.710.5060.72
D20.0025810.0012910.690.5140.70
E20.0029040.0014520.780.4750.79
Error160.0297770.001861
Total260.396933
Table 7. Analysis of variance for shrinkage in the transverse direction.
Design ParametersDegree of FreedomSum of SquaresMean SquaresF-Ratio (%)P-ValueContribution (%)
A20.1222730.06113621.100.00022.43
B20.1473670.07368325.440.00027.05
C20.0050890.0025450.880.4350.94
D20.0021330.0010660.370.6980.39
E20.2680080.13400446.260.00049.19
Error160.0463490.002897
Total260.591218
Table 8. Analysis of variance for warpage.
Design ParametersDegree of FreedomSum of SquaresMean SquaresF-Ratio (%)P-ValueContribution (%)
A20.1065790.05328927.550.00029.99
B20.1476270.07381438.160.00041.55
C20.0022650.0011330.590.5680.64
D20.0024710.0012360.640.5410.70
E20.0963870.04819424.910.00027.12
Error160.0309510.001934
Total260.386281
Table 9. Optimum condition by response surface methodology.
OptimizationABCDE
Shrinkage in the flow direction260602000.2
Shrinkage in the transverse direction2606032.5300.6
Warpage260602020.58
Shrinkage & warpage2606026.2600.56
Table 10. Comparison of optimum combinations.
MethodABCDEShrinkage in the Flow Direction (%)Shrinkage in the Transverse Direction (%)Warpage (mm)
The Taguchi method2606023.330.670.470.5750.8500.7211
Response surface methodology2606026.2600.560.5750.8550.7281
Table 11. Comparison of simulation and experimental results.
Shrinkage in the Flow Direction (%)Shrinkage in the Transverse Direction (%)Warpage (mm)
Simulation0.5750.8500.7211
Experiment0.3860.5980.715

