Article

Curing Kinetics and Thermal Stability of Epoxy Composites Containing Newly Obtained Nano-Scale Aluminum Hypophosphite (AlPO2)

1
School of Chemical Engineering, College of Engineering, University of Tehran, Tehran 11155-4563, Iran
2
Université de Lorraine, CentraleSupélec, LMOPS, F-57000 Metz, France
3
Laboratory of Polymeric & Composite Materials, Materia Nova Research Center, Place du Parc 23, B-7000 Mons, Belgium
4
Department of Resin and Additives, Institute for Color Science and Technology, Tehran 16765-654, Iran
5
Laboratory of Polymeric and Composite Materials (LPCM), Center of Innovation and Research in Materials & Polymers (CIRMAP), Health and Materials Research Institutes, University of Mons, Place du Parc, 23, B-7000 Mons, Belgium
*
Authors to whom correspondence should be addressed.
Polymers 2020, 12(3), 644; https://doi.org/10.3390/polym12030644
Submission received: 1 February 2020 / Revised: 3 March 2020 / Accepted: 10 March 2020 / Published: 12 March 2020
(This article belongs to the Special Issue Epoxy Resins and Composites)

Abstract

:
For the first time, nano-scale aluminum hypophosphite (AlPO2) was simply obtained in a two-step milling process and applied in preparation of epoxy nanocomposites varying concentration (0.1, 0.3, and 0.5 wt.% based on resin weight). Studying the cure kinetics and thermal stability of these nanocomposites would pave the way toward the design of high-performance nanocomposites for special applications. Scanning electron microscopy (SEM) and transmittance electron microscopy (TEM) revealed AlPO2 particles having domains less than 60 nm with high potential for agglomeration. Excellent (at heating rate of 5 °C/min) and Good (at heating rates of 10, 15 and 20 °C/min) cure states were detected for nanocomposites under nonisothermal differential scanning calorimetry (DSC). While the dimensionless curing temperature interval (ΔT*) was almost equal for epoxy/AlPO2 nanocomposites, dimensionless heat release (ΔH*) changed by densification of polymeric network. Quantitative cure analysis based on isoconversional Friedman and Kissinger methods gave rise to the kinetic parameters such as activation energy and the order of reaction as well as frequency factor. Variation of glass transition temperature (Tg) was monitored to explain the molecular interaction in the system, where Tg increased from 73.2 °C for neat epoxy to just 79.5 °C for the system containing 0.1 wt.% AlPO2. Moreover, thermogravimetric analysis (TGA) showed that nanocomposites were thermally stable.

Graphical Abstract

1. Introduction

Epoxy resin, as a versatile high-performance and thermosetting material with acceptable chemical and corrosion resistance and low shrinkage, has been shown to be applicable in industrial fields like adhesives and coatings [1,2]. However, there are microstructural requirements to be met in order to make epoxy resins resistant in harsh environments. Exploring the structure–property relationship in thermoset polymer nanocomposites makes possible the development of high-performance materials [3]. There are several foundational works on the optimization of the microstructure of thermoset nanocomposites with the aim of achieving better properties [4,5,6]. Typically, cross-linking density is recognized as the key parameter determining the efficiency of microstructure modification [7]. The analysis of cure is a fundamental concept for tracing the progress of the system toward nanostructure formation within thermoset materials [8,9]. Recently, Cure Index was proposed as a comprehensive dimensionless criterion for taking a quick qualitative image of cure, simply projecting contributions of the type, surface chemistry, size, and morphology of additives to the crosslinking reaction taking place in thermoset composites [10]. Nevertheless, it cannot be denied that the uniform dispersion of micro/nanoparticles is the prerequisite for developing a thermoset composite with excellent performance [11,12,13].
Application of inorganic phosphorus-based materials has been a trend of modification, especially in polymers containing oxygen, in order to improve their thermal stability [14,15]. The addition of phosphoric acid leads to the release of water at elevated temperatures, as well as the catalyzation of dehydration reactions, forming carbocations as a crosslinking aid [16]. Although the synergistic thermal stability effects of phosphorus compounds in epoxy thermoset resins have been reported previously [17], the current understanding of cure behavior and kinetics of phosphorus-containing epoxy composites and nanocomposite coatings lags behind their rapid development in industrial applications. A comprehensive study on the contributions of nano-scale types of phosphorus materials in low concentrations is required, since the agglomeration of nanoparticles at higher loadings may prevent the cure conversion from progressing [18,19].
Aluminum hypophosphite (AHP), AlPO2, hereafter simply referred as AHP, is a highly reactive phosphorous-based compound because it contains phosphorous at low oxidation degree. Thanks to its high reactivity, AHP has been used as a flame retardant additive for polymers [20,21] at low incorporation content. However, AHP is thermally stable up to 300 °C, and its thermal degradation leads to the release of toxic phosphine. For this reason, its use in some technical polymers is limited in order to avoid phosphine emission during melt processing.
Epoxy resin is well adapted for hosting AHP as a flame retardant agent. In fact, epoxy processing temperature does not exceed 300 °C, and a relatively low rate of incorporation is required, since AHP is highly reactive. However, the effect of the incorporation of AHP into epoxy and the mechanisms of its performance in the network formation have been the subject of only a limited number of works. For example, Shi et al. [22] suggested that the introduction of 2 wt.% of AHP into unsaturated polyester resin in combination with a multivalent phosphorus precursor might improve crosslinking reactions. However, to the best of our knowledge, no report has ever been published on the role of AHP nano-scale particles in the curing behavior and crosslinking degree of epoxy resins.
In this work, new AHP nanoparticles were prepared, and their role in epoxy curing behavior and structure–property relationships of their nanocomposites was discussed. First, AHP microparticles were processed to obtain nano-scale particles, and then they were characterized by scanning electron microscopy (SEM) and transmittance electron microscopy (TEM). Low concentration epoxy nanocomposites of AHP (0.1, 0.3 and 0.5 wt.% based on epoxy weight) were prepared from a solution of AHP in ethanol to avoid solubilization. Differential scanning calorimetry (DSC) at various heating rates of 5, 10, 15 and 20 °C/min was performed to evaluate cure behavior and kinetics in terms of enthalpy of cure, curing temperature window, featured in Cure Index and based on a general protocol [10,23]. The samples were designated with cure labels including Poor, Good and Excellent. Additionally, quantitative cure analysis was carried out based on kinetic parameters such as activation energy and order of reaction, as well as the frequency factor based on the Friedman and Kissinger isoconversional methods. Glass transition temperature (Tg) was used as an indicator of molecular mobility and interactions of constituents in the system, and was measured by reciprocal scanning of fully cured samples at heating rate of 10 °C/min. Finally, the thermal properties of the nanocomposites were evaluated by thermogravimetric analysis (TGA).

2. Materials and Methods

2.1. Materials

AHP microparticles were purchased from Hutong Global Co., Ltd. (Tianjin, China). Bisphenol A diglycidyl ether (EPON™ Resin 828) epoxy resin with epoxide equivalent weight (EEW) of 450–550 g/Eq. was manufactured by Hexion (Columbus, OH, USA). The curing agent was Epikure™ F205 based on isophorone diamine provided by Hexion (Columbus, OH, USA), with a hydrogen equivalent weight (HEW) value of 105 g/eq and an ambient viscosity of 500–700 mPa.s.

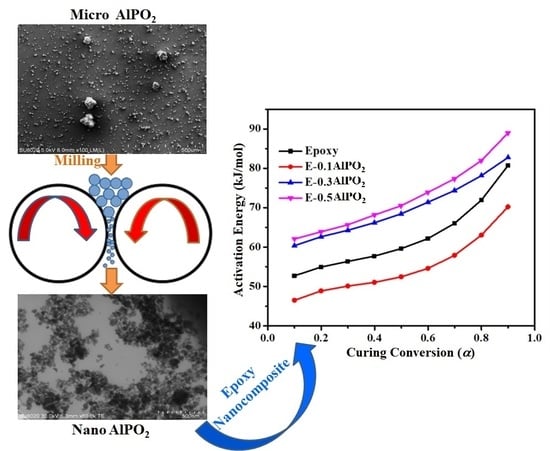
2.2. AHP Nanoparticles Preparation

A two-step milling process was conducted on the as-received AHP particles by SDTech company, SDTech Nano France (Alès, France). To facilitate nanometer-scale fulfilment, an intervening size reduction step was required to achieve the particle size of 1 µm. For this aim, grinding balls with diameter of 1 mm and a grid mesh with the size of 400 µm were used (microbeads Netzsch Labstar mill). During the second step, the nanoparticles were obtained by using smaller grinding balls and grid mesh (diameter of 200 µm and 100 µm, respectively). The second milling step was performed in ethanol in order to avoid solubilization of AHP particles. In the whole downsizing process, the filling ratio of grinding balls and rotor speed were kept at 90% and 3000 rpm, respectively.

2.3. Preparation of Epoxy/AHP Nanocomposites

Nanocomposites of epoxy containing AHP nanoparticles in different concentrations of 0.1, 0.3, and 0.5 wt.% were prepared in order to characterize network formation. In order to do so, proper amounts of AHP/ethanol (9%) solution and epoxy resin were mixed and sonicated for 5 min. Then, the mixture was subjected to mechanical mixing for 20 min at speed of 1500 rpm. To evaporate the excess solvent, mixture was placed in an oven at 45 °C for 24 h. Finally, the hardener was added to the resulting mixtures at 2:1 resin:hardener stoichiometric ratio at ambient temperature and was thoroughly stirred for 3 min to make homogeneous nanocomposite samples.

2.4. Characterization Methods

2.4.1. Electron Microscopy (SEM and TEM)

Microscopic observations of AHP microparticles were performed by scanning electron microscopy (SEM) analysis using a JEOL JSM 6100 apparatus (JEOL Ltd., Tokyo, Japan) at 5 keV. Samples were coated with gold prior to SEM observations. AHP nanoparticle size was evaluated by Transmission electron microscopy (TEM, Eindhoven, The Netherlands) employing a Philips CM100 microscope with an acceleration voltage of 30 keV.

2.4.2. Nonisothermal Differential Scanning Calorimetry (DSC)

Cure reactions of the blank epoxy and nanocomposite samples were studied by nonisothermal DSC conducted using DSC 4000 PerkinElmer device (Waltham, MA, USA). Samples of 12 mg was weighted and placed in an aluminum pan which were held in a refrigerator after preparation, were contingent upon DSC, test in a nitrogen environment with flow rate of 20 mL/min at four different heating rates of 5, 10, 15, and 20 °C/min. The temperature range was chosen to be between 15 and 250 °C in order to cover up throughout the curing process. The reciprocal heating, cooling, and reheating at 10 °C/min were used for determination of Tg.
As mentioned previously, additive presence in thermoset resin can hinder cure reaction or facilitate it, depending on the characteristics of nanomaterial. This effect can be evaluated by calculation of fractional extent of conversion as a function of reaction time, which is defined as below:
α = Δ H T Δ H
where ΔH is the total heat of cure reaction and ΔHT is the enthalpy of the reaction up to a specific temperature T.

2.4.3. Thermogravimetric Analysis (TGA)

In order to study the thermal stability of fully cured neat epoxy and its nanocomposites containing 0.1, 0.3 and 0.5 wt.% AHP, TGA was conducted on a STA-6000 instrument (Perkin-Elmer, Norwalk, CT, USA) within a temperature range of 25–600 °C with a heating rate of 10 °C/min in N2 atmosphere with a flow rate of 20 mL/min. For this purpose, about 8 mg of samples were weighted and placed in a ceramic crucible. This analysis was performed in order to assess thermal stability of epoxy/AHP nanocomposites. The temperature of 5% and 10% weight loss, T5% and T10%, respectively, and the char residues, were extracted from TGA data.

3. Results and Discussion

3.1. Characterization of AHP Nanoparticles

Figure 1 shows SEM micrographs of AHP particles before the milling process. In the images, the aggregation of pristine AHP particles can be observed to fall within a size range of 5–30 μm through SEM.
It was expected that by performing the two-step milling process on the material, particles soud appear in nano-scale through microscope observation. The successful downsizing of AHP allowed obtaining nanoparticles with a diameter lower than 60 nm, confirmed by TEM monitoring (Figure 2). Higher surface area due to size reduction caused more agglomeration due to high surface energy. This is why the images mostly indicate the populations of nanoparticles.

3.2. Qualitative Cure Analysis

For the evaluation of cure potential of epoxy/amine system intermediated by AHP nanoparticles in different concentrations, nonisothermal DSC was employed at heating rates of 5, 10, 15 and 20 °C/min (Figure 3). The broad peak appeared irrespective of sample type in the thermograms of samples, which can be considered as a double-peaked curve, where the smaller shoulder overlaps with the main temperature peak. Meanwhile, the typical autocatalytic epoxy ring opening reaction commonly leads to a unimodal exothermic peak [18,24]. Therefore, secondary reactions take place in parallel, making the cure kinetics complex [25]. Since this behavior is observed for neat epoxy as well, the shoulder cannot be attributed to the contribution of nanoparticles in the cure reaction; rather, it belongs to the epoxy system. The chemical structure of epoxy used in this study contains hydroxyl groups on its own backbone, which is one of the reactive functionalities capable of opening the epoxide group. Therefore, in the early stages, the curing progress is governed by the chemical reactions of the oxirane with primary and secondary amines of the curing agent. The shoulder is more salient at higher temperatures, when epoxy participates in etherification reactions with hydroxyl groups present in the system that originated both from the previous stage and from the epoxy backbone structure. This reaction is inferior, or of lower likelihood, at low temperatures [26,27]. Increasing the heating rate to higher values shifted cure characteristics, including onset (Tonset), peak (Tp) and final (Tendset) temperatures, to higher values (Table 1) as a result of the fact that the shortage of time for cure moieties to react at high heating rates is compensated for at higher temperatures [28].
To make an inclusive assessment, we need a powerful measure that integrates all the factors affecting the whole cure process into a simple criterion, known as Cure Index (CI). The applicability and versatility of the CI have been repeatedly proved in previous works [29,30]. To calculate such a measure, one should consider the following equations [10]:
Δ H * = Δ H C Δ H R e f ,
Δ T * = Δ T C Δ T R e f ,
C I = Δ H * × Δ T * ,
where ΔH* and ΔT* are dimensionless enthalpy and temperature interval for the complete curing process, as determined from the values calculated for epoxy nanocomposites (ΔHC and ΔTC) divided by their corresponding values for the neat epoxy (ΔHRef and ΔTRef), respectively. The defined parameters are calculated at all heating rates and are reported in Table 1.
Placing the data in Table 1 under scrutiny, it has been demonstrated that the introduction of AHP nanoparticles to the epoxy matrix has contributed to cure reactions of epoxy resin, for all the CI values are laid in Good and Excellent cure states. However, the temperature window of the cure is almost unvaried for samples cross-linking at the same heating rate, the incorporation of AHP nanocomposites could intensify the release of heat throughout the duration of the reaction, in comparison to the reference sample. Liu et al. [31] proposed some evidence, such as thermal stability improvement, that confirmed the interactions between a metal phosphinate additive and epoxy matrix and their compatibility. The aluminum cation present in phosphorus precursors can also participate in the epoxy ring-opening reaction as a consequence of complexing with oxygen as a Lewis acid [32]. It should be mentioned that the presence of AHP nanoparticles did not change the kinetics of cure, and only provided more active sites thanks to aluminum cations that could result in a denser network. Low concentrations of nanoparticles facilitate the dispersion of nanoparticles in the matrix and prevents physical limitations such as viscosity increase or dilution effect from occurring. At very low concentrations (0.1 wt.%), the minimized amount of agglomeration, and at higher concentrations (0.3 and 0.5 wt.%), numerous active sites introduced to the system are the reasons why Excellent and Good cure states are achieved. It should be added that at low heating rate all nanocomposites unconditionally took the Excellent label, and possessed the characteristic of completely curing the thermosetting networks [33,34].
Figure 4 graphically exhibited the aforementioned cure states of epoxy nanocomposites for deeper assessment. The cure states of epoxy nanocomposites containing 0.1, 0.3 and 0.5 wt.% of AHP nanoparticles are presented in Figure 4 based on the CI in the plot of the dimentionless ΔH* versus dimentionless ΔT*. The placement of the CI in the green region, which is representative of an Excellent cure (ΔT* < CI < ΔH*), demonstrates the importance of providing enough time and energy for molecular collision in the system for all the samples cured at heating rate of 5 °C/min. As the heating rate increases and consequently the equilibrium time decreases, the cure moieties encounter serious difficulties in reaching each other for reaction, resulting in a Good cure state (CI > ΔH*) instead of an Excellent. It can be realized that the contribution of nanoparticles to the cure performance of the system is very bold; such that, even at high heating rates, the cure quality is improved regardless of the concentration of nanoparticles in the matrix, and no system with a Poor cure state (CI < ΔT*) was observed to be in the red zone [35,36,37].

3.3. Quantitative Cure Analysis

It is recommended that a two-step quantitative cure analysis be performed on thermoset nanocomposites complementarily with a qualitative cure analysis in order to achieve a deeper and more detailed understanding of additive/polymer interactions and cure progress [38]. Cure behavior and kinetics are two different but highly relevant parts of quantitative cure analysis that can be investigated in order to predict the ultimate properties of the thermoset nanocomposite. Cure behavior reveals the variations in the reaction rate to be dependent on the amount, particle size and reactivity of the additives, while in cure kinetics, model-fitting or isoconversional methods tend to be applied to determine the kinetic parameters.
The α-time curves in Figure 5 indicate that cure conversion progress in all samples follows a similar trend to that of the reference sample. The results give an image of the dominant mechanism of reaction which appears to be autocatalytic due to the sigmoidal shape of the curve [39]. The retardation in the preliminary phase of the cure is explained by increased viscosity as a result of nano-additives, which hinders the accessibility of cure species [40]. From a molecular point of view, the numerous active sites participating in network formation thanks to AHP nanoparticles need a longer time interval for the ring opening reaction, since they have a more prominent role in the diffusion-control stage of the process. This effect is boosted at low heating rates of 5 °C/min due to the larger amount of time required. On the other hand, by increasing the heating rate, this effect is diminished as a result of the higher kinetic energy per molecule, which increases the mobility and, consequently, the number of collisions among curing moieties.
Based on these evaluations, one of the best ways to determine kinetic parameters such as activation energy (Ea) and order of reaction is to apply independent isoconversional methods that do not require model-fitting for calculation of Ea and Frequency factor (A) [23]. At a given α, these methods assume that the reaction rate is determined purely in terms of temperature (T). Any new factor kinetically stimulating the system, such as the incorporation of filler into the matrix, would emerge as an alteration of the behavior of activation energy relative to the extent of the reaction. Among all of the proposed isoconversional methods, this behavior can be determined by approximation-free Friedman differential model in combination with the Kissinger integral method (explained in Appendix A.1 and Appendix A.2).
Figure 6 demonstrates correlation of Ea and α as calculated by the Friedman and Kissinger approaches for epoxy and AHP/epoxy nanocomposites. The increasing evolution of activation energy with respect to cure conversion in the range of 0.1 to 0.9 is indicative of the transition from a rapid chemical-control to a gentle diffusion-control phase of the reaction, leading to an increase in the activation energy required for epoxy ring opening at high viscosity, and the difficult accessibility of reaction constituents following the vitrification point, which is the point at which the glass transition temperature of system exceeds the curing temperature [41,42].
In light of the contribution made by nanoparticle content in the nanocomposite, it can be seen from Figure 6 that the presence of very low amounts of AHP nanoparticles in epoxy resin (0.1 wt.% of polymer) caused a significant decrease in Ea throughout the whole range of cure conversion in comparison to unfilled epoxy, which exhibits a facilitated cure reaction and molecular mobility. On the contrary, a higher concentration of nanoparticles requires a greater amount of energy in order to initiate the reaction due to aggregate formation and the higher viscosity of the system. Although the behavior described can be predicted by both isoconversional methods, the values of Ea calculated by the Friedman model are slightly higher than those calculated using the Kissinger model.
To answer the question as to “whether or not the introduction of nanoparticles has affected the auto-catalytic/non-catalytic ratio of curing mechanism”, we need to determine a reaction model by applying valid approaches like the Malek method when the activation energy is determined. The detailed mathematical relations are described in the Appendix B.1 and Appendix B.2 sections. This method takes advantage of the maximum points of y(α) curve (αm) and z(α) curve (αp), together with the peak conversion in DSC thermograms (αp) as a means of predicting the reaction model and comparing it with the theoretical master plots of y(α) and z(α), which can be obtained simply by transforming the experimental data [43]. As a result, the defined parameters are calculated and presented in Table 2 for pristine and AHP-loaded epoxy resin for all heating rates based on the previous DSC characterization.
Interpreting the results of Table 2 shows that the values for αm are in all cases lower than those for αp. A maximum point exists in the y(α) profile (Figure A4 in Appendix B.2), as can be observed from the shape of y(α). Accordingly, two-parameter autocatalytic kinetic models fit the given condition [43].
The Friedman and Kissinger methods can also be used to determine the autocatalytic reaction model based on experimental data in the form of the equation below:
d α d t = A e x p ( E α R T ) α m ( 1 α ) ,
In Equation (5) n and m represents degrees of non-catalytic and autocatalytic reactions, respectively, and A is defined as a frequency factor, a measure of the molecular collision state. These parameters were calculated using the Friedman and Kissinger methods (Appendix C), and the results are summarized in Table 3.
The contents of Table 3 imply that the non-catalytic order of reaction (n) at all heating rates is first decreased due to the hindrance effect of nanoparticles in epoxy resin, while by increment of nanoparticle loading this parameter is increase to higher values compared to reference epoxy as a result of high reactivity of numerous AHP nanoparticles toward ring opening reactions, compromising the hindrance effect. This is also the case for the catalytic order of reaction (m) and frequency factor (A), for which a similar trend is observed. The increase in A values resulting from the introduction of 0.3 and 0.5 wt.% of AHP is further evidence of the physical impeding effect of nanoparticles, resulting in more energy being requiredfor the curing process. Moreover, the overall order of the cure reaction (m + n) is higher than 1 for most of the studied systems, revealing non-elementary aspects to be inherent to the cure reaction occurring in the nanocomposite systems [44]. The patterns described are predicted by both of the applied methods with a slight common difference, which is caused by the difference in approximation of the models.
The reliability of the models used in this study need to be assessed by a simple comparison of theoretical and experimental results of curing rate versus temperature which is depicted in Figure 7. The experimental curves show some discrepancies with respect to calculated values, revealing the complexity of cure kinetics of these systems.

3.4. Glass Transition Analysis

Glass transition temperature for fully cured AHP/epoxy nanocomposites was measured in a heating cycle from 15 to 250 °C. The results were compared to the Tg of cured bare epoxy and are provided in Table 4.
A brief review of the table provides an image of the molecular interactions of the constituents present in system. The glass transition temperature is slightly increased by the addition of 0.1 wt.% AHP nanoparticles to the polymer, which starts scaling down through the multiplicsation of the nanoparticle amount. It can be seen that the presence of low amounts of AHP reduces the simplicity of the molecular movements and hinders the segmental mobility of the polymer chains. This is because of the formation of a denser epoxy cross-linked network in favor of more active sites that react excellently with the epoxide group. However, when the concentration of AHP is increased to 0.3 and 0.5 wt.% of resin, although the number of active sites is significantly increased and, based on previous section, the curing progress of the system has been enhanced, the decrease of Tg is a sign that indicates easier movement of molecules at imparted voids in proximity to the nanoparticles and resin. This could be due to the aggregation of nanoparticles and their relatively poor dispersion, which could undermine molecular mobility. In the case of 0.3 wt.% AHP/epoxy nanocomposite, the similarity of Tg to that of neat epoxy shows the validity of this approach.

3.5. Thermal Stability

The thermal stability of AHP/epoxy nanocomposites in comparison to neat epoxy was determined by TGA under nitrogen atmosphere at a heating rate of 10 °C/min from room temperature to 550 °C. Figure 8 shows the dual-step TGA curves and Table 5 summarizes the characteristic data of thermal analysis. The early-stage degradation at around 100 °C can be related to solvent and small molecules which have lower thermal stability compared to epoxy structure [45]. Investigating the retarded thermal behavior of nanocomposites in this region, one can realize that addition of AHP nanoparticles to the resin decreased the decomposition rate, representing improved thermal resistance in the system, even at very low concentrations (0.1 wt.% of resin).
The decreasing trend of initial decomposition temperature (T5%) of nanocomposites (Table 5) demonstrates the higher activity of the O=P–O bond compared to the common C–C and C–O bonds in epoxy, which is boosted by increasing the nanoparticle content and leads to significant decline in T5%T = 20 °C) to 300 °C for the highest loading [46]. In fact, the addition of AHP nanoparticles causes a decrease in the temperature at which the carbon layer forms [47]. However, this effect is reduced in the 0.1 wt.% AHP/epoxy nanocomposite due to the low amount of P-containing materials.
The sharp drop in mass loss profile in Figure 8 at a temperature of around 350 °C can be ascribed to the decomposition of the epoxy resin, which is facilitated by the presence of phosphate compounds, catalyzing the decomposition process. Table 5 shows that the char yield values of the thermoset nanocomposites were more or less equal to that of the reference polymer, with a slight variation. It can be suggested that when the content of nanoparticles reaches a threshold (in this case, 0.5 wt.% of resin), AHP nanoparticles start to enhance char forming. Figure 9 proposes a schematic illustration of possible thermal stability induced by the incorporation of AHP into the epoxy matrix as a function of loading level. At low loading levels, it is anticipated that the presence of nanoparticles restricted the mobility of the epoxy chains. After the amount of AHP in the epoxy matrix reached the critical threshold of 0.5 wt.%, the release of volatile compounds and free radicals through epoxy network scission was made more difficult, hindering the diffusion of such low-molecular-weight molecules through the polymer matrix. Moreover, phosphoric acid, PH3 and AlPO4 released through the decomposition of aluminum hypophosphite [48]. At higher temperatures, phosphoric acid could be partly degraded to produce poly metaphosphoric acid, which could promote the carbonization of epoxy [49]. This effect is probably more likely at higher AHP loadings.

4. Conclusions

Aluminum hypophosphite (AHP) nanoparticles were produced through a milling process of AHP microparticles, and their epoxy nanocomposites were prepared in different loadings of 0.1, 0.3 and 0.5 wt.% with respect to the resin in order to investigate their potential for participating in the cure progress of thermoset epoxy resin. The shape and size of the fresh and milled particles was compared on the basis of SEM and TEM. The nonisothermal DSC of the prepared samples demonstrated that a denser cross-linked network of polymer was the case for the majority of nanocomposites due to the provision of a reactive Lewis acid element (Aluminum cation) in the system by the AHP nanoparticles. Comparing the experimental results of the nanocomposites with reference samples for qualitative cure analysis, the calculated Cure Index was found to be in the Good and Excellent states for all of the nanocomposites as a result of the extended length of the epoxy ring opening reaction. Additionally, the quantitative cure analysis was also performed based on a detailed protocol in order to investigate the kinetics of cure reaction in detail. The differential Friedman and integral Kissinger isoconversional methods were regarded to be predictors of kinetic parameters such as activation energy and order of autocatalytic and non-catalytic reactions. The results showed a decrease in the value of Ea for low loadings from 72.5 (Friedman) and 62.4 (Kissinger) for neat epoxy to 64.6 and 54.9 kJ/mol., respectively. Agglomeration stemming from higher additive contents present in a system reduces the molecular mobility, and therefore increases the values of Ea. Moreover, the Tg characterization confirmed the higher crosslinking density, especially for low loadings of nanoparticles in resin, which results in an increase from 73.2 for neat epoxy to 79.5 for E-0.1AHP. The slight reduction of Tg at high loadings was attributed to aggregation formation due to high surface energy. Finally, TGA analysis provided a context for the investigation of thermal stability of AHP/epoxy nanocomposites. Improved char forming ability was an achievement demonstrated by the analysis of E-0.5AHP.

Author Contributions

Conceptualization, H.V. and M.R.S.; methodology, M.J.; software, F.T., and M.J.; validation, H.V. and M.R.S.; formal analysis, S.M.; investigation, M.J.; resources, F.L.; data curation, M.J., H.V. and M.R.S.; writing—original draft preparation, F.T.; writing—review and editing, M.J., and M.R.S.; visualization, M.R.S.; supervision, P.D.; All authors have read and agreed to the published version of the manuscript.

Funding

This research received no external funding.

Acknowledgments

The authors would like to thank the support provided by SDTech company, SDTech Nano France, in preparation of AlPO2 nanoparticles.

Conflicts of Interest

The authors declare no conflict of interest.

Appendix A. Isoconversional Kinetic Methods

Appendix A.1. Friedman Model

According to the literature, Friedman model can be expressed as the following equation:
l n [ β i ( d α d T ) α , i ] = l n [ f ( α ) A α ] E α R T α , i ,
where α, β and Eα are representative of cure conversion, heating rate and activation energy, respectively. Depicting the ln [ β i ( d α / d T ) α , i ] vs. 1000/Tα, one can find the values of activation energy at each conversion from the slope of Figure A1.
Figure A1. Plots of ln(dα/dt) vs. 1/T of the prepared samples based on Friedman model at β = 5 °C/min.
Polymers 12 00644 g0a1

Appendix A.2. Kissinger Method

Kissinger method can be defined by the following equation:
l n ( β i T α , i 2 ) = C o n s t 1.0008 ( E α R T α ) ,
Plotting l n ( β i / T α , i 2 ) vs. 1000/Tα gives the possibility of obtaining activation energy from the slope of straight lines showed in Figure A2.
Figure A2. Plots of ln(β/T2) vs. 1/T for prepared samples based on the Kissinger model.
Polymers 12 00644 g0a2

Appendix B. Curing Reaction Model Determination

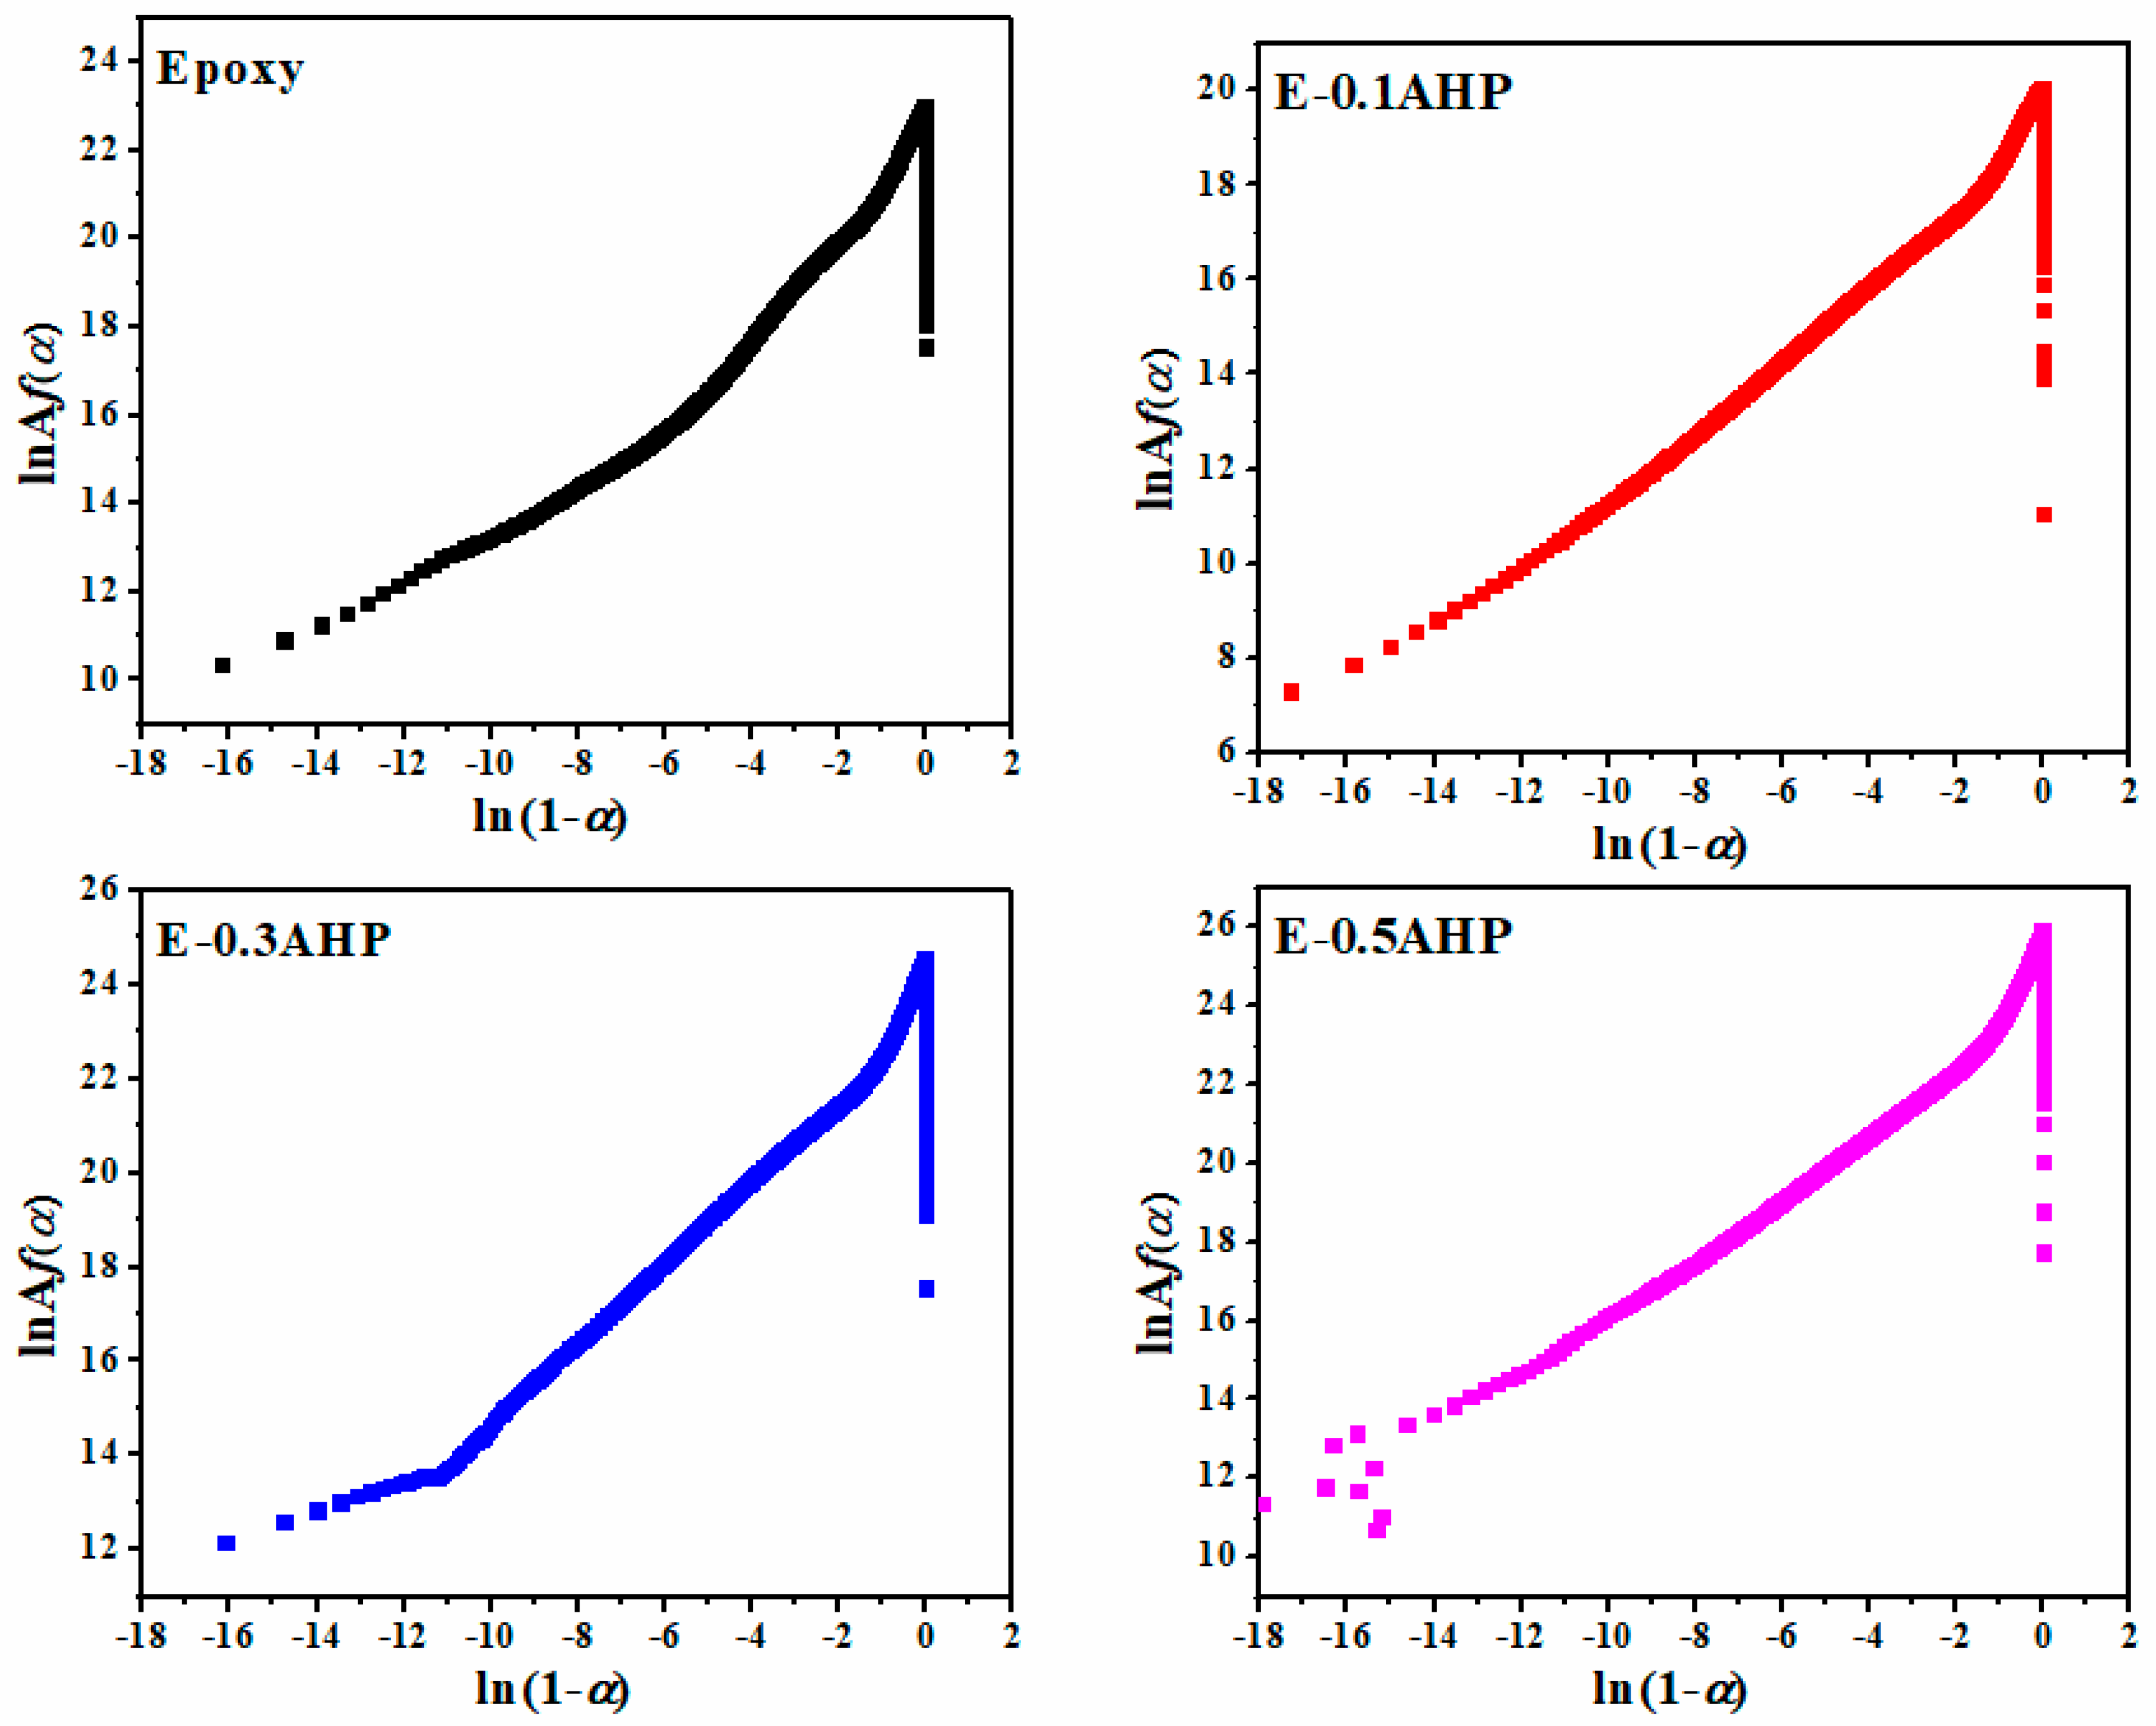
Appendix B.1. Friedman Model

Based on the Friedman method, the model of the epoxy curing reaction can be determined using Equation (A3). The shape of plot of ln[Af(α)] vs. ln(1 − α) denotes the deviation from nth-order reaction (Figure A3).
l n [ A f ( α ) ] = l n ( d α d t ) + E R T = l n A + n l n ( 1 α ) ,
For the nth-order cure kinetics, a straight line should be obtained by plotting ln[Af(α)] vs. ln(1 − α), the slope of which gives the reaction rate (n).
Figure A3. Plots of ln[Af(α)] vs. ln(1 − α)for the samples at heating rate of 5 °C/min used in calculation of activation energy via Friedman method.
Polymers 12 00644 g0a3
According to the Friedman method, based on the shape of plot of ln[Af(α)] against ln(1 − α), the curing mechanism can be determined (Equation (A3)). From the shape of Figure A3, showing a maximum point out of the range of −0.51 to −0.22, it can be concluded that a disagreement between experimental and theoretical results exists, and the reaction mechanism of neat epoxy and its nanocomposites does not follow an autocatalytic model.

Appendix B.2. Malek Method

The important parameters of Malek method y(α) and z(α) can be determined by Equations (A4) and (A5) as follows:
y ( α ) = ( d α d t ) α e x p ( E 0 R T α ) = A f ( α ) ,
z ( α ) = ( d α d t ) α T α 2 [ π ( x ) β T α ] ,
The term in the brackets of Equation (A5) is negligible and ineffective on the shape of the z(α) function and can be omitted. In Equation (A4), the value of E0 is determined by isoconversional methods, that is, Friedman and Kissinger models in which the activation energy is determined from the slope of ln(βi) vs. 1000/Tp plot as shown in Figure A1 and Figure A2. The experimental values of y(α) and z(α) for AHP/epoxy nanocomposite as a function of α are shown in Figure A4 and compared with theoretical master plots.
Figure A4. Variation of y(α) and z(α) versus conversion for prepared samples based on Malek model for (a) neat epoxy, (b) E-0.1AHP, (c) E-0.3AHP and (d) E-0.5AHP.
Polymers 12 00644 g0a4
The values of y(α) and z(α) should be normalized as follows to take a value between 0 and 1:
y n ( α ) = y ( α ) max [ y ( α ) ] ,
z n ( α ) = z ( α ) max [ z ( α ) ] ,
The maximum values of, y(α)max = αm and z(α)max = αp, can be found from the following expressions, which are critical for kinetic characterization:
f ( α m ) = 0 ,
f ( α p ) g ( α p ) = 1 ,
The parameter g(αp) is the integral form of the reaction model.

Appendix C. Determination of Degree of Reaction

The degrees of autocatalytic reaction (n and m) and the frequency factor (A), as essential kinetic parameters, can be determined through the following equations:
V a l u e I = l n ( d α d t ) + E α R T l n [ d ( 1 α ) d t ] E α R T = ( n m ) l n ( 1 α α ) ,
V a l u e I I = l n ( d α d t ) + E α R T + l n [ d ( 1 α ) d t ] + E α R T = ( n + m ) l n ( α α 2 ) + 2 l n A ,
The slope of the plots of Value I vs. ln[(1 − α)/α] (Figure A5) and Value II vs. ln(αα2) (Figure A6) gives the value of (nm) and (n + m), respectively, and from the intercept of the latter, the plot A value can be calculated.
Figure A5. Plots of Value I calculated using DSC data for prepared epoxy system under heating rate of 5 °C/min.
Polymers 12 00644 g0a5
Figure A6. Plots of Value II calculated for prepared samples under heating rate of 5 °C/min.
Polymers 12 00644 g0a6

References

  1. Ahmadi, Z. Nanostructured epoxy adhesives: A review. Prog. Org. Coat. 2019, 135, 449–453. [Google Scholar] [CrossRef]
  2. Ahmadi, Z. Epoxy in nanotechnology: A short review. Prog. Org. Coat. 2019, 132, 445–448. [Google Scholar] [CrossRef]
  3. Puglia, D.; Kenny, J.M. Chapter 7-Structure-property relationships of thermoset nanocomposites. In Thermosets, 2nd ed.; Guo, Q., Ed.; Elsevier: Amsterdam, The Netherlands, 2018; pp. 231–276. [Google Scholar]
  4. Lange, J.; Luisier, A.; Hult, A. Influence of crosslink density, glass transition temperature and addition of pigment and wax on the scratch resistance of an epoxy coating. J. Coat. Technol. 1997, 69, 77–82. [Google Scholar] [CrossRef]
  5. Wu, G.M.; Liu, D.; Liu, G.F.; Chen, J.; Huo, S.P.; Kong, Z.W. Thermoset nanocomposites from waterborne bio-based epoxy resin and cellulose nanowhiskers. Carbohydr. Polym. 2015, 127, 229–235. [Google Scholar] [CrossRef]
  6. Song, S.; Ma, J.; Cao, K.; Chang, G.; Huang, Y.; Yang, J. Synthesis of a novel dicyclic silicon-/phosphorus hybrid and its performance on flame retardancy of epoxy resin. Polym. Degrad. Stab. 2014, 99, 43–52. [Google Scholar] [CrossRef]
  7. Bharadwaj, R.K.; Mehrabi, A.R.; Hamilton, C.; Trujillo, C.; Murga, M.; Fan, R.; Thompson, A.K. Structure–property relationships in cross-linked polyester–clay nanocomposites. Polymer 2002, 43, 3699–3705. [Google Scholar] [CrossRef]
  8. Wang, C.S.; Lin, C.H. Novel phosphorus-containing epoxy resins. Part II: Curing kinetics. Polymer 2000, 41, 8579–8586. [Google Scholar] [CrossRef]
  9. Narayan, R.; Chattopadhyay, D.K.; Sreedhar, B.; Raju, K.V.S.N. Cure, viscoelastic and mechanical properties of hydroxylated polyester melamine high solids coatings. J. Mater. Sci. 2002, 37, 4911–4918. [Google Scholar] [CrossRef]
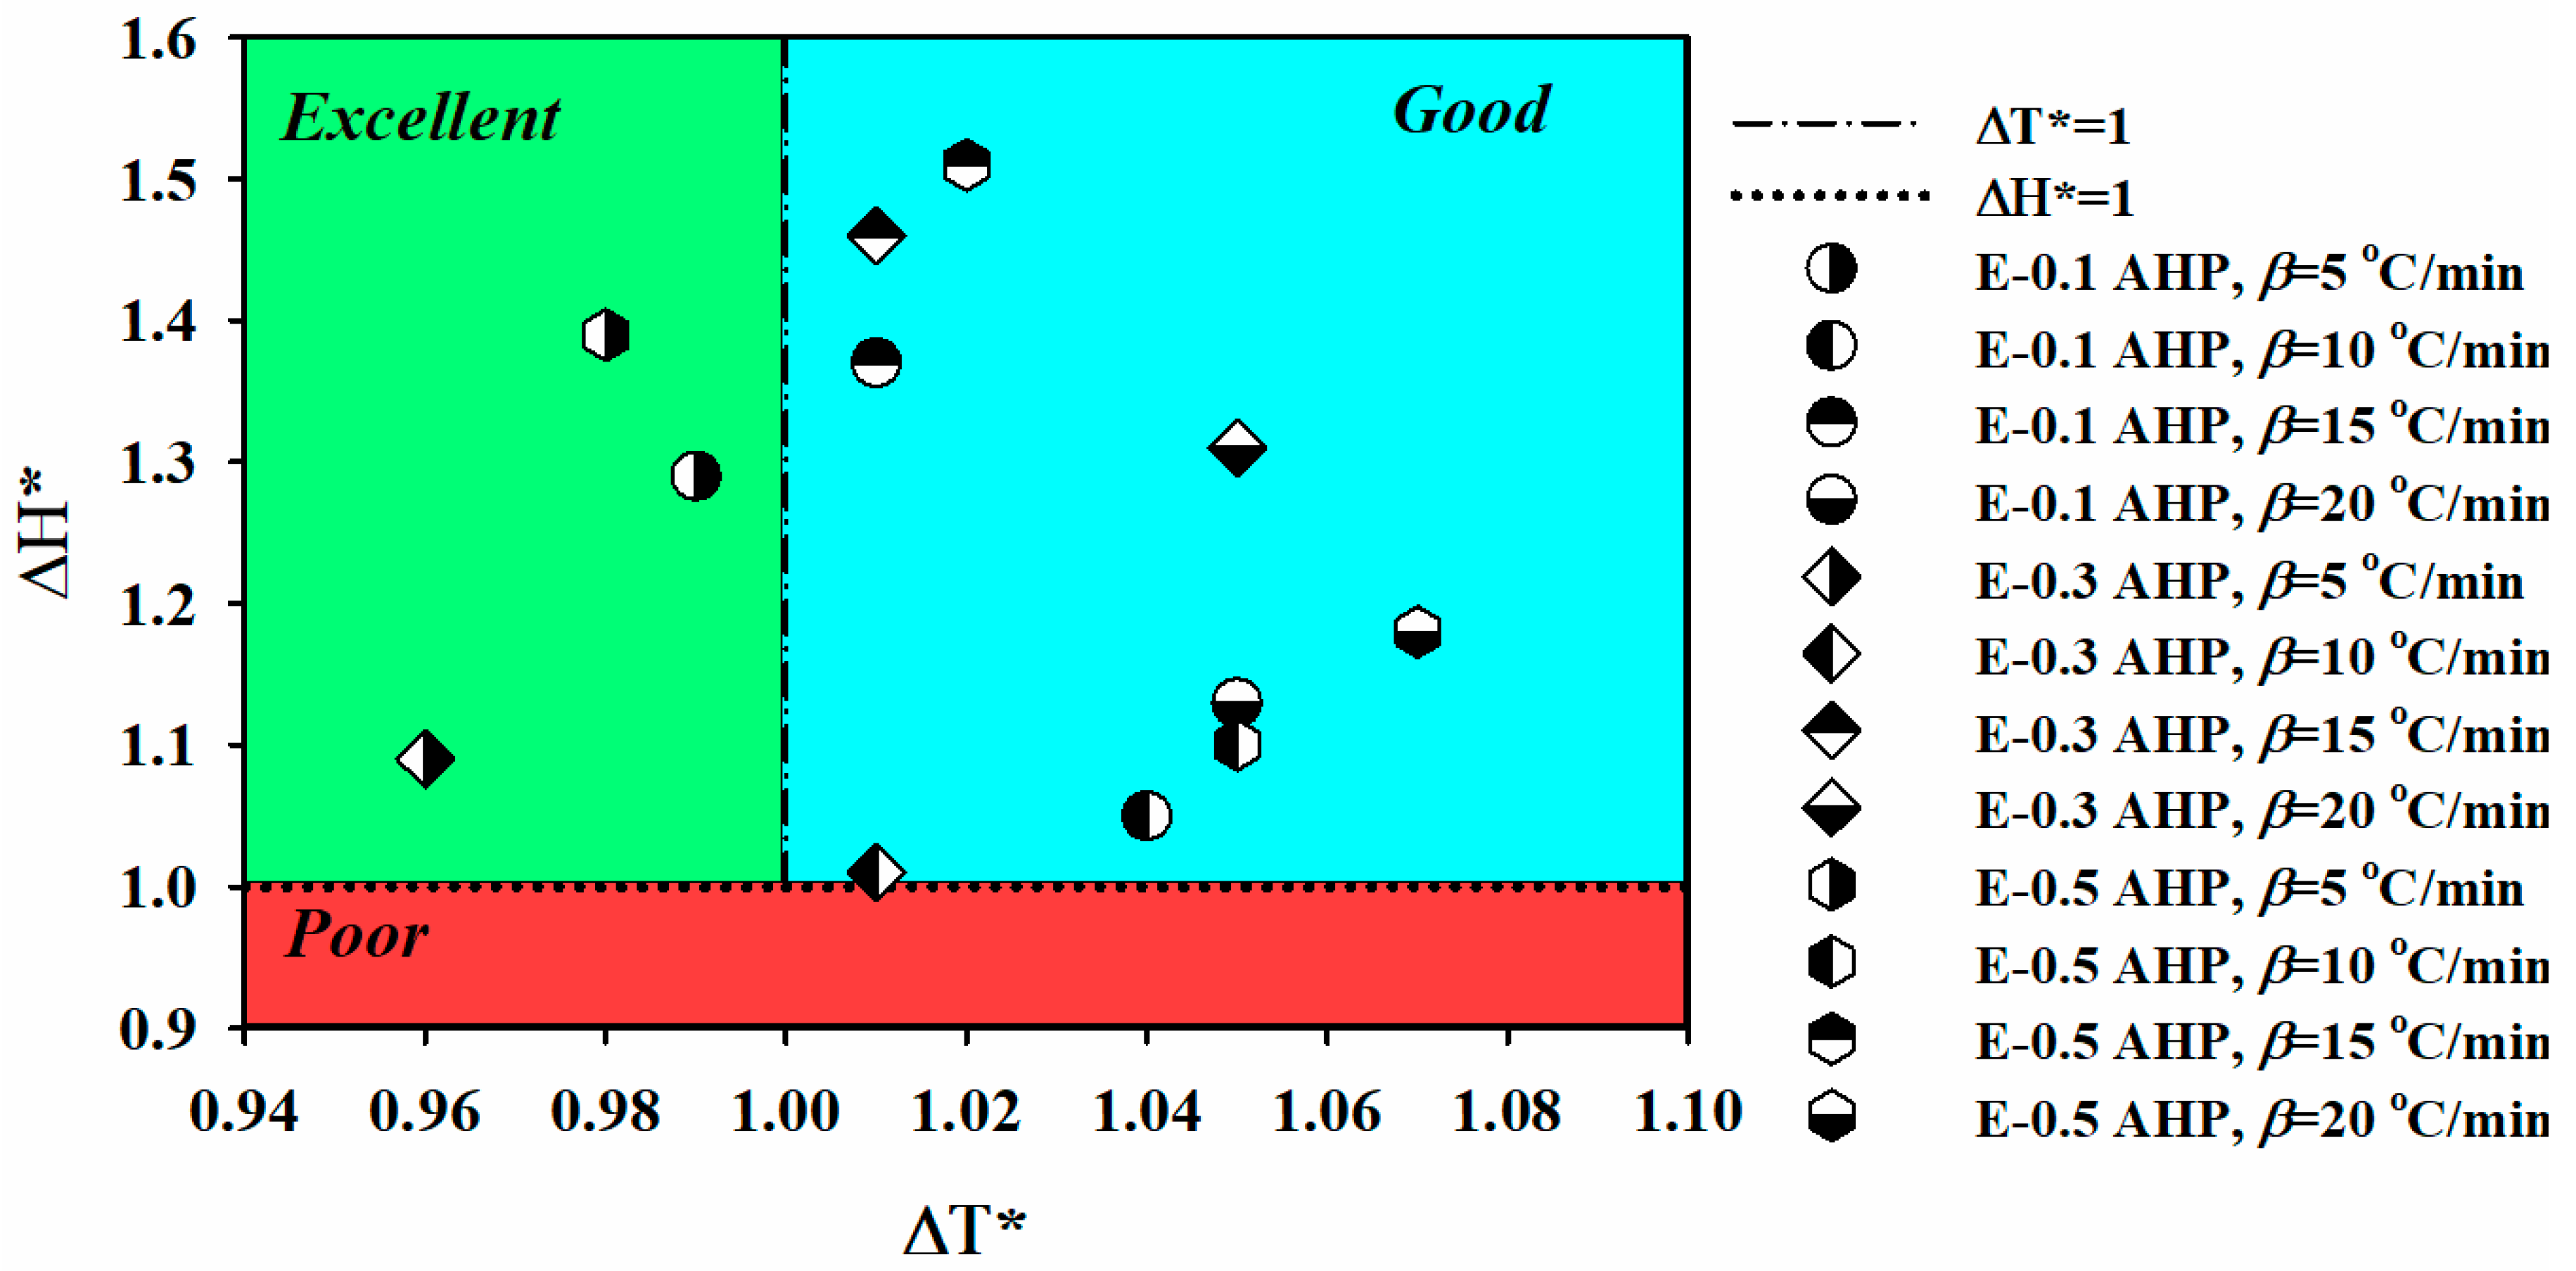
  10. Jouyandeh, M.; Paran, S.M.R.; Jannesari, A.; Saeb, M.R. ‘Cure Index’ for thermoset composites. Prog. Org. Coat. 2019, 127, 429–434. [Google Scholar] [CrossRef]
  11. Vahedi, V.; Pasbakhsh, P. Instrumented impact properties and fracture behaviour of epoxy/modified halloysite nanocomposites. Polym. Test. 2014, 39, 101–114. [Google Scholar] [CrossRef]
  12. Tikhani, F.; Jouyandeh, M.; Jafari, S.H.; Chabokrow, S.; Ghahari, M.; Gharanjig, K.; Saeb, M.R. Cure Index demonstrates curing of epoxy composites containing silica nanoparticles of variable morphology and porosity. Prog. Org. Coat. 2019, 135, 176–184. [Google Scholar] [CrossRef]
  13. Jouyandeh, M.; Paran SM, R.; Shabanian, M.; Ghiyasi, S.; Vahabi, H.; Badawi, M.; Saeb, M.R. Curing behavior of epoxy/Fe3O4nanocomposites: A comparison between the effects of bare Fe3O4, Fe3O4/SiO2/chitosan and Fe3O4/SiO2/chitosan/imide/phenylalanine-modified nanofillers. Prog. Org. Coat. 2018, 123, 10–19. [Google Scholar] [CrossRef]
  14. Levchik, S.V.; Weil, E.D. A review of recent progress in phosphorus-based flame retardants. J. Fire Sci. 2006, 24, 345–364. [Google Scholar] [CrossRef]
  15. Wang, J.; Chow, W. A brief review on fire retardants for polymeric foams. J. Appl. Polym. Sci. 2005, 97, 366–376. [Google Scholar] [CrossRef]
  16. Laoutid, F.; Bonnaud, L.; Alexandre, M.; Lopez-Cuesta, J.M.; Dubois, P. New prospects in flame retardant polymer materials: From fundamentals to nanocomposites. Mater. Sci. Eng. R Rep. 2009, 63, 100–125. [Google Scholar] [CrossRef]
  17. Hsiue, G.H.; Liu, Y.L.; Tsiao, J. Phosphorus-Containing Epoxy Resins for Flame Retardancy V: Synergistic Effect of Phosphorus–Silicon on Flame Retardancy. J. Appl. Polym. Sci. 2000, 78, 1–7. [Google Scholar] [CrossRef]
  18. Ghiyasi, S.; Sari, M.G.; Shabanian, M.; Hajibeygi, M.; Zarrintaj, P.; Rallini, M.; Laoutid, F. Hyperbranched poly(ethyleneimine) physically attached to silica nanoparticles to facilitate curing of epoxy nanocomposite coatings. Prog. Org. Coat. 2018, 120, 100–109. [Google Scholar] [CrossRef]
  19. Nonahal, M.; Rastin, H.; Saeb, M.R.; Sari, M.G.; Moghadam, M.H.; Zarrintaj, P.; Ramezanzadeh, B. Epoxy/PAMAM dendrimer-modified graphene oxide nanocomposite coatings: Nonisothermal cure kinetics study. Prog. Org. Coat. 2018, 114, 233–243. [Google Scholar] [CrossRef]
  20. Yan, Y.W.; Huang, J.Q.; Guan, Y.H.; Shang, K.; Jian, R.K.; Wang, Y.Z. Flame retardance and thermal degradation mechanism of polystyrene modified with aluminum hypophosphite. Polym. Degrad. Stab. 2014, 99, 35–42. [Google Scholar] [CrossRef]
  21. Zhu, Z.M.; Rao, W.H.; Kang, A.H.; Liao, W.; Wang, Y.Z. Highly effective flame retarded polystyrene by synergistic effects between expandable graphite and aluminum hypophosphite. Polym. Degrad. Stab. 2018, 154, 1–9. [Google Scholar] [CrossRef]
  22. Shi, X.; Zhang, L.; Jiang, S.; Peng, X.; Kuang, T. Enhancement of flame retardancy of unsaturated polyester resin based on DOPO derivatives and aluminum hypophosphite. In Proceedings of the Annual Technical Conference-ANTEC, Conference Proceedings, Anaheim, CA, USA, 8–10 May 2017; pp. 591–594. [Google Scholar]
  23. Jouyandeh, M.; Paran, S.M.R.; Jannesari, A.; Puglia, D.; Saeb, M.R. Protocol for nonisothermal cure analysis of thermoset composites. Prog. Org. Coat. 2019, 131, 333–339. [Google Scholar] [CrossRef]
  24. Akbari, V.; Naja, F.; Vahabi, H.; Jouyandeh, M.; Badawi, M. Progress in Organic Coatings Surface chemistry of halloysite nanotubes controls the curability of low fi lled epoxy nanocomposites. Prog. Org. Coat. 2019, 135, 555–564. [Google Scholar] [CrossRef]
  25. Jouyandeh, M.; Hamad, S.M.; Karimzadeh, I.; Aghazadeh, M.; Karami, Z.; Akbari, V.; Ganjali, M.R. Unconditionally blue: Curing epoxy with polyethylene glycol (PEG) surface-functionalized ZnxFe3-xO4 magnetic nanoparticles. Prog. Org. Coat. 2019, 137, 105285. [Google Scholar] [CrossRef]
  26. Achilias, D.S.; Karabela, M.M.; Varkopoulou, E.A.; Sideridou, I.D. Cure Kinetics Study of Two Epoxy Systems with Fourier Tranform Infrared Spectroscopy (FTIR) and Differential Scanning Calorimetry (DSC). J. Macromol. Sci. Part A 2012, 49, 630–638. [Google Scholar] [CrossRef]
  27. Ehlers, J.E.; Rondan, N.G.; Huynh, L.K.; Pham, H.; Marks, M.; Truong, T.N. Theoretical Study on Mechanisms of the Epoxy Macromolecules. Macromolecules 2007, 40, 4370–4377. [Google Scholar] [CrossRef]
  28. Zhao, S.F.; Zhang, G.P.; Sun, R.; Wong, C.P. Curing kinetics, mechanism and chemorheological behavior of methanol etherified amino/novolac epoxy systems. Express Polym. Lett. 2014, 8, 95–106. [Google Scholar] [CrossRef] [Green Version]
  29. Jouyandeh, M.; Tikhani, F.; Shabanian, M.; Movahedi, F.; Moghari, S.; Akbari, V.; Gabrionf, X.; Laheurteg, P.; Vahabiab, H.; Saebe, M.R. Synthesis, characterization, and high potential of 3D metal–organic framework (MOF) nanoparticles for curing with epoxy. J. Alloys Compd. 2020, 829, 154547. [Google Scholar] [CrossRef]
  30. Jouyandeh, M.; Jazani, O.M.; Navarchian, A.H.; Shabanian, M.; Vahabi, H.; Saeb, M.R. Bushy-surface hybrid nanoparticles for developing epoxy superadhesives. Appl. Surf. Sci. 2019, 479, 1148–1160. [Google Scholar] [CrossRef]
  31. Liu, X.; Liu, J.; Sun, S.; Chen, J. A New Type of Flame Retarded Epoxy Resin Based on Metal Phosphinates. Polym. Polym. Compos. 2012, 20, 151–154. [Google Scholar] [CrossRef]
  32. Hu, Q.; Peng, P.; Peng, S.; Liu, J.; Liu, X.; Zou, L.; Chen, J. Flame-retardant epoxy resin based on aluminum monomethylphosphinate. J. Therm. Anal. Calorim. 2017, 128, 201–210. [Google Scholar] [CrossRef]
  33. Karami, Z.; Jouyandeh, M.; Ali, J.A.; Ganjali, M.R.; Aghazadeh, M.; Maadani, M.; Akbari, V. Cure Index for labeling curing potential of epoxy/LDH nanocomposites: A case study on nitrate anion intercalated Ni-Al-LDH. Prog. Org. Coat. 2019, 136, 105228. [Google Scholar] [CrossRef]
  34. Jouyandeh, M.; Ganjali, M.R.; Ali, J.A.; Aghazadeh, M.; Paran, S.M.R.; Naderi, G.; Saeb, M.R.; Thomas, S. Curing epoxy with polyvinylpyrrolidone (PVP) surface-functionalized ZnxFe3-xO4 magnetic nanoparticles. Prog. Org. Coat. 2019, 136, 105227. [Google Scholar] [CrossRef]
  35. Jouyandeh, M.; Ganjali, M.R.; Ali, J.A.; Aghazadeh, M.; Stadler, F.J.; Saeb, M.R. Curing epoxy with electrochemically synthesized CoxFe3-xO4 magnetic nanoparticles. Prog. Org. Coat. 2019, 137, 105252. [Google Scholar] [CrossRef]
  36. Jouyandeh, M.; Ganjali, M.R.; Ali, J.A.; Akbari, V.; Karami, Z.; Aghazadeh, M.; Zarrintaje, P.; Saebd, M.R. Curing epoxy with polyethylene glycol (PEG) surface-functionalized GdxFe3-xO4 magnetic nanoparticles. Prog. Org. Coat. 2019, 137, 105283. [Google Scholar] [CrossRef]
  37. Karami, Z.; Aghazadeh, M.; Jouyandeh, M.; Zarrintaj, P.; Vahabi, H.; Ganjali, M.R.; Saeb, M.R. Epoxy/Zn-Al-CO3 LDH nanocomposites: Curability assessment. Prog. Org. Coat. 2020, 138, 105355. [Google Scholar] [CrossRef]
  38. Karami, Z.; Jouyandeh, M.; Hamad, S.M.; Ganjali, M.R.; Aghazadeh, M.; Torre, L.; Saeb, M.R. Curing epoxy with Mg-Al LDH nanoplatelets intercalated with carbonate ion. Prog. Org. Coat. 2019, 136, 105278. [Google Scholar] [CrossRef]
  39. Karami, Z.; Jouyandeh, M.; Ali, J.A.; Ganjali, M.R.; Aghazadeh, M.; Maadani, M.; Saeb, M.R. Development of Mg-Zn-Al-CO3 ternary LDH and its curability in epoxy/amine system. Prog. Org. Coat. 2019, 136, 105264. [Google Scholar] [CrossRef]
  40. Karami, Z. Well-cured silicone/halloysite nanotubes nanocomposite coatings. Prog. Org. Coat. 2019, 129, 357–365. [Google Scholar] [CrossRef]
  41. Sbirrazzuoli, N.; Vyazovkin, S. Learning about epoxy cure mechanisms from isoconversional analysis of DSC data. Thermochim. Acta 2002, 388, 289–298. [Google Scholar] [CrossRef]
  42. Jouyandeh, M.; Jazani, O.M.; Navarchian, A.H.; Shabanian, M.; Vahabi, H.; Saeb, M.R. Surface engineering of nanoparticles with macromolecules for epoxy curing: Development of super-reactive nitrogen-rich nanosilica through surface chemistry manipulation. Appl. Surf. Sci. 2018, 447, 152–164. [Google Scholar] [CrossRef]
  43. Málek, J. The kinetic analyss of non-isothermal data. Thermochim. Acta 1992, 200, 257–269. [Google Scholar] [CrossRef]
  44. Saeb, M.R.; Ghaffari, M.; Rastin, H.; Khonakdar, H.A.; Simon, F.; Najafi, F.; Formela, K. Biowaste chicken eggshell powder as a potential cure modifier for epoxy/anhydride systems: Competitiveness with terpolymer-modified calcium carbonate at low loading levels. RSC Adv. 2017, 7, 2218–2230. [Google Scholar] [CrossRef] [Green Version]
  45. Toldy, A.; Szolnoki, B.; Csontos, I.; Marosi, G. Green synthesis and characterization of phosphorus flame retardant crosslinking agents for epoxy resins. J. Appl. Polym. Sci. 2014, 131, 1–8. [Google Scholar] [CrossRef]
  46. Gu, L.; Qiu, J.; Qiu, C.; Yao, Y.; Sakai, E.; Yang, L. Mechanical properties and degrading behaviors of aluminum hypophosphite-poly (Lactic Acid)(PLA) nanocomposites. Polym. Plast. Technol. Mater. 2019, 58, 126–138. [Google Scholar] [CrossRef]
  47. Chen, X.; Wang, W.; Jiao, C. In situ synthesis of flame retardant organic–inorganic hybrids by a molten blending method based on thermoplastic polyurethane elastomer and polybutyl titanate. RSC Adv. 2016, 6, 92276–92284. [Google Scholar] [CrossRef]
  48. Tang, G.; Wang, X.; Xing, W.; Zhang, P.; Wang, B.; Hong, N.; Song, L. Thermal degradation and flame retardance of biobased polylactide composites based on aluminum hypophosphite. Ind. Eng. Chem. Res. 2012, 51, 12009–12016. [Google Scholar] [CrossRef]
  49. Yi, J.; Yin, H.; Cai, X. Effects of common synergistic agents on intumescent flame retardant polypropylene with a novel charring agent. J. Therm. Anal. Calorim. 2013, 111, 725–734. [Google Scholar] [CrossRef]
Figure 1. SEM micrographs of aluminum hypophosphite (AHP) microparticles before milling.
Polymers 12 00644 g001
Figure 2. TEM micrographs of AHP nanoparticles obtained by milling.
Polymers 12 00644 g002
Figure 3. Nonisothermal DSC thermograms of epoxy and epoxy/AHP nanocomposites at heating rates of: (a) 5, (b) 10, (c) 15 and (d) 20 °C·min−1.
Polymers 12 00644 g003
Figure 4. Graphical representation of cure state of epoxy nanocomposites, ΔH* and ΔT* are dimensionless enthalpy and temperature interval for the complete curing process.
Polymers 12 00644 g004
Figure 5. Fractional extent of conversion vs. time for epoxy and AHP/epoxy nanocomposites at heating rates of (a) 5, (b) 10, (c) 15 and (d) 20 °C/min.
Polymers 12 00644 g005
Figure 6. Evolution of activation energy as a function of the extent of cure reaction for epoxy and AHP/epoxy nanocomposites estimated by (a) differential Friedman and (b) integral Kissinger methods.
Polymers 12 00644 g006
Figure 7. Comparison of experimental data with the kinetic models for the prepared samples at heating rate of 5 °C/min as a typical of computations done based on Friedman and Kissinger models.
Polymers 12 00644 g007
Figure 8. (a) TGA and (b) DTG thermograms of neat epoxy and its nanocomposites containing 0.1, 0.3 and 0.5 wt.% of AHP.
Polymers 12 00644 g008
Figure 9. Possible decomposition mechanism of epoxy network in the presence of low (0.1 wt.%) and high (0.5 wt.%) AHP loadings.
Polymers 12 00644 g009
Table 1. Cure characteristics of epoxy and its nanocomposites as a function of heating rate (β).
Designationβ (°C/min)TonsetTp (°C)TendsetΔT (°C)ΔH (J/g)ΔT*ΔH*CIQuality
526.886.9143.7116.8179.9n.a.n.a.n.a.n.a.
Epoxy1027.798.8139.9112.1192.5n.a.n.a.n.a.n.a.
1535.1111.7147.3112.2132.5n.a.n.a.n.a.n.a.
2040.6118.42150.5110.0145.9n.a.n.a.n.a.n.a.
E-0.1 AHP519.086.5134.5115.4232.80.991.291.28Excellent
1026.9102.3143.9117.0201.21.041.051.02Good
1536.4115.6149.6113.2181.71.011.371.38Good
2041.2123.4156.2115.0165.21.051.131.19Good
E-0.3 AHP522.891.1135.2112.4196.50.961.091.05Excellent
1030.3102.3142.5112.2195.01.011.010.95Good
1534.1110.0147.6113.5192.81.011.461.47Good
2037.2115.7152.1115.0190.71.051.311.38Good
E-0.5 AHP522.390.6137.0114.8250.50.981.391.36Excellent
1028.1101.0145.8117.7213.51.051.101.09Good
1534.3109.3149.0114.7199.71.021.511.54Good
2035.5113.3152.8117.3172.21.071.181.26Good
Table 2. The values of αp, αm and αp obtained from DSC analysis based on the Malek model at various heating rates.
DesignationHeating Rate (°C/min)αpαmαp
Epoxy50.470.140.51
100.700.150.55
150.790.150.70
200.830.170.79
E-0.1AHP50.470.190.51
100.590.180.59
150.700.170.72
200.720.180.72
E-0.3AHP50.500.060.59
100.570.070.60
150.620.080.62
200.650.080.64
E-0.5AHP50.500.040.55
100.540.050.58
150.600.060.59
200.620.060.57
Table 3. The curing kinetic parameters of the samples based on Friedman and Kissinger models.
Designationβ (°C/min)Ēa (kJ/mol)ln A (s−1)Mean (s−1)mMeannMean
Friedman
Epoxy572.522.222.00.400.391.170.94
1022.10.391.00
1521.90.410.83
2021.90.370.78
E-0.1AHP564.419.619.30.270.291.120.89
1019.30.310.91
1519.20.310.77
2019.20.260.74
E-0.3AHP577.223.423.30.530.491.030.93
1023.40.510.94
1523.30.470.90
2023.30.440.85
E-0.5AHP580.724.624.50.560.521.191.06
1024.60.541.09
1524.50.530.98
2024.50.460.97
Kissinger
Epoxy562.418.918.80.260.251.080.87
1018.90.250.92
1518.70.270.77
2018.80.240.71
E-0.1AHP554.916.516.40.140.161.040.82
1016.40.180.83
1516.30.180.71
2016.40.130.69
E-0.3AHP569.321.021.00.430.390.970.88
1021.00.410.89
1521.10.3710.85
2021.00.340.80
E-0.5AHP572.521.921.90.440.411.110.99
1021.90.421.03
1521.90.410.92
2022.00.340.91
Table 4. Glass transition temperature of fully cured AHP/epoxy nanocomposites at β of 10 °C.min−1.
SampleTg (°C)
Epoxy73.2
E-0.1AHP79.5
E-0.3AHP73.1
E-0.5AHP69.5
Table 5. TGA data of neat epoxy and AHP/EP nanocomposites.
SamplesT5%(°C)T10%(°C)Residue Weight Ratio at 550 °C
Epoxy3193519.8%
E-0.1AHP3203489.0%
E-0.3AHP2953439.4%
E-0.5AHP29933710.7%

