Article

Cellulose Structural Changes during Mild Torrefaction of Eucalyptus Wood

1
Forest Research Center, School of Agriculture, University of Lisbon, Tapada da Ajuda, 1349-017 Lisboa, Portugal
2
CICECO, Chemistry Department, University of Aveiro, Campus de Santiago, P-3810-193 Aveiro, Portugal
*
Authors to whom correspondence should be addressed.
Polymers 2020, 12(12), 2831; https://doi.org/10.3390/polym12122831
Submission received: 5 November 2020 / Revised: 25 November 2020 / Accepted: 26 November 2020 / Published: 28 November 2020
(This article belongs to the Special Issue Degradation of Wood-Based Materials)

Abstract

:
The changes in the cellulose structure of eight Eucalyptus species (E. botryoides, E. globulus, E. grandis, E. maculata, E. propinqua, E. rudis, E. saligna and E. viminalis) in a mild torrefaction (from 160 °C to 230 °C, 3 h) were studied in situ and after cellulose isolation from the wood by solid-state carbon nuclear magnetic resonance (13C NMR), wide angle X-ray scattering (WAXS), Fourier transform infrared spectroscopy (FTIR) and by analytic pyrolysis coupled with gas chromatography and mass spectrometry (Py-GC/MS). Changes in molecular weight were assessed by viscosimetry. A small decrease in cellulose crystallinity (ca. 2%–3%) was attributed to its amorphization on crystallite surfaces as a result of acid hydrolysis and free radical reactions resulting in the homolytic splitting of glycosidic bonds. The degree of the cellulose polymerization (DPv) decreased more than twice during the heat treatment of wood. It has been proposed that changes in the supramolecular structure of cellulose and in molecular weight during a heat treatment can be affected by the amount of lignin present in the wood. The limitations of FTIR and Py-GC/MS techniques to distinguish the minor changes in cellulose crystallinity were discussed.

1. Introduction

Wood is a natural complex of plant polymers, constituted mainly by cellulose, lignin and hemicelluloses, which provide it with unique physical properties. Wood is the oldest material used by humankind for the most varied of purposes, from elements of household utensils to construction materials. Thus, wood is recognized as an environmentally sound building material, for flooring, furniture, and interior decoration due to its intrinsic esthetic value, excellent physical and mechanical properties, and relatively low price. Although wood has increased its consumer value due to being a sustainable natural resource, some of its shortcomings, such as high hydroscopicity, cause dimensional instability of wood-made products [1]. Another weak point of wood as a material is its biodegradability, i.e., susceptibility to either biotic or abiotic factors [2,3,4], creating some constrains/limitations when applying woody materials outdoors. To overcome these negative aspects, different kinds of protectors (e.g., vanishes, paints, coatings and chemical treatment) have been applied to wood products to enhance its durability [5]. Anaerobic heat treatment has been known since the 1920s as an alternative method of wood protection, providing a radical improvement in the dimensional stability of heat-treated wood [6,7]. Thermal pretreatment or mild torrefaction of wood is usually carried out at moderate temperatures (150–250 °C) to preserve its mechanical properties. Modern industrial approaches for the thermal treatment or heat modification/mild torrefaction, such as, for example, Thermowood® technology, are environmentally friendly and highly effective processes to enhance the dimensional stability and decay resistance of wood without using any toxic chemicals, but they can lower its mechanical properties [8,9]. In this context, the understanding of the thermal behavior of wood components under conditions of thermal pre-treatment of wood is of great relevance.
The composition of the cell wall material in wood and its physical properties are changed by exposure to temperatures greater than 160 °C under oxygen-depleted conditions [10]. It is not entirely clear what actually happens to the structural elements of the wood, and this is a subject of study and discussion. Thus, it is evidenced that hemicelluloses are firstly degraded during thermal treatment of wood by depolymerization via homolytic slitting of glycoside bonds and by hydrolysis, loss of volatile products and extensive deacetylation [8,11,12,13]. Lignin is believed to be more resistant to thermal degradation than polysaccharides [8], but it also undergoes certain condensation and esterification reactions and is partially demethoxylated [14,15]. Recently, the typical lignin reactions of different Eucalyptus species thermally treated at 160–230 °C were reported, which included homolytic cleavage of ether linkages responsible for a ca. 25% reduction in its molecular weight and the formation of different condensation structures via radical coupling [16].
Cellulose is the dominant polymer in wood composed of linear chains of β(1→4)-linked β-D-glucopyranose units and forming alternating crystalline and amorphous regions in bulk due to the strong intra- and intermolecular hydrogen bonds [17]. This amorphous-crystalline structure largely affects the cellulose thermal behavior during wood thermal pretreatment. According to common opinion, unlike hemicelluloses, cellulose undergoes much less depolymerization and reveals changes in its physical structure, expressed in the increase in crystallinity due to the partial hydrolysis/recrystallization of the amorphous counterpart [18,19,20,21]. However, as it was widely reviewed [8,9,20], to date, there is no consensus in relation to exact changes in cellulose supramolecular structure under heat treatment. In fact, researchers often report contradictory data about changes in cellulose crystallinity after heat treatment. This can be explained by the diverse thermal treatment conditions used in these studies [22,23,24,25], wood humidity [18], employed equipment [26] and the methods involved to assess the cellulose crystallinity and the fibrils dimensions [22,23,24,25,26,27]. However, it is widely accepted that in addition to hydrolytic reactions due to the release of water and organic acids from wood, the degree of cellulose polymerization is reduced as a consequence of the regeneration of free radicals (homolytic splitting of glycosidic bonds), formation of carbonyl groups and carboxyl, and carbon dioxide [18,19,20,21,26].
Since cellulose is greatly responsible for the mechanical properties of wood, its behavior during the mild torrefaction of wood is of particular interest. The critical aspect is the knowledge on cellulose crystallinity evolution upon heat pretreatment, because the crystalline state significantly influences such properties as the elasticity and absorptive capacity, and other industrially valuable physical properties (strength, density, surface energy, etc.). Accordingly, the aim of this study was to contribute comprehensively to the knowledge on cellulose behavior during thermal pretreatment of wood by employing wide-angle X-ray scattering (WAXS), solid-state carbon nuclear magnetic resonance (13C NMR), Fourier transform infrared (FTIR) and pyrolysis, coupled with gas chromatography and mass spectrometry (Py-GC-MS) techniques. For this purpose, the eight Eucalyptus species (E. globulus, E. botryoides, E. viminalis, E. grandis, E. rudis, E. maculata, E. saligna and E. propinqua) submitted to an industrial thermal treatment under controlled conditions (160–230 °C, 3 h) and the treated and non-treated wood samples were evaluated in situ and after the cellulose isolation from some point samples by the aforementioned techniques. This multi-analytical approach allowed a critical examination and new findings of structural changes in cellulose structure during the industrial mild torrefaction of wood.

2. Materials and Methods

2.1. Raw Materials and Thermal Treatment

Eight Eucalyptus wood species were used in this study, all being grown under the same edaphoclimatic conditions in an arboretum localized in the School of Agriculture (ISA), Portugal: E. globulus, E. propinqua, E. botryoides, E. viminalis, E. grandis, E. rudis, E. maculata, and E. saligna. The trees were harvested at the age of six years, cut in logs and fractionated in boards that were thermo-modified by gradually heating them from 160 to 230 °C during 3 h in an industrial oven provided by Santos & Santos Madeiras, a Portuguese Company under the trademark of Atlanticwood® (http://atlanticwood.pt). After the treatment, the boards were stored under dark at room temperature with 60% relative humidity to stabilize.

2.2. Analysis of Wood

Samples of the wood boards were reduced manually to chips, grinded in a cross beater RETSCH mill (SK100) with a 1 mm sieve, and the 40–60 mesh fraction recovered for chemical analysis. The chemical analysis involved the quantification of holocellulose and the sugars’ monomeric composition, where here the focus was on the glucose and acetyl groups, using procedures described in the previous work [28]. The 40–60 mesh fraction of the eight species of wood (before and after thermal treatment) were also analyzed by 13C CP/MAS NMR in a Bruker Avance 400 spectrometer (magnetic field of 9.4 T). The samples were spun in a 7 mm zirconia’s rotor (12 kHz), and the following acquisition parameters applied: a proton pulse of ca. 4 µs (90°), contact time of 2 ms, recovery delay of 4 s and 8000–9000 scans accumulated. The Hartman–Hahn matching procedure used glycine that also served as an as external standard for the calibration of the chemical shift scale relative to tetramethylsilane ((CH3)4Si).

2.3. Cellulose Isolation

The cellulose was isolated from the solid residues belonging to E. globulus and E. propinqua, before and after the heat treatment, using the Kürschner and Hoffer isolation procedure. The residual xylan content did not exceed 3%–4%. Typically, around 1 g of woody material was treated by several consecutive stages with HNO3: EtOH mixture (1:4, v/v) with a liquid-to-solid ratio 50 under reflux for 1 h each. The end of the treatments was checked by Herzberg reagent [29]. The final cellulose residue was washed by ethanol and hot distilled water until neutral reaction of filtrates.
Alternatively, cellulose samples were prepared from peracetic holocellulose obtained by the treatment of wood sawdust (40–60 mesh) with 10% peracetic acid for 20–25 min at 85 °C [30]. The holocellulose was extracted twice with dimethyl sulfoxide (DMSO) at 50 °C for 12 h each extraction to eliminate most of the xylan without damaging the polysaccharides [31]. These cellulose samples were used for the analysis of the degree of polymerization by viscosimetry.

2.4. Cellulose Characterization

Isolated cellulose samples (Kürschner and Hoffer) were analyzed as textured samples (ca. 50 mg of cellulose was pressed at 50 MPa in 1 mm thickness pellet of around 1.2 cm diameter) by X-ray diffraction scattering analysis (WADS) in a Philipps X’Pert MPD diffractometer using Cu-Kα source (λ = 0.154 nm) in the 2θ range 2°–40° and scanning step width of 0.02°/scan. The background scattering was subtracted from the cellulose diffraction diagram using WINPLOTR software. The amorphous halo was determined after the baseline correction in the 2θ range of 12°–30° assuming a maximum intensity in between 19° and 20°, and the crystalline reflection profiles were fitted using the Lorentzian function. The degree of cellulose crystallinity (DC0) was calculated from the integral scattering intensities of the crystalline (Ic) and the amorphous (Ia) regions [31] according to Equation (1):
D C 0 , % = I c I c + I a 100
The average width of crystallite in the 200-lattice plane (D200) was determined using the Scherer equation, taking into account the crystallite defects [32]:
D 200 , n m = [ ( β 200 cos θ 200 λ ) 2 ( δ L d L ) 2 ] 1 2
where β200 is the width on the middle height of the 200 reflection (in rad); θ200 is the maximum of the 200 reflection (in rad); λ is the wavelength of the X-ray source (λ = 0.154 nm), δL is a parameter related to the lattice distortion perpendicular to the 200 plane direction (0.05), and dL represents the average distance between the 200 lattice planes (0.395 nm). The dimensions of the cell unit were calculated from Bragg’s equation relating the spacing between the scattered planes, d, and the angle between the incident ray and the scattering planes (θ, deg.):
d = n λ 2 sin θ
Fourier transform infrared analysis (FTIR) was performed with the samples in potassium bromide (KBr) pellets and the spectra were acquired on a FT-IR spectrometer (Mattson, Model 7300) at 4 cm−1 of resolution, 128 scans per set and over a range of 4000–525 cm−1. The crystallinity parameter (CrP) was calculated by the ratio of the transmittance peaks recorded at 1372 cm−1 (T1372) and at 2900 cm−1 (T2900) according to Tripp [33], as presented in Equation (4):
C r P , % = T 1372 T 2900 100
Other indices were also calculated based on the absorbance values (A = 2-log(T)). The lateral order index (LOI) was calculated as the ratio between the absorbance at 1423 cm−1 (associated with the amount of crystalline cellulose) and the absorbance at 897 cm−1 (assigned with the glycosidic bond β-(1,4) stretching in cellulose). The HBI (hydrogen bond intensity) was obtained as the ratio from absorbance at 3336 cm−1 (OH stretching, H-bonds between molecules) and the absorbance at 1335 cm−1 (CH rocking vibrations of the glucose ring) [34].
Cellulose was also analyzed by 13C CP-MAS NMR (solid-state Cross Polarization—Magic Angle Spinning Nuclear Magnetic Resonance). The spectra were recorded on a Bruker Avance 400 spectrometer, where the samples were packed into a zirconia’s rotor sealed with Kel-FTM caps and spun at 12 kHz. The acquisition parameters were the following: ca. 7000 scans with a 90° proton pulse, a 1 ms of cross-polarization contact time and a 2.5 s of recovery delay.
The crystallinity index (CrI) was calculated from the relationship between the integration areas of the ordered (A86–92 ppm) and amorphous (A79–86 ppm) C-4 signals in cellulose [35] using the Equation (5).
C r I , % = A 86 92 p p m A 86 92 p p m + A 79 986 p p m 100
The index for the carboxyl/ester groups (ICO2) was calculated based on the carbon signals from the corresponding groups at 165–178 ppm using the intensity of anomeric carbon (C1) in cellulose at ca. 105 ppm as an internal standard. The lateral dimensions of fibril aggregates were calculated as described by methodology proposed by Wickholm et al. [36] according to the model of a fibril with a square cross-section given by the equation:
q = 4 n 4 n 2
where q is the fraction of intensity of the signal of accessible surfaces. The accessible and inaccessible cellulose surfaces were estimated by deconvolution of the corresponding signals in 13C CP-MAS NMR spectra (Figure S1 in Supplementary Materials). The calculated number of cellulose chains perpendicular to the fibril cross-section along one side of the assumed square fibril or the assumed square fibril aggregate cross-section n can be converted to a lateral dimension expressed in nm using a factor of 0.55 nm per chain.
The cellulose samples were analyzed by analytic pyrolysis coupled with gas chromatography and mass spectrometry (Py-GC/MS) after milling in a Retsch MM20 mixer ball mill (10 min). Around 0.10 mg of cellulose was pyrolyzed (550 °C for 1 min) in a platinum coil Pyroprobe connected to a CDS 5150 valved interface linked to a gas chromatographer (Agilent 7890B) with a mass detector (5977B), and using a fused-silica capillary column (ZB-1701: 60 m × 0.25 mm i.d. × 0.25 µm film thickness). The chromatographic conditions used were: 40 °C, held for 4 min, 10 °C min−1 to 70 °C, 5 °C min−1 to 100 °C, 3 °C min−1 to 265 °C, held for 3 min, 5 °C min−1 to 270 °C, held for 9 min. The temperatures applied were as follows: 270 °C (injector), 280 °C (MS interface). The electron ionization energy was at 70 eV. Helium was the carrier gas with a total flow of 1 mL/min. The compounds were identified comparing their mass spectra with Wiley, the NIST2014 database and the literature [37,38]. The total area of the chromatogram was obtained automatically and the percentage area of each compound identified calculated.
The average viscosimetric degree of the polymerization (DPv) of cellulose was calculated from the Equation (6), proposed by Evans and Wallis [39] and using the data for the intrinsic viscosity ([η]) obtained according to SCAN-CM 15:88 in cupriethylenediamine solution:
1.1 [ η ] = ( D P v ) 0.85

3. Results and Discussion

3.1. Chemical Analysis of the Thermally Treated Woods

A summary of the chemical analyses of the eight Eucalyptus species showed that the heat treatment promotes an average mass loss of ca. 11% among the woods, with the major loss being observed for the E. propinqua, where the loss was as higher as 12%, followed by E. viminalis and E. saligna (Table 1). E. maculata, E. globulus and E. grandis showed slightly lower mass loss (ca. 10%). Holocellulose content showed an average reduction of 16%, while in E. propinqua and E. globulus, the content decreased by 19% and 16%, respectively. This reduction was mostly due to the degradation of xylan since the percentage of glucose (based on total sugars) increased more or less equally in all species in the order of 20% (E. propinqua) to 33% (E. viminalis) (Table 1). In addition, the drastic reduction in acetyl groups belonging to xylan was evident in all treated woods (average of 57%), in percentages ranging from 40% (E. propinqua) to 56% (E. rudis). The opposite trend was observed in the total lignin content, which increased by an average of 33%, where E. maculata showed the highest growth (60%) and E. viminalis the lowest (23%). The total lignin content accounts for the lignin itself and some other concomitants (e.g., tannins) and heat degradation products resulting from carbohydrates and extractives [16]. These results are coherent with others previously reported for the hardwoods’ thermal treatment at a similar range of temperatures [26,40,41] and evidenced the relative stability of lignin and cellulose towards thermal destruction.
It is noteworthy that the bond dissociation energy (BDE) of glycoside linkage in cellulose [42] and of ether linkages in lignin [43] are of the same order (ca. 54 and 40–60 kcal.mol−1, respectively), but the glycoside bonds are much more susceptible to hydrolysis that the ether bonds in lignin. That is why the main degradation of the cellulosic chains is attributed mainly to the hydrolysis of accessible cellulose regions, rather than to homolysis, which becomes quite significant at temperatures as high as 240–250 °C [22]. On the other hand, the high cellulose crystallinity and the arrangement of cellulose fibrils in the cell wall (fibrils are embedded to the lignin matrix) drastically decrease the cellulose ability to undergo hydrolysis catalyzed by the organic acids released in the heat treatment of wood. It is proposed that lignin could play a role of cellulose protector in the heat treatment of wood [44].
Regarding the structural changes of cellulose in the mild torrefaction of wood (160–240 °C), there are strong arguments in favor of both a possible increase and decrease in the degree of cellulose crystallinity (DC). On the one hand, the amorphous cellulose is more susceptible to hydrolysis induced by wood degradation products than the crystalline regions. This could naturally increase the crystalline cellulose phase, also due to the partial recrystallization of the amorphous and paracrystalline regions and cocrystallization of neighboring crystallites [18,19,20,21,22,23]. On the other hand, part of the crystalline cellulose can be also amorphisized from the fibrils’ surface due to the same hydrolysis reactions, homolytic splitting of glycoside bonds and the cellulose chains’ rearrangements [23]. The latest transformations are certainly prevalent at temperatures as high as 240–250 °C [22,23]. However, at temperatures below 240 °C, both a decrease [25,45] and an increase [24] in cellulose DC have been reported. This point was of particular attention in this study and evaluated by a set of analytical techniques recognized in the area.

3.2. Changes in Cellulose Structure during the Thermal Treatment

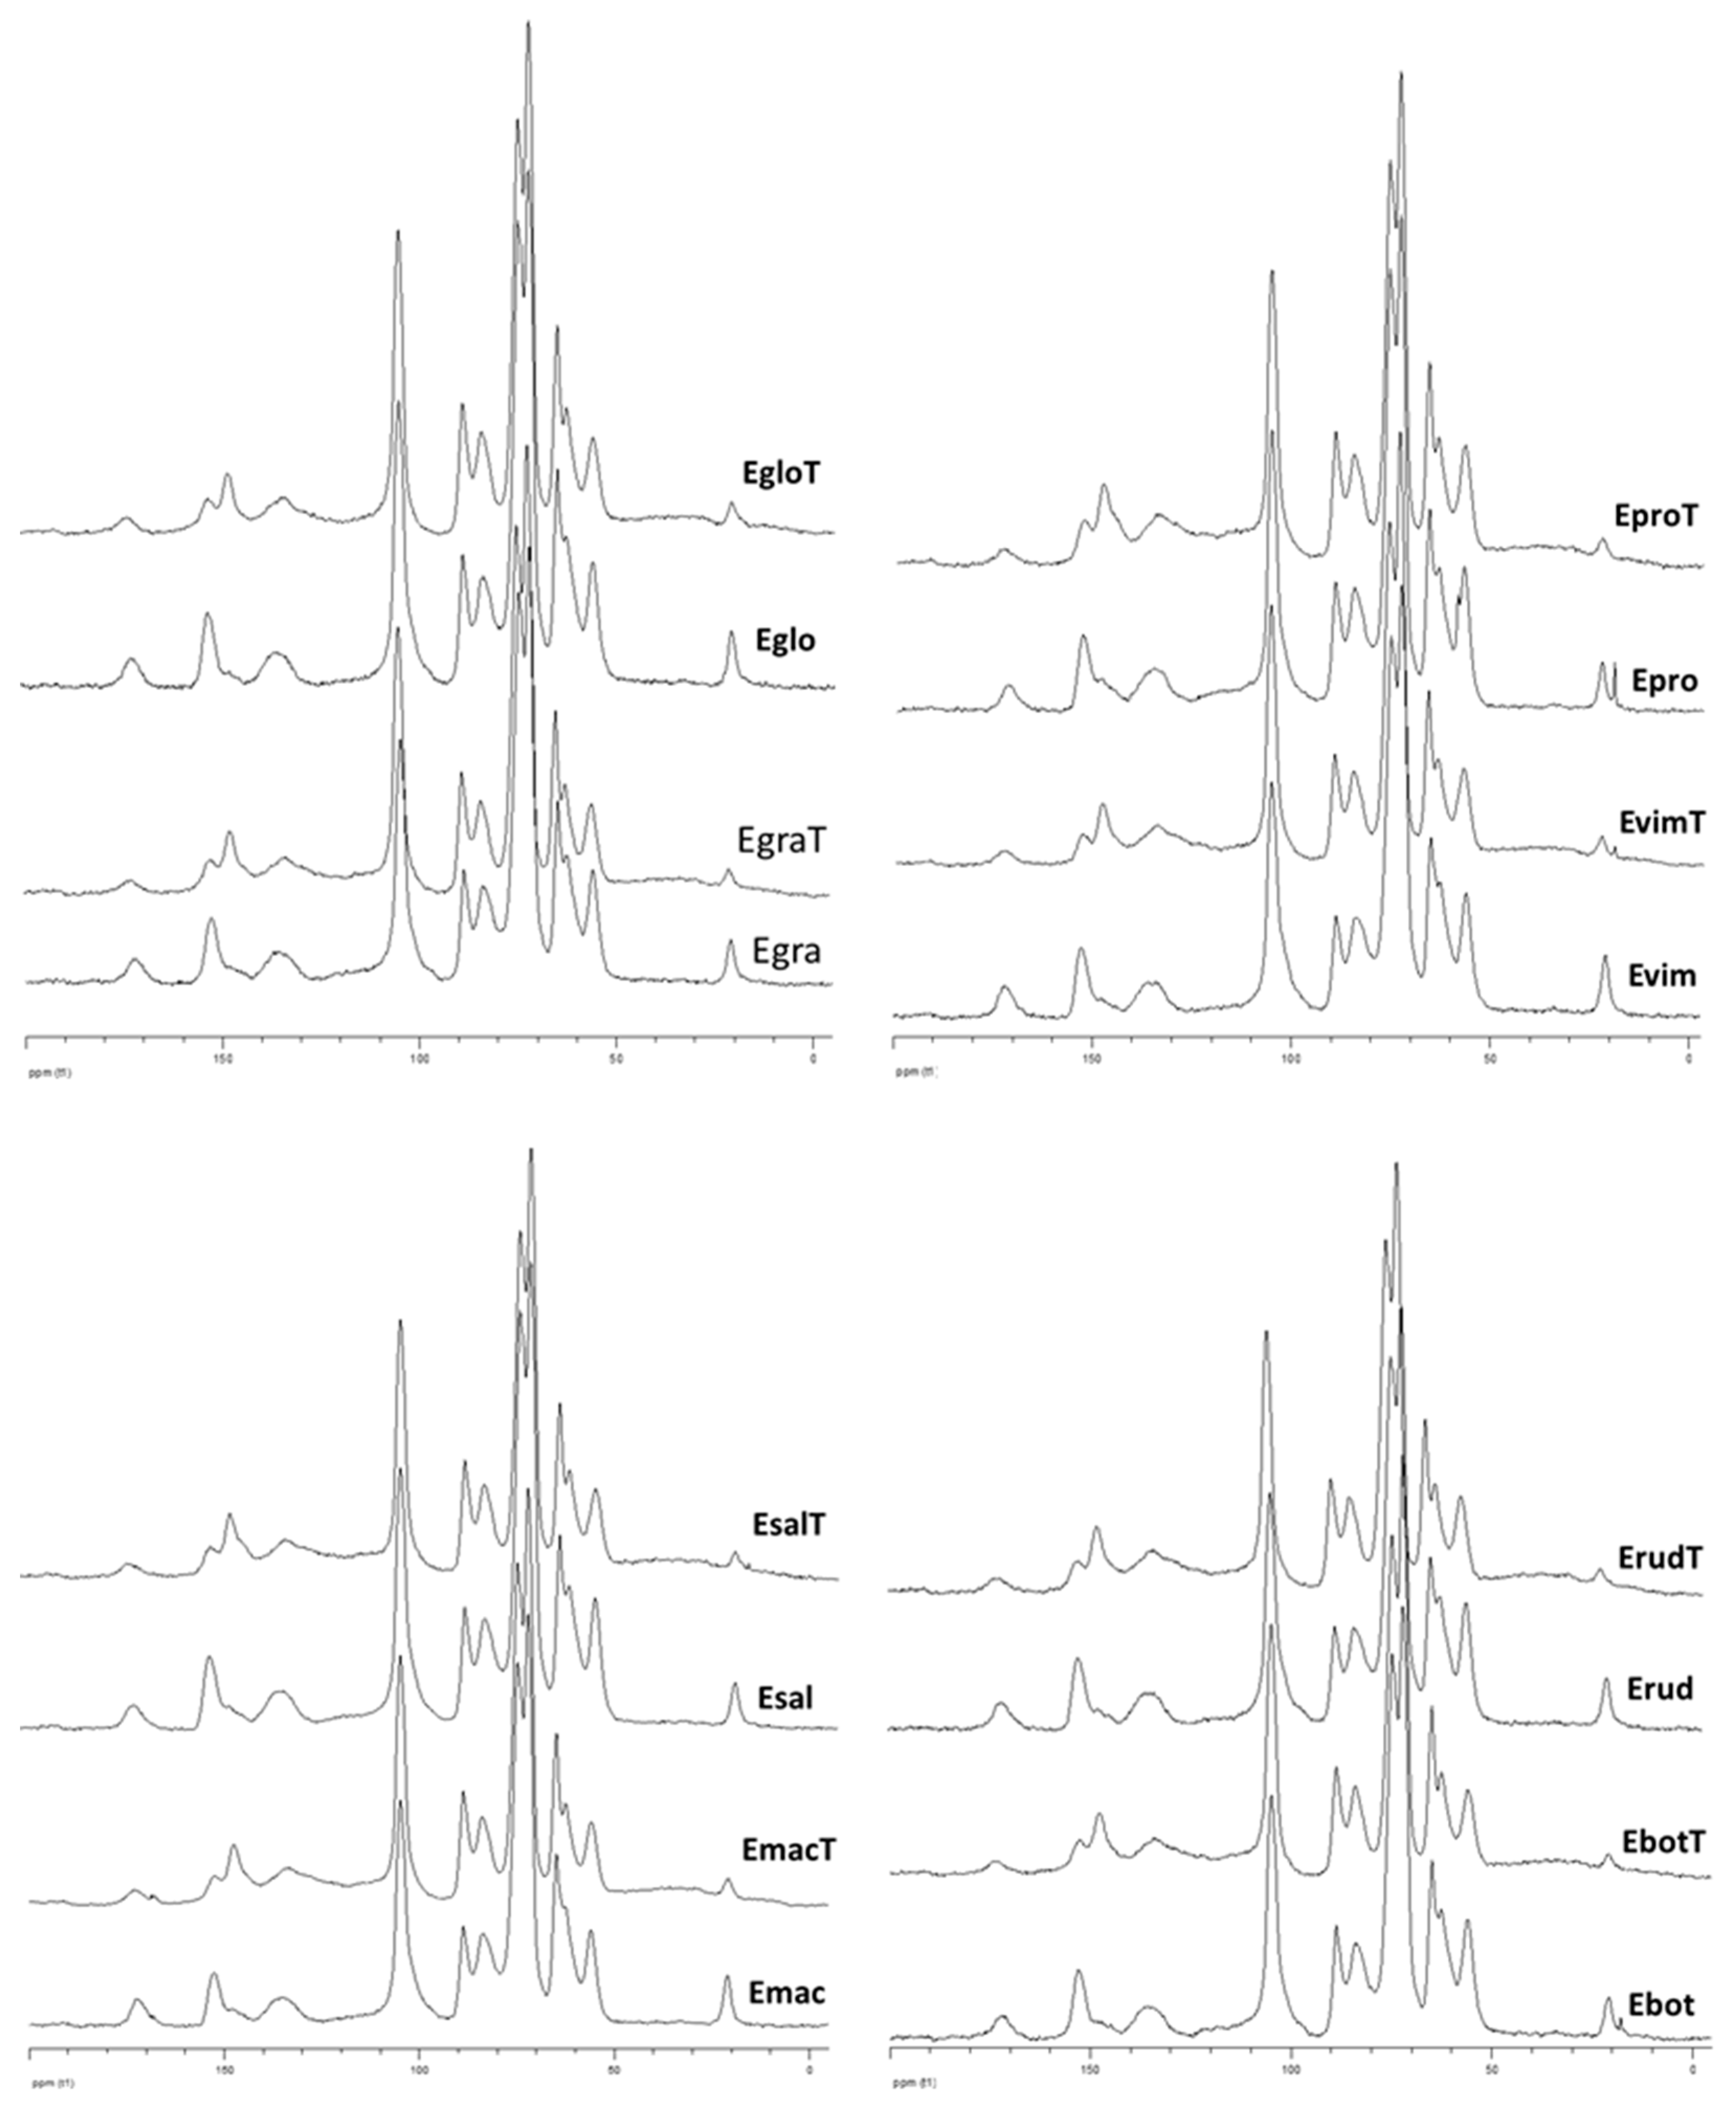
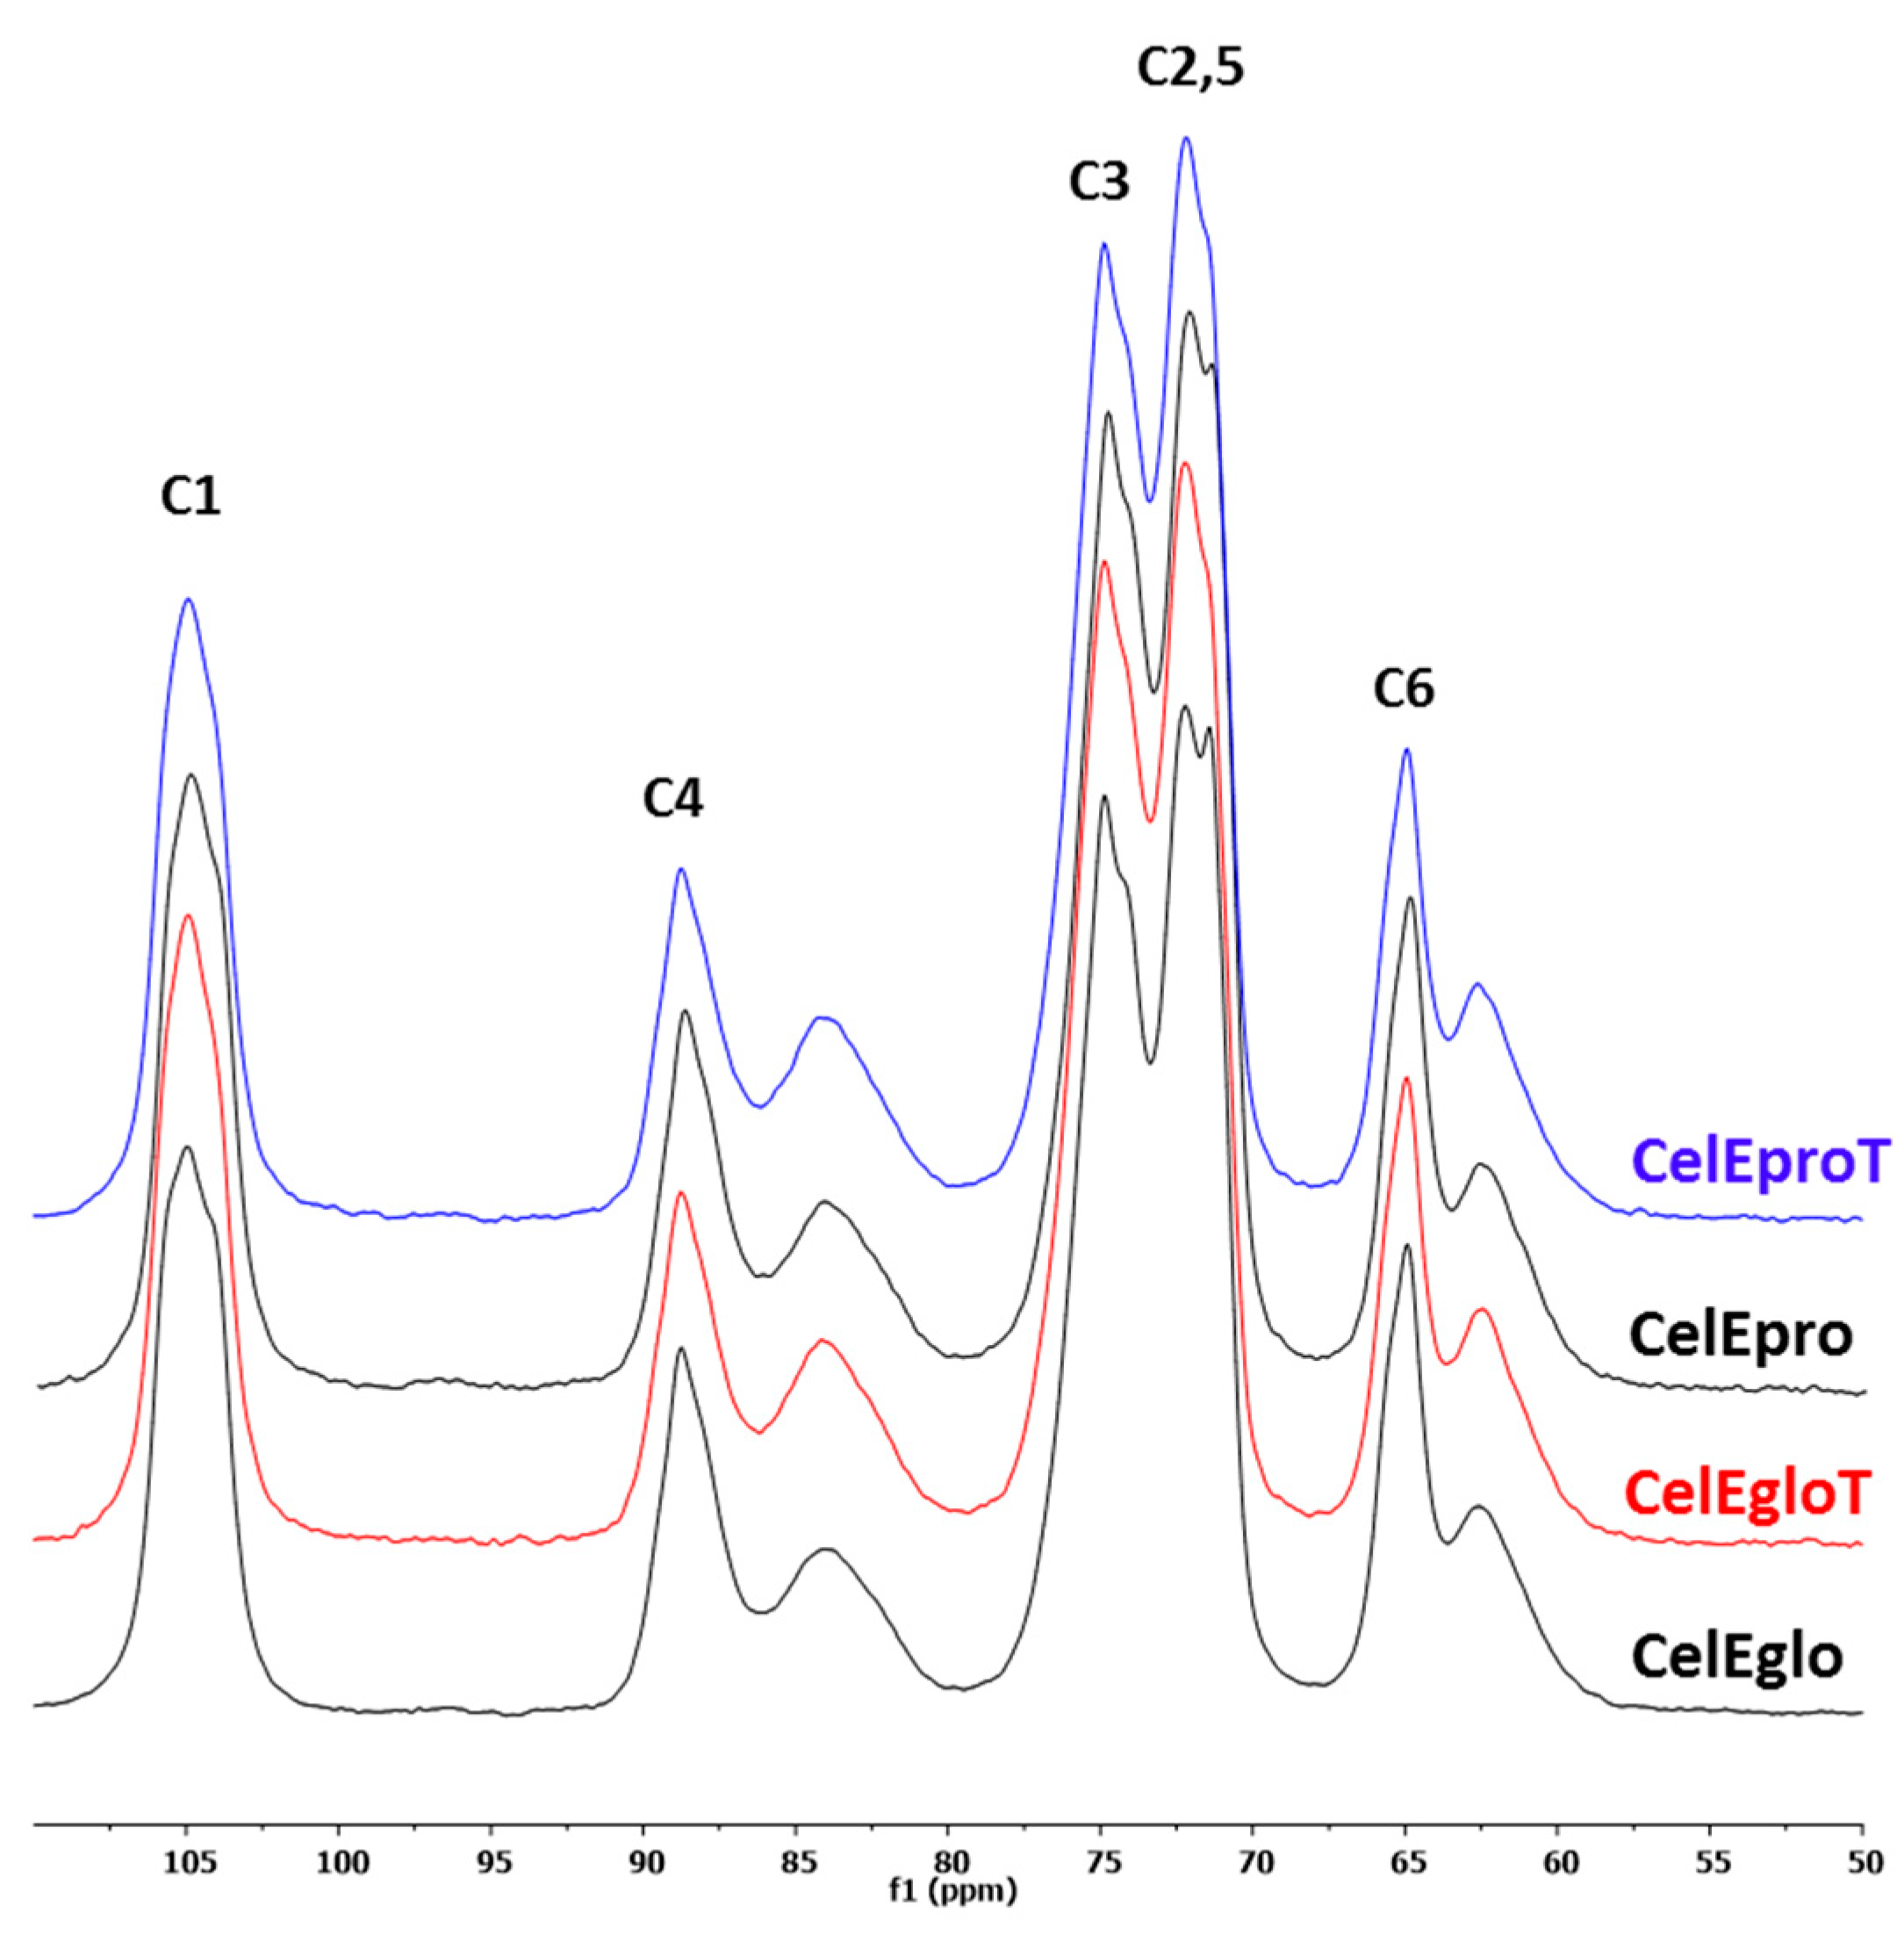
3.2.1. CP-MAS 13C NMR Analysis

The structural features of cellulose during the thermal treatment of different Eucalyptus species were analyzed by solid-state 13C NMR using integral wood sawdust. Semi-quantitative analysis was carried out using the crystallinity index (CrI) of cellulose and estimating the amounts of carboxyl and ester groups (–CO2−) per one glucopyranose unit using the signal of C1 in cellulose as an internal standard (Table 2). The amount of the carbonyl groups was too small and they were not considered for the analysis. The CrI relates to cellulose DC reflecting the relative proportion of conventional crystalline and amorphous cellulose [35]. CrI is always smaller than DC and is a useful indicator for comparative reasons.
The Eucalyptus species showed similar spectral features before and after the thermal treatment (Figure 1). The CrI was always greater for the treated than for the untreated woods. However, this fact does not indicate an unconditional increase in the DC of cellulose during the thermal treatment of wood. The fact is that the spectra regions used for the CrI determination belong not only to cellulose, but also to lignin and hemicelluloses (mainly xylan). The spectrum region at 79–86 ppm is especially critical, because it contributes simultaneously to the C4 in glucopyranose units of predominantly amorphous cellulose, to Cβ in β-O-4 lignin structures and to C3 of the xylan [35]. Independently of the cellulose structural behavior, the integral intensity of this spectrum region in a treated wood decreases due the appreciable cleavage of β-O-4 lignin structures [16] and a drastic degradation of the xylan (Table 1). Therefore, the inferred CrI of cellulose is significantly overestimated and does not reflect unambiguously the changes in the supramolecular structure of the cellulose. The adequate deconvolution and subtraction of signals other than those of cellulose from the aforementioned region is very difficult due to the uncertainty of the contribution of each of them.
The profile of carboxyl/ester groups in treated/non treated woods was ambiguous, showing simultaneously the same (E. propinqua and E. saligna), greater (E. globulus) or lower (E. botryoides, E. viminalis, E. grandis, E. rudis and E. maculata) levels after the treatment (Table 2). Again, these –CO2–groups belong to cellulose, lignin and hemicelluloses, which have different behavior under conditions of heat treatment. Supposing the formation of new carboxyl/ester groups in cellulose and lignin during the treatment, the strong deacetylation of the xylan might be taken into account. In fact, a notable loss of acetyl groups from xylan in a range from 18% (E. grandis) to 46% (E. saligna) was detected (Table 2), which negatively contributed to the intensity of signals at 165–178 ppm. Hence, the clear tendency towards the formation of new oxidized groups in cellulose during the heat treatment was inconclusive.
In order to assess more accurately the structural changes in cellulose during the thermal treatment, cellulose was isolated from the wood and analyzed again by solid-state 13C NMR (Figure 2). The Kürschner and Hoffer method, used in this study for the cellulose isolation, is usually employed for the quantitative cellulose analysis in plant materials and does not significantly change the physical structure of the cellulose [31]. Two eucalypt species were selected for comparative reasons, containing the lowest (E. globulus) and the highest (E. propinqua) lignin content (Table 1).
The results on CrI analysis clearly showed the decrease in cellulose crystallinity in both wood species during the thermal treatment (Table 3). In addition, the lateral dimensions of cellulose fibril aggregates (A) were reduced in the treated wood. The last fact indicates that the cellulose fibril surfaces in the treated wood contain some amorphous phase or non-cellulosic compounds (e.g., hemicellulose) that hindered the aggregation of the fibrils upon drying. The fibrils’ aggregation is strongly dependent of their surface purity and decreases drastically in the presence of hemicelluloses [35,46]. The only fibrils free of other concomitant cell wall polymers (e.g., hemicelluloses and lignin) are susceptible to the cocrystallization through the coalescence of neighboring crystallite regions with a small increase in DC [46,47]. However, the isolated cellulose samples did not contain lignin (negative reaction on the Herzberg reagent) and contained minimal amounts of hemicelluloses (less than 3%). Therefore, the surface amorphization of cellulose in fibrils during the heat treatment could be proposed.
The analysis of the 13C CP/MAS NMR of cellulose also showed some changes in the relative proportion of cellulose phases Iα and Iβ (Figure S1 in Supplementary Materials) after the wood treatment. The relative intensity of the C1 signals at 104 and 106 ppm decreases slightly and the signal at 105 ppm increases in the cellulose from the treated wood (Figure 2). The C1 signals at 104 and 106 are assigned to cellulose Iβ and the signal at 105 ppm is essentially assigned to the cellulose Iα [48]. The cellulose phase Iα has the triclinic unit cell and is located on the surface of the crystallite along the elementary fibrils, being alternated with phase Iβ that has the monoclinic unit cell [49,50]. Since the Iβ phase is dominant in plant celluloses, it might constitute the major core of crystallites. The phase Iα is metastable and usually converted to Iβ by annealing [49]. Therefore, the eventual assumption on the Iβ → Iα transformation to explain the Iβ phase reduction would be untenable. The plausible explanation could be the eventual partial amorphization of cellulose chains under heat treatment on the surface of crystallites that were removed, at least partially, jointly with hemicelluloses during the isolation of Kürschner and Hoffer cellulose under strong acidic conditions. In this case, the effective width of the crystallite could be reduced, leading to less phase Iβ, based on the proposition that the surface coverage with phase Iα remains similar. Previously, phase Iβ reduction has also been reported in heat treated wood during the analysis of cellulose isolated by the same method [25].
The moderate depolymerization of cellulose during the heat treatment of wood was confirmed when comparing DPv of isolated cellulose before and after the treatment (Table 3). The cellulose samples used in these analyses were obtained from corresponding peracetic holocelluloses that were thoroughly extracted by DMSO. Although these cellulose samples still contained hemicelluloses, they did not degrade as much as isolated α-cellulose samples explored previously for the same purposes [26]. This can explain some greater DPv values of cellulose obtained in our study when compared to those reported for the same wood and determined from the α-cellulose samples [26].

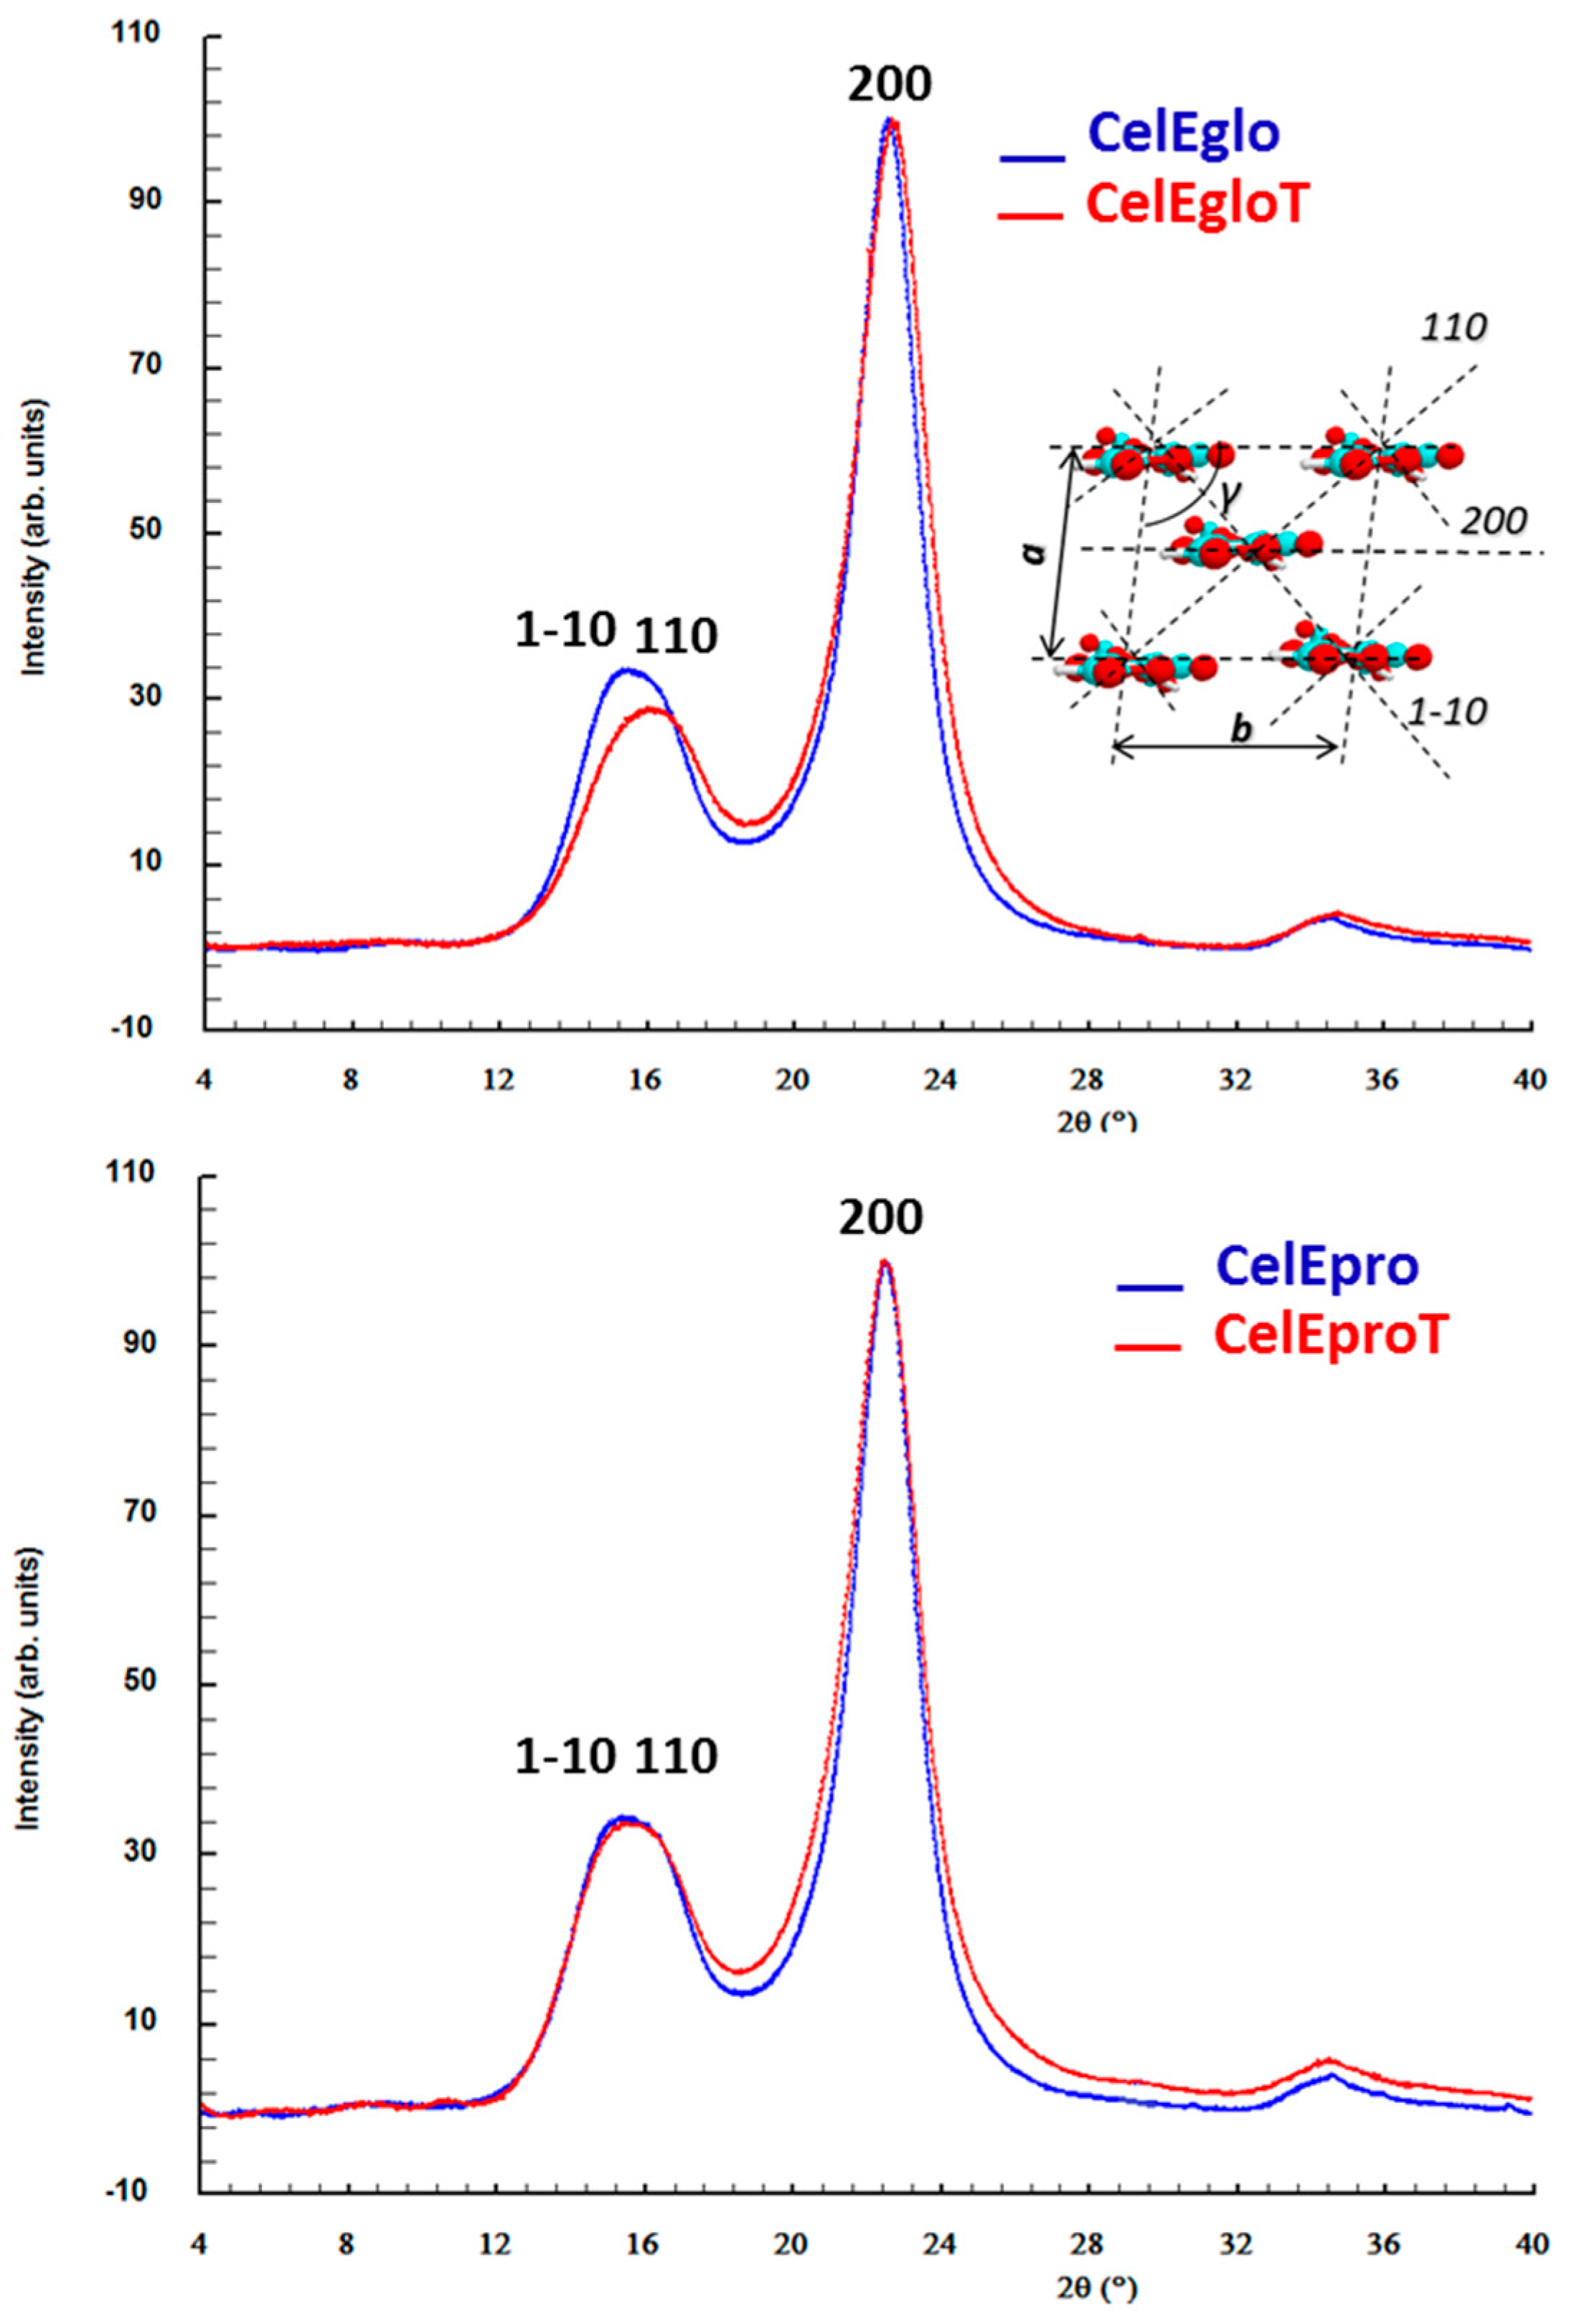
3.2.2. X-ray Scattering Analysis (WAXS)

Since the accurate determination of the DC of cellulose in wood by X-ray scattering is a complex analytical problem [32], these analyses were carried out using cellulose samples isolated from wood by the method of Kürschner and Hoffer. The WAXS analysis revealed changes in the diffractograms of cellulose samples isolated from untreated and thermally modified wood, dealing with some enlargement and a small change in the maximum reflections (Figure 3). This reveals changes in the lateral dimensions of crystallites (D200) and in the parameters of the elementary unit cell of cellulose I (Table 3). The obtained results clearly indicated the decrease in the DC of cellulose (ca. 2.5%) after heat treatment for both examined species (E. globulus and E. propinqua). This is in tune with results obtained by solid-state 13C NMR (Table 2). At the same time, WAXS data showed a decrease in D200 after the wood treatment. Hence, everything indicates a partial amorphization of cellulose on the crystallite surface during the mild torrefaction of the wood. The certain decrease in cellulose DC and/or the reduction in the average lateral dimension of cellulose crystallites under similar conditions of heat treatment used here were reported previously by other researchers both for hardwoods and softwoods [23,40,44].
It is noteworthy that greater changes in the DC and D200 of cellulose during heat treatment were observed for E. globulus than for E. propinqua (Table 4). This is coherent with data on the CrI obtained by solid-state 13C NMR (Table 3). Such a singularity may be related to the notably higher lignin content in E. propinqua when compared to E. globulus. The higher coverage of cellulose fibrils with lignin could favor better fibrils protection against acid-catalyzed degradation and the cleavage of glycoside bonds through free radical mechanisms during the heat treatment of wood.

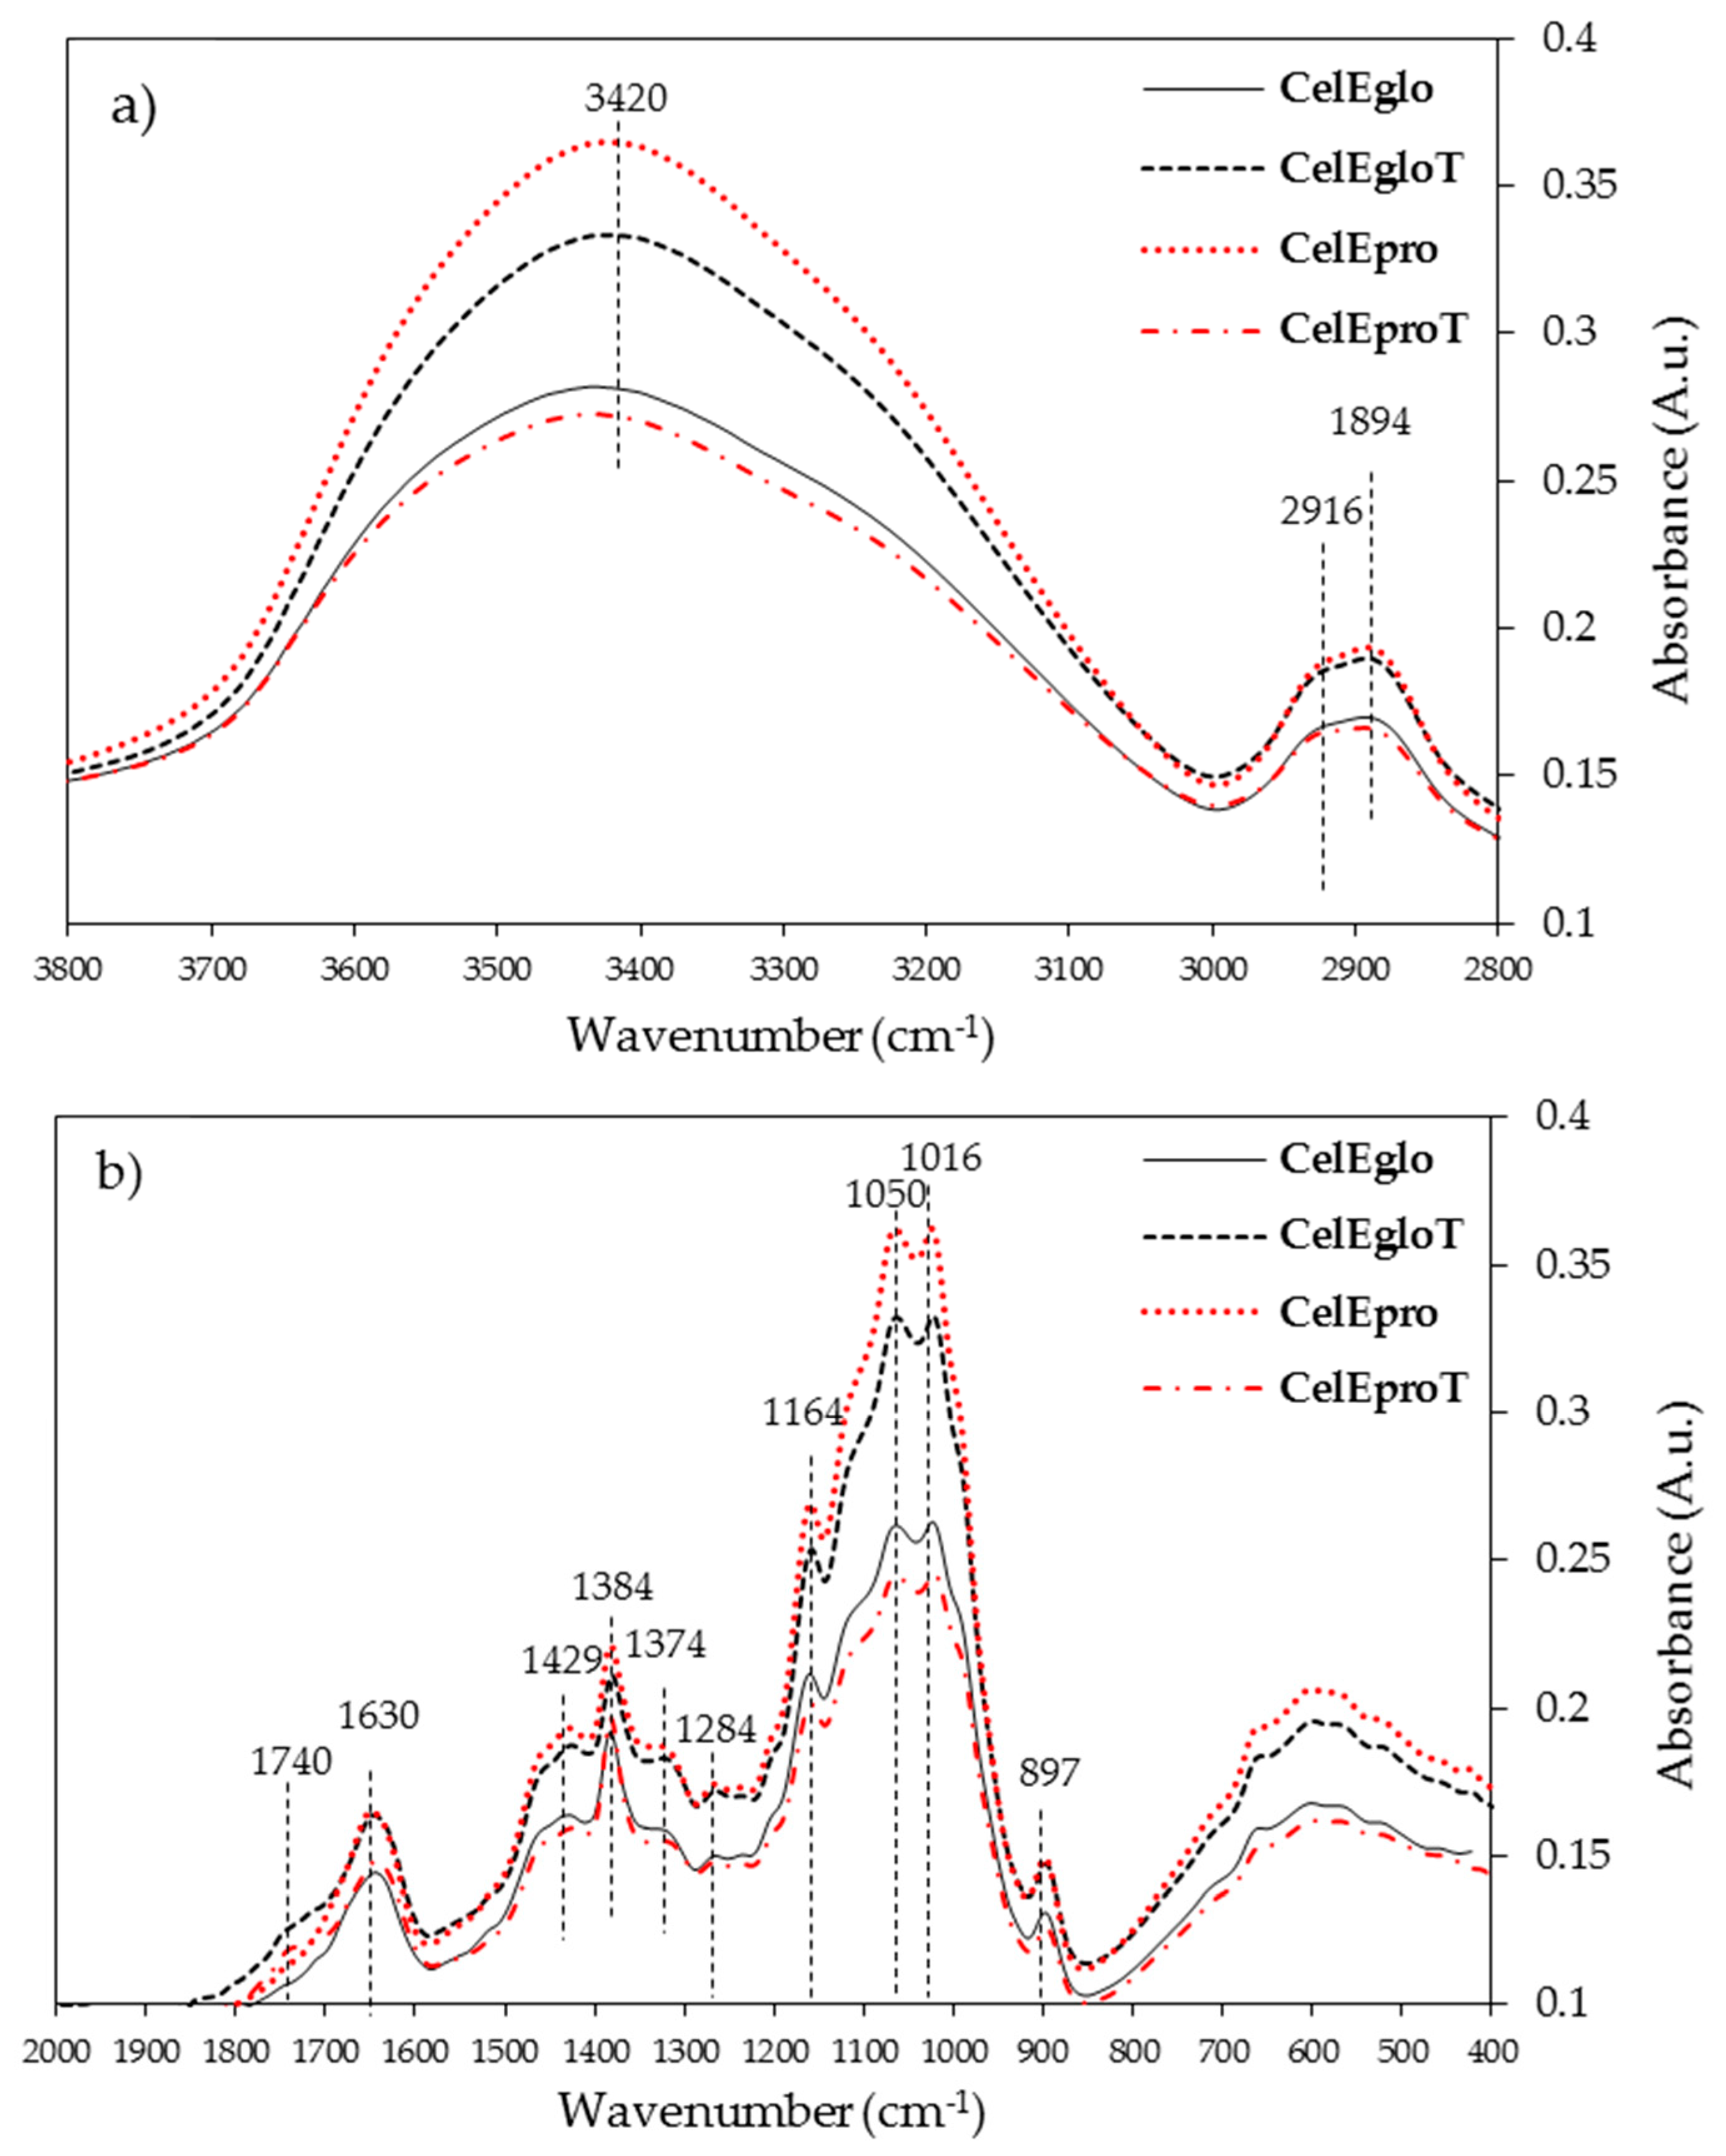
3.2.3. FTIR Analysis

Figure 4 shows the FTIR spectra of the isolated celluloses that are depicted in two regions: the 2800–3800 cm−1 (Figure 4a) and the 600–1800 cm−1 (Figure 4b) region. The celluloses from untreated woods were quite different from each other; in CelEpro the band between the 3600 and 3100 cm−1 region is sharper and with higher intensity comparative to CelEglo, and the opposite features occurred in the cellulose samples from treated woods. The band between the 3600 and 3100 cm−1 region is related to the O-H stretching, but also to the intensity of intramolecular and intermolecular hydrogen bonding [33,51]. The decrease in intensity of this band is related to the scission of intra- and intermolecular hydrogen bonds, meaning that these linkages were weaker in CelEglo than in CelEgloT and in CelEproT than in CelEpro. In addition, the amount of hydroxyl groups, absorbed water and the hydrogen bonding were more pronounced in the cellulose from E. propinqua (CelEpro) and E. globulus after the treatment (CelEgloT) due to the higher intensity of this band in these samples, which is in accordance with the higher glucan content in E. propinqua wood and in the E. globulus after the treatment (Table 1). The band centered at ca. 2900 cm−1 consists of overlapped bands at 1894 and 2916 cm−1 assigned to antisymmetric and symmetric CH2 stretching, respectively [33]. These bands followed the same intensity features as the bands centered at ca. 3420 cm−1 and were used for the evaluation of cellulose crystallinity as the reference.
The “fingerprint” region (1500 to 800 cm−1) presents similar signal profiles for all cellulose samples, showing, however, some differences in the intensity of the bands (Figure 4b). The absence of characteristics for lignin bands at 1737, 1594, 1510, and 1263 cm−1 and the strong band characteristics for the xylans at 1730–1740 cm−1 are noteworthy, thus evidencing the purity of isolated cellulose samples.
Table 5 summarises the values of CrP (crystallinity parameter), TCI (total crystallinity index), LOI (lateral order index) and HBI (hydrogen bond intensity). The CrP refers to the abundance of crystalline cellulose contributing substantially to the band at 1372 cm−1 assigned to C-H bending [33]. This parameter slightly decreased in E. globulus cellulose and increased in E. propinqua cellulose isolated after the wood heat treatment. The TCI represents the total crystallinity index, similar to the physical meaning of CrP, and the values were quite similar between cellulose samples isolated from untreated and treated wood samples (Table 5). The values for the empirical crystallinity index (lateral order index, LOI) are practically the same for cellulose from E. globulus and E. propinqua wood and unchanged after the thermal modification of wood (Table 5). The band at 1430 cm−1 refers to asymmetric CH2 bending vibration in the crystalline phase and the band 897 cm−1 is specific for the CH deformation vibrations in the glucopyranose ring [51].
Since the band at 3336 cm−1 is assigned to O-H stretching and hydrogen bonding between molecules and the band at 1335 cm−1 is assigned to CH rocking vibrations of the glucose ring, their ratio, known as the hydrogen bond intensity (HBI), relates to the degree of intermolecular regularity and the amount of bound water [34,51]. The HBI values in cellulose from untreated wood show that E. propinqua has a stronger hydrogen bonding when compared to E. globulus (1.95 vs. 1.77), but the heat treatment breaks more of these bonds in the case of E. propinqua, because the HBI decreased to 1.76. At the same time, these bonds were enhanced by heat treatment in the case of E. globulus since the value increased from 1.77 to 1.82. It seems that the FTIR technique is less sensitive in distinguishing the minor changes in cellulose crystallinity when compared to solid-state 13C NMR and WAXS. This was probably the reason why coherent conclusions were drawn for the structural changes of cellulose during the heat treatment of E. globulus wood by all these techniques and less conclusive results were obtained for E. propinqua, whose cellulose crystallinity changed less with the wood treatment (Table 3 and Table 4).

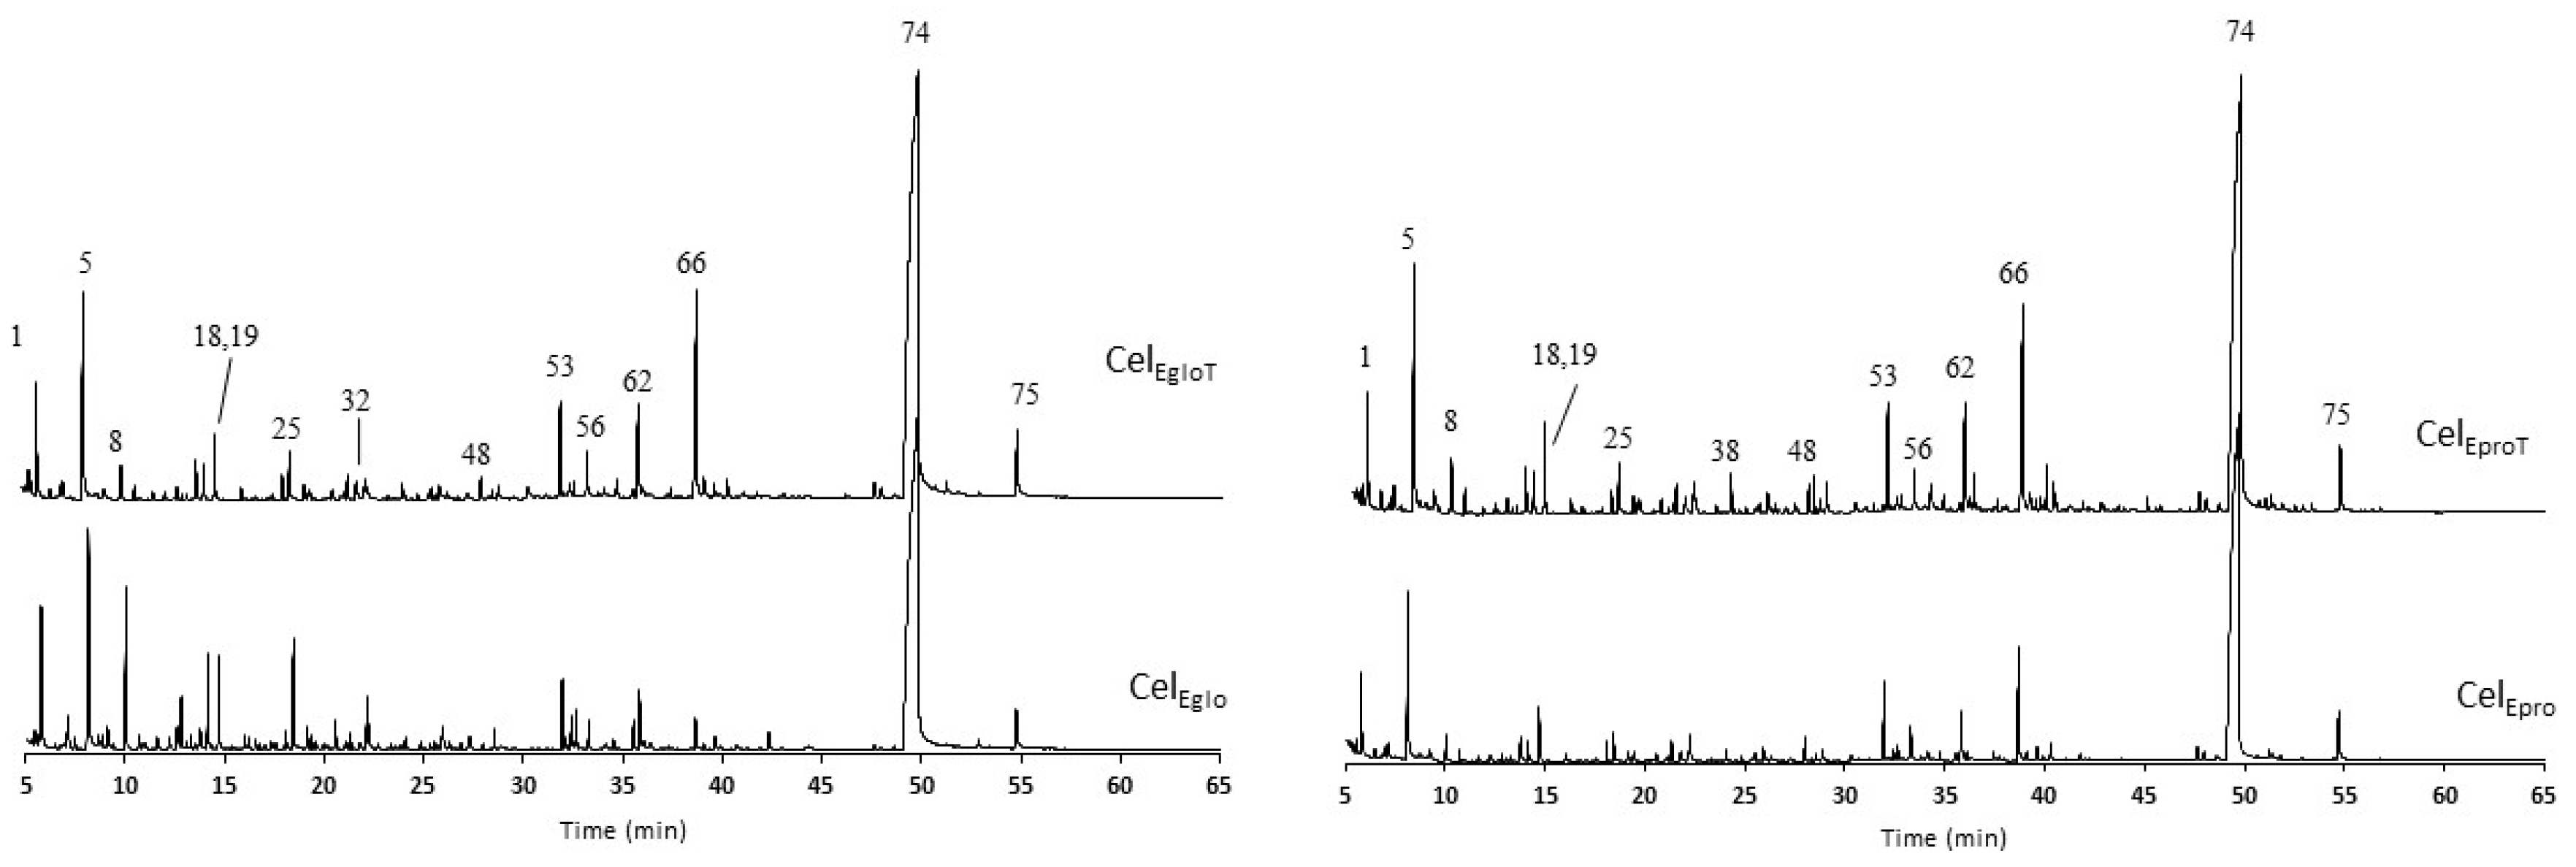
3.2.4. Pyrolysis Analysis

Py-GC/MS is a recognised powerful technique for the study of the chemical compositions of complex polymeric systems, including wood. The pyrolysis products reflect not only the structural composition of polymer composites, but also their physical structure. Regarding the major wood components, lignin and carbohydrates, they give completely different pyrolytic degradation products, the relative proportions of which allow the discrimination of a wood’s botanic origin and the assessment of its behaviour during different processing routes [52]. In particular, the main pyrolysis product of cellulose (60%–70% yield) is levoglucosan (LG), followed by low molecular compounds (LMC) and furan-derived products, contributing by 10–20% and by 5–15%, respectively [52,53,54,55]. LG is a pyran-derived product from cellulose pyrolysis and is formed by cleavage of the 1,4-glycosidic linkages, followed by intramolecular rearrangement of the monomer unit and dehydration. Under the same pyrolysis conditions, the yield of LG is related to the physical properties of cellulose and is usually higher for the amorphous than for the crystalline phase [53,54,55]. However, there is not yet a full consensus regarding the influence of the degree of polymerization and the crystallinity of cellulose upon the formation of LG [56].
The results from the Py-GC/MS of the isolated celluloses and the corresponding pyrograms are presented in Table 6 and Figure 5, respectively. The detailed list of pyrolysis products is presented in Table S1 (Supporting Materials). In general, the isolated cellulose samples from heat treated woods produced less carbohydrate derivatives: ca. 84 vs. 87% for the E. globulus and ca. 71% vs. 85% for the E. propinqua. Since the isolated cellulose samples contained minimal amounts of hemicelluloses, these features can be essentially assigned to the crystalline and amorphous phases of cellulose. Thus, the results are presented by grouping the pyrolysis products in pyran, furan, LMC and others instead of focusing on their origin. The pyrolysis of samples mainly revealed the production of pyran compounds (48–63%), followed by LMC (9–17%), and the furan compounds were less than 7% of the total chromatographic area (Table 6). The main pyran compound was levoglucosan (LG, peak 74), while hydroxyacetaldehyde (peak 5) was predominant among LMC, and the 5-hydroxymethylfurfural (5-HMF, peak 62) was the most abundant furan compound (Figure 5). The Py-GC/MS results indicated that the heat treatment of E. globulus wood decreases the molecular ordening of cellulose, because the yield of LG was reduced substantially. This confirms the previous results obtained by solid-state 13C NMR, WAXS and FTIR. At the same time, the same conclusion cannot be drawn for the E. propinqua wood, where the LG yield decreased in cellulose isolated from treated wood (Table 6). However, the amount of furan-derived pyrolysis products was increased anyway after the treatment of E. propinqua wood. The increase in furans and LMS during the pyrolysis of cellulose is clearly indicative of the greater content of amorphized cellulose [55].
The results of the Py-GC/MS analysis on the LG yield can be affected by the concomitant lignin in the isolated cellulose samples. In fact, the analysis of pyrograms showed trace amounts of lignin-derived products in the CelEglo, CelEgloT and CelEpro samples (Table 6). However, these were almost ten times more abundant in the CelEproT sample, indicating a much more relevant lignin content. This observation is consistent with a higher Klason lignin content in the E. propinqua when compared to E. globulus (29.4 vs. 21.1% in untreated and 39.0 vs. 29.1% in the treated wood, Table 1). In addition, despite the predominace in syringyl structural units (S units), the E. propinqua is richer than E. globulus in guaiacyl lignin units (G units) with an S/G ratio of 1.3 vs. 4.1 and 1.7 vs. 4.6, respectively, in untreated and treated wood [16]. Accordingly, E. propinqua wood is much more difficult to delignify, and during the cellulose isolation some lignin was irremovable and mantained in the cell matrix. This fact explains, at least partially, the much lower yield of cellulose-derived pyrolysis products from E. propinqua than from E. globulus, due to the higher chair yield in the presence of lignin (Table 6).
It can also be speculated that the residual lignin in CelEproT affected the results of the FTIR, thus contributing to the signals at 1300–1500 cm−1 used to evaluate the cellulose crystallinity.

4. Conclusions

The results of this study showed a small decrease in the crystallinity of cellulose (ca. 2–3%) in eucalyptus woods, during the mild torrefaction performed in the range of 160–230 °C (3 h), within the trend of Thermowood® technology. This was attributed to the cellulose amorphization of crystallite surfaces as a result of acid-catalyzed hydrolysis and free radical reactions from the homolytic spitting of glycosidic bonds. The parameters of the crystalline cell unit changed insignificantly under conditions of heat treatment, showing its minor distortion within the allomorph of cellulose I. The degree of the cellulose polymerization decreased more than twice during the heat treatment of wood. It has been proposed that changes in the supramolecular structure of cellulose and in molecular weight during a heat treatment can be affected by the amount of lignin present in the wood. Unlike hemicelluloses, lignin is much less depolymerized with minimal release of low molecular weight products. The increase in the content of lignin and other polyphenols protects the wood cellulose against degradation, decreasing its accessibility for hydrolysis and free radical reactions by radical scavenging. Among the analytic techniques employed, solid-state 13C NMR and WAXS are considered more sensitive than FTIR and Py-GC/MS for the unequivocal assessment of small changes in cellulose crystallinity.

Supplementary Materials

The following information is available online at https://www.mdpi.com/2073-4360/12/12/2831/s1: Figure S1 (13C CP/MAS NMR spectrum of CelEglo showing the expanded region at 80–92 and 100–110 ppm with deconvolution of signals from accessible (AC) and inaccessible (IN) cellulose and from cellulose Iα and Iβ phases) and Table S1 (Detailed list of compounds attained by Py-GC/MS analysis).

Author Contributions

Conceptualization, A.L., S.A., J.G. and D.E.; methodology, A.L. and D.E.; writing—original draft preparation, A.L.; writing—review and editing, A.L., S.A., J.G. and D.E.; resources, J.G. and D.E.; funding acquisition, J.G. and D.E. All authors have read and agreed to the published version of the manuscript.

Funding

This research was funded by Fundação para a Ciência e a Tecnologia (FCT) through funding of the Forest Research Centre (UID/AGR/00239/2019 & UIDB/00239/2020) and the CICECO-Aveiro Institute of Materials (UIDB/50011/2020 & UIDP/50011/2020) financed by national funds through the FCT/MEC and when appropriate co-financed by FEDER under the PT2020 Partnership Agreement. The NMR spectrometers are part of the National NMR Network (PTNMR) and are partially supported by Infrastructure Project Nº 022161 (co-financed by FEDER through COMPETE 2020, POCI and PORL and by the FCT through PIDDAC).

Acknowledgments

Ana Lourenço and Solange Araújo acknowledge funding from the FCT for their research contracts, DL 57/2016/CP1382/CT0007 and DL 57/2016/CP1382/CT0018, respectively. The authors thank Sandra Magina and Inês Mendes for their help during the cellulose isolation, Ana Henriques for her help in determination of DPv in cellulose samples, and Ricardo Costa that prepared the samples for the pyrolysis analysis.

Conflicts of Interest

The authors declare no conflict of interest.

References

  1. Priadi, T.; Hiziroglu, S. Characterization of heat treated wood species. Mater. Des. 2013, 49, 575–582. [Google Scholar] [CrossRef]
  2. Rowell, R.M. Chemical Modification of Wood. Forest Prod. Abstr. 1983, 6, 363–382. [Google Scholar]
  3. Ibach, RE. Biological properties of wood. In Handbook of Chemistry and Wood Composites, 2nd ed.; Rowell, R.M., Ed.; Taylor Francis: Boca Raton, FL, USA, 2013; pp. 99–126. [Google Scholar]
  4. Evans, P.D. Weathering of wood and wood composites. In Handbook of Chemistry and Wood Composites, 2nd ed.; Rowell, R.M., Ed.; Taylor Francis: Boca Raton, FL, USA, 2013; pp. 152–200. [Google Scholar]
  5. Jones, D.; Brischke, C. (Eds.) Performance of Bio-Based Building Materials; Woodhead Publishing, Elsevier Ltd.: Amsterdam, The Netherlands, 2017. [Google Scholar]
  6. Tiemann, H.D. The effect of different methods of drying on the strength of wood. Lumber World Rev. 1915, 28, 19–20. [Google Scholar]
  7. Stamm, A.J.; Hansen, L.A. Minimizing wood shrinkage and swelling effect of heating in various gasses. Ind. Eng. Chem. 1937, 29, 831–833. [Google Scholar] [CrossRef]
  8. Pelaez-Samaniego, M.R.; Yadama, V.; Lowell, E.; Espinoza-Herrera, R. A review of wood thermal pretreatments to improve wood composite properties. Wood Sci. Technol. 2013, 47, 1285–1319. [Google Scholar] [CrossRef]
  9. Esteves, B.M.; Pereira, H. Wood modification by heat treatment: A Review. Bioresources 2009, 4, 370–404. [Google Scholar] [CrossRef]
  10. Sandberg, D.; Kutnar, A. Thermal modified timber: Recent developments in Europe and North America. Wood Fiber. Sci. 2016, 48, 28–39. Available online: https://wfs.swst.org/index.php/wfs/article/view/2296 (accessed on 1 October 2020).
  11. Tjeerdsma, B.F.; Boonstra, M.; Pizzi, A.; Tekely, P.; Militz, H. Characterisation of thermally modified wood: Molecular reasons for wood performance improvement. Holz als Roh-und Werkst. 1998, 56, 149–153. [Google Scholar] [CrossRef]
  12. Ru, B.; Wang, S.; Dai, G.; Zhang, L. Effect of torrefaction on biomass physicochemical characteristics and the resulting pyrolysis behavior. Energy Fuels 2015, 29, 5865–5874. [Google Scholar] [CrossRef]
  13. Silva, C.M.S.; Carneiro, A.C.O.; Vital, B.R.; Figueiró, C.G.; Fialho, L.F.; Magalhães, M.A.; Carvalho, A.G.; Cândido, W.L. Biomass Torrefaction for Energy Purposes—Definitions and an Overview of Challenges and Opportunities in Brazil. Renew. Sustain. Energy Rev. 2018, 82, 2426–2432. [Google Scholar] [CrossRef]
  14. Manninen, A.M.; Pasanen, P.; Holopainen, J.K. Comparing the VOC emissions between air-dried and heat-treated Scots pine wood. Atmos. Environ. 2002, 36, 1763–1768. [Google Scholar] [CrossRef]
  15. Kim, J.Y.; Hwang, H.; Oh, S.; Kim, Y.S.; Kim, U.J.; Choi, J.W. Investigation of structural modification and thermal characteristics of lignin after heat treatment. Int. J. Biol. Macromol. 2014, 66, 57–65. [Google Scholar] [CrossRef]
  16. Lourenço, A.; Araújo, S.; Gominho, J.; Pereira, H.; Evtuguin, D. Structural changes in lignin of thermally treated eucalyptus wood. J. Wood Chem. Technol. 2020, 40, 258–268. [Google Scholar] [CrossRef]
  17. Hon, D.N.C. Cellulose: A random walk along its historical path. Cellulose 1994, 1, 1–25. [Google Scholar] [CrossRef]
  18. Bhuiyan, M.T.R.; Hirai, N.; Sobue, N. Changes of crystallinity in wood cellulose by heat treatment under drier and moist conditions. J. Wood Sci. 2000, 46, 431–436. [Google Scholar] [CrossRef]
  19. Bhuiyan, R.; Hirai, T.; Sobue, N.N. Effect of intermittent heat treatment on crystallinity in wood cellulose. J. Wood Sci. 2001, 47, 336–341. [Google Scholar] [CrossRef]
  20. Tarmian, A.; Mastouri, A. Changes in moisture exclusion efficiency and crystallinity of thermally modified wood with aging. iForest-Biogeosciences For. 2019, 12, 92–97. [Google Scholar] [CrossRef] [Green Version]
  21. Kubovský, I.; Kačíková, D.; Kačík, F. Structural changes of oak wood main components caused by thermal modification. Polymers 2020, 12, 485. [Google Scholar] [CrossRef] [Green Version]
  22. Melkior, T.; Jacob, S.; Gerbaud, G.; Hediger, S.; Le Pape, L.; Bonnefois, L.; Bardet, M. NMR analysis of the transformation of wood constituents by torrefaction. Fuel 2012, 92, 271–280. [Google Scholar] [CrossRef]
  23. Hill, S.J.; Grigsby, W.J.; Hall, P.W. Chemical and cellulose crystallite changes in Pinus radiata during torrefaction. Biomass Bioenergy 2013, 56, 92–98. [Google Scholar] [CrossRef]
  24. Wikberg, H.; Maunu, S.L. Characterization of thermally modified hard and softwoods by 13C CPMAS NMR. Carbohydr. Polym. 2004, 58, 461–466. [Google Scholar] [CrossRef]
  25. Yildiz, S.; Gümüskaya, E. The effects of thermal modification on crystalline structure of cellulose in soft and hardwood. Build. Environ. 2007, 42, 62–67. [Google Scholar] [CrossRef]
  26. Wentzel, M.; Fleckenstein, M.; Hofmann, T.; Militz, H. Relation of chemical and mechanical properties of Eucalyptus nitens wood thermally modified in open and closed systems. Wood Mater. Sci. Eng. 2019, 14, 165–173. [Google Scholar] [CrossRef]
  27. Baccile, N.; Falco, C.; Titirici, M.M. Characterization of biomass and its derived char using 13C solid state nuclear magnetic resonance. Green Chem. 2014, 16, 4839–4869. [Google Scholar] [CrossRef] [Green Version]
  28. Araújo, S.O.; Neiva, D.M.; Gominho, J.; Esteves, B.; Pereira, H. Chemical effects of a mild torrefaction on the wood of eight Eucalyptus species. Holzforschung 2017, 71, 291–298. [Google Scholar] [CrossRef]
  29. Browning, B.L. Methods in Wood Chemistry; John Wiley& Sons: New York, NY, USA, 1967; Volume II, pp. 406–727. [Google Scholar]
  30. Evtuguin, D.V.; Tomás, J.L.; Silva, A.M.S.; Neto, C. Characterization of acetylated heteroxylan from Eucalyptus globulus Labill. Carbohydr. Res. 2003, 338, 597–607. [Google Scholar] [CrossRef]
  31. Tribulová, T.; Kačík, F.; Evtuguin, D.V.; Čabalová, I.; Ďurkovičd, J. The effects of transition metal sulfates on cellulose crystallinity during accelerated ageing of silver fir wood. Cellulose 2019, 26, 2625–2638. [Google Scholar] [CrossRef]
  32. Ioelovitch, M.Y.; Tupureine, A.D.; Veveris, G.P. Study on the cellulose crystallinity in plant materials. Khimiya Drev. 1989, 5, 3–9. [Google Scholar]
  33. Tripp, V.W. Measurement of crystallinity. In Cellulose and Cellulose Derivatives; Bikales, N.M., Segal, L., Eds.; Part IV; Wiley-Interscience: New York, NY, USA, 1971; pp. 305–323. [Google Scholar]
  34. Auxenfans, T.; Crônie, D.; Chabbert, B.; Paёs, G. Understanding the structural and chemical changes of plant biomass following steam explosion pretreatment. Biotechnol. Biofuels 2017, 10, 36. [Google Scholar] [CrossRef] [Green Version]
  35. Liitiä, T.; Maunu, S.; Hortling, B. Solid-state NMR studies on cellulose crystallinity in fines and bulk fibres separated from refined kraft pulp. Holzforschung 2000, 54, 618–624. [Google Scholar] [CrossRef]
  36. Wickholm, K.; Larsson, PT.; Iversen, T. Assignment of non-crystalline forms in cellulose I by CP/MAS 13C NMR spectroscopy. Carbohydr. Res. 1998, 312, 123–129. [Google Scholar] [CrossRef]
  37. Ralph, J.; Hatfield, R.D. Pyrolysis-GC-MS characterization of forage materials. J. Agric. Food Chem. 1991, 39, 1426–1437. [Google Scholar] [CrossRef]
  38. Faix, O.; Fortman, I.; Bremer, J.; Meier, D. Thermal degradation products of wood. A collection of electron-impact (EI) mass spectra of polysaccharide derived products. Holz als Roh-und Werkst. 1991, 49, 299–304. [Google Scholar] [CrossRef]
  39. Evans, R.; Wallis, A.F.A. Cellulose molecular weights determined by viscometry. J. Appl. Polym. Sci. 1989, 37, 2331–2340. [Google Scholar] [CrossRef]
  40. Mafu, L.D.; Neomagus, H.W.J.P.; Everson, R.C.; Carrier, M.; Strydom, C.A.; Bunt, J.R. Structural and chemical modifications of typical South African biomasses during torrefaction. Biores. Technol. 2016, 202, 192–197. [Google Scholar] [CrossRef]
  41. Shoulaifar, T.K.; DeMartini, N.; Willför, S.; Pranovich, A.; Smeds, A.I.; Virtanen, T.A.P.; Maunu, S.-L.; Verhoeff, F.; Kiel, J.H.A.; Hupa, M. Impact of torrefaction on the chemical structure of birch wood. Energy Fuels 2014, 28, 3863–3872. [Google Scholar] [CrossRef]
  42. Zhu, C.; Krumm, C.; Facas, G.G.; Neurock, M.; Dauenhauer, P.J. Energetics of cellulose and cyclodextrin glycosidic bond cleavage. React. Chem. Eng. 2017, 2, 201–214. [Google Scholar] [CrossRef]
  43. Kim, S.; Chmely, S.C.; Nimlos, M.R.; Bomble, Y.J.; Foust, T.D.; Paton, R.S.; Beckham, G.T. Computational study of bond dissociation enthalpies for a large range of native and modified lignins. J. Phys. Chem. Lett. 2011, 2, 2846–2852. [Google Scholar] [CrossRef]
  44. Alonso, E.R.; Capucine Dupont, C.; Heux, L.; Da Silva Perez, D.; Commandre, J.-M.; Gourdon, C. Study of solid chemical evolution in torrefaction of different biomasses through solid-state 13C cross-polarization/magic angle spinning NMR (nuclear magnetic resonance) and TGA (thermogravimetric analysis). Energy 2016, 97, 381–390. [Google Scholar] [CrossRef]
  45. Cheng, X.Y.; Li, X.J.; Xu, K.; Huang, Q.T.; Sun, H.N.; Wu, Y.Q. Effect of thermal treatment on functional groups and degree of cellulose crystallinity of eucalyptus wood (Eucalyptus grandis x Eucalyptus urophylla). For. Prod. J. 2017, 67, 135–140. [Google Scholar] [CrossRef]
  46. Hult, E.L.; Larsson, P.T.; Iversen, T. Cellulose fibril aggregation—An inherent property of kraft pulps. Polymer 2001, 42, 3309–3314. [Google Scholar] [CrossRef]
  47. Newman, R.H. Carbon-13 NMR evidence for cocrystallization of cellulose as a mechanism for hornification of bleached kraft pulp. Cellulose 2004, 11, 45–52. [Google Scholar] [CrossRef]
  48. Atalla, R.H.; VanderHart, D.L. The role of solid state 13C NMR spectroscopy in studies of the nature of native celluloses. Solid State Nucl. Magn. Reson. 1999, 15, 1–19. [Google Scholar] [CrossRef]
  49. Pérez, S.; Samain, D. Structure and Engineering of Celluloses. Adv. Carbohydr. Chem. Biochem. 2010, 64, 25–116. [Google Scholar] [CrossRef]
  50. Wada, M.; Okano, T. Localization of Iα and Iβ phases in algal cellulose revealed by acid treatments. Cellulose 2001, 8, 183–188. [Google Scholar] [CrossRef]
  51. Polettoa, M.; Pistorc, V.; Santana, R.M.C.; Zattera, A.J. Materials Produced From Plant Biomass. Part II: Evaluation of Crystallinity and Degradation Kinetics of Cellulose. Mater. Res. 2012, 15, 421–427. [Google Scholar] [CrossRef] [Green Version]
  52. Lourenço, A.; Gominho, J.; Pereira, H. Chemical characterization of lignocellulosic materials by analytical pyrolysis. In Analytical Pyrolysis; Chapter 2; Kusch, P., Ed.; InTechOpen: London, UK, 2019; pp. 9–30. ISBN 978-1-78984-958-5. Available online: https://www.intechopen.com/books/analytical-pyrolysis/chemical-characterization-of-lignocellulosic-materials-by-analytical-pyrolysis (accessed on 1 October 2020). [CrossRef] [Green Version]
  53. Li, S.; Lyons-Hart, J.; Banyasz, J.; Shafer, K. Real-time evolved gas analysis by FTIR method: An experimental study of cellulose pyrolysis. Fuel 2001, 80, 1809–1817. [Google Scholar] [CrossRef]
  54. Wang, S.; Guo, X.; Liang, T.; Zhou, Y.; Luo, Z. Mechanism research on cellulose pyrolysis by Py-GC/MS and subsequent density functional theory studies. Bioresour. Technol. 2012, 104, 722–728. [Google Scholar] [CrossRef]
  55. Cuba-Torres, C.M.; Had, S.; Pecha, B.; Garcia-Perez, M. Effect of cellulose crystallinity on the formation of a liquid intermediate and on product distribution during pyrolysis. J. Anal. Appl. Pyrolysis 2013, 100, 56–66. [Google Scholar] [CrossRef]
  56. Junior, I.I.; Nascimento, M.A.; Souza, R.O.M.A.; Dufour, A.; Wojcieszak, R. Levoglucosan: A promising platform molecule? Green Chem. 2020, 22, 5859. [Google Scholar] [CrossRef]
Figure 1. 13C CP/MAS NMR spectra of the Eucalyptus woods before and after thermal treatment: E. globulus (Eglo/EgloT), E. propinqua (Epro/EproT), E. grandis (Egra/EgraT), E. viminalis (Evim/EvimT), E. saligna (Esal/EsalT), E. rudis (Erud/ErudT), E. maculata (Emac/EmacT), E. botryoides (Ebo/EboT).
Polymers 12 02831 g001
Figure 2. 13C CP/MAS NMR spectra of cellulose samples isolated from Eucalyptus woods before (CelEglo and CelEpro) and after (CelEgloT and CelEproT) thermal treatment.
Polymers 12 02831 g002
Figure 3. X-ray scattering diffractograms of cellulose isolated from two eucalypt species before (CelEglo and CelEpro) and after (CelEgloT and CelEproT) the heat treatment. The schematic representation shows the crystalline unit cell and the main lattice plans.
Polymers 12 02831 g003
Figure 4. FTIR spectra of the isolated celluloses depicted in the region 3800–2800 cm−1 (a) and in the region 1800–600 cm−1 (b). The samples designations are the same as in Table 2 and Table 3.
Polymers 12 02831 g004
Figure 5. Pyrograms of the celluloses from E. globulus and E. propinqua before (CelEglo, CelEpro) and after the thermal treatment (CelEgloT, CelEproT). Peak identification: 1—2-oxo-propanal; 5—hydroxyacetaldehyde; 8—acetol; 18—furfural; 19—2-cyclopenten-1-one; 25—2-hydroxy-2-cyclopenten-1-one; 32—2H-pyran-2-one; 38—guaiacol; 48—levoglucosenone; 53—NI sugar; 56—1,4:3,6-dianhydro-α-D-glucopyranose; 62—5-hydroxymethylfurfural; 66—2-hydroxymethyl-5-hydroxy-2,3-dihydro-(4H)-pyran-4-one; 74—1,6-anhydro-β-D-glucopyranose (levoglucosan); 75—1,6-anhydro-α-D-galactofuranose. More peak assignment is provided in the supplementary information.
Polymers 12 02831 g005
Table 1. Chemical composition (%, oven dry material) of eucalypt woods before (NT) and after (T) the thermal treatment *.
Species Weight Loss
(%)
Total Lignin
(%)
Holocellulose
(%)
Glucose
(%)
Xylose
(%)
Acetyl Groups
(%)
E. globulusNT-23.966.268.120.67.1
T9.730.055.682.211.84.1
E. propinquaNT-31.563.669.219.67.0
T12.739.851.182.710.64.2
E. botryoidesNT-29.967.570.219.17.0
T10.237.651.185.18.84.0
E. viminalisNT-28.461.459.227.09.4
T12.534.951.981.011.24.5
E. grandisNT-26.060.469.119.57.5
T9.734.854.085.18.84.0
E. rudisNT-27.657.664.922.58.5
T11.438.151.585.48.83.7
E. maculataNT-22.565.661.726.48.0
T9.636.152.582.010.54.6
E. salignaNT-28.363.570.618.37.2
T12.436.852.884.89.14.2
* The glucose, xylose and acetyl groups content were reported as percentage of total sugars.
Table 2. Analysis of the woods before (NT) and after the treatment (T) by solid-state carbon nuclear magnetic resonance (13C NMR).
Species CrI *ICO2 **
E. globulusNT0.370.08
T0.440.09
E. propinquaNT0.380.12
T0.430.12
E. botryoidesNT0.380.10
T0.440.09
E. viminalisNT0.390.16
T0.440.06
E. grandisNT0.380.11
T0.430.04
E. rudisNT0.350.14
T0.430.13
E. maculataNT0.360.16
T0.460.11
E. salignaNT0.420.14
T0.450.14
* CrI—index of cellulose crystallinity. ** calculated as the integral ratio at 165–178 and 100–108 ppm.
Table 3. Crystallinity of the isolated cellulose from Eucalyptus woods assessed by solid-state 13C NMR, degree of polymerization (DPv) determined by viscosimetry.
CelEgloCelEgloTCelEproCelEproT
A (±0.3 nm)12.59.911.59.6
CrI (±1%)58525753
DPv (±20)13005301330590
Table 4. Crystallinity, lateral dimension of crystallites and the crystallite cell parameters of cellulose assessed by wide angle X-ray scattering (WAXS).
CelEgloCelEgloTCelEproCelEproT
DC (±0.5%)71.368.871.669.8
D200 (±0.1 nm)5.44.65.54.9
a (±0.002 nm)0.7970.7880.7980.795
b (±0.002 nm)0.8250.8350.8280.832
γ (±0.1 deg.)97.096.197.296.5
Table 5. Values of the indexes calculated from FTIR spectra.
CelEgloCelEgloTCelEproCelEproT
CrP (T1372/T2892 × 100%)97.997.296.097.2
TCI (A1375/A2900)1.101.101.131.12
LOI (A1429/A897)1.251.271.291.27
HBI (A3336/A1335)1.771.821.951.76
CrP—Crystallinity parameter (%); TCI—total crystallinity index; LOI—lateral order index; HBI—hydrogen bond intensity.
Table 6. Pyrolysis results of the isolated celluloses from E. globulus, E. propinqua before and after thermal treatment (% of total chromatographic area).
CelEgloCelEgloTCelEproCelEproT
Total carbohydrates (% of total area)87.184.284.571.1
Furan6.75.15.26.0
Pyran53.663.360.847.6
Low molecular compounds (LMC)16.68.39.49.4
Others10.27.59.18.0
Total lignin (% of total area)0.10.10.53.3
% of identified compounds87.284.385.074.3
Publisher’s Note: MDPI stays neutral with regard to jurisdictional claims in published maps and institutional affiliations.

