Geopolymer/CeO2 as Solid Electrolyte for IT-SOFC

 ,
,  ,
,  ,
,  ,
,  and
and
Abstract
1. Introduction
2. Materials and Methods
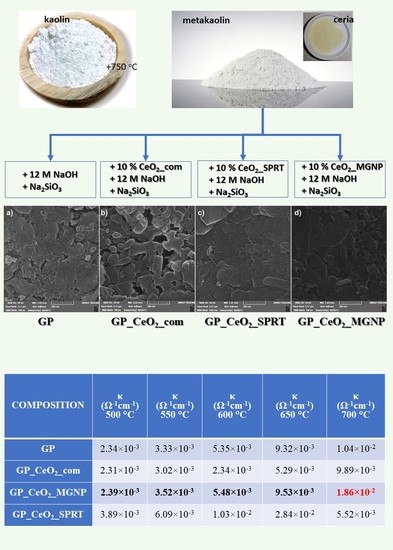
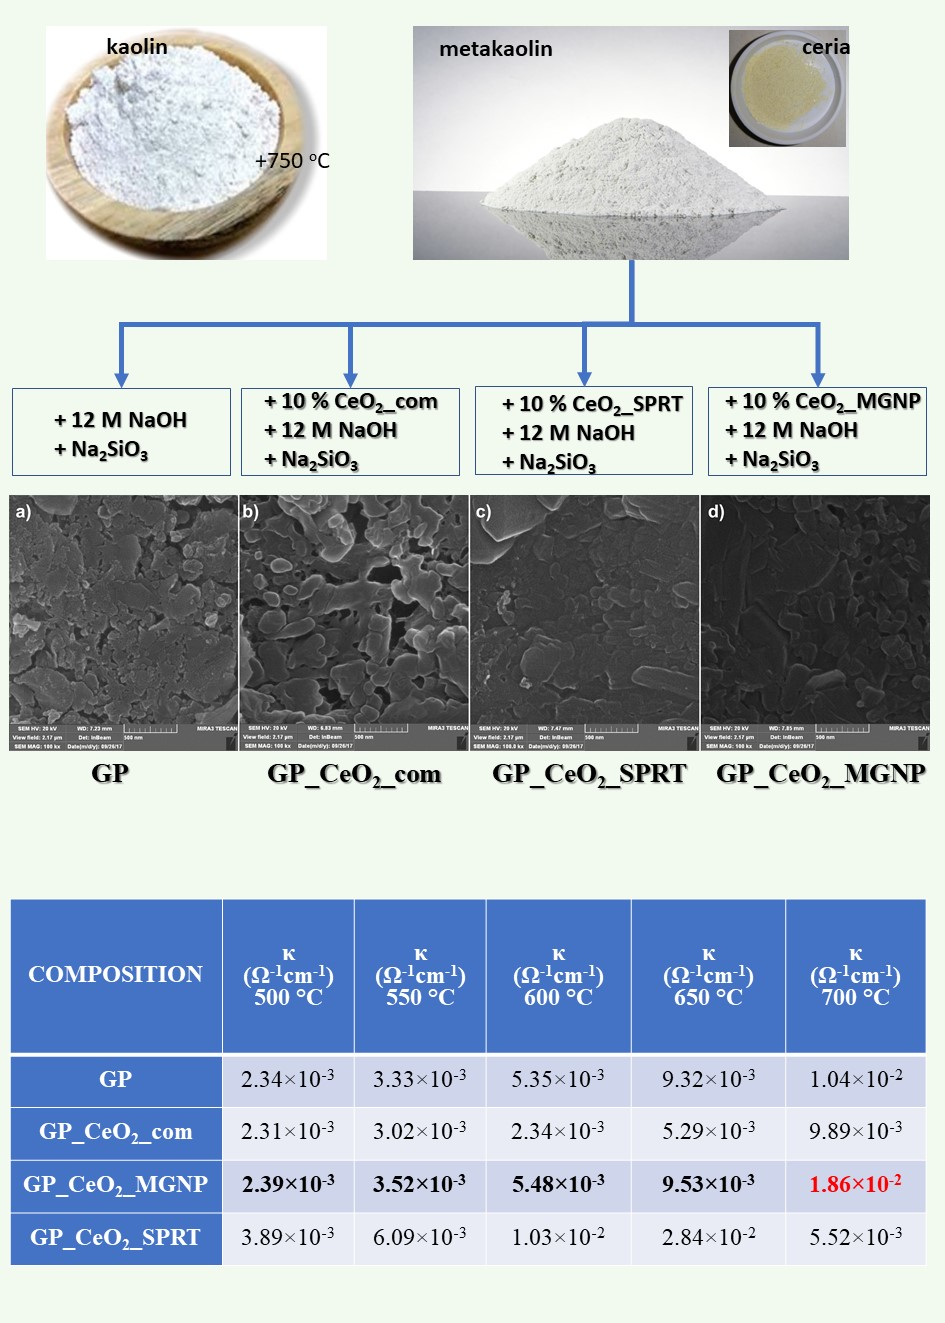
2.1. Samples Preparations
2.2. Methods
3. Results and Discussion
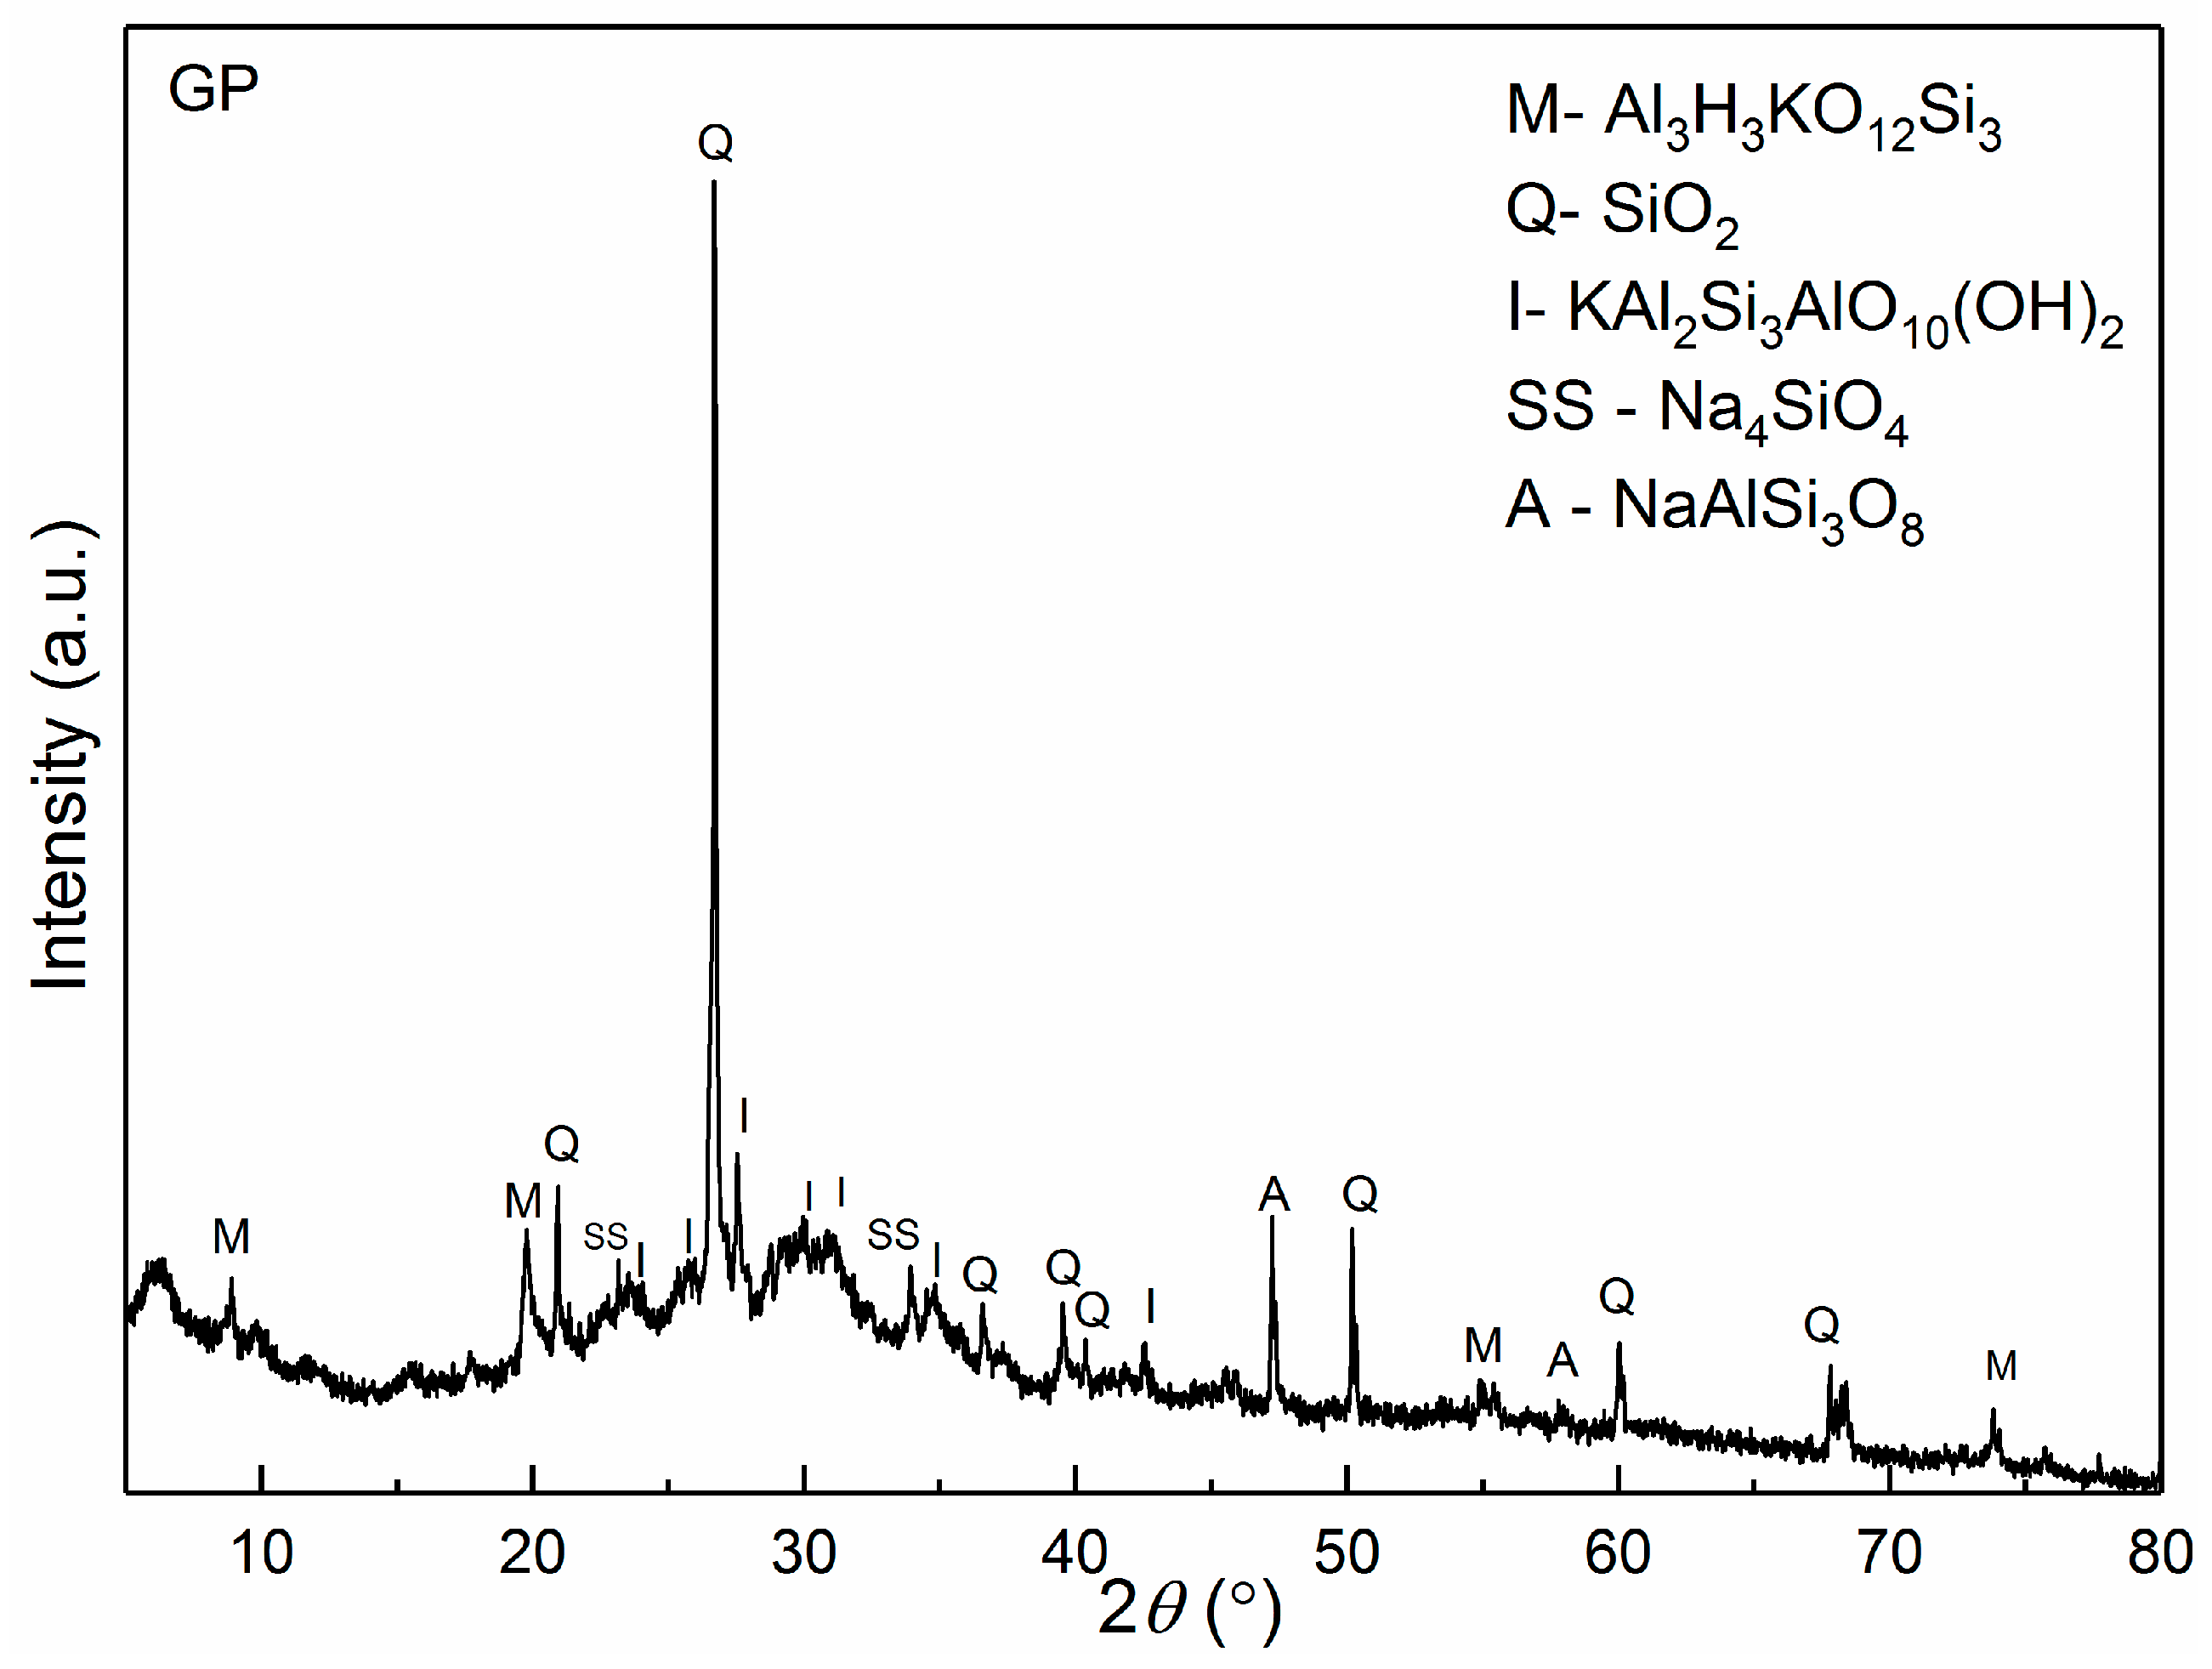
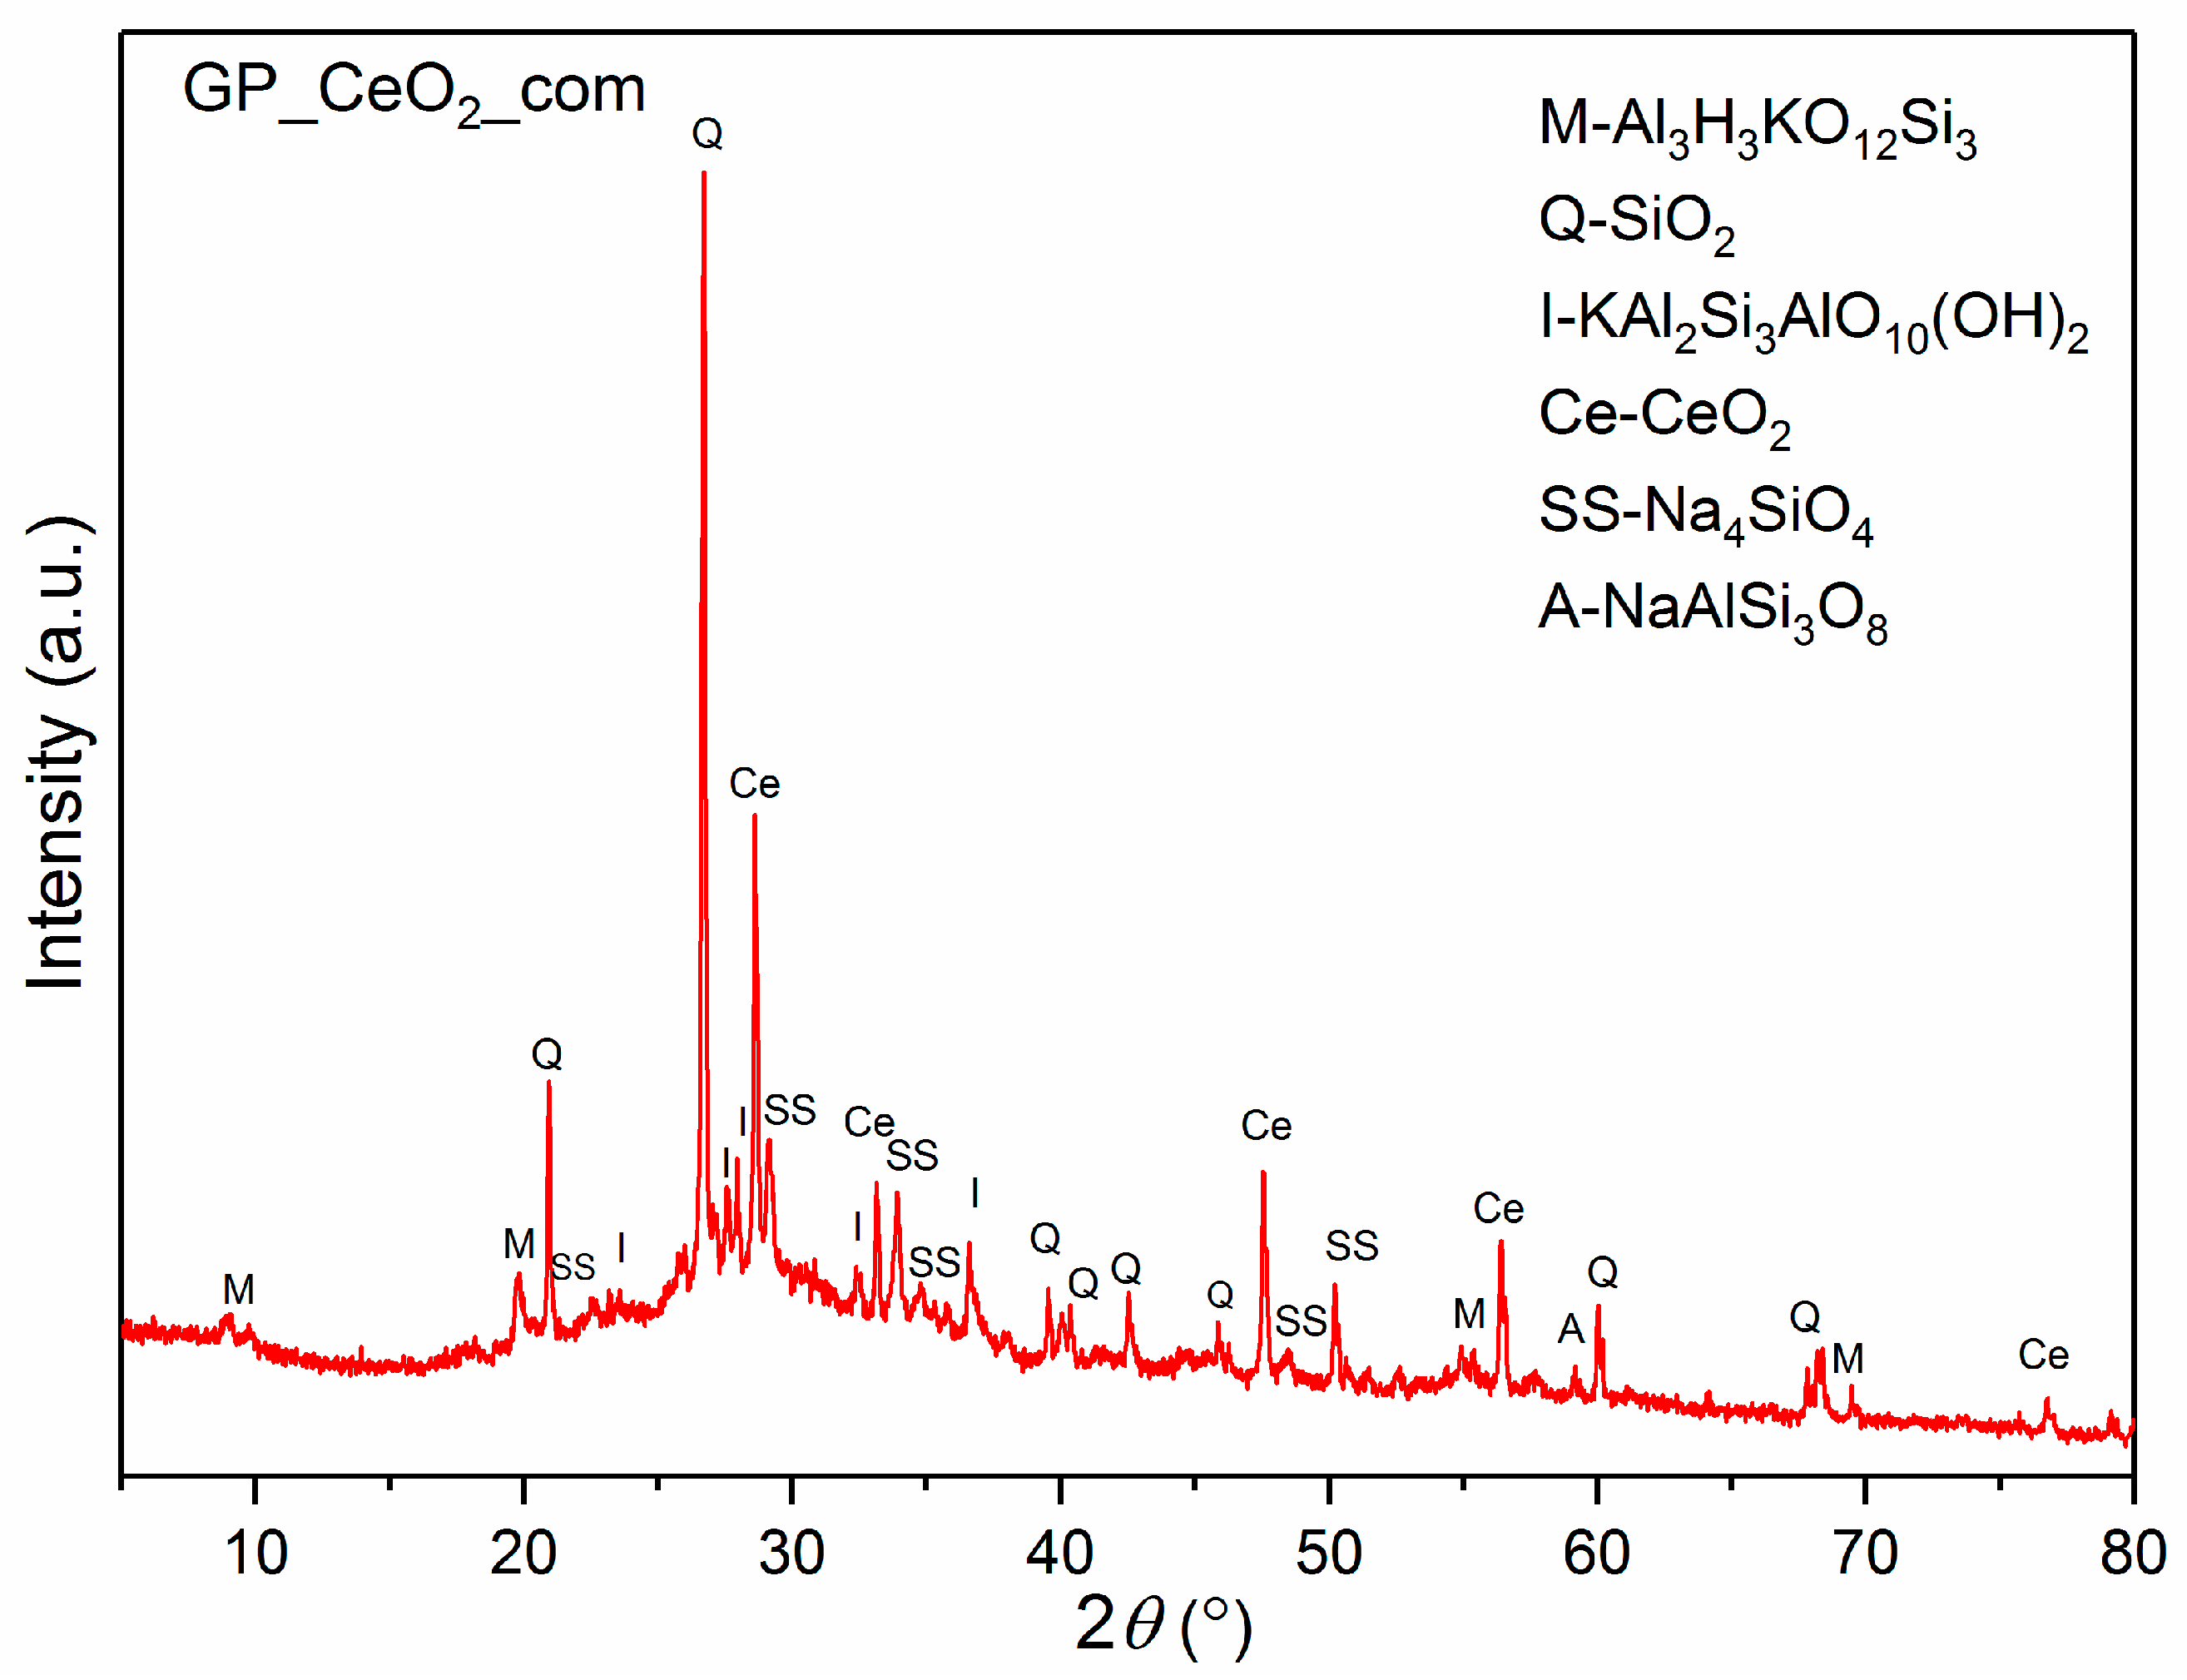
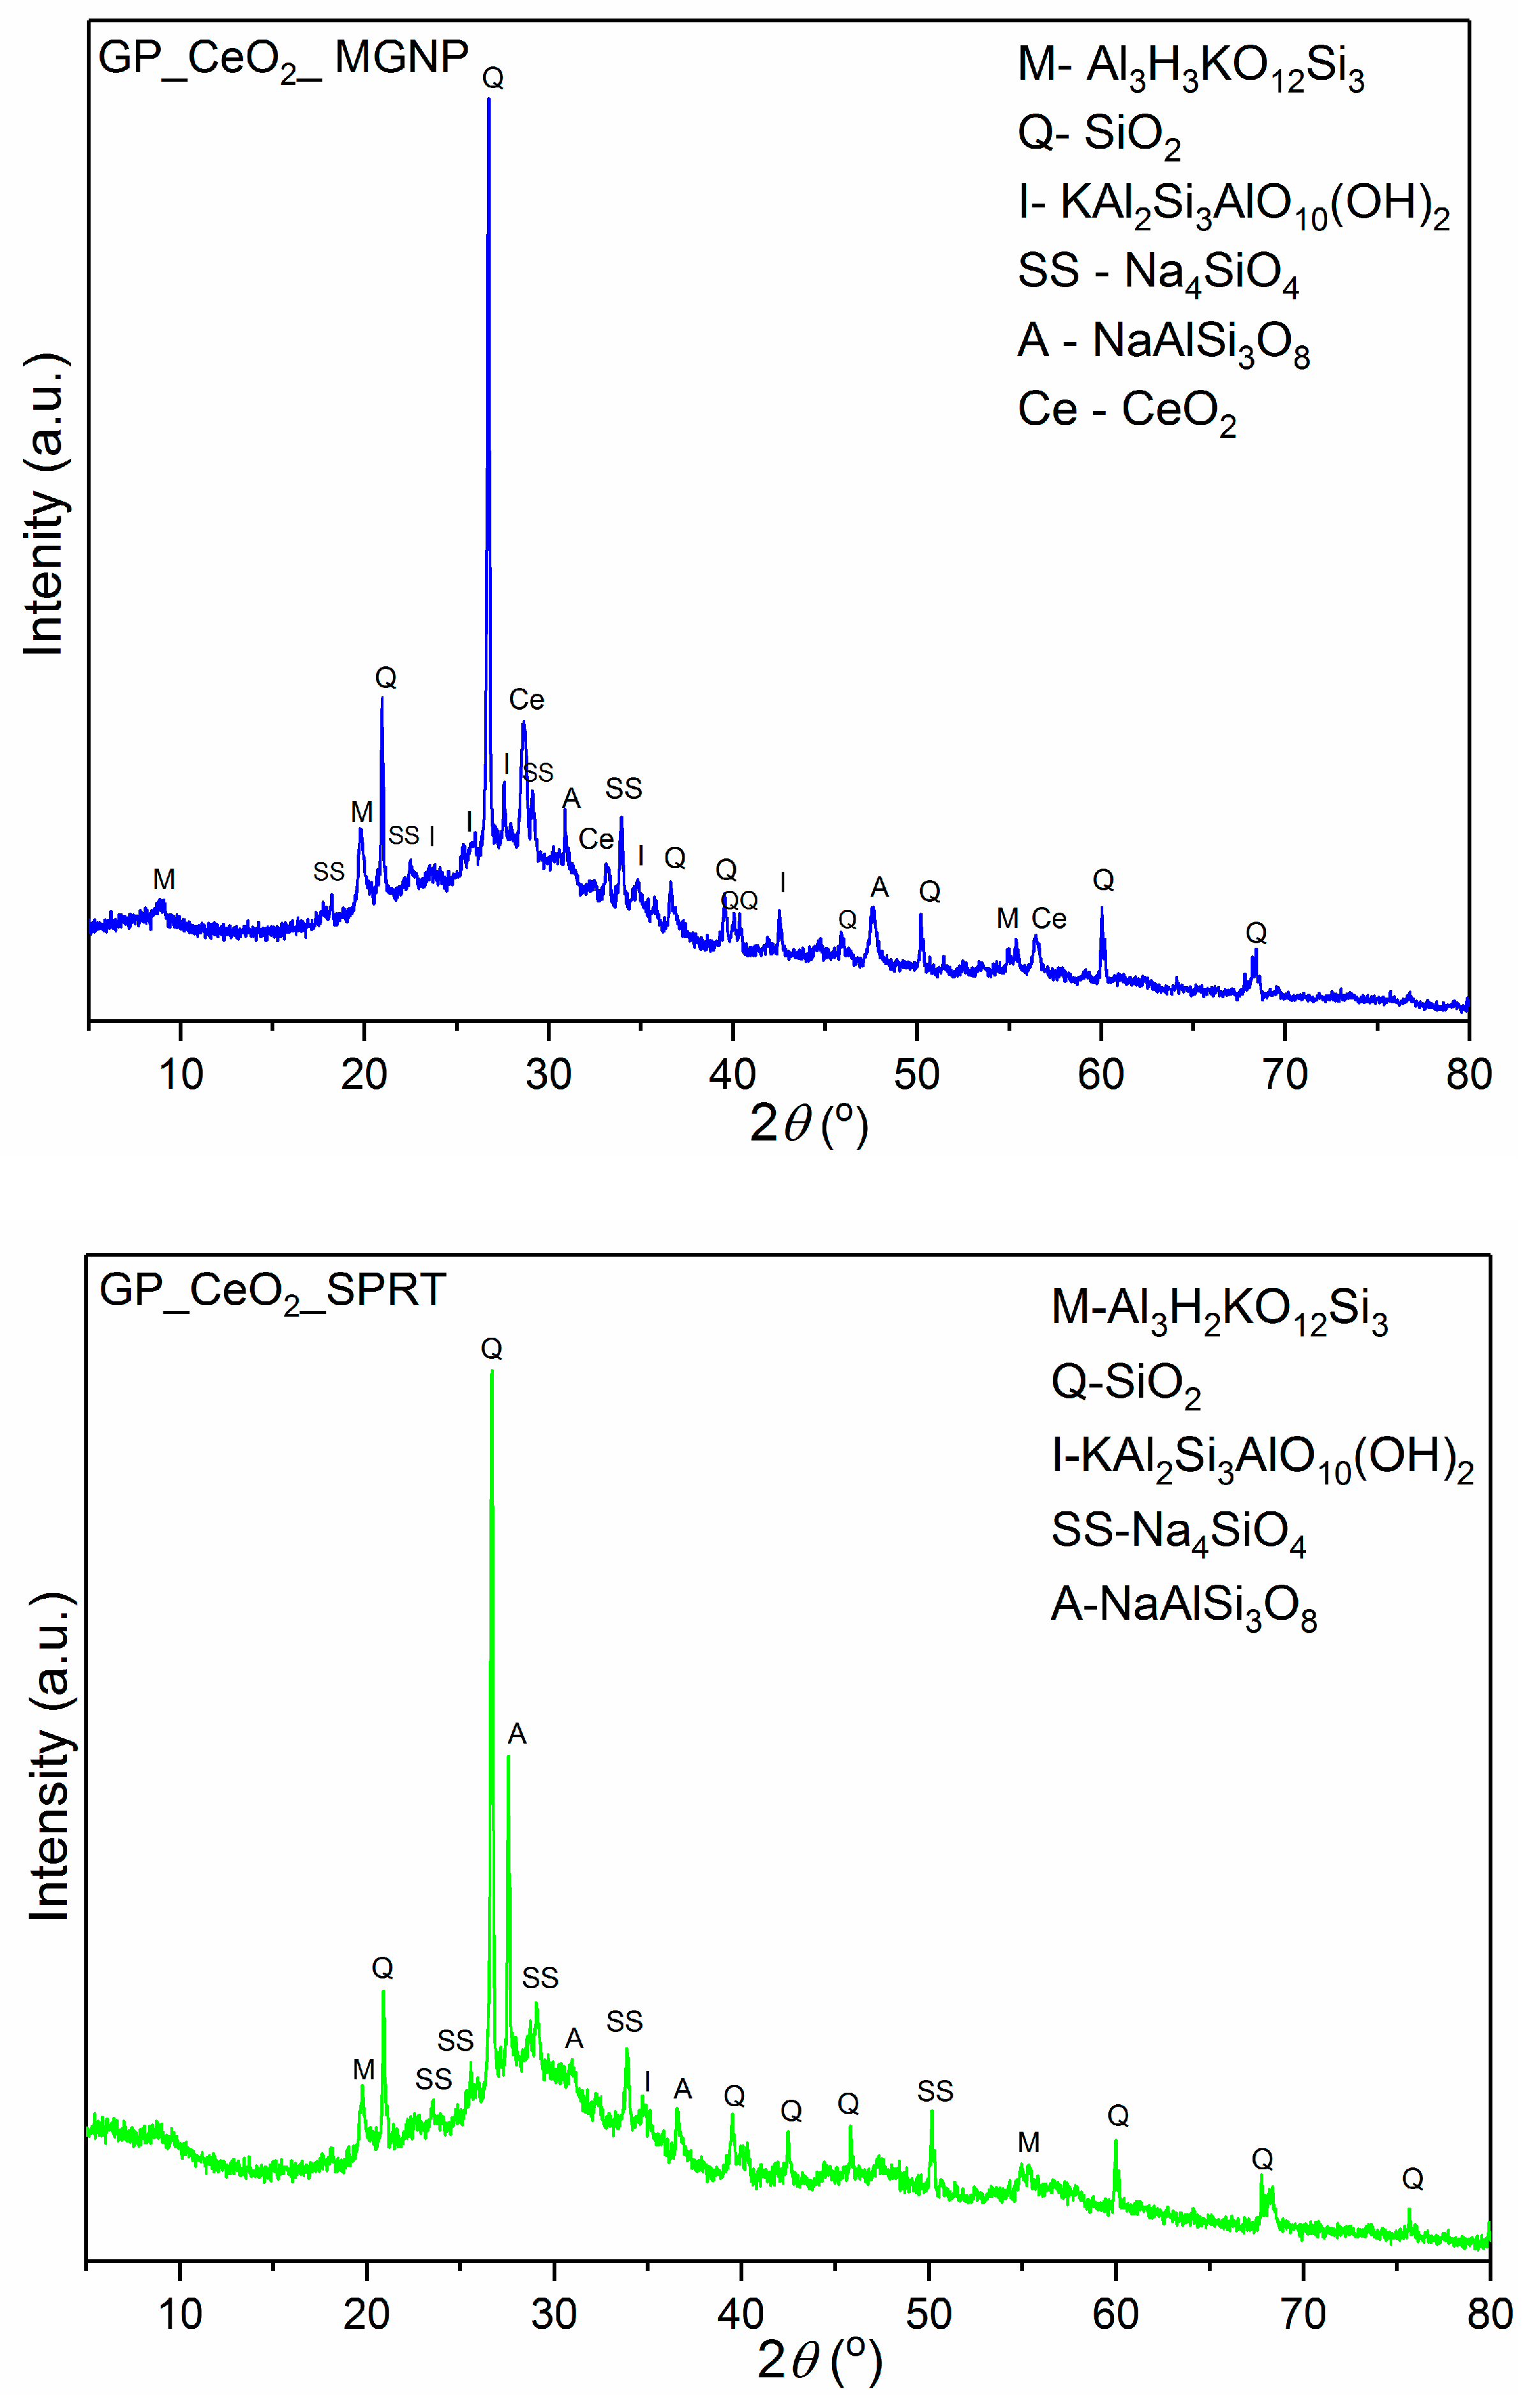
3.1. XRPD Analysis
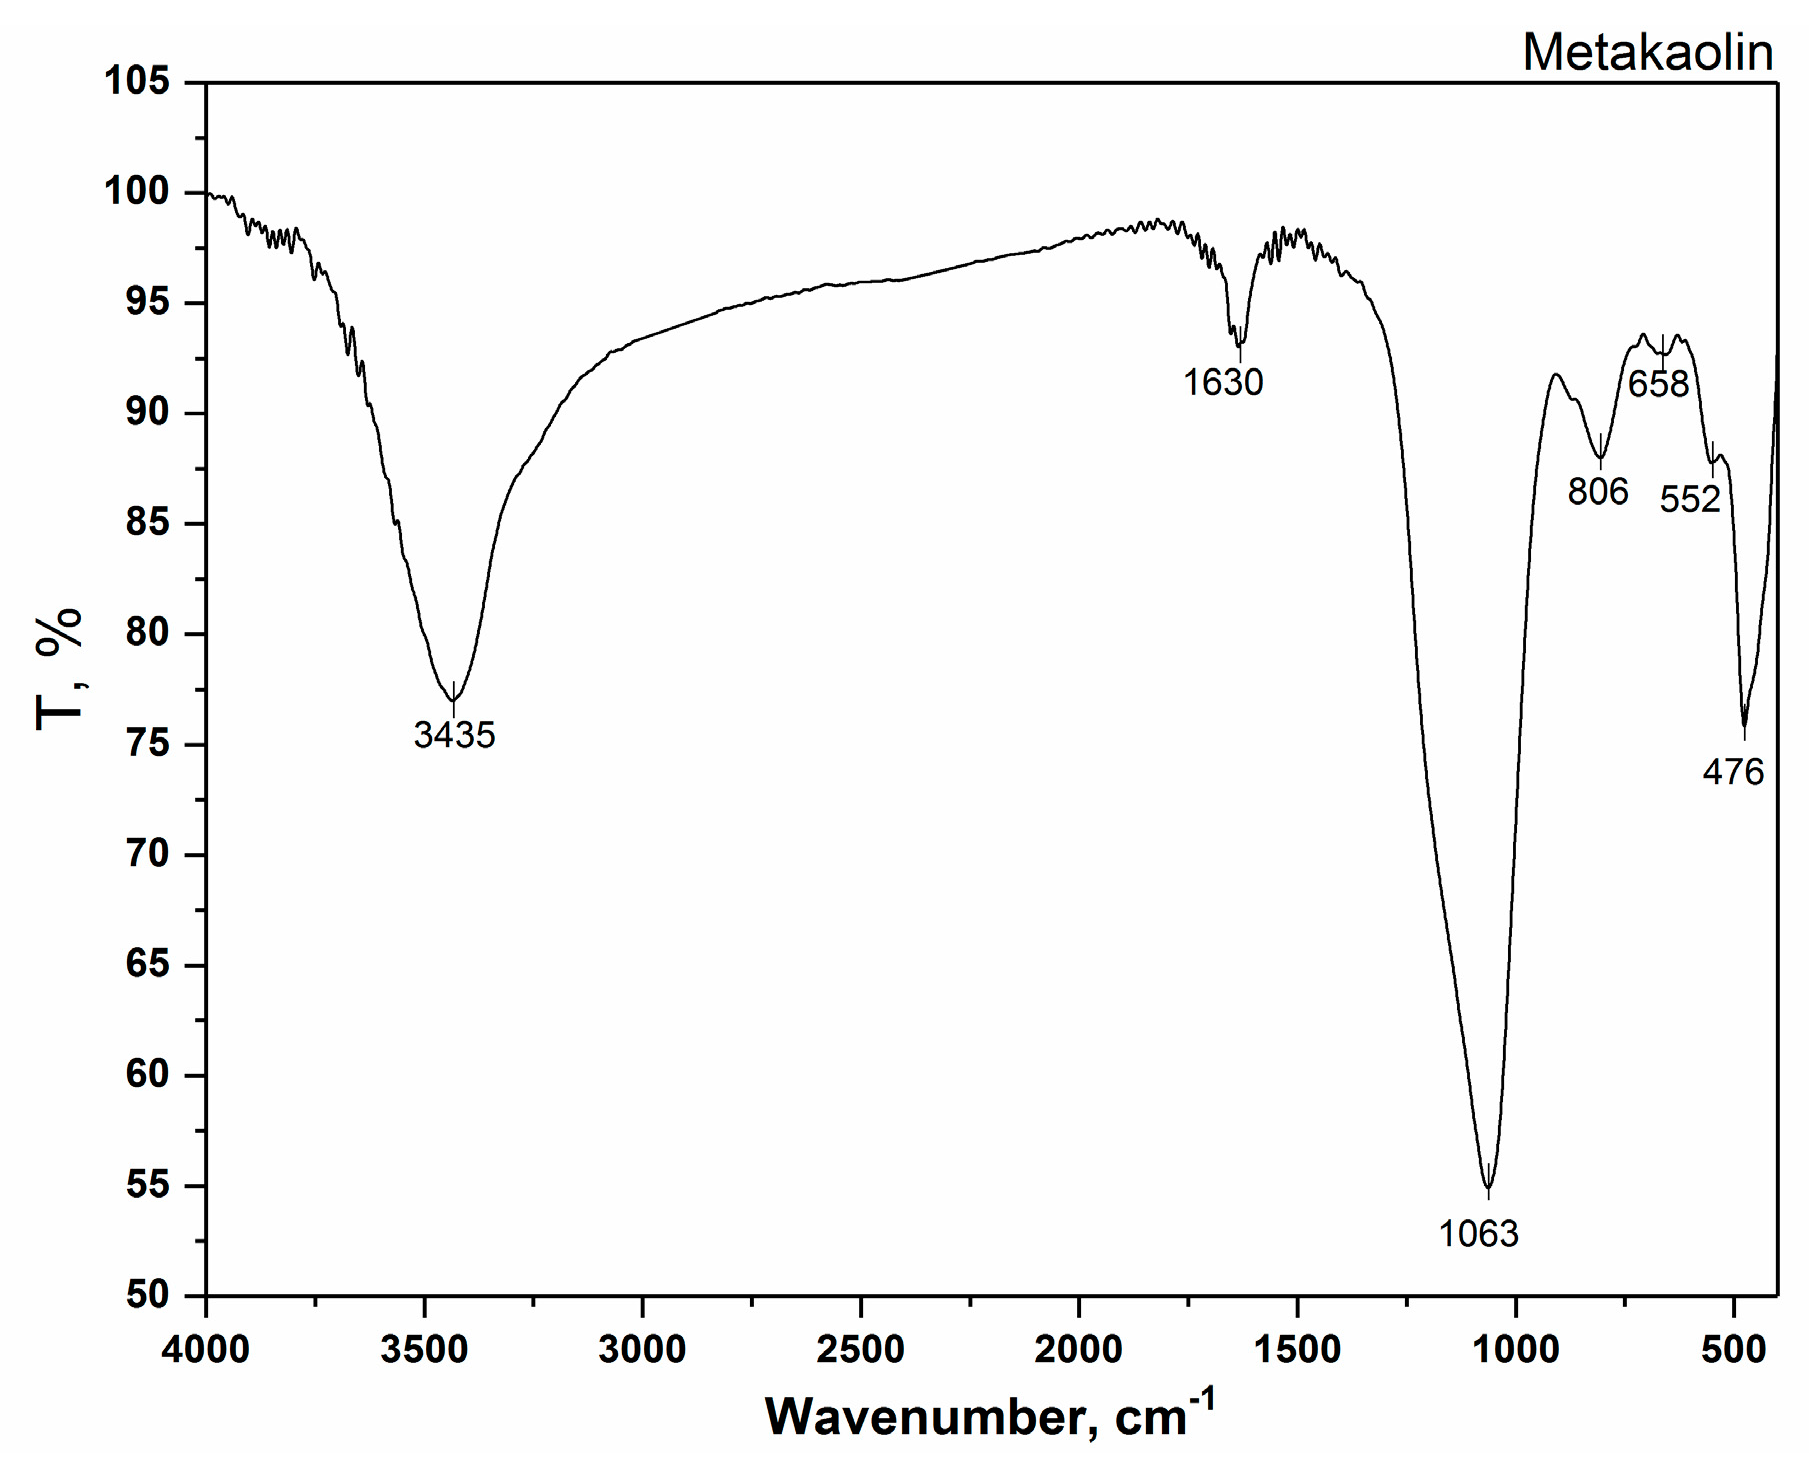
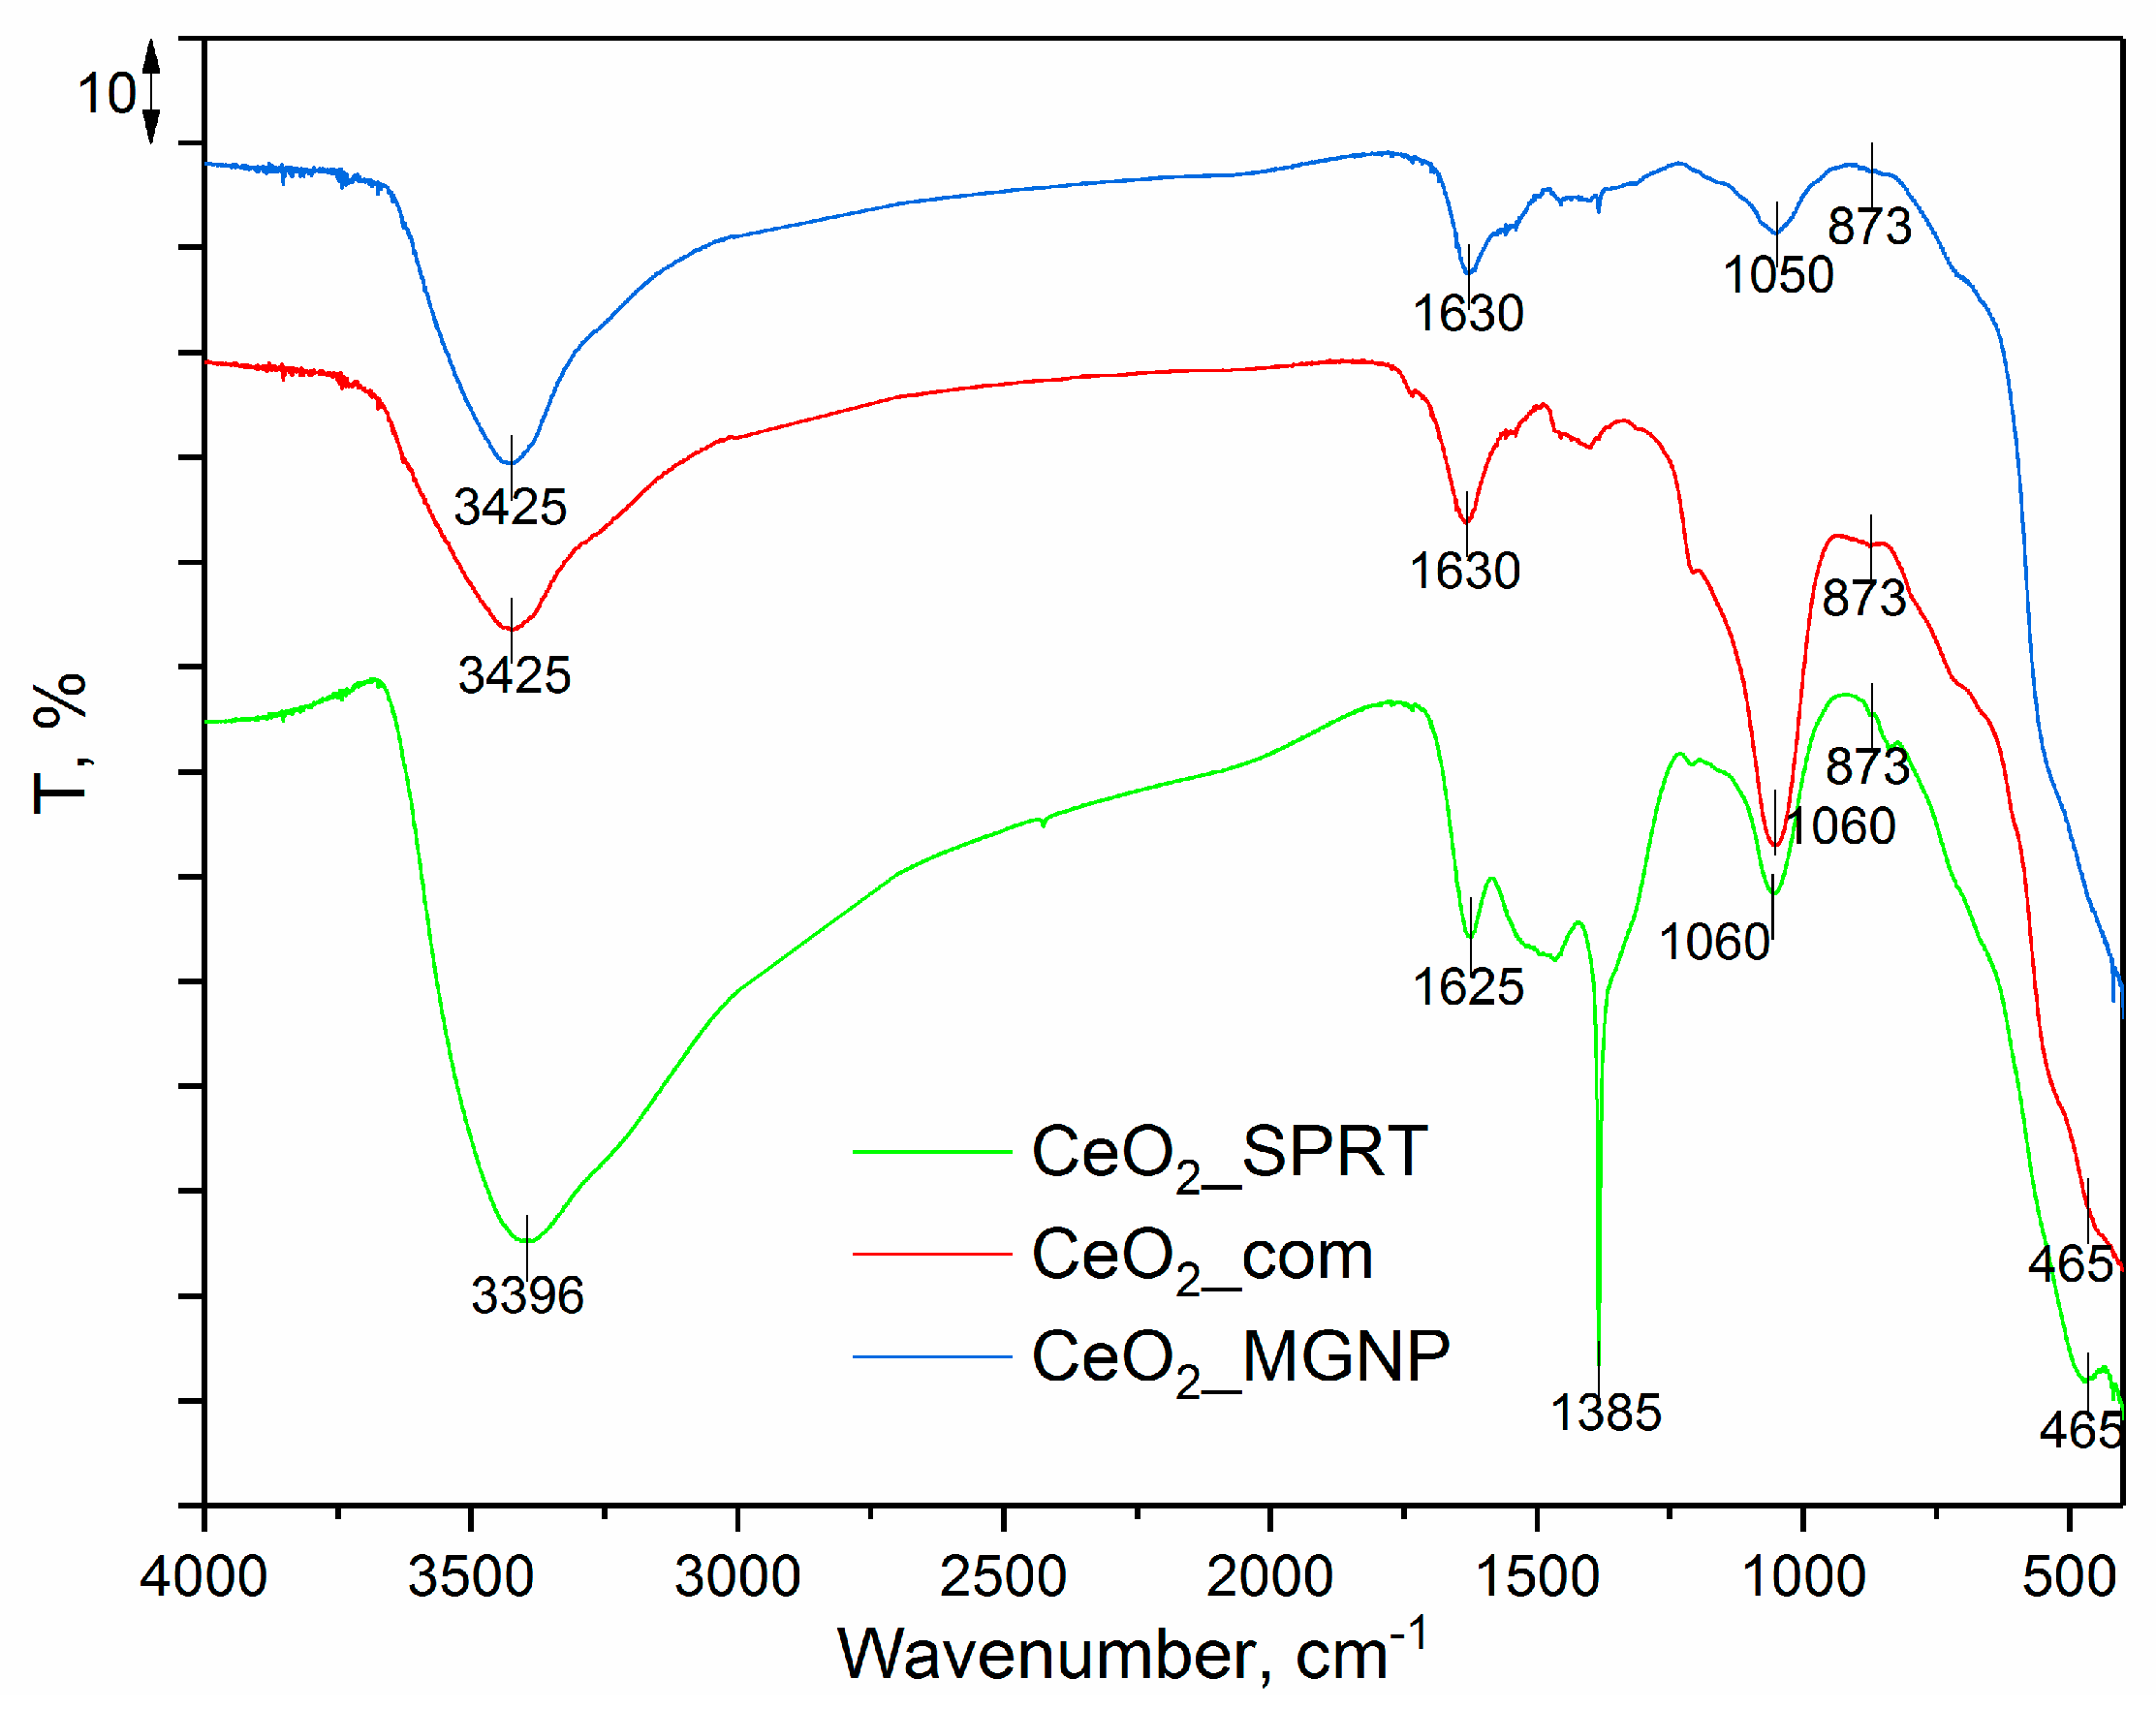
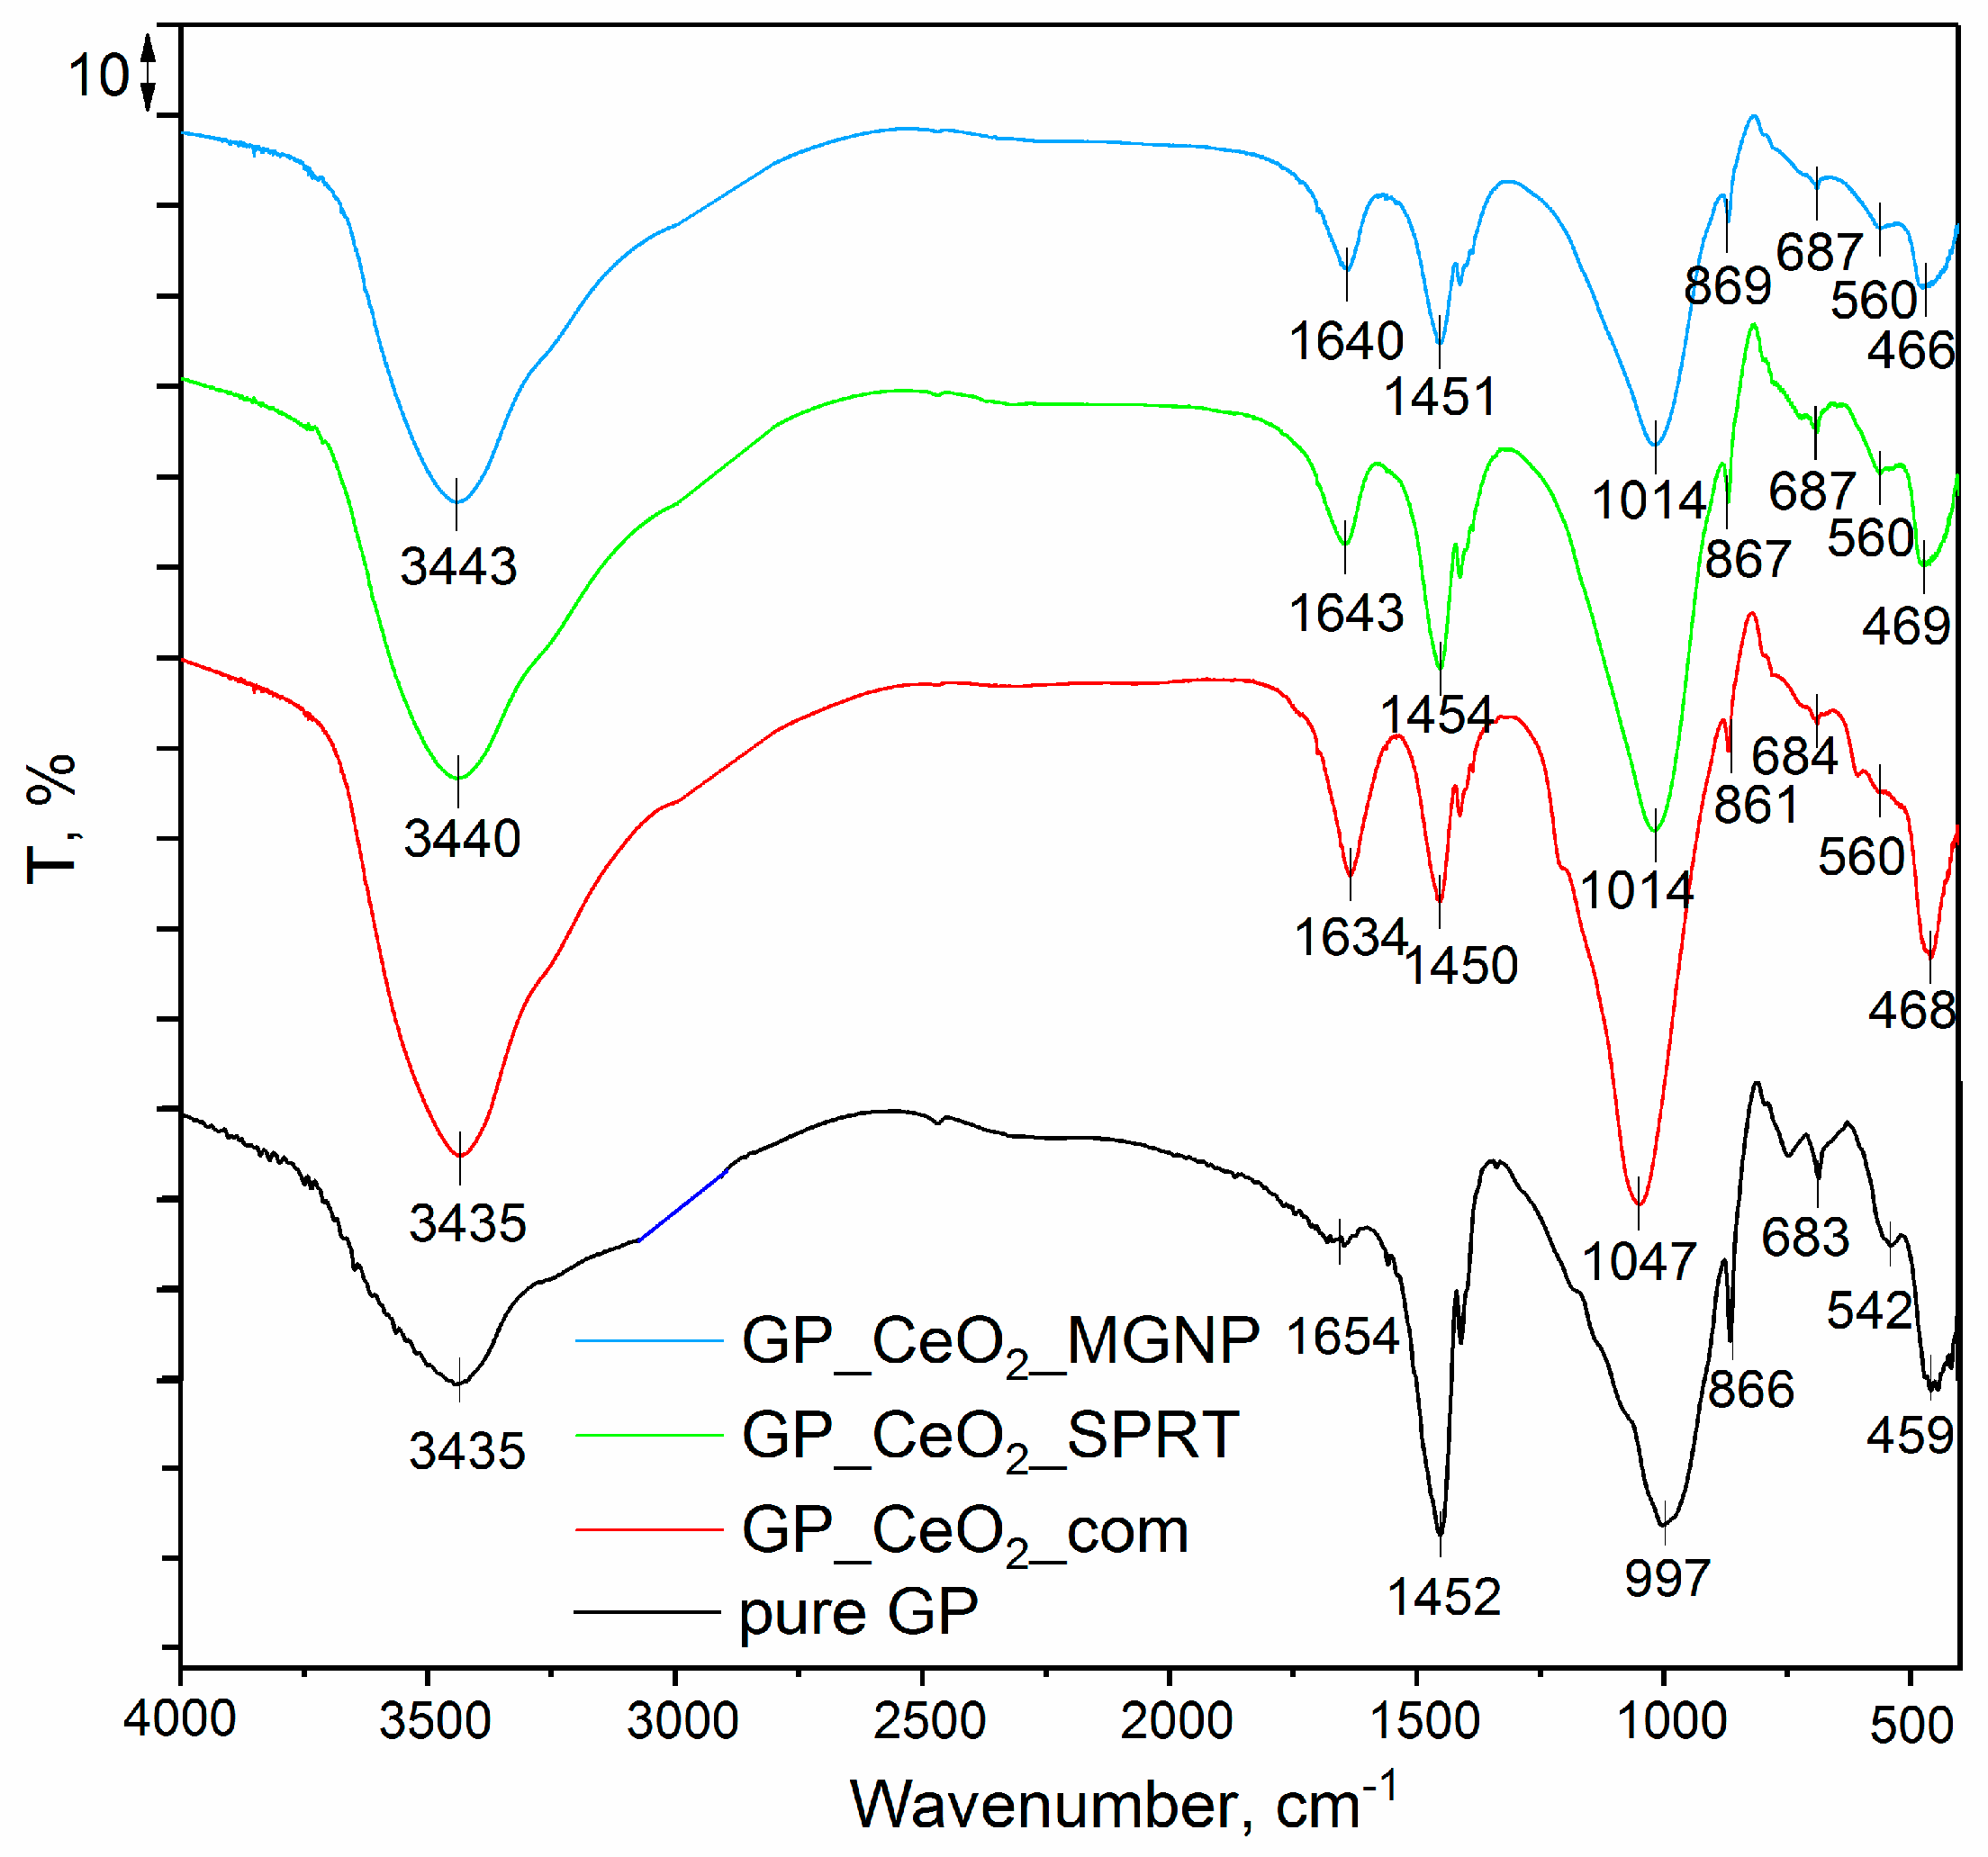
3.2. FTIR Analysis
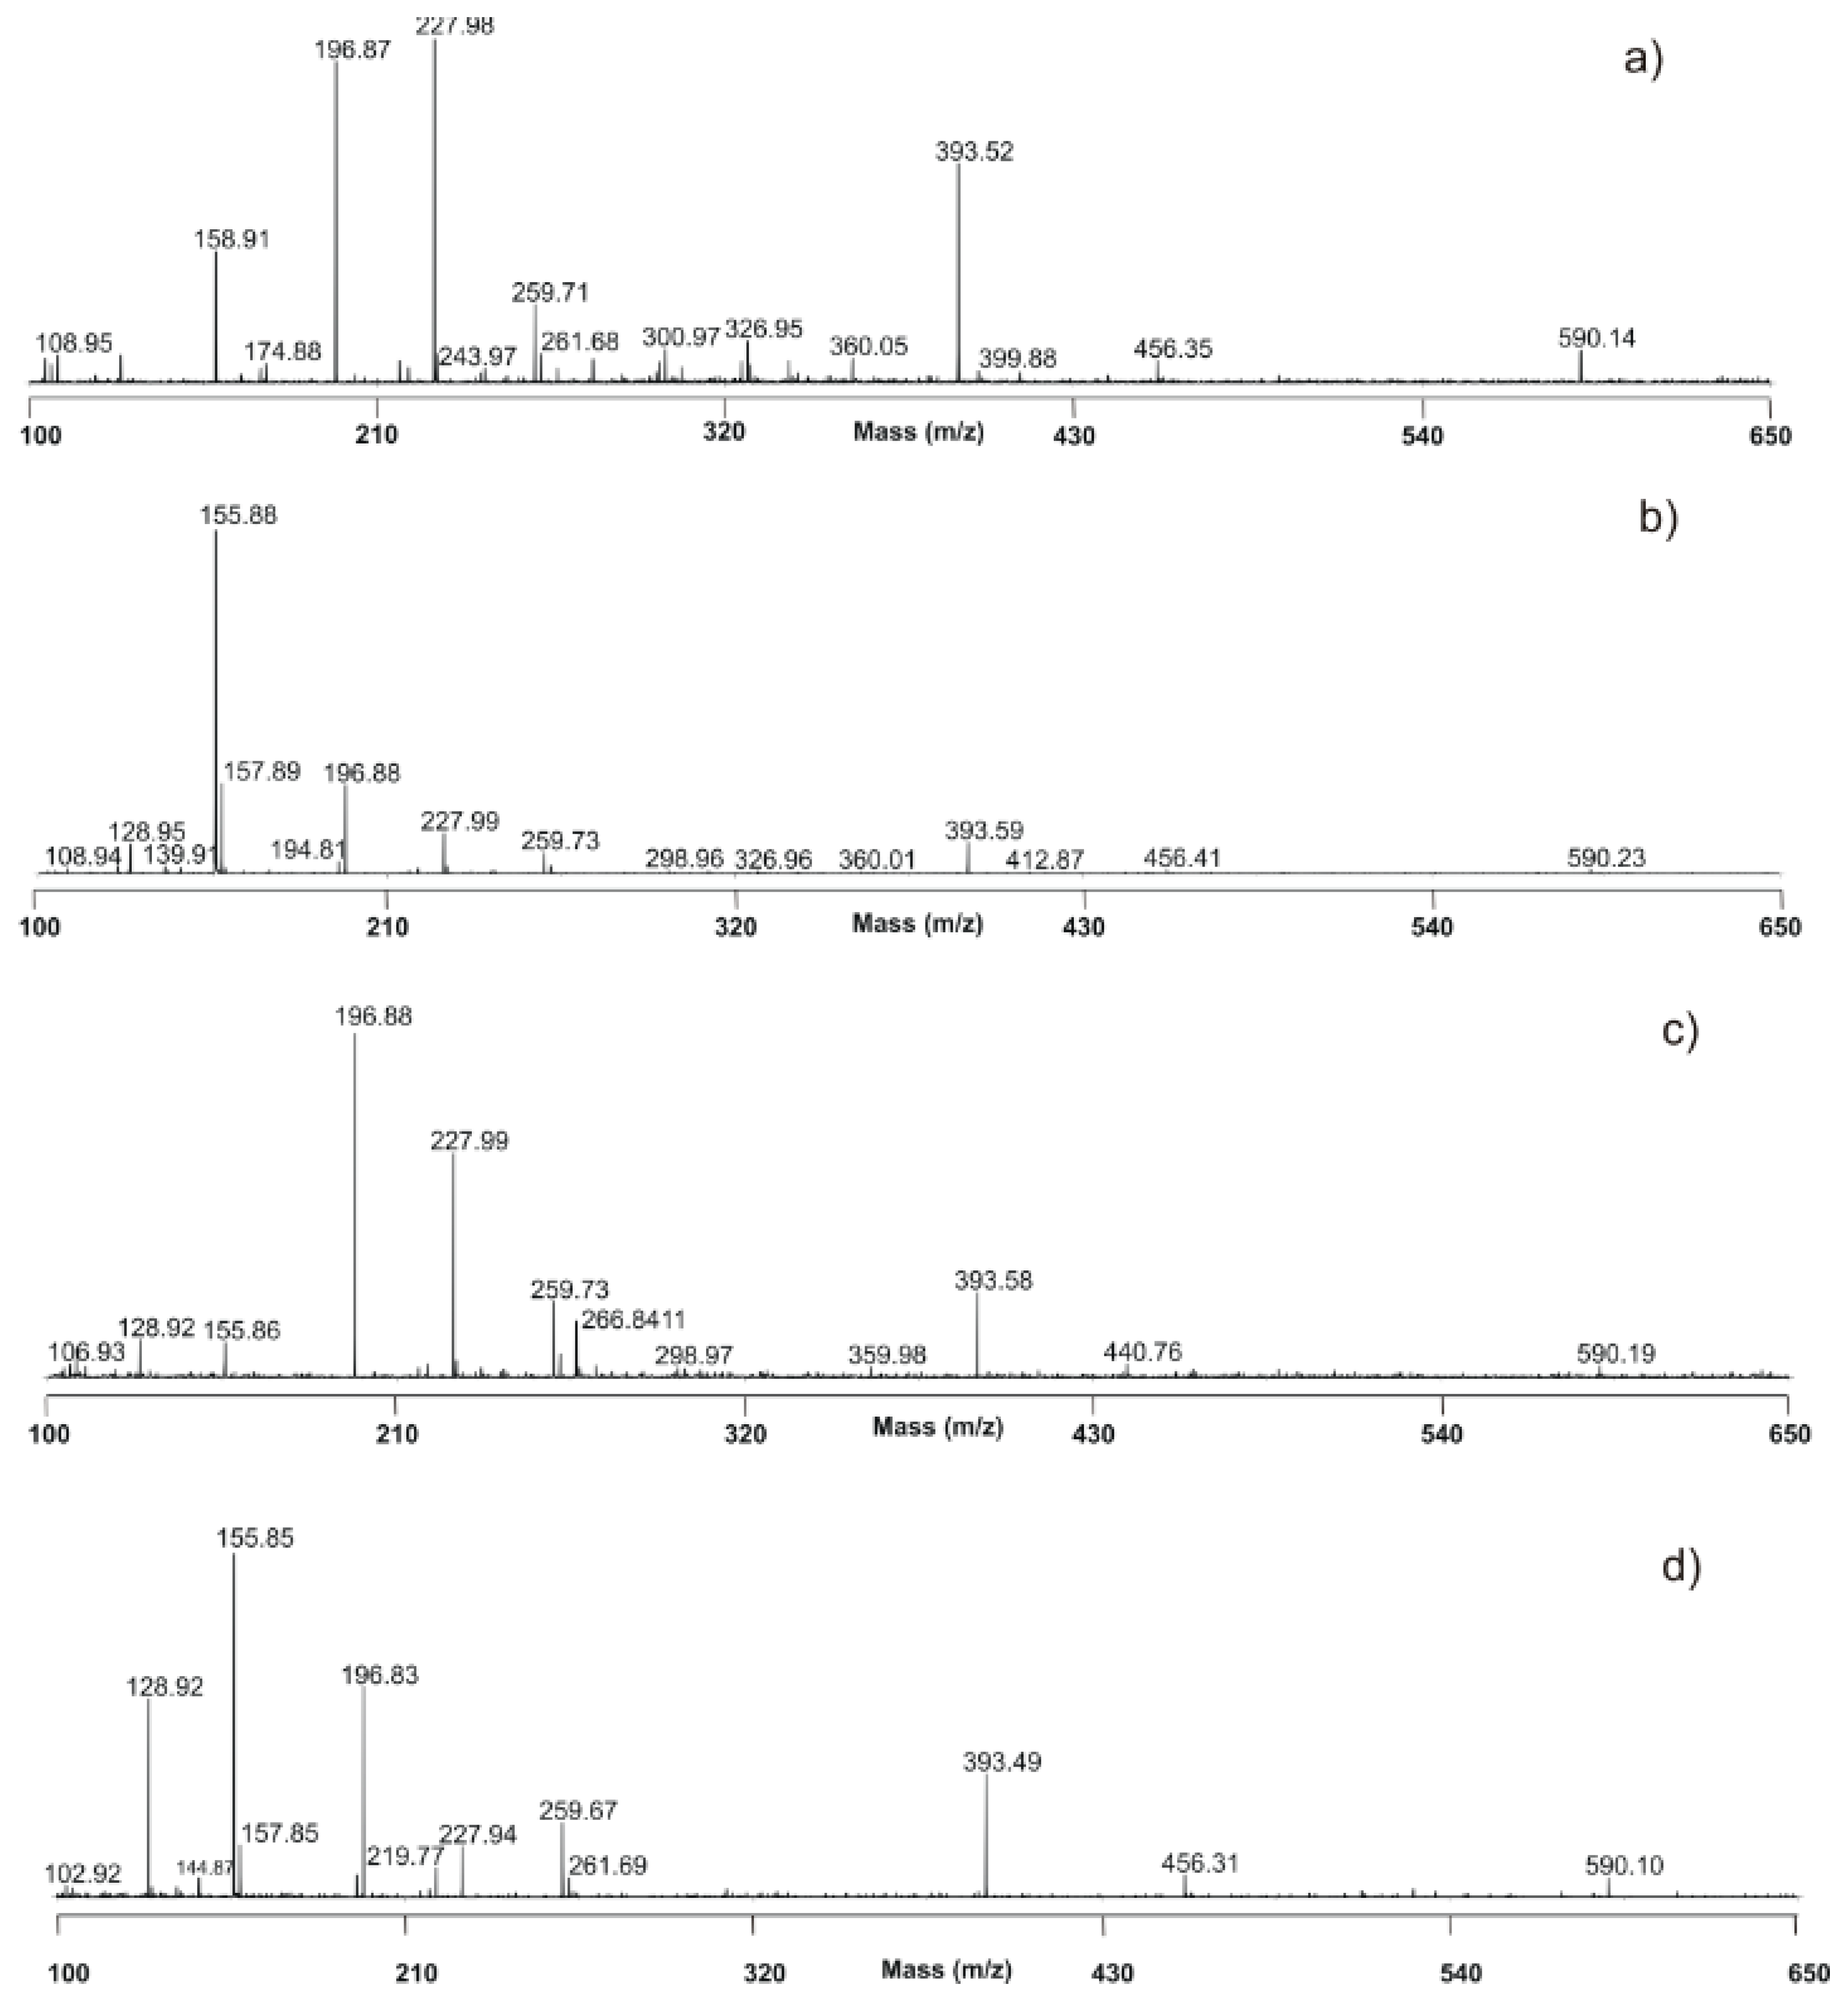
3.3. MALDI TOF Analysis
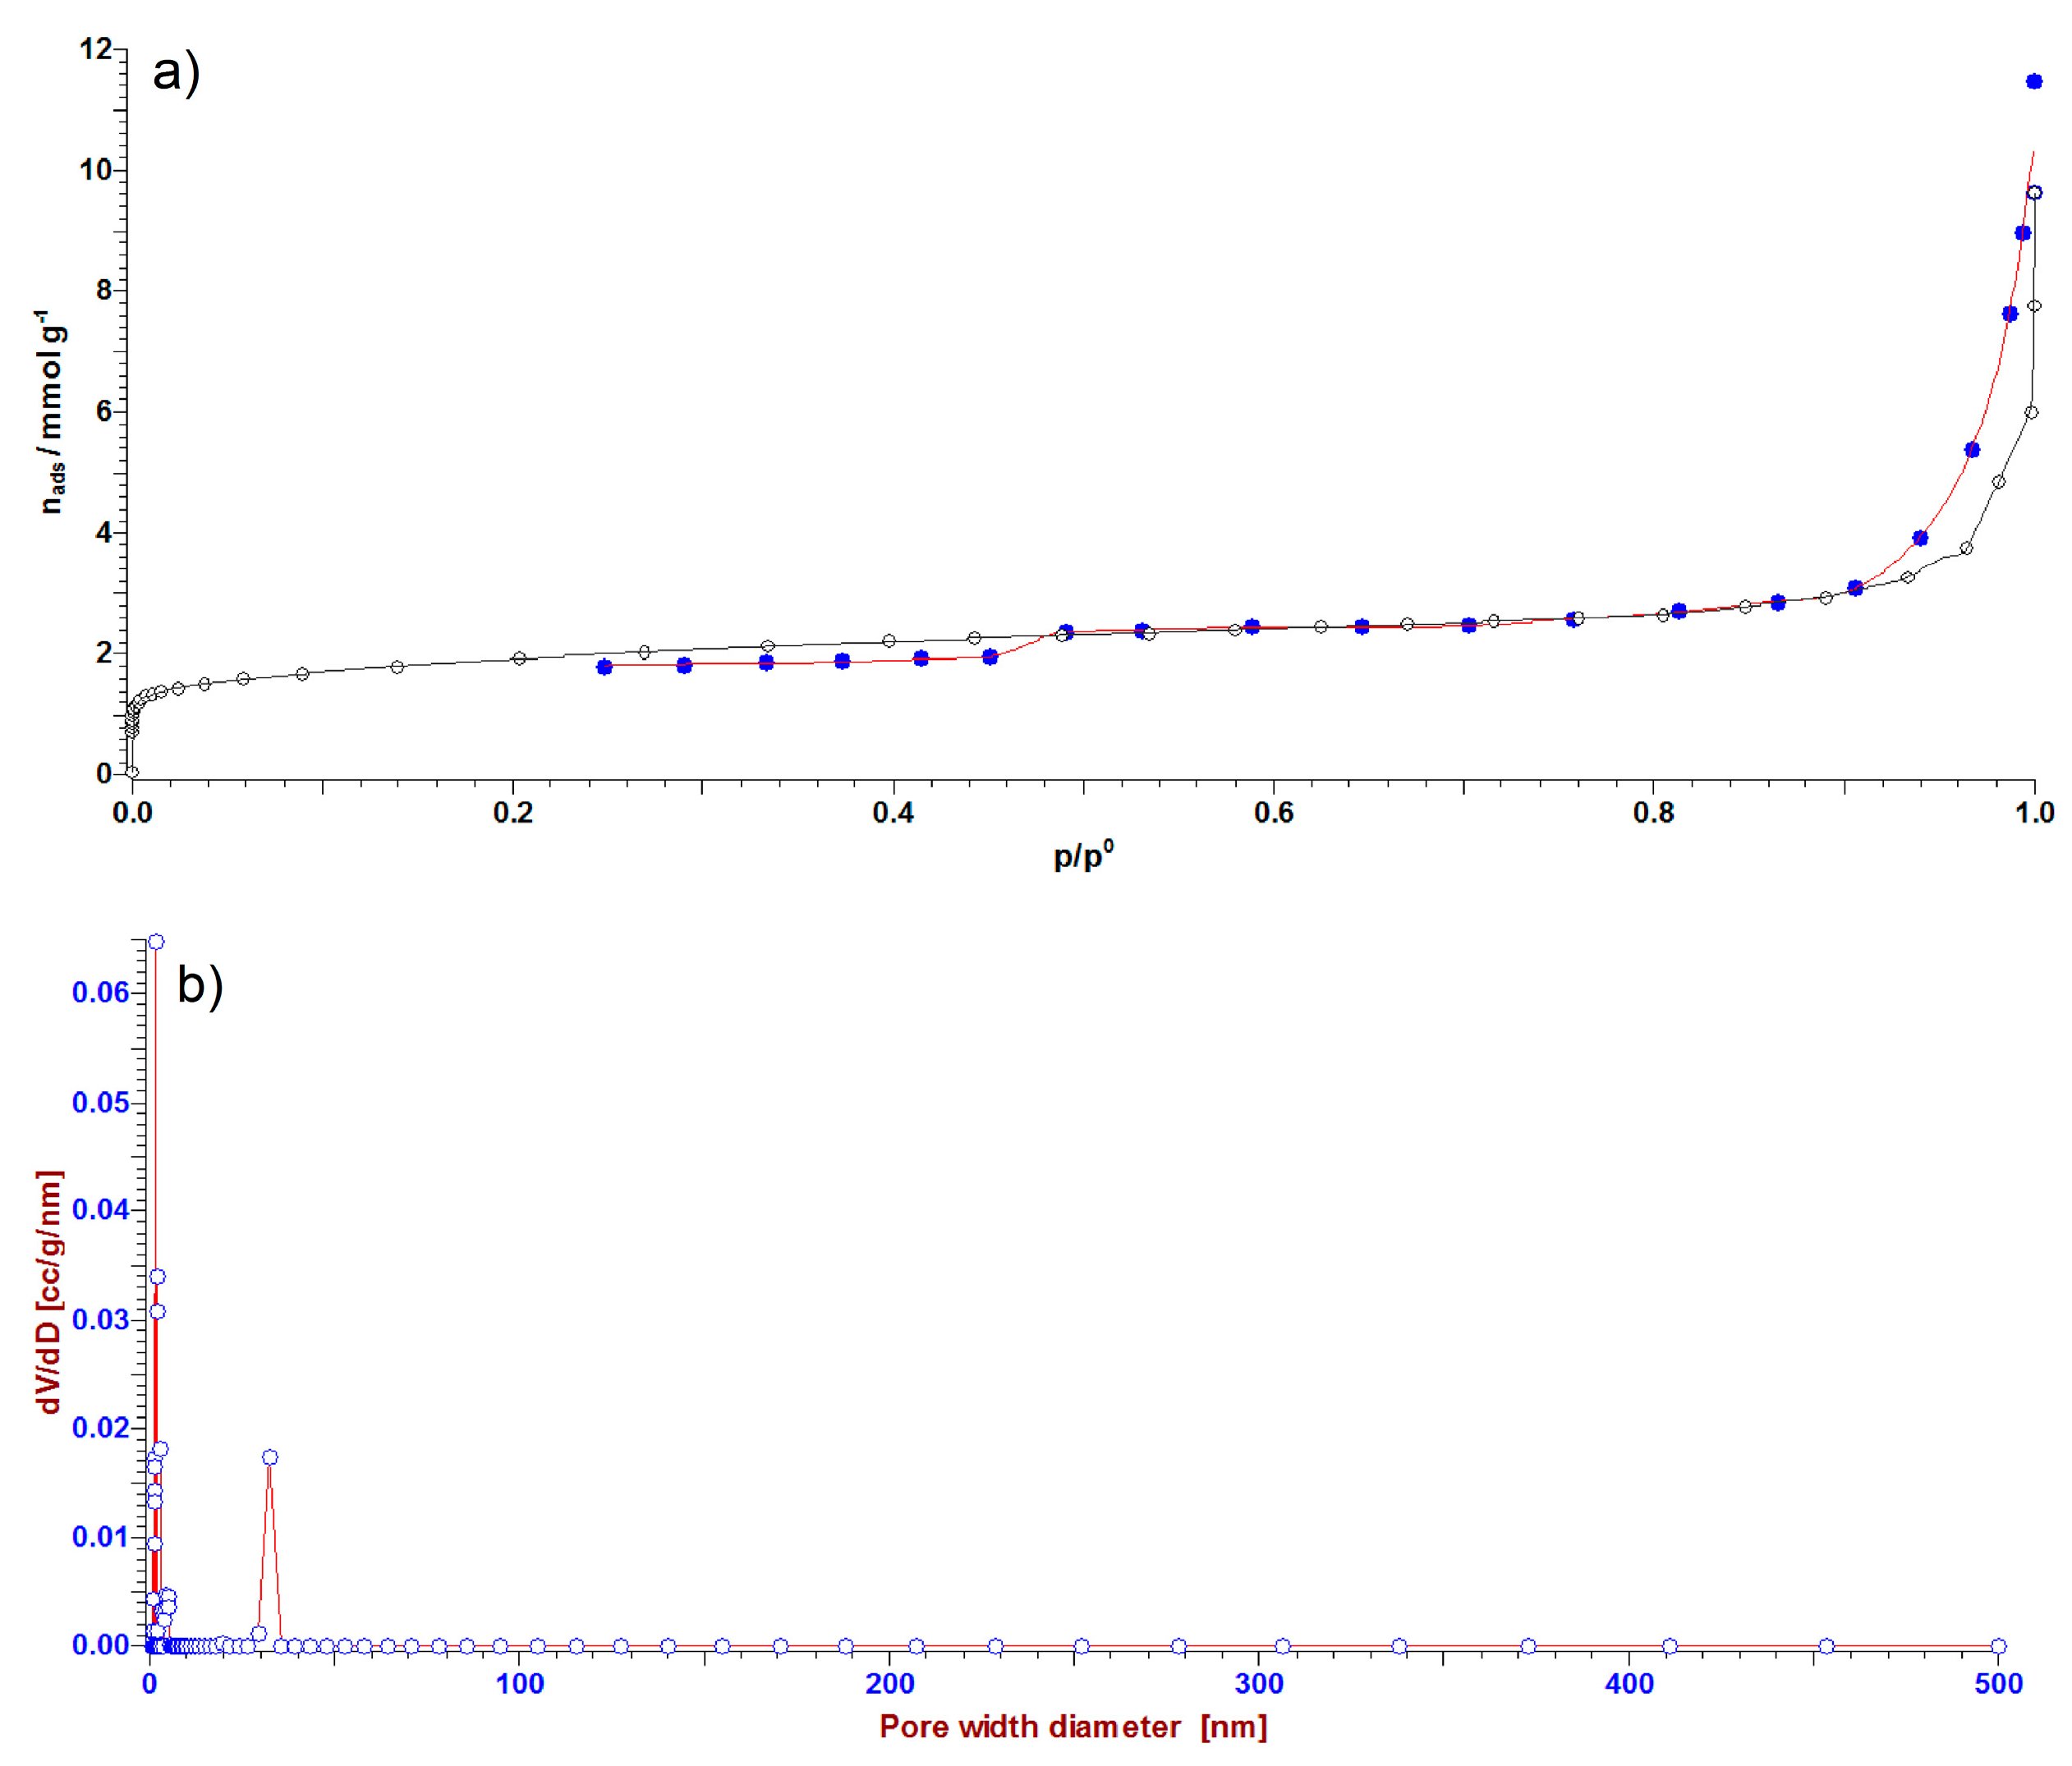
3.4. Adsorption isotherms—BET Analysis
3.5. TGA-DTA Analysis
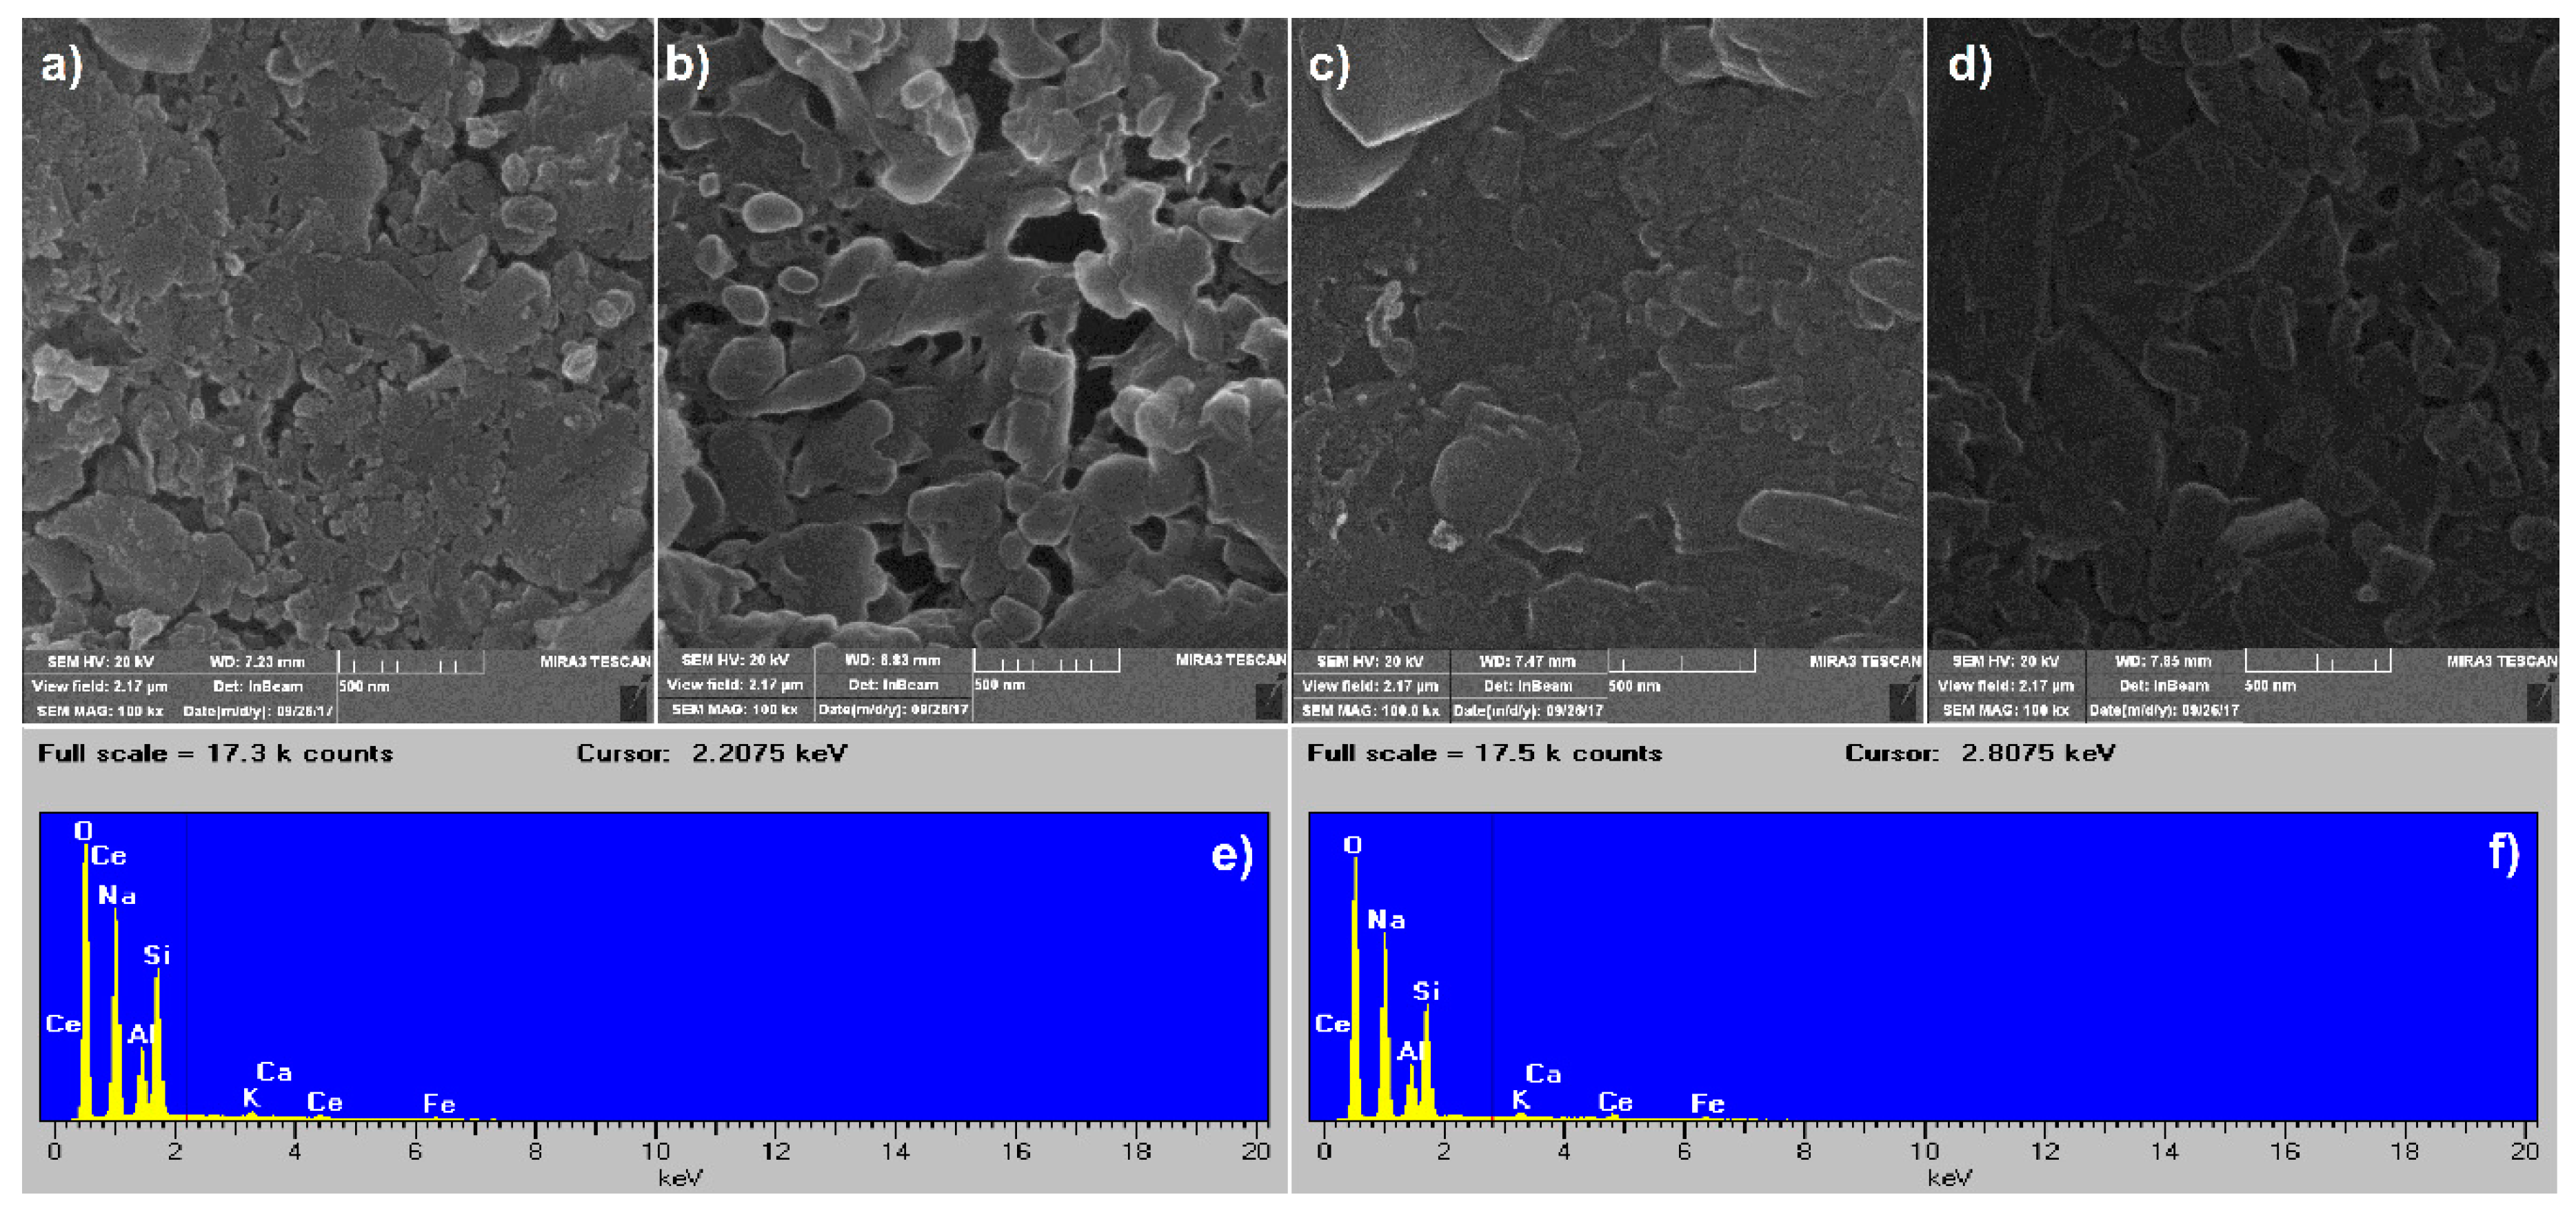
3.6. SEM Analysis
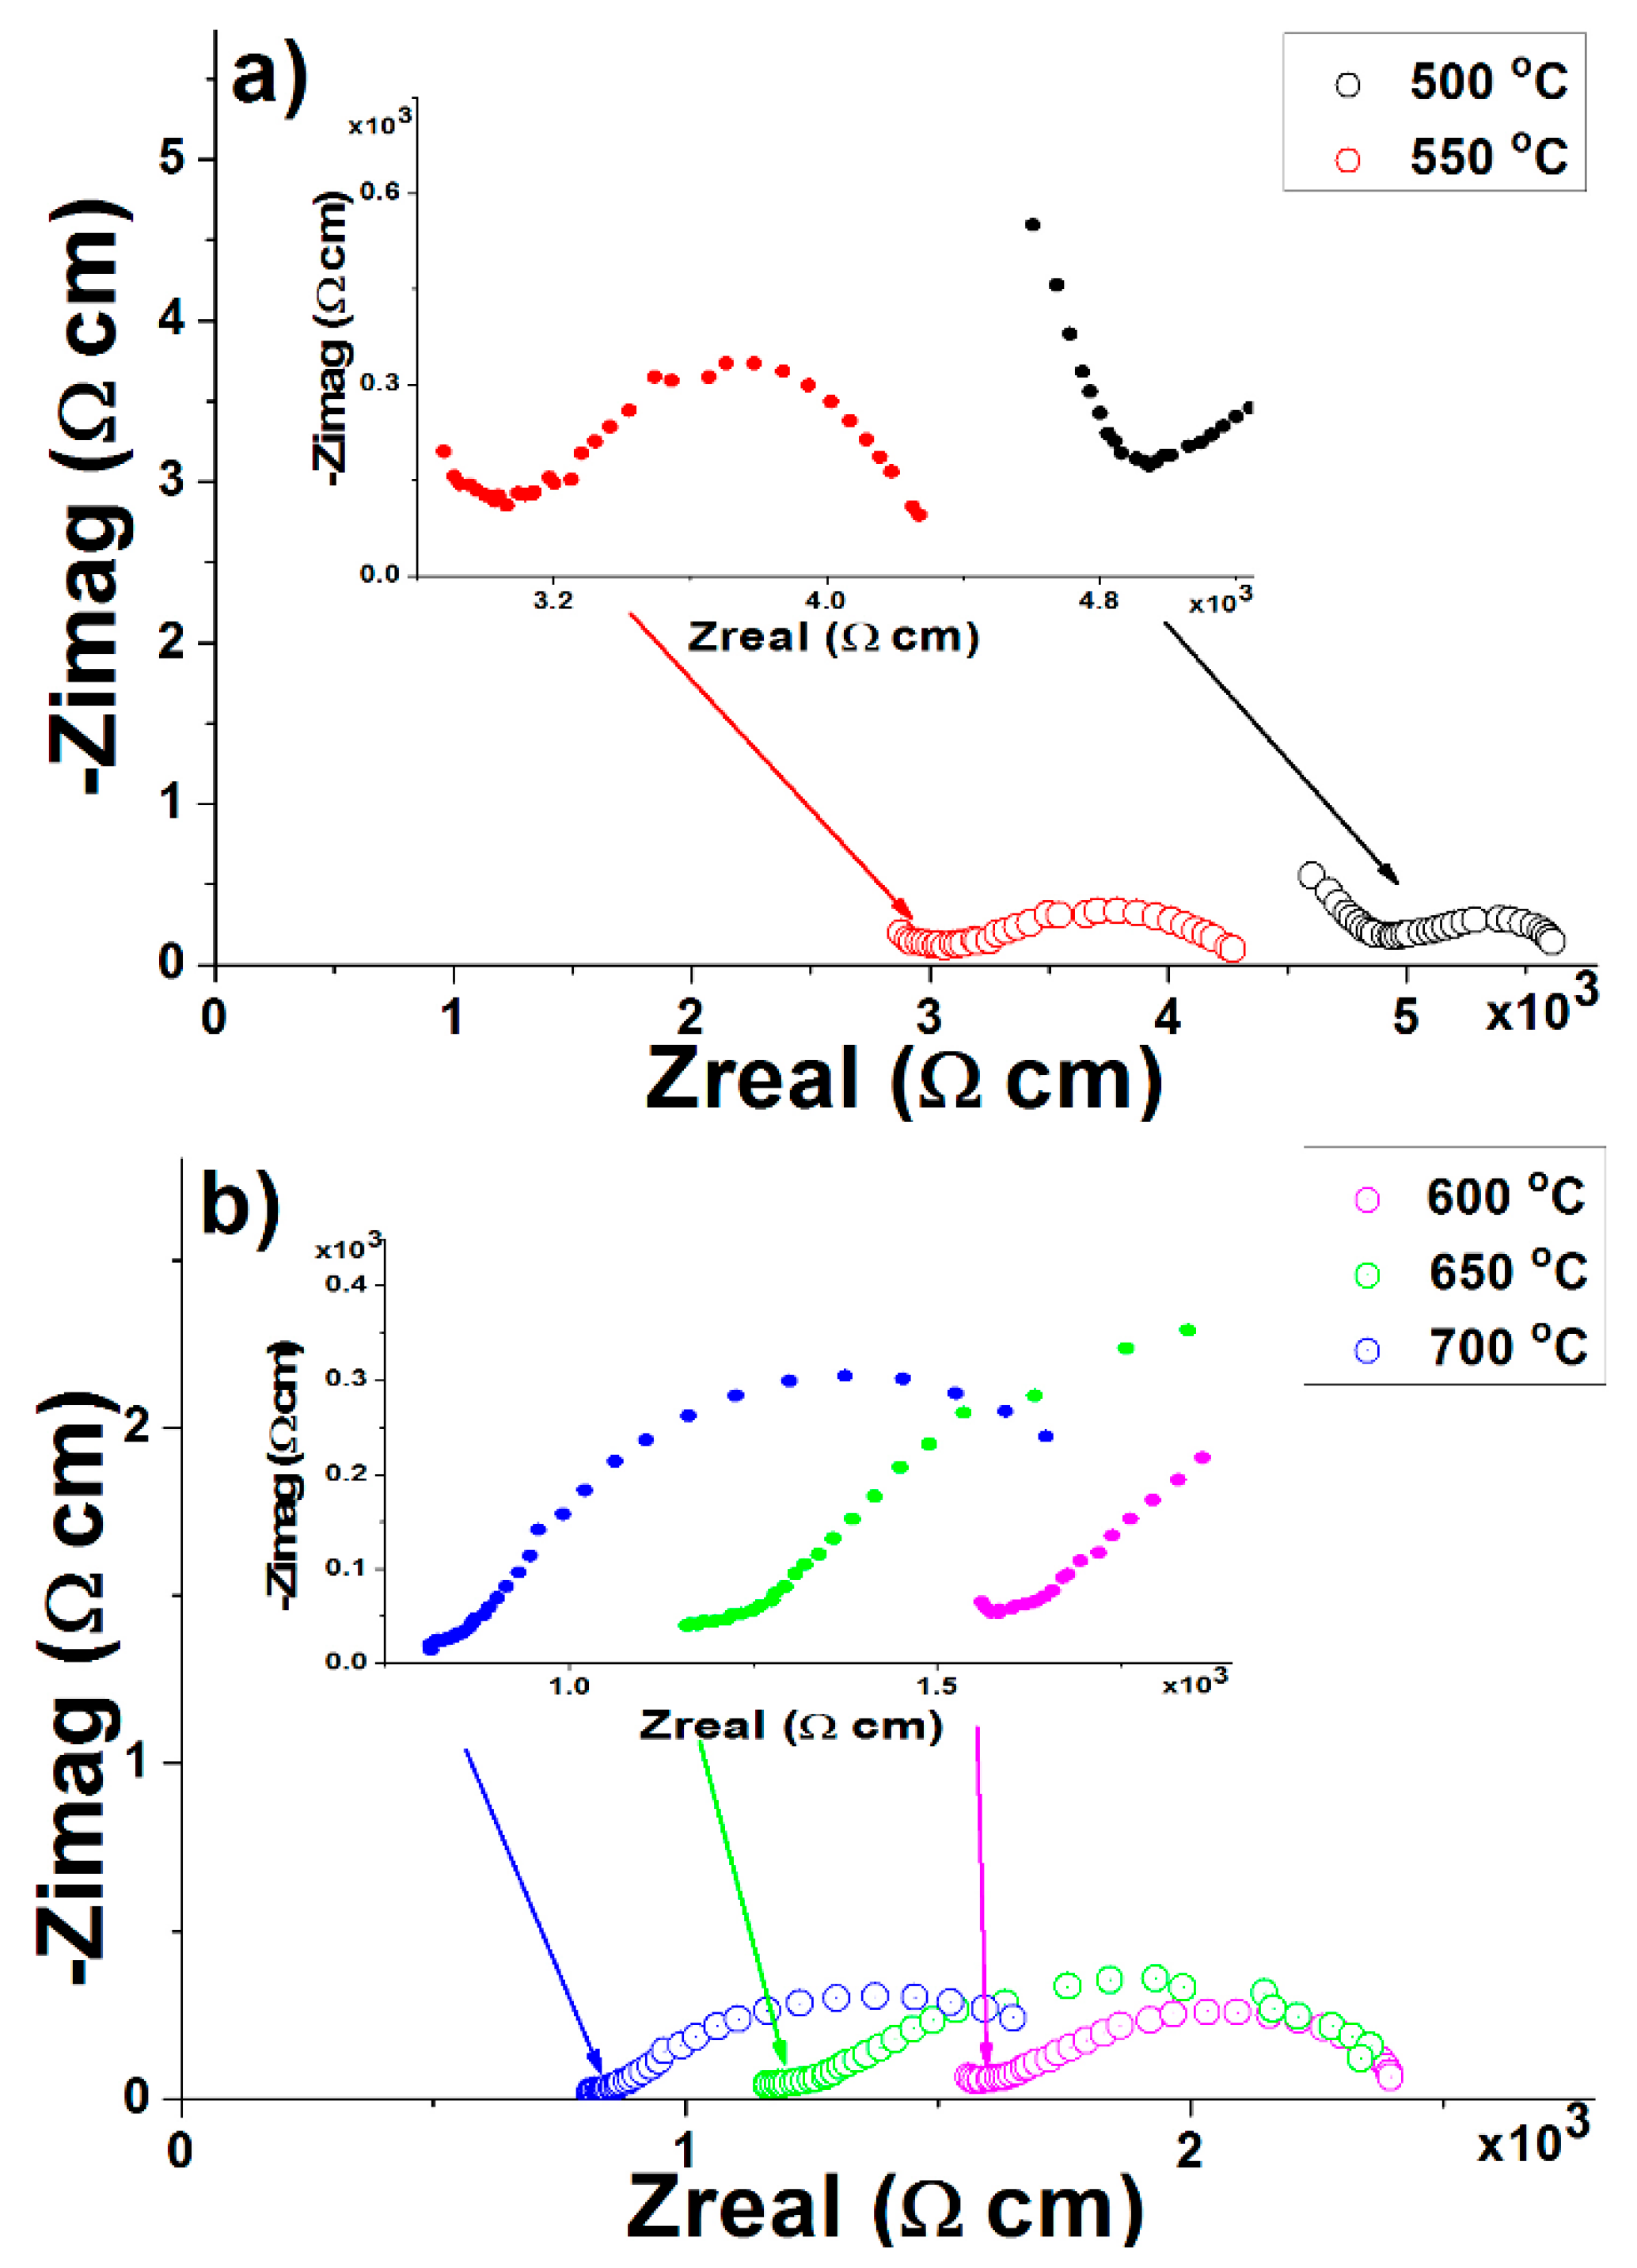
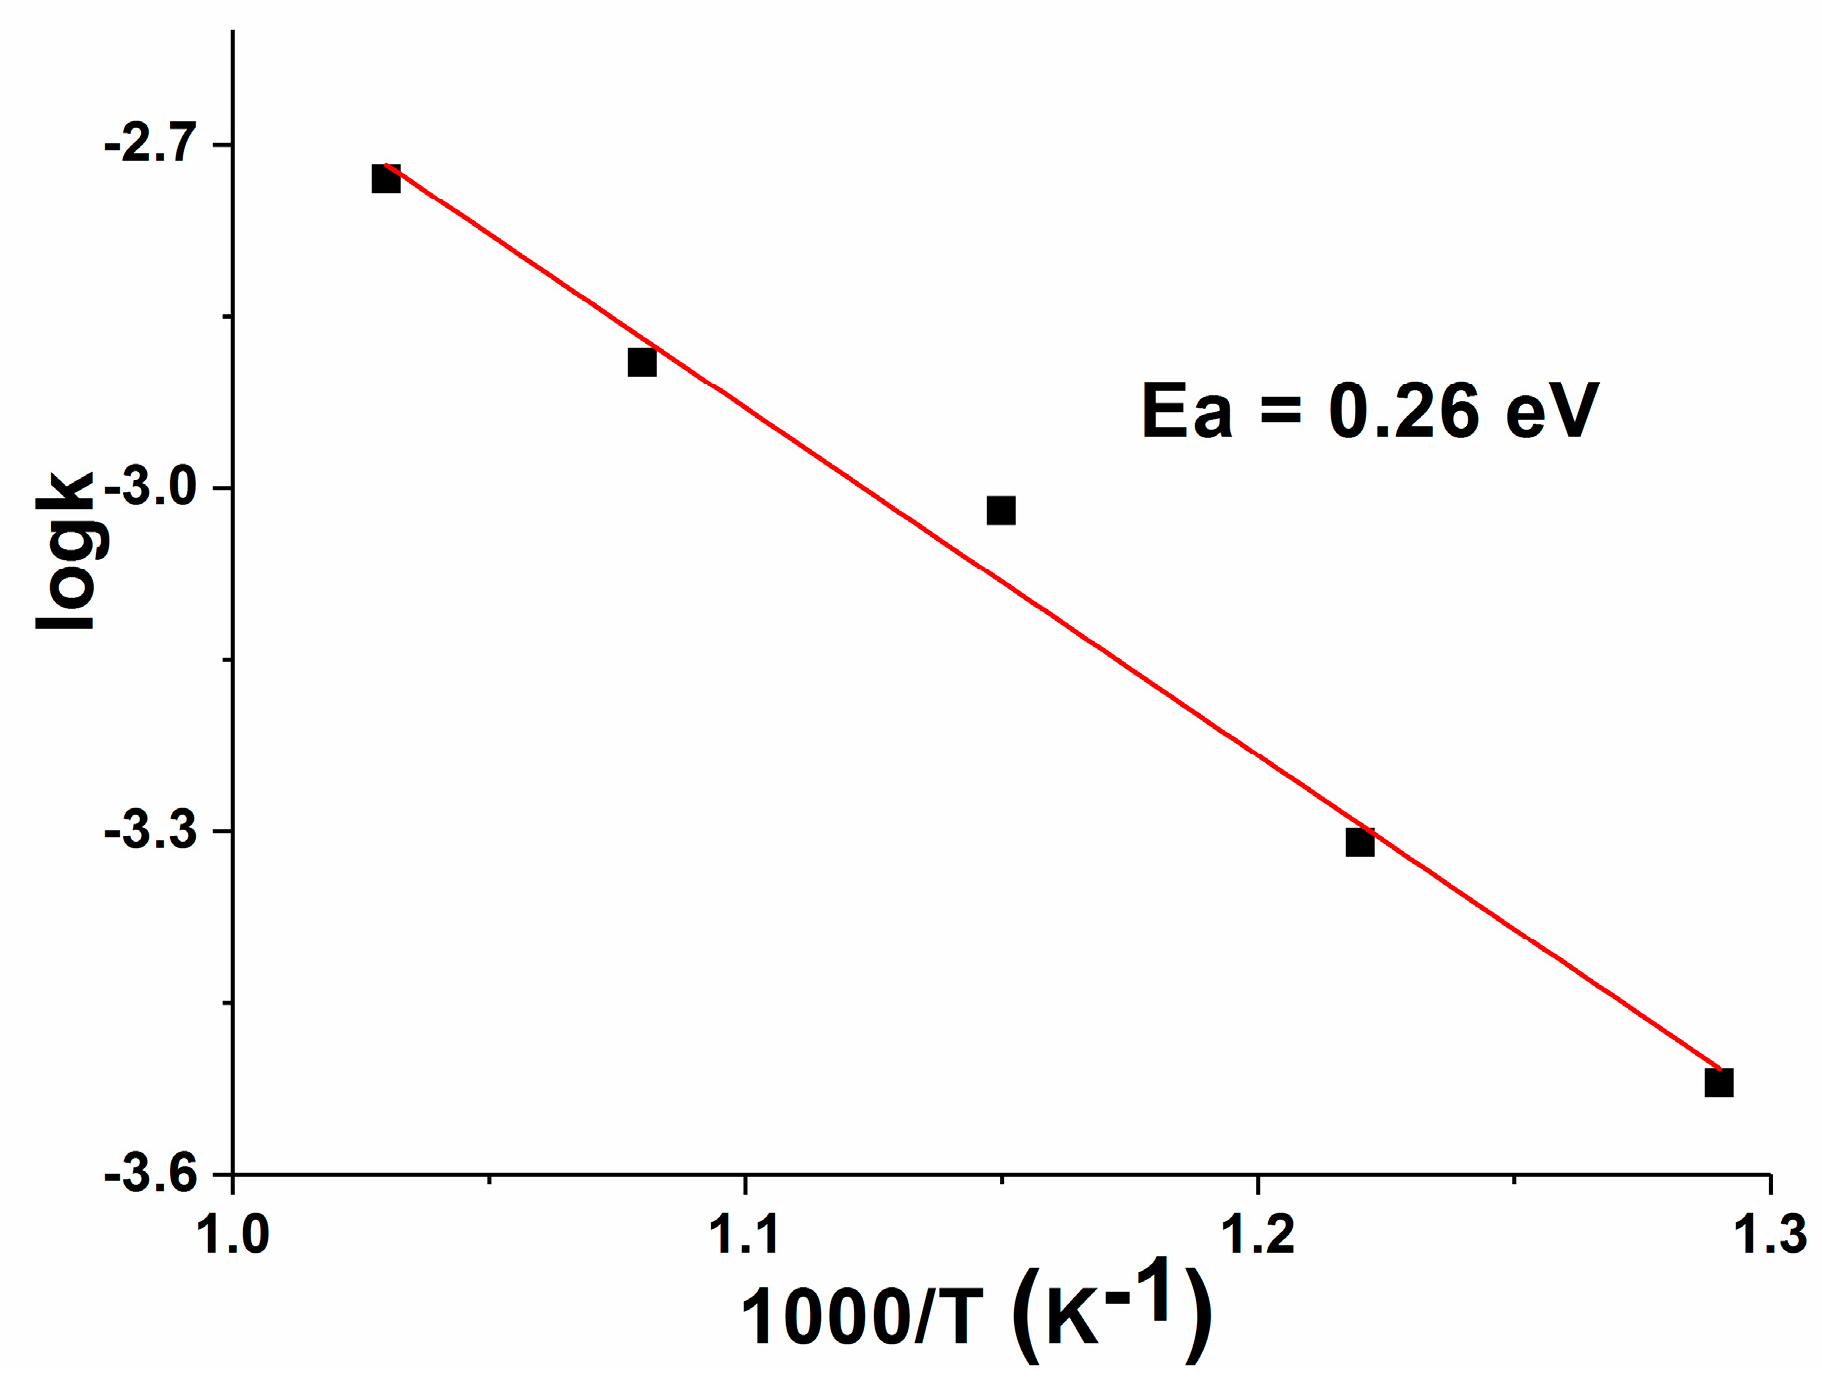
3.7. Electrical Conductivity
4. Conclusions
Author Contributions
Funding
Conflicts of Interest
References
- Alves, H.J.; Junior, C.B.; Niklewicz, R.R.; Frigo, E.P.; Frigo, M.S.; Coimbra-Arau’jo, C.H. Overview of hydrogen production technologies from biogas and the applications in fuel cells. J. Hydrog. Energy 2013, 38, 5215–5225. [Google Scholar] [CrossRef]
- Galvagno, A.; Chiodo, V.; Urbani, F.; Freni, F. Biogas as hydrogen source for fuel cell applications. Int. Hydrog. Energy 2013, 38, 3913–3920. [Google Scholar] [CrossRef]
- Liu, J.; Zhang, S.; Wang, W.; Gao, J.; Liu, W.; Chen, C. Partial oxidation of methane in a Zr0.84Y0.16O1.92eLa0.8Sr0.2Cr0.5Fe0.5O3-d hollow fiber membrane reactor targeting solid oxide fuel cell applications. J. Power Sources 2012, 217, 287–290. [Google Scholar] [CrossRef]
- Takagi, Y.; Kerman, K.; Ko, C.; Ramanathan, S. Operational characteristics of thin film solid oxide fuel cells with ruthenium anode in natural gas. J. Power Sources 2011, 243, 1–9. [Google Scholar] [CrossRef]
- Hao, X.; Liy, Y.; Wang, Z.; Qiao, J.; Sun, K. A novel sintering method to obtain fully dense gadolinia doped ceria by applying a direct current. J. Power Sources 2012, 210, 86–91. [Google Scholar] [CrossRef]
- Waldhäusl, J.; Preis, W.; Sitte, W. Electrochemical characterization of gadolinia- doped ceria using impedance spectroscopy and dc-polarization. Solid State Ion. 2012, 225, 453–456. [Google Scholar] [CrossRef]
- Gurel, T.; Eryigit, R. Ab initio pressure-depend vibrational and dielectric properties of CeO2. Phys. Rev. B 2006, 74, 014302. [Google Scholar] [CrossRef]
- Trovarelli, A. Catalytic properties of Ceria and CeO2-Containing Materials. Catal. Rev.-Sci. Eng. 1996, 38, 439–520. [Google Scholar] [CrossRef]
- Spaneir, J.E.; Robinson, R.D.; Zhang, F.; Chen, S.; Herman, I.P. Size-dependent properties of CeO2-y nanoparticles as studied by Raman scattering. Phys. Rev. B 2001, 64, 245407. [Google Scholar] [CrossRef]
- Atcison, A. Chemically-induced stresses in gadolinium-doped ceria solid oxide fuel cell electrolytes. Solid State Ion. 1997, 95, 249–258. [Google Scholar]
- Wang, S.; Wang, W.; Zuo, J.; Qian, Y. Study of the Raman spectrum of CeO2 nanometer thin films. Mater. Chem. Phys. 2001, 68, 246–248. [Google Scholar] [CrossRef]
- Bošković, S.B.; Matović, B.Z.; Vlajić, M.D.; Kristić, V.D. Modified glycine nitrate procedure (MGNP) for the synthesis of SOFC nano-powders. Ceram. Int. 2007, 33, 89–93. [Google Scholar] [CrossRef]
- Bošković, S.; Đurović, D.; Dohčević-Mitrović, Z.; Popović, Z.; Zinkevich, M.; Aldinger, F. Self Propagating room temperature synthesis of nano-powders for SOFC. J. Power Sources 2005, 145, 237–242. [Google Scholar] [CrossRef]
- Pikalova, E.Y.; Murashkina, A.A.; Maragou, V.I.; Demin, A.K.; Strekalovsky, V.N.; Tsiakaras, P.E. CeO2 based materials doped with lanthanides for applications in intermediate temperature electrochemical devices. Int. J. Hydrog. Energy 2011, 36, 6175–6183. [Google Scholar] [CrossRef]
- Stojmenović, M.; Bošković, S.; Žunić, M.; Varela, J.A.; Prekajski, M.; Matović, B.; Mentus, S. Electrical properties of multidoped ceria. Ceram. Int. 2014, 40, 9285–9292. [Google Scholar] [CrossRef]
- Mirković, M.; Dosen, A.; Erić, S.; Stojmenović, M.; Matović, B.; Rosić, A. Structural, Morphological and Electrical Properties of Multi-Doped Calcium Phosphate Materials as Solid Electrolytes for Intermediate Temperature Solid Oxide Fuel Cells. Sci. Sinter. 2018, 50, 95–109. [Google Scholar] [CrossRef]
- Egelja, A.; Pašalić, S.; Dodevski, V.; Kragović, M.; Stojković-Simatović, I.; Radovanović, Ž.; Stojmenović, M. Structural, Morphological and Electrical Properties of Alumina/YAG Composites as Solid Electrolyte for IT—SOFC. Sci. Sinter. 2011, 50, 357–369. [Google Scholar] [CrossRef]
- Gentile, P.; Sofie, S. Investigation of aluminosilicate as a solid oxide fuel cell refractory. J. Power Sources 2011, 196, 4545–4554. [Google Scholar] [CrossRef]
- Cuia, X.M.; Zhenga, G.J.; Hana, Y.C.; Sua, F.; Zhoub, J. A study on electrical conductivity of chemosynthetic Al2O3–2SiO2 geoploymer materials. J. Power Sources 2008, 184, 652–656. [Google Scholar] [CrossRef]
- Duxson, P.; Provis, J.L.; Lukey, G.C.; van Deventer, J.S.J.; Separovic, F. 29Si NMR study of structural ordering in aluminosilicate geopolymer gels. Langmuir 2005, 21, 3028–3033. [Google Scholar] [CrossRef]
- Cvetković, V.S.; Purenović, J.M.; Jovićević, J.N. Change of water redox potential, pH and rH in contact with magnesium enriched kaolinite–bentonite ceramics. Appl. Clay Sci. 2008, 38, 268–278. [Google Scholar] [CrossRef]
- Méndez, Y.E.; Vlasova, M.; Leon, I.; Trejo, M.; Kakazey, M. Properties of low-temperature porous ceramics on the base of clay-fusible glass mixtures. J. Aust. Ceram. Soc. 2010, 46, 53–62. [Google Scholar]
- Peng, L.M. Fabrication and mechanical properties of microalloyed and ceramic particulate reinforced NiAl-based alloys. J. Alloys Compd. 2007, 440, 150–153. [Google Scholar] [CrossRef]
- Purenović, J.M. Properties and Application of Multifunctional Microalloyed Composite Alumino-Silicate Ceramics as Active Dielectric with Nanostructured Metal Films on an Amorphous-Crystal Matrix, with the Fractal Nature of Grain Boundary; Monography, Vinča Institut of Nuclear Sciences: Belgrade, Serbia, 2016. [Google Scholar]
- Martínez-González, L.G.; Rodríguez-Reyna, E.; Moreno, K.J.; Escalante-García, J.I.; Fuentes, A.F. Ionic conductivity of apatite-type rare-earth silicates prepared by mechanical milling. J. Alloys Compd. 2009, 476, 710–714. [Google Scholar] [CrossRef]
- Nallamuthu, N.; Prakash, I.; Satyanarayana, N.; Venkateswarlu, M. Electrical conductivity studies of nanocrystalline lanthanum silicate synthesized by sol–gel route. J. Alloys Compd. 2011, 509, 1138–1145. [Google Scholar] [CrossRef]
- Marrero-López, D.; dos Santos-Gómez, L.; León-Reina, L.; Canales-Vázquez, J.; Losilla, E.R. Influence of the microstructure on the bulk and grain boundary conductivity in apatite-type electrolytes. J. Power Sources 2014, 245, 107–118. [Google Scholar] [CrossRef]
- Skinner, S.; KIlner, J. Oxyen ion coductors. Mater. Today 2003, 6, 303–307. [Google Scholar] [CrossRef]
- Slater, P.; Sansom, J.; Tolchard, J. Development of apatite-type oxide ion conductors. Chem. Rec. 2004, 4, 373–384. [Google Scholar] [CrossRef]
- Nenadović, S.; Kljajević, L.J.; Nešić, M.; Petković, M.; Trivunac, K.; Pavlović, V. Structure analysis of geopolymers synthesized from clay originated from Serbia. Environ. Earth Sci. 2017, 2, 76–79. [Google Scholar] [CrossRef]
- Stojmenović, M.; Bošković, S.; Zec, S.; Babić, B.; Matović, B.; Bučevac, D.; Dohčević-Mitrović, Z.; Aldinger, F. Characterization of nanometric multidoped ceria powders. J. Alloys Compd. 2010, 507, 279–285. [Google Scholar] [CrossRef]
- Stojmenović, M.; Bosković, S.; Bučevac, D.; Prekajski, M.; Babić, B.; Matović, B.; Mentus, S. Electrical characterization of multidoped ceria ceramics. Ceram. Int. 2013, 39, 1249–1255. [Google Scholar] [CrossRef]
- Stojmenović, M.; Žunić, M.; Gulicovski, J.; Bajuk–Bogdanović, D.; Holclajtner–Antunović, I.; Dodevski, V.; Menus, S. Structural, morphological, and electrical properties of doped ceria as a solid electrolyte for intermediate–temperature solid oxide fuel cells. J. Mater. Sci. 2015, 50, 3781–3794. [Google Scholar] [CrossRef]
- Tokyo Rigaku Corporation. PDXL Integrated X-ray Powder Diffraction Software; Rigaku Corporation: Tokyo, Japan, 2011. [Google Scholar]
- International Centre for Diffraction Data (ICDD). Powder Doffraction File P-D, Announcement of New Database Release; International Centre for Diffraction Data: Newtown Square, PA, USA, 2012. [Google Scholar]
- Barrett, E.; Joyner, L.; Halenda, P. The determination of pore volume and area distributions in porous substances. I. Computations from nitrogen isotherms. J. Am. Chem. Soc. 1951, 73, 373–380. [Google Scholar] [CrossRef]
- Kaneko, K.; Ishii, C.; Ruike, M.; Kuwabara, H. Origin of superhigh surface area and microcrystalline graphitic structures of activated carbons. Carbon 1992, 30, 1075–1088. [Google Scholar] [CrossRef]
- Kruk, M.; Jaroniec, M.; Gadkaree, K.P. Nitrogen adsorption studies of novel synthetic active carbons. J. Colloid Interface Sci. 1997, 192, 250–256. [Google Scholar] [CrossRef]
- Kaneko, K.; Ishii, C.; Kanoh, H.; Hanzawa, Y.; Setoyama, N.; Suzuki, T. Characterization of porous carbons with high resolution αs–analysis and low temperature magnetic susceptibility. Adv. Colloid Interface Sci. 1998, 76–77, 295–320. [Google Scholar] [CrossRef]
- Kljajević, L.Ј.M.; Nenadović, S.S.; Nenadović, M.T.; Bundaleski, N.K.; Todorović, B.Ž.; Pavlović, V.B.; Rakočević, Z.L.J. Structural and chemical properties of thermally treated geopolymer samples. Ceram. Int. 2017, 43, 6700–6708. [Google Scholar] [CrossRef]
- Nenadović, S.; Kljajević, L.J.; Nenadović, M.; Mirkovic, M.; Markovic, S. Mechanochemical treatment and structural properties of lead adsorption on kaolinite (Rudovci, Serbia). Environ. Earth Sci. 2015, 73, 7669–7677. [Google Scholar] [CrossRef]
- Ilić, B.; Mitrović, A.; Miličić, L.J. Thermal treatment of kaolin clay. Hem. Ind. 2010, 64, 351–356. [Google Scholar]
- Farahmandjou, M.; Zarinkamar, M.; Firoozabadi, T.P. Synthesis of Cerium Oxide (CeO2) nanoparticles using simple CO-precipitation method. Revista Mexicana de Fısica 2016, 62, 496–499. [Google Scholar]
- Wang, T.; Sun, D. Preparation and characterization of nanometer-scale powders ceria by electrochemical deposition method. Mater. Res. Bull. 2008, 43, 1745–1760. [Google Scholar] [CrossRef]
- Chelliah, M.; Rayappan, J.; Krishnan, U. Synthesis and Characterization of Cerium Oxide Nanoparticles by Hydroxide Mediated Approach. J. Appl. Sci. 2012, 12, 1734–1737. [Google Scholar]
- Zhang, J.; Ju, X.; Wu, Z.; Liu, T.; Hu, T.D.; Xie, Y.; Zhang, Z. Structural Characteristics of Cerium Oxide Nanocrystals Prepared by the Microemulsion Method. Chem. Mater. 2001, 13, 4192–4197. [Google Scholar] [CrossRef]
- Heah, C.; Khairul Nizar, I.; Kamarudin, H.; Mustafa Al Bakri, A.; Bnhussain, M.; Luqman, M.; Ruzaidi, C.; Liew, Y. Kolin-based geopolymers with various NaOH concentrations. Int. J. Min. Met. Mater. 2013, 20, 313–322. [Google Scholar] [CrossRef]
- Zagaynov, I.; Buryak, A. A surface and catalytic investigation of ceria by laser desorption, ionization mass spectrometry. Nanosyst. Phys. Chem. Math. 2017, 8, 290–295. [Google Scholar] [CrossRef][Green Version]
- Sing, K.; Everett, D.; Haul, R.; Moscou, L.; Pierotti, R.; Rouquerol Siemieniewska, T. Reporting physisorption data for gas/solid systems with special reference to the determination of surface area and porosity. Pure Appl. Chem. 1985, 57, 603–619. [Google Scholar] [CrossRef]
- Durmus, S.; Dalmaz, A.; Ozdincer, M.; Sivrikaya, S. Preparation of Cerium Oxide Nanoparticles: An Efficient Catalyst to the Synthesis of Dimeric Disulphide Schiff Bases. CBU J. Sci. 2017, 13, 25–30. [Google Scholar]
- Rees, C.A.; Provis, J.L.; Lukey, G.C.; van Deventer, J.S.J. In Situ ATR-FTIR Study of the Early Stages of Fly Ash Geopolymer Gel. Langmuir 2007, 23, 9076–9082. [Google Scholar] [CrossRef]
- Ogundiran, M.B.; Kumar, S. Synthesis and characterization of geopolymer from Nigerian Clay. Appl. Clay Sci. 2015, 108, 173–181. [Google Scholar] [CrossRef]


| COMPOSITION | κ (Ω−1 cm−1) 500 °C | κ (Ω−1 cm−1) 550 °C | κ (Ω−1 cm−1) 600 °C | κ (Ω−1 cm−1) 650 °C | κ (Ω−1 cm−1) 700 °C |
|---|---|---|---|---|---|
| GP | 2.34 × 10⁻³ | 3.33 × 10⁻³ | 5.35 × 10⁻³ | 9.32 × 10⁻³ | 1.04 × 10⁻² |
| GP_CeO2_com | 2.31 × 10⁻³ | 3.02 × 10⁻³ | 2.34 × 10⁻³ | 5.29 × 10⁻³ | 9.89 × 10⁻³ |
| GP_CeO2_MGNP | 2.39 × 10⁻³ | 3.52 × 10⁻³ | 5.48 × 10⁻³ | 9.53 × 10⁻³ | 1.86 × 10⁻² |
| GP_CeO2_SPRT | 3.89 × 10⁻³ | 6.09 × 10⁻³ | 1.03 × 10⁻² | 2.84 × 10⁻² | 5.52 × 10⁻³ |
© 2020 by the authors. Licensee MDPI, Basel, Switzerland. This article is an open access article distributed under the terms and conditions of the Creative Commons Attribution (CC BY) license (http://creativecommons.org/licenses/by/4.0/).
Share and Cite
Gulicovski, J.; Nenadović, S.; Kljajević, L.; Mirković, M.; Nišavić, M.; Kragović, M.; Stojmenović, M. Geopolymer/CeO2 as Solid Electrolyte for IT-SOFC. Polymers 2020, 12, 248. https://doi.org/10.3390/polym12010248
Gulicovski J, Nenadović S, Kljajević L, Mirković M, Nišavić M, Kragović M, Stojmenović M. Geopolymer/CeO2 as Solid Electrolyte for IT-SOFC. Polymers. 2020; 12(1):248. https://doi.org/10.3390/polym12010248
Chicago/Turabian StyleGulicovski, Jelena, Snežana Nenadović, Ljiljana Kljajević, Miljana Mirković, Marija Nišavić, Milan Kragović, and Marija Stojmenović. 2020. "Geopolymer/CeO2 as Solid Electrolyte for IT-SOFC" Polymers 12, no. 1: 248. https://doi.org/10.3390/polym12010248
APA StyleGulicovski, J., Nenadović, S., Kljajević, L., Mirković, M., Nišavić, M., Kragović, M., & Stojmenović, M. (2020). Geopolymer/CeO2 as Solid Electrolyte for IT-SOFC. Polymers, 12(1), 248. https://doi.org/10.3390/polym12010248