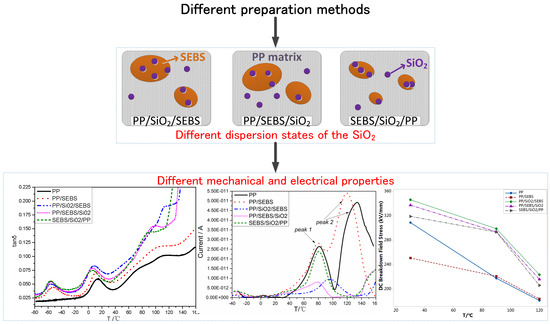
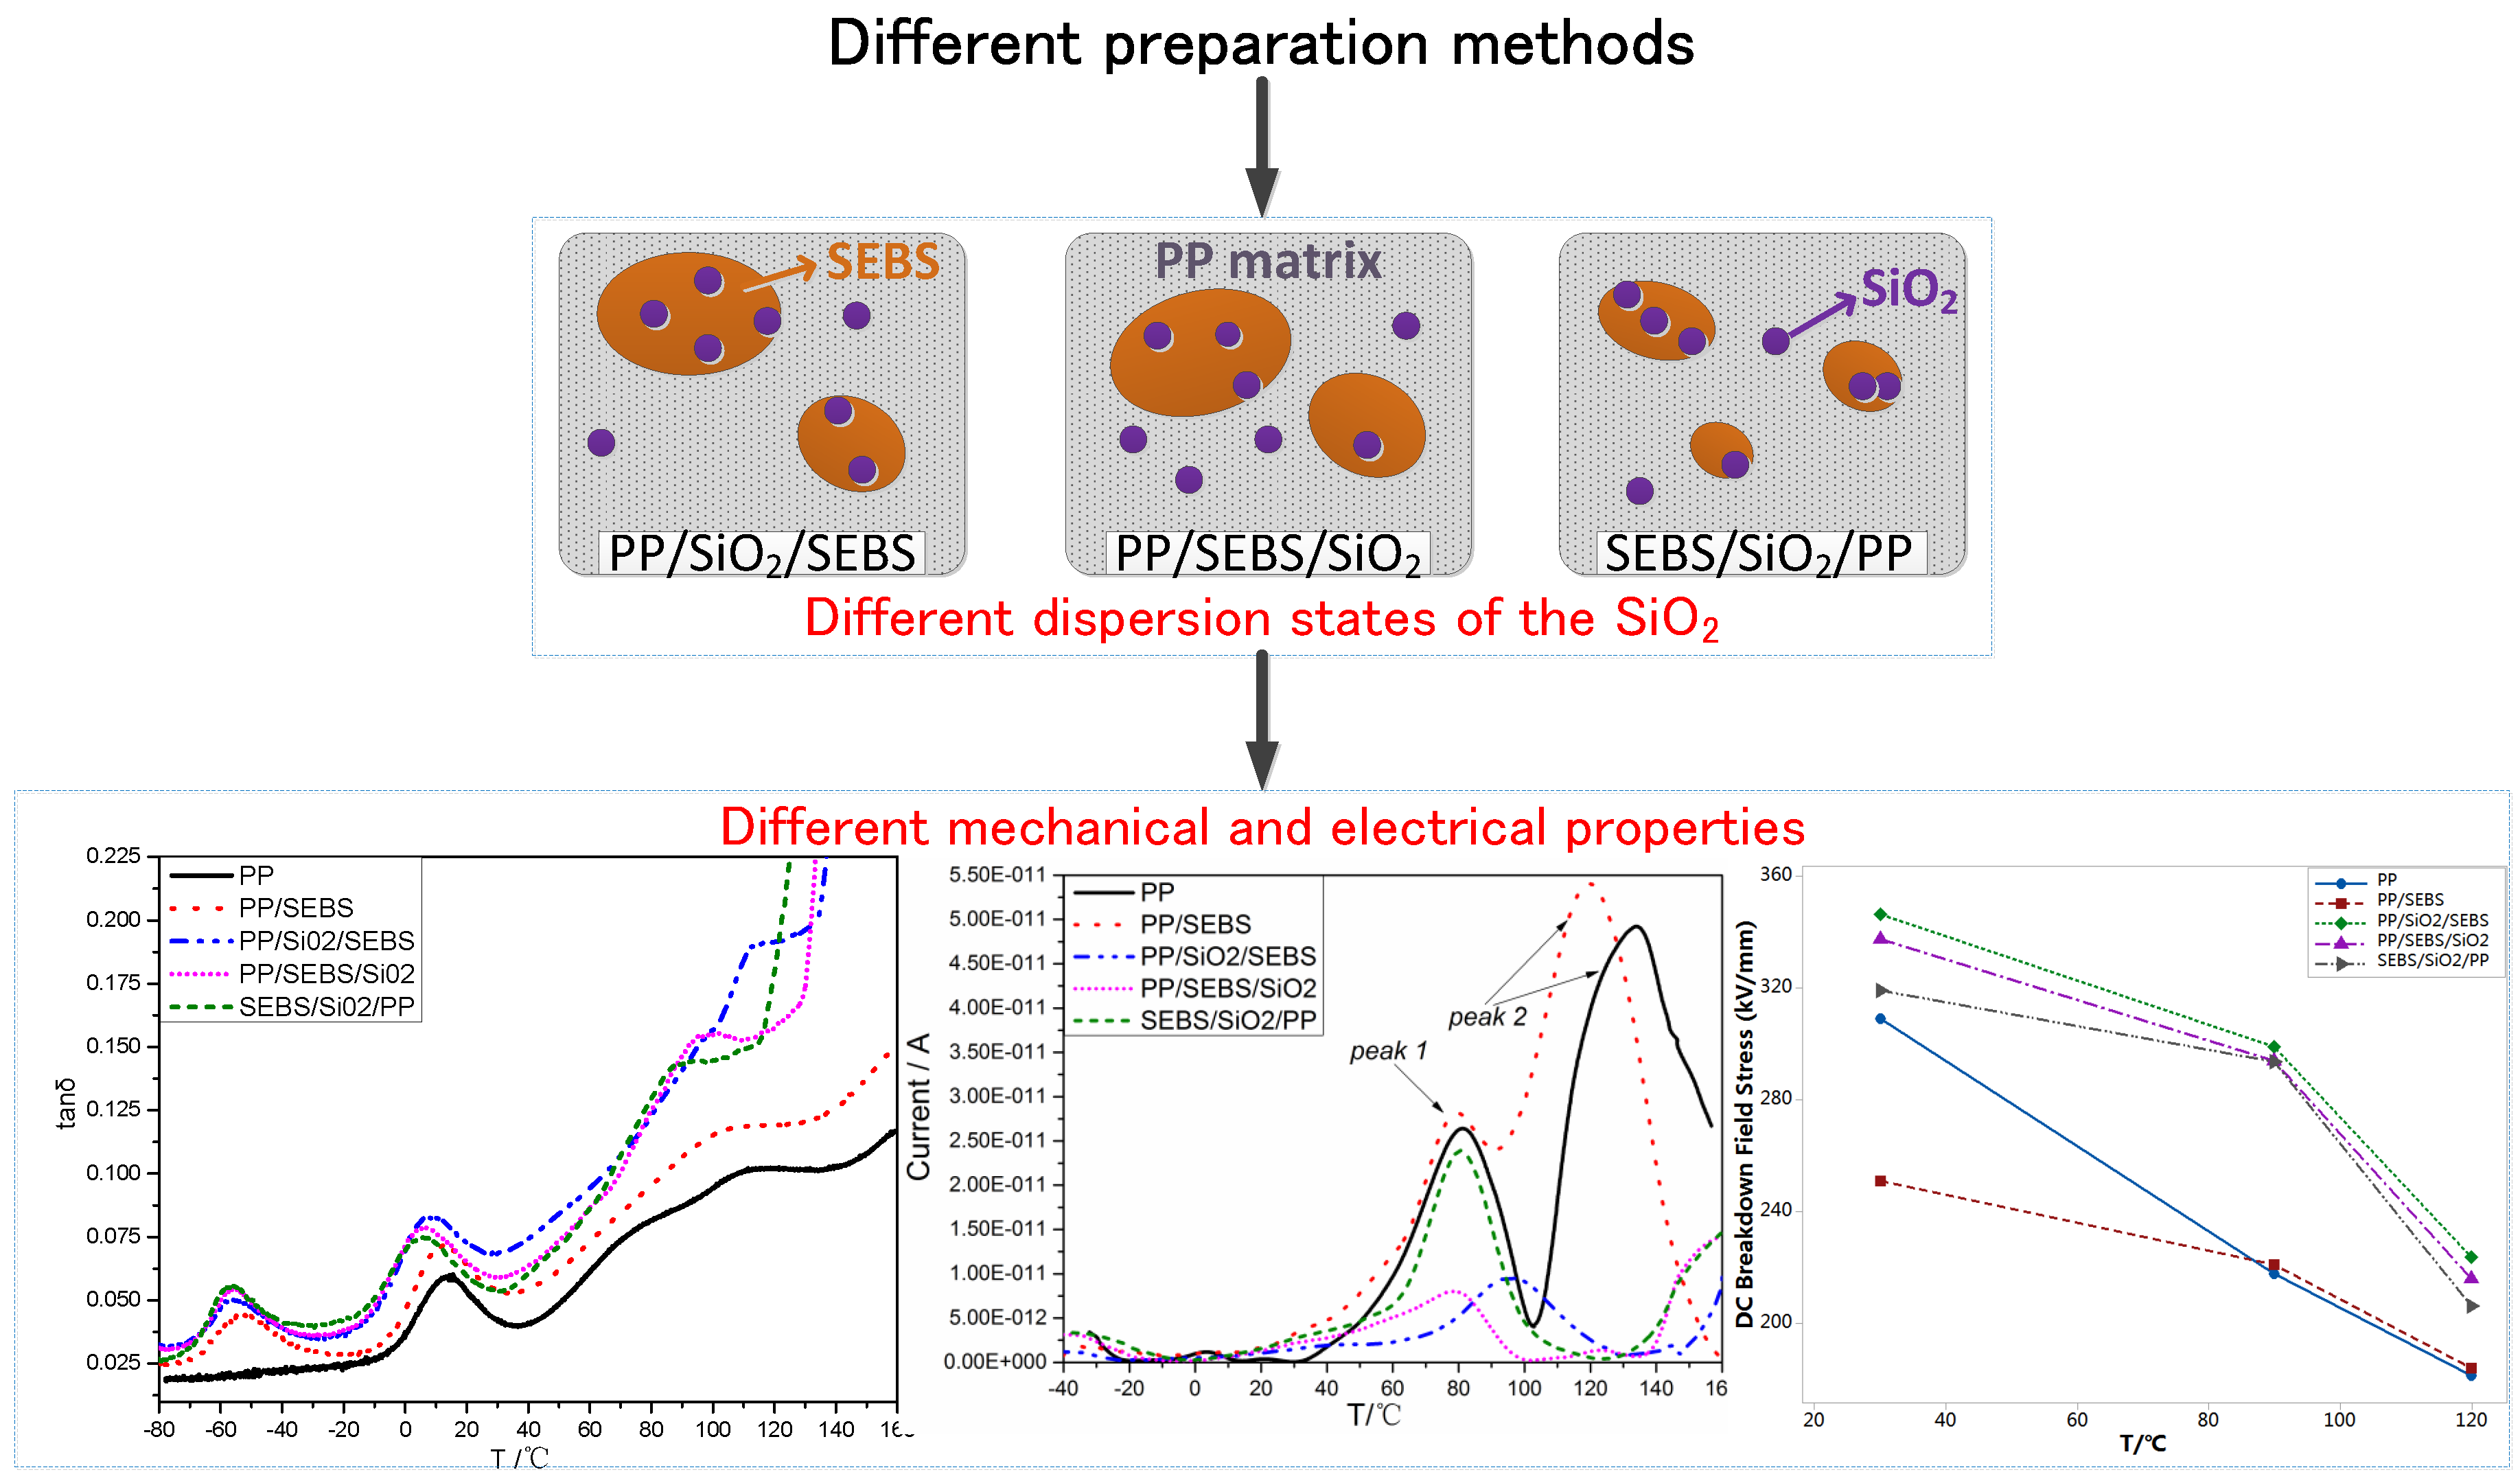
Preparation Methods of Polypropylene/Nano-Silica/Styrene-Ethylene-Butylene-Styrene Composite and Its Effect on Electrical Properties


Abstract
:
1. Introduction
2. Materials and Methods
2.1. Materials
2.2. Sample Preparation for Scanning Electron Microscope (SEM) Observations
2.3. Thermal Properties
2.4. The Dynamic Mechanical Properties
2.5. Thermally Stimulated Depolarization Current
2.6. DC Breakdown Test
2.7. Space Charge Measurement
3. Results
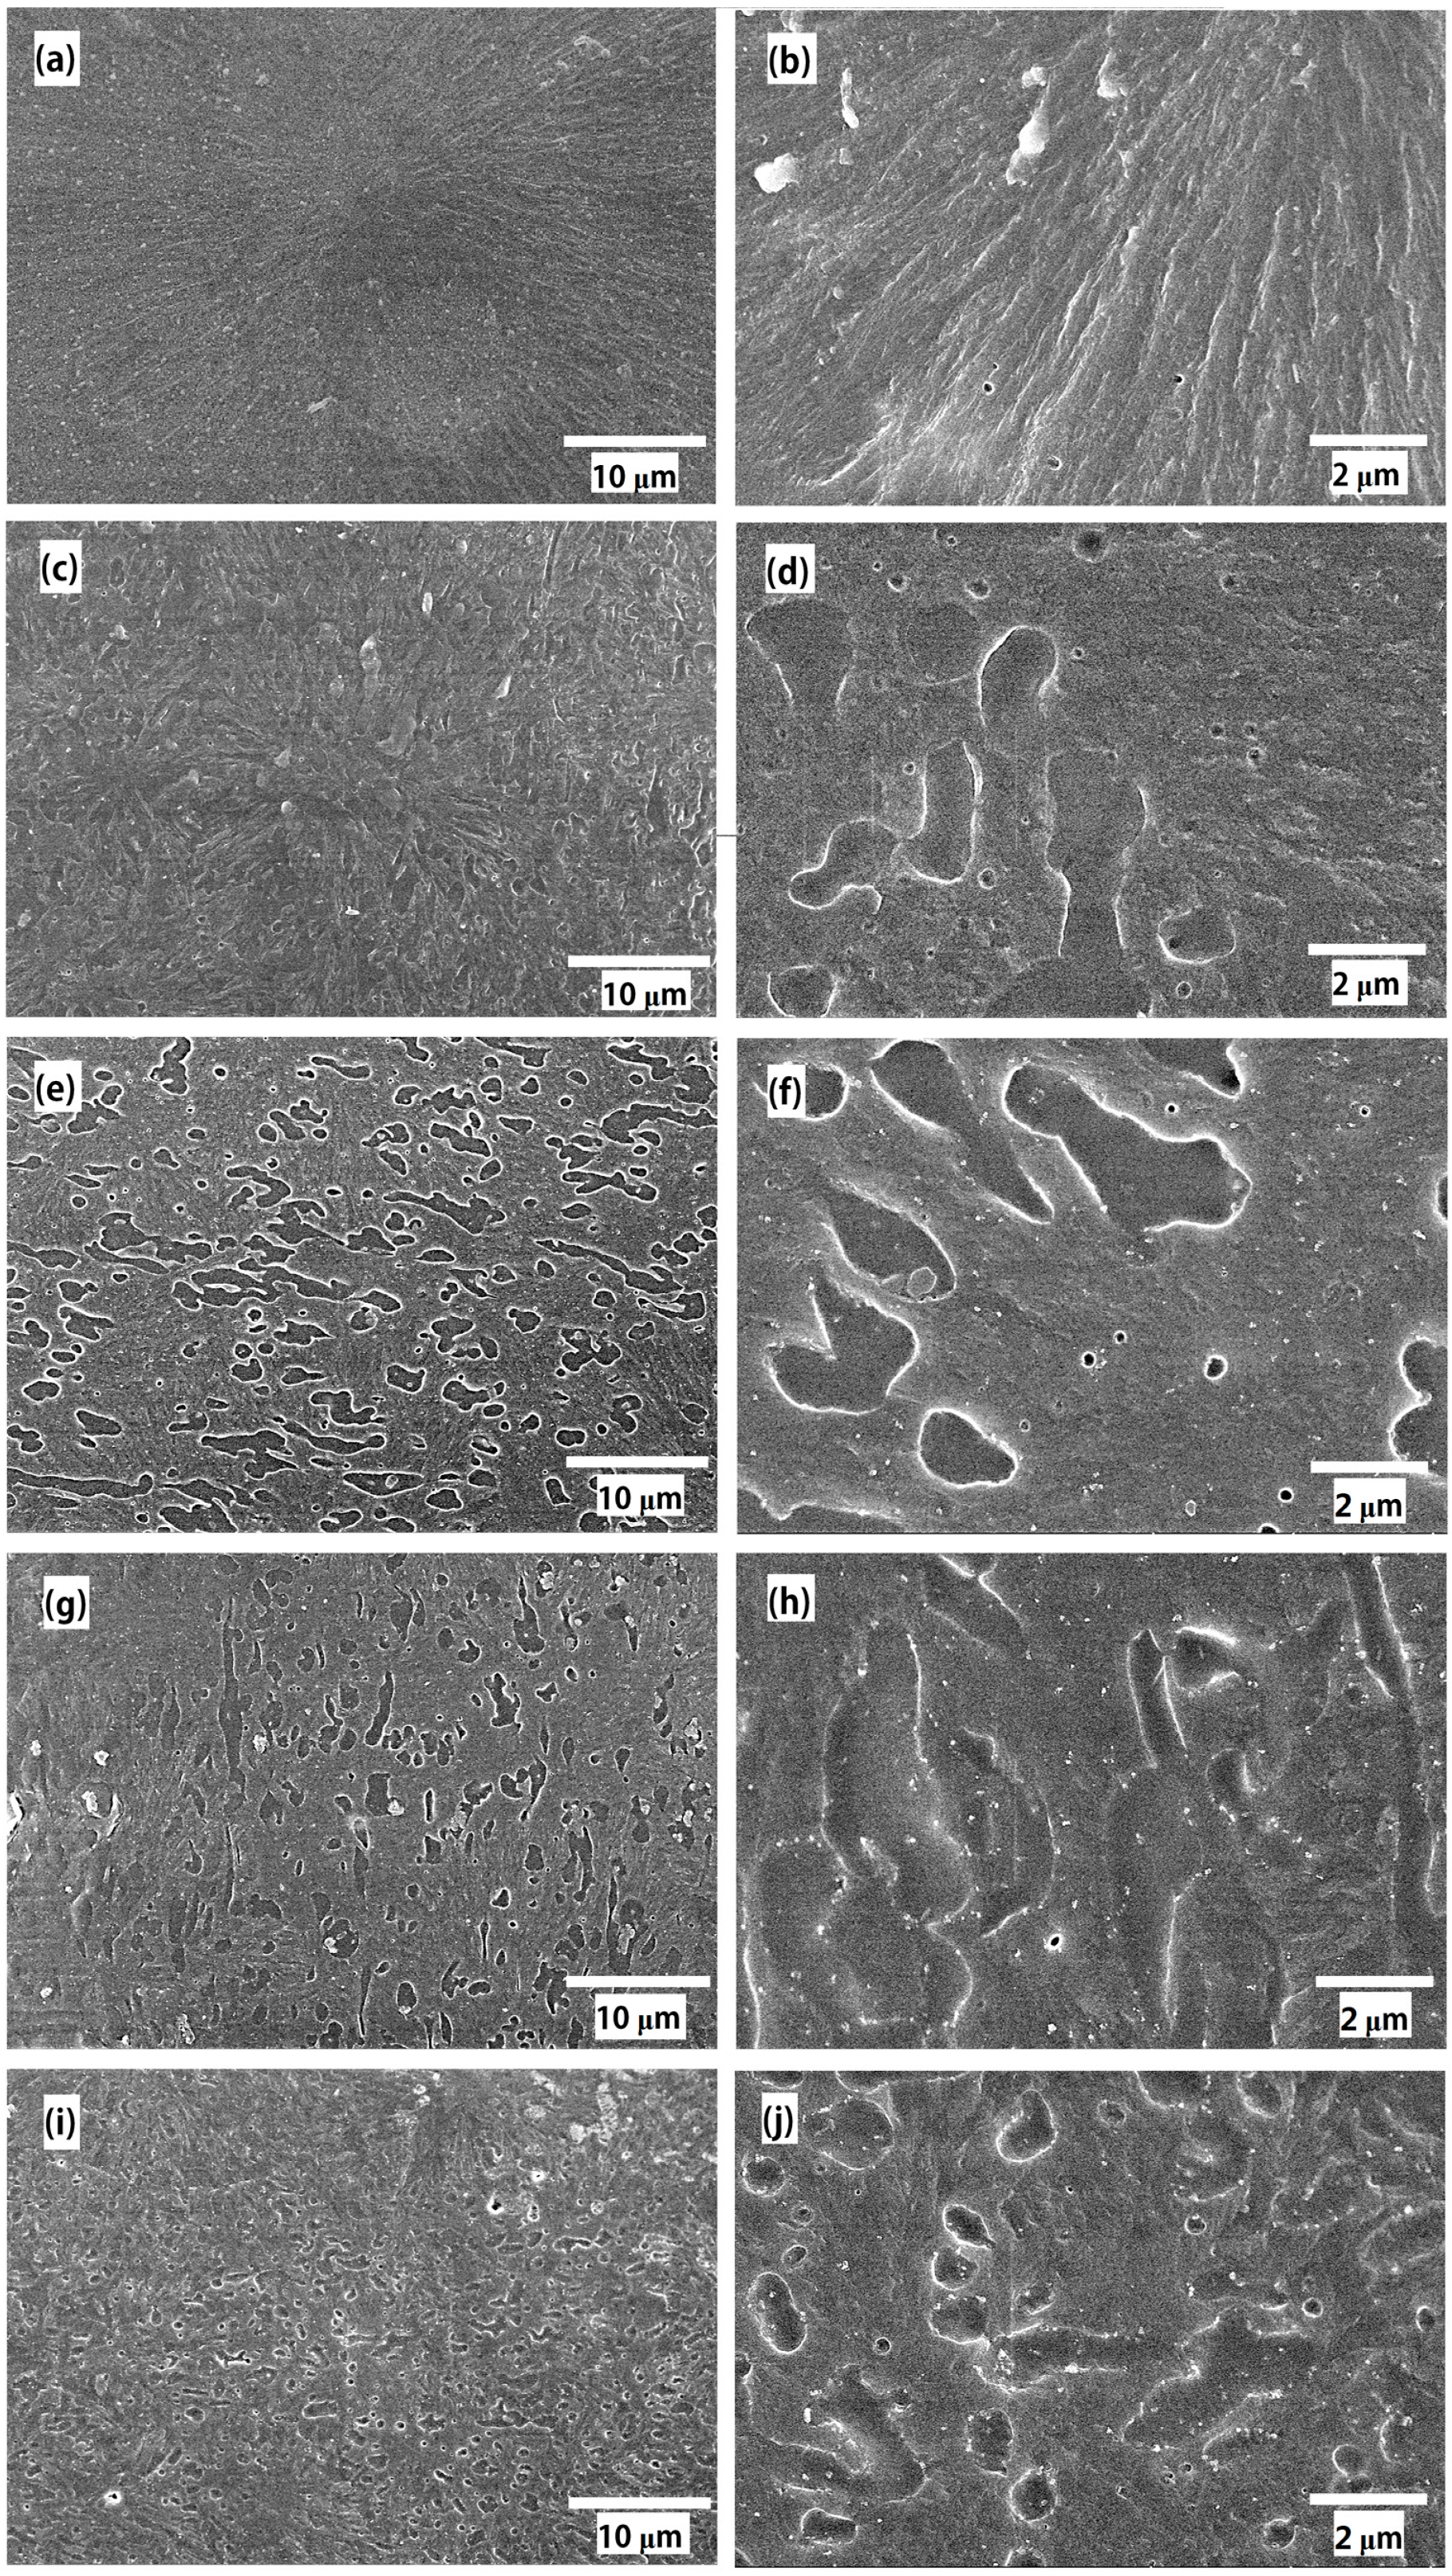
3.1. Morphology
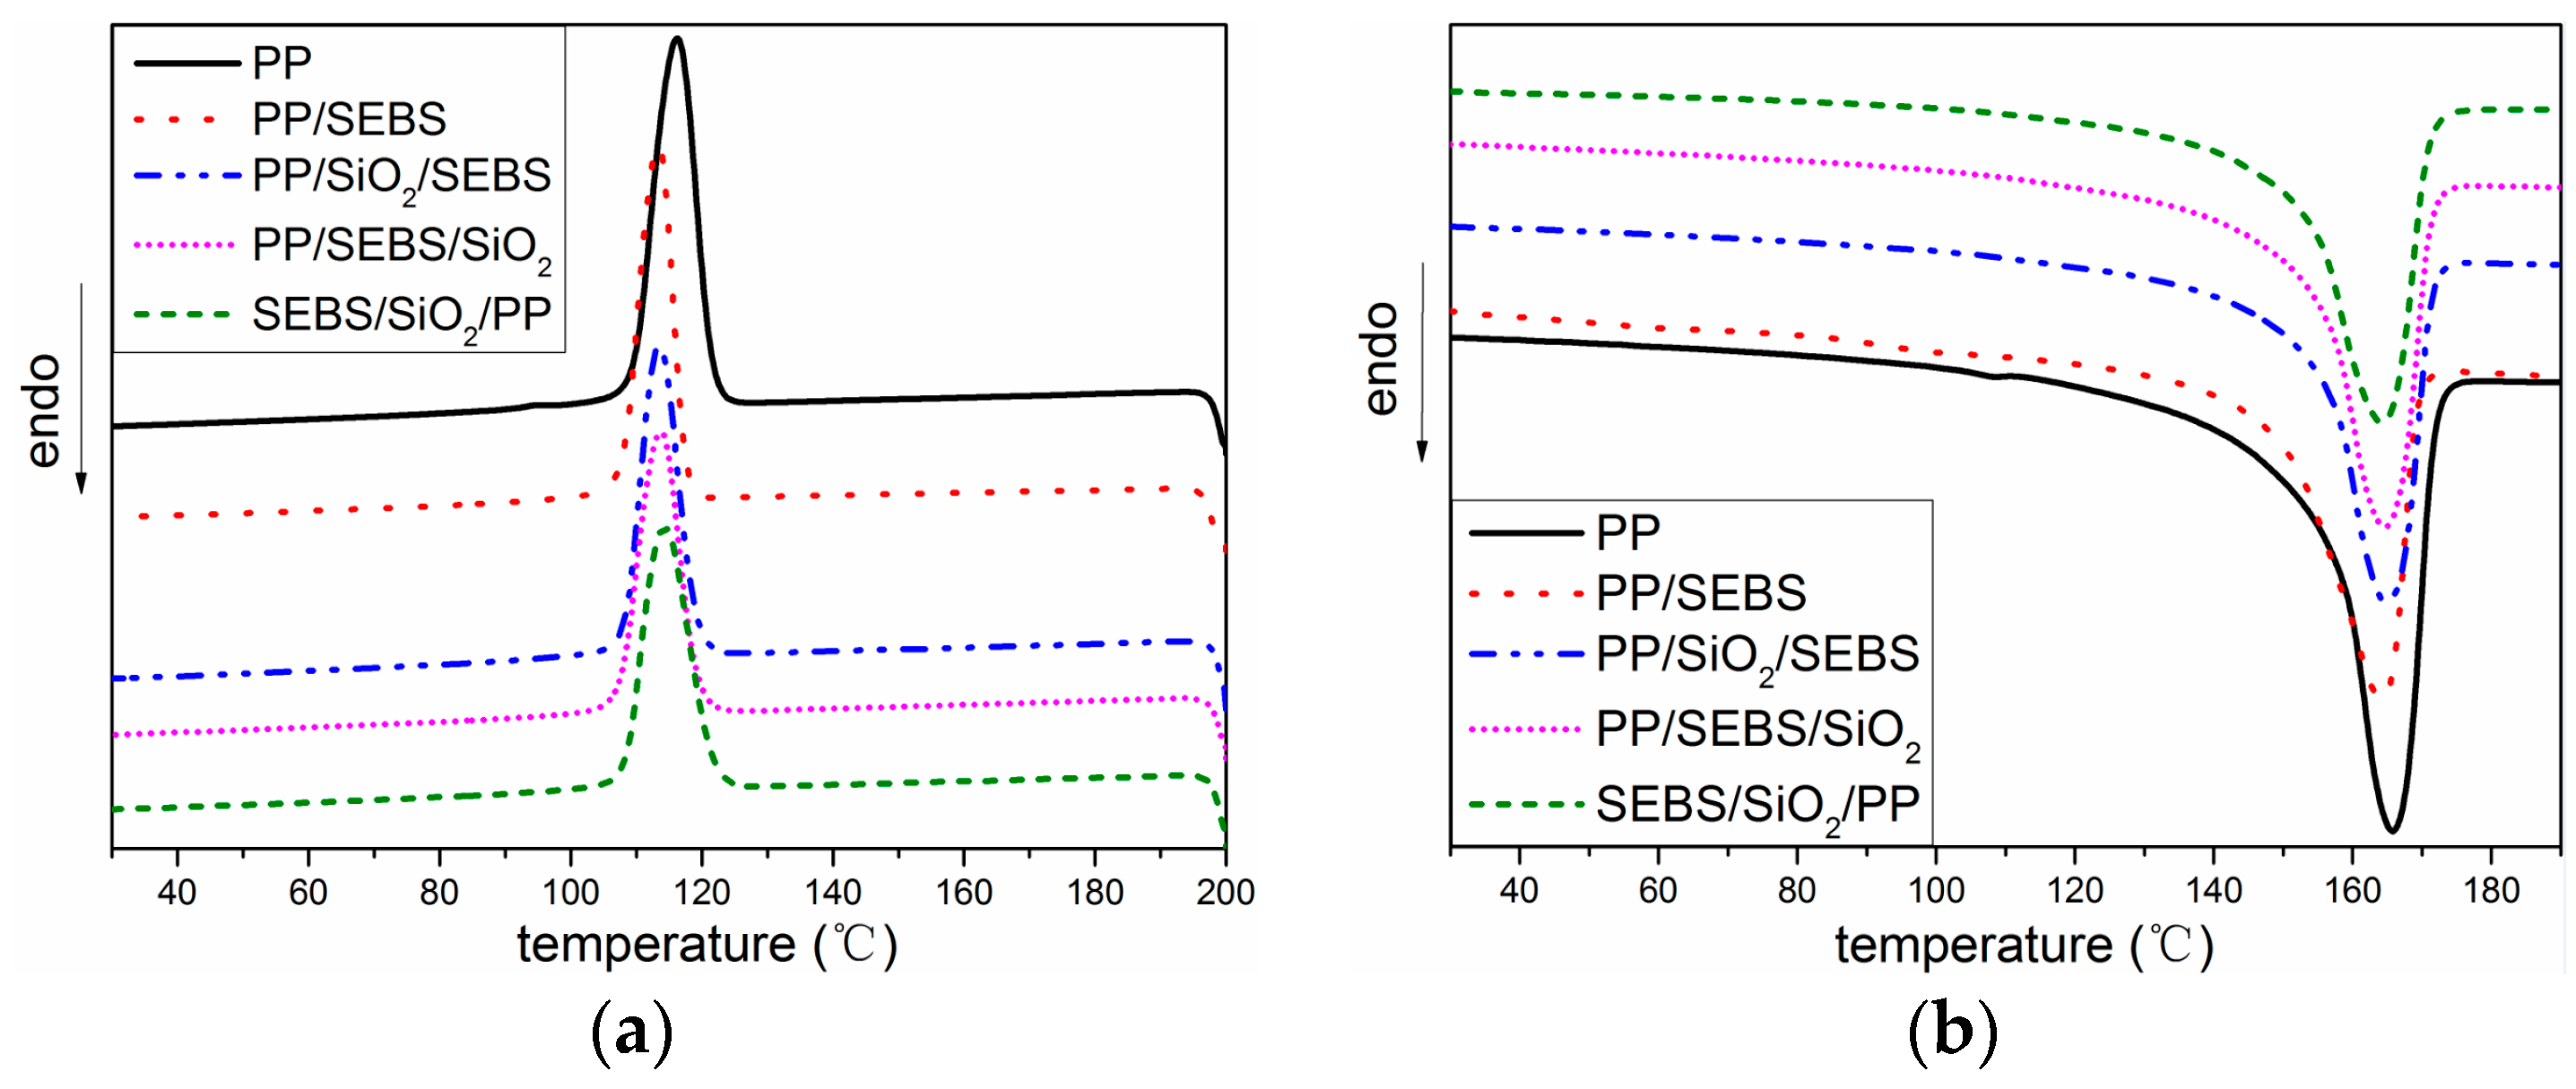
3.2. Thermal Properties
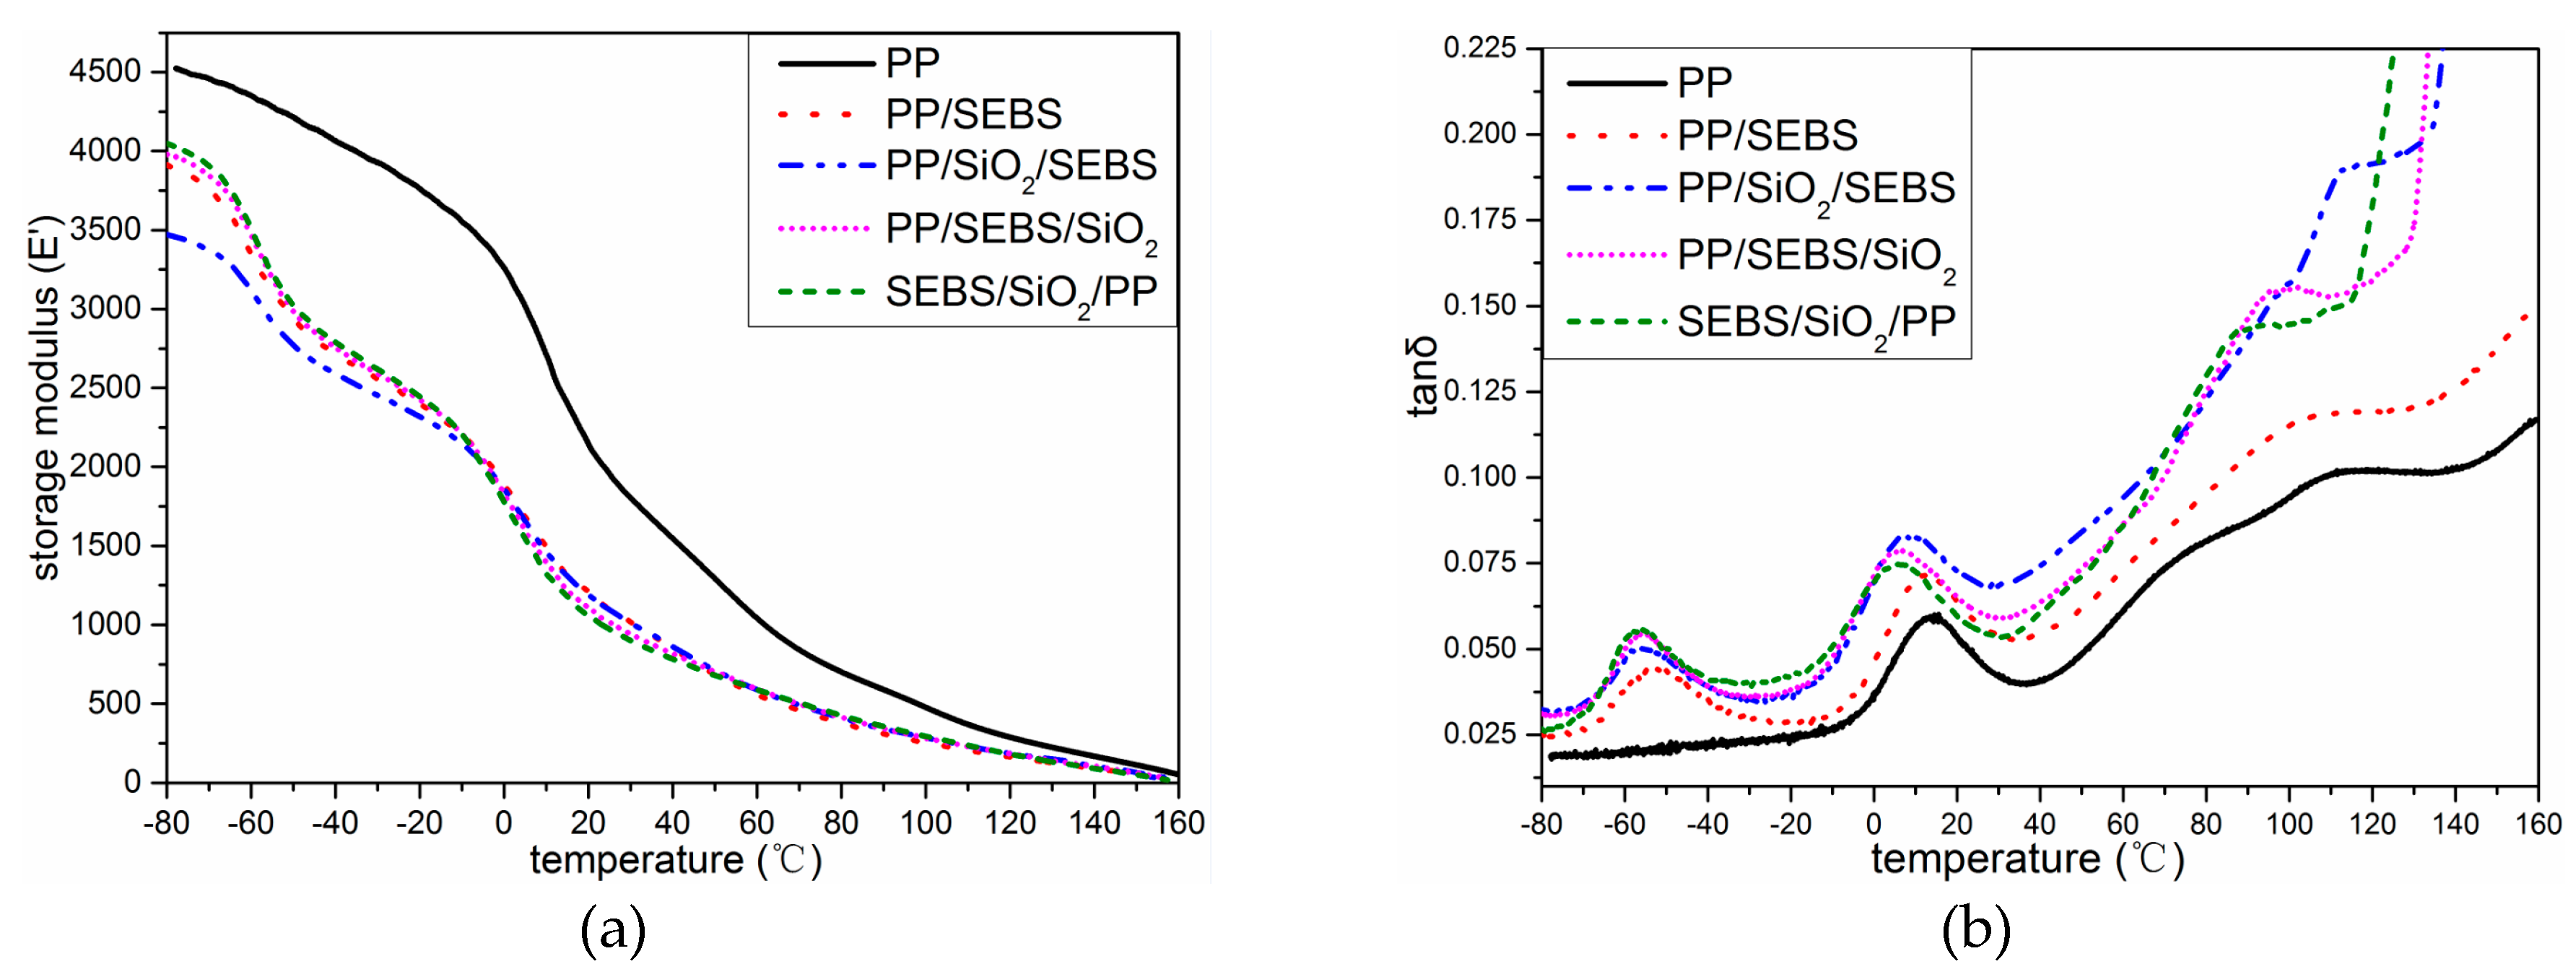
3.3. The Dynamic Mechanical Properties
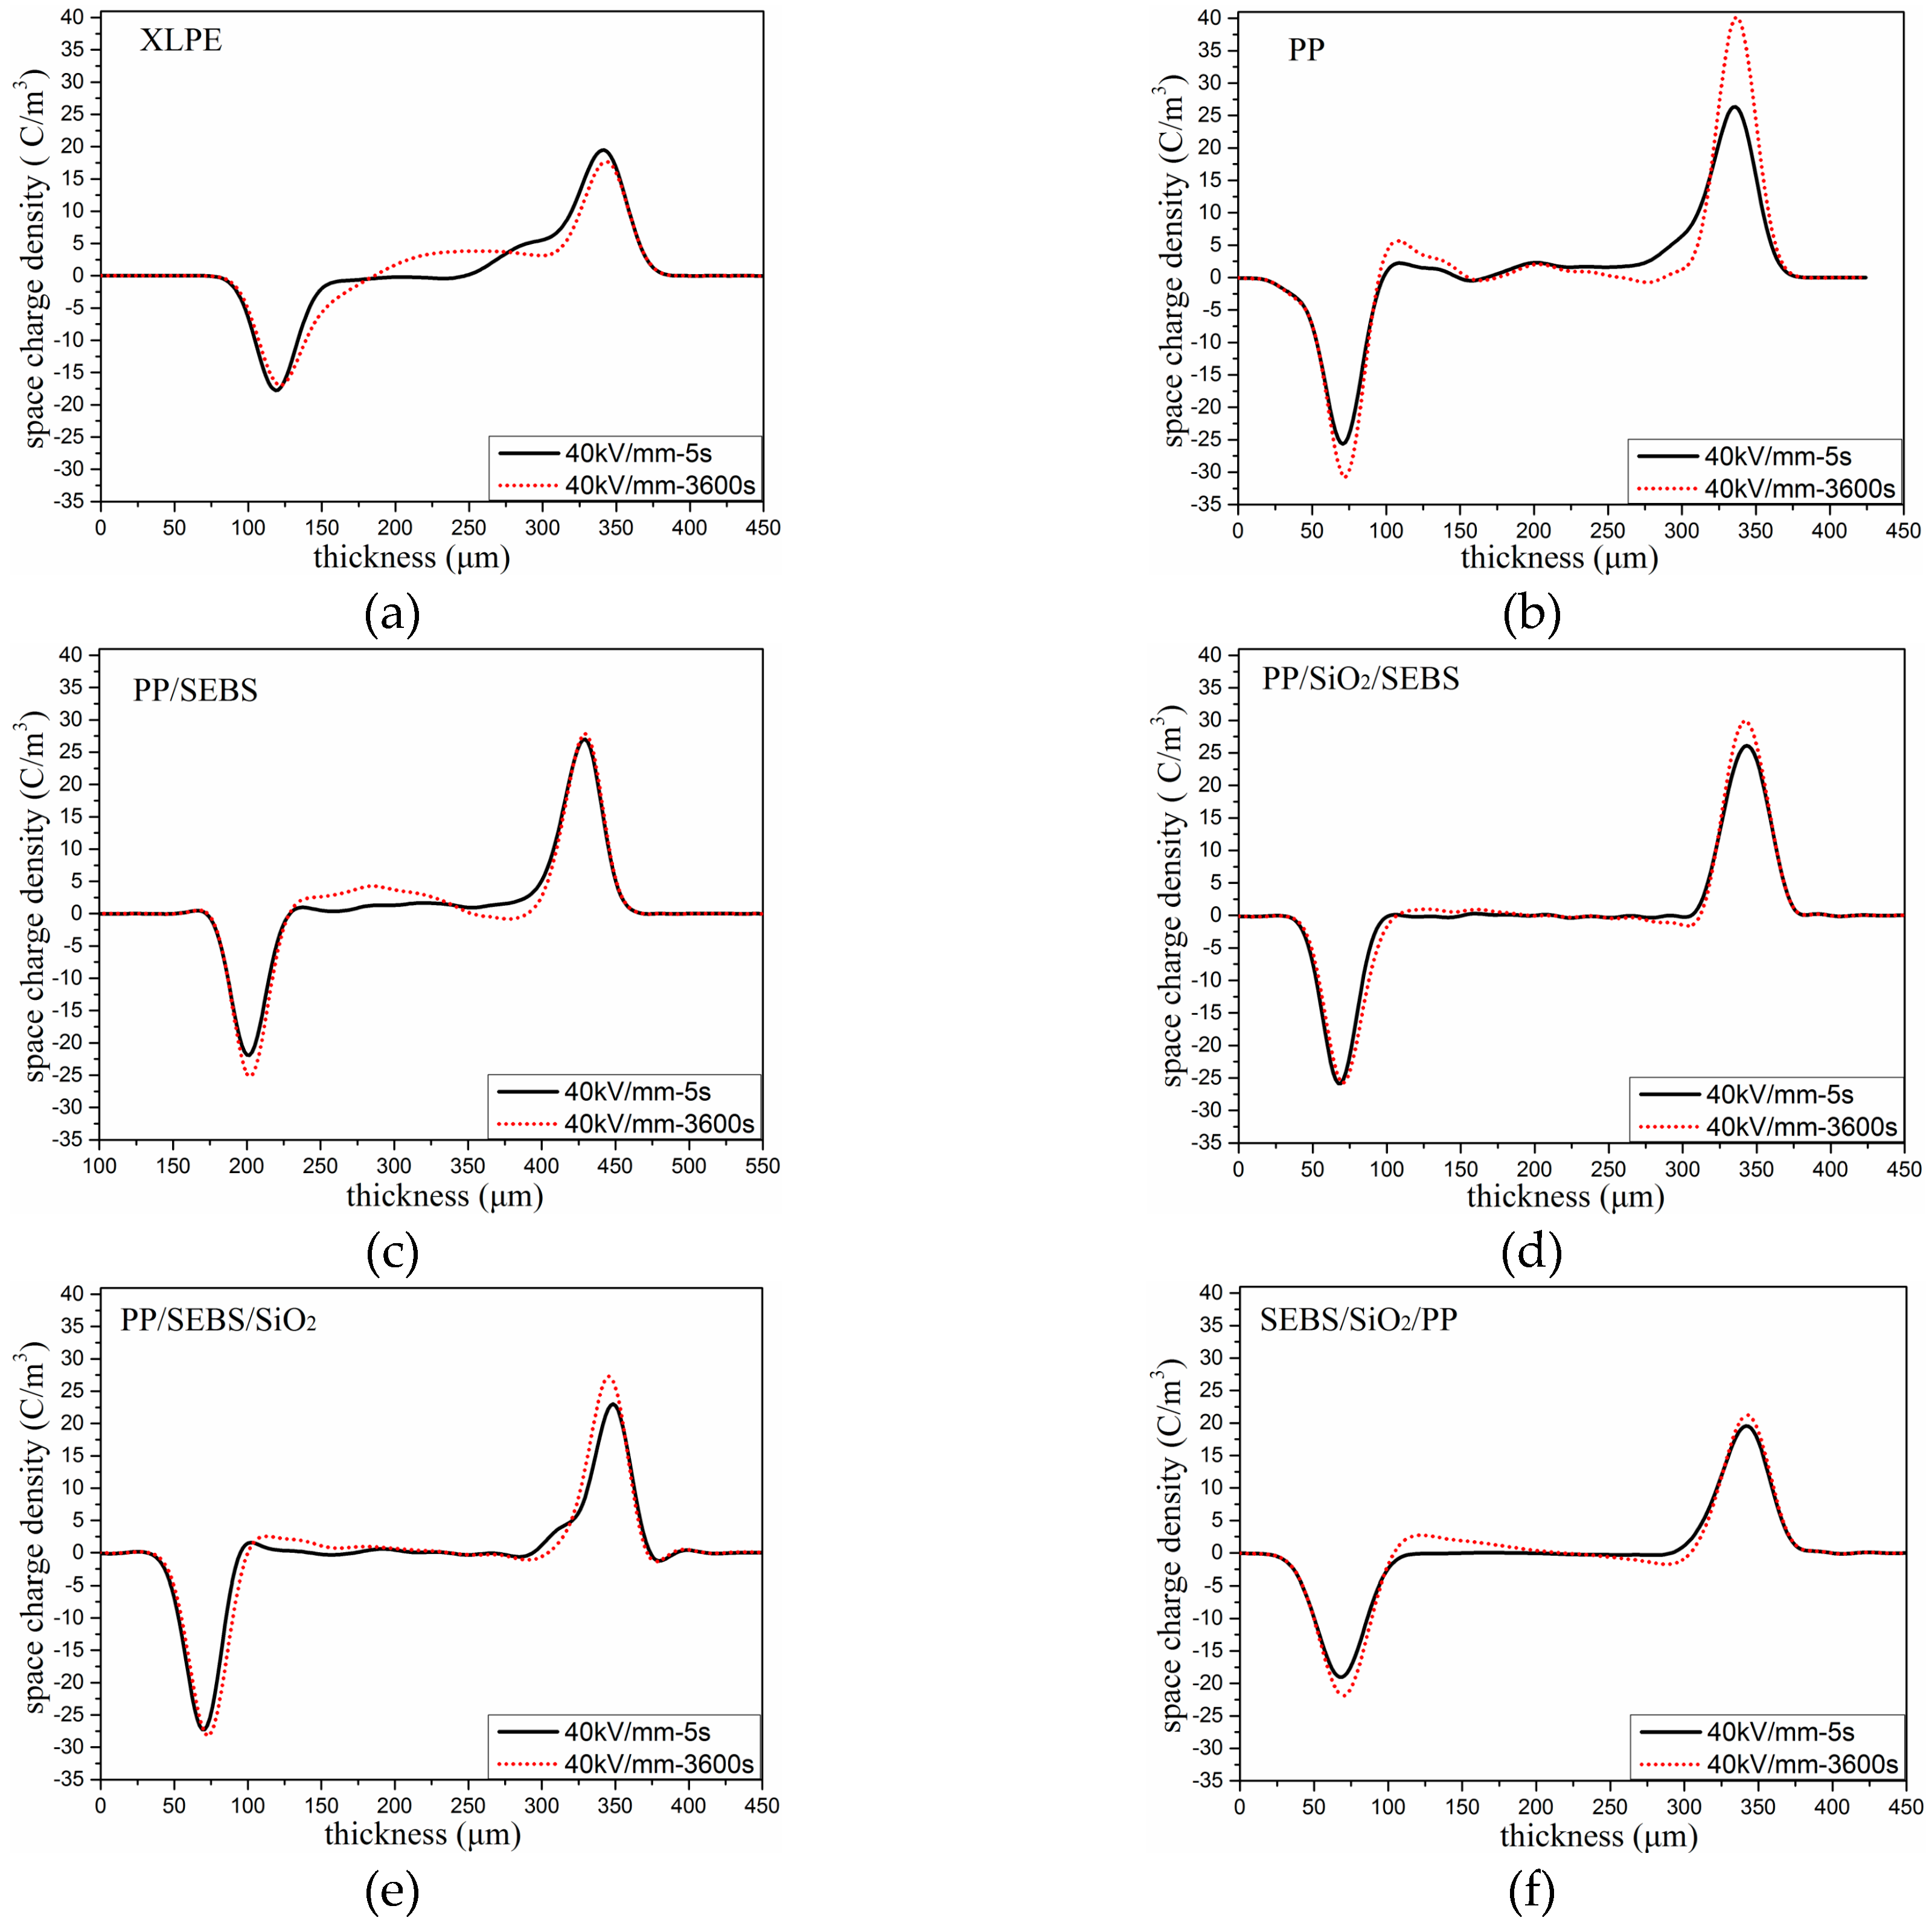
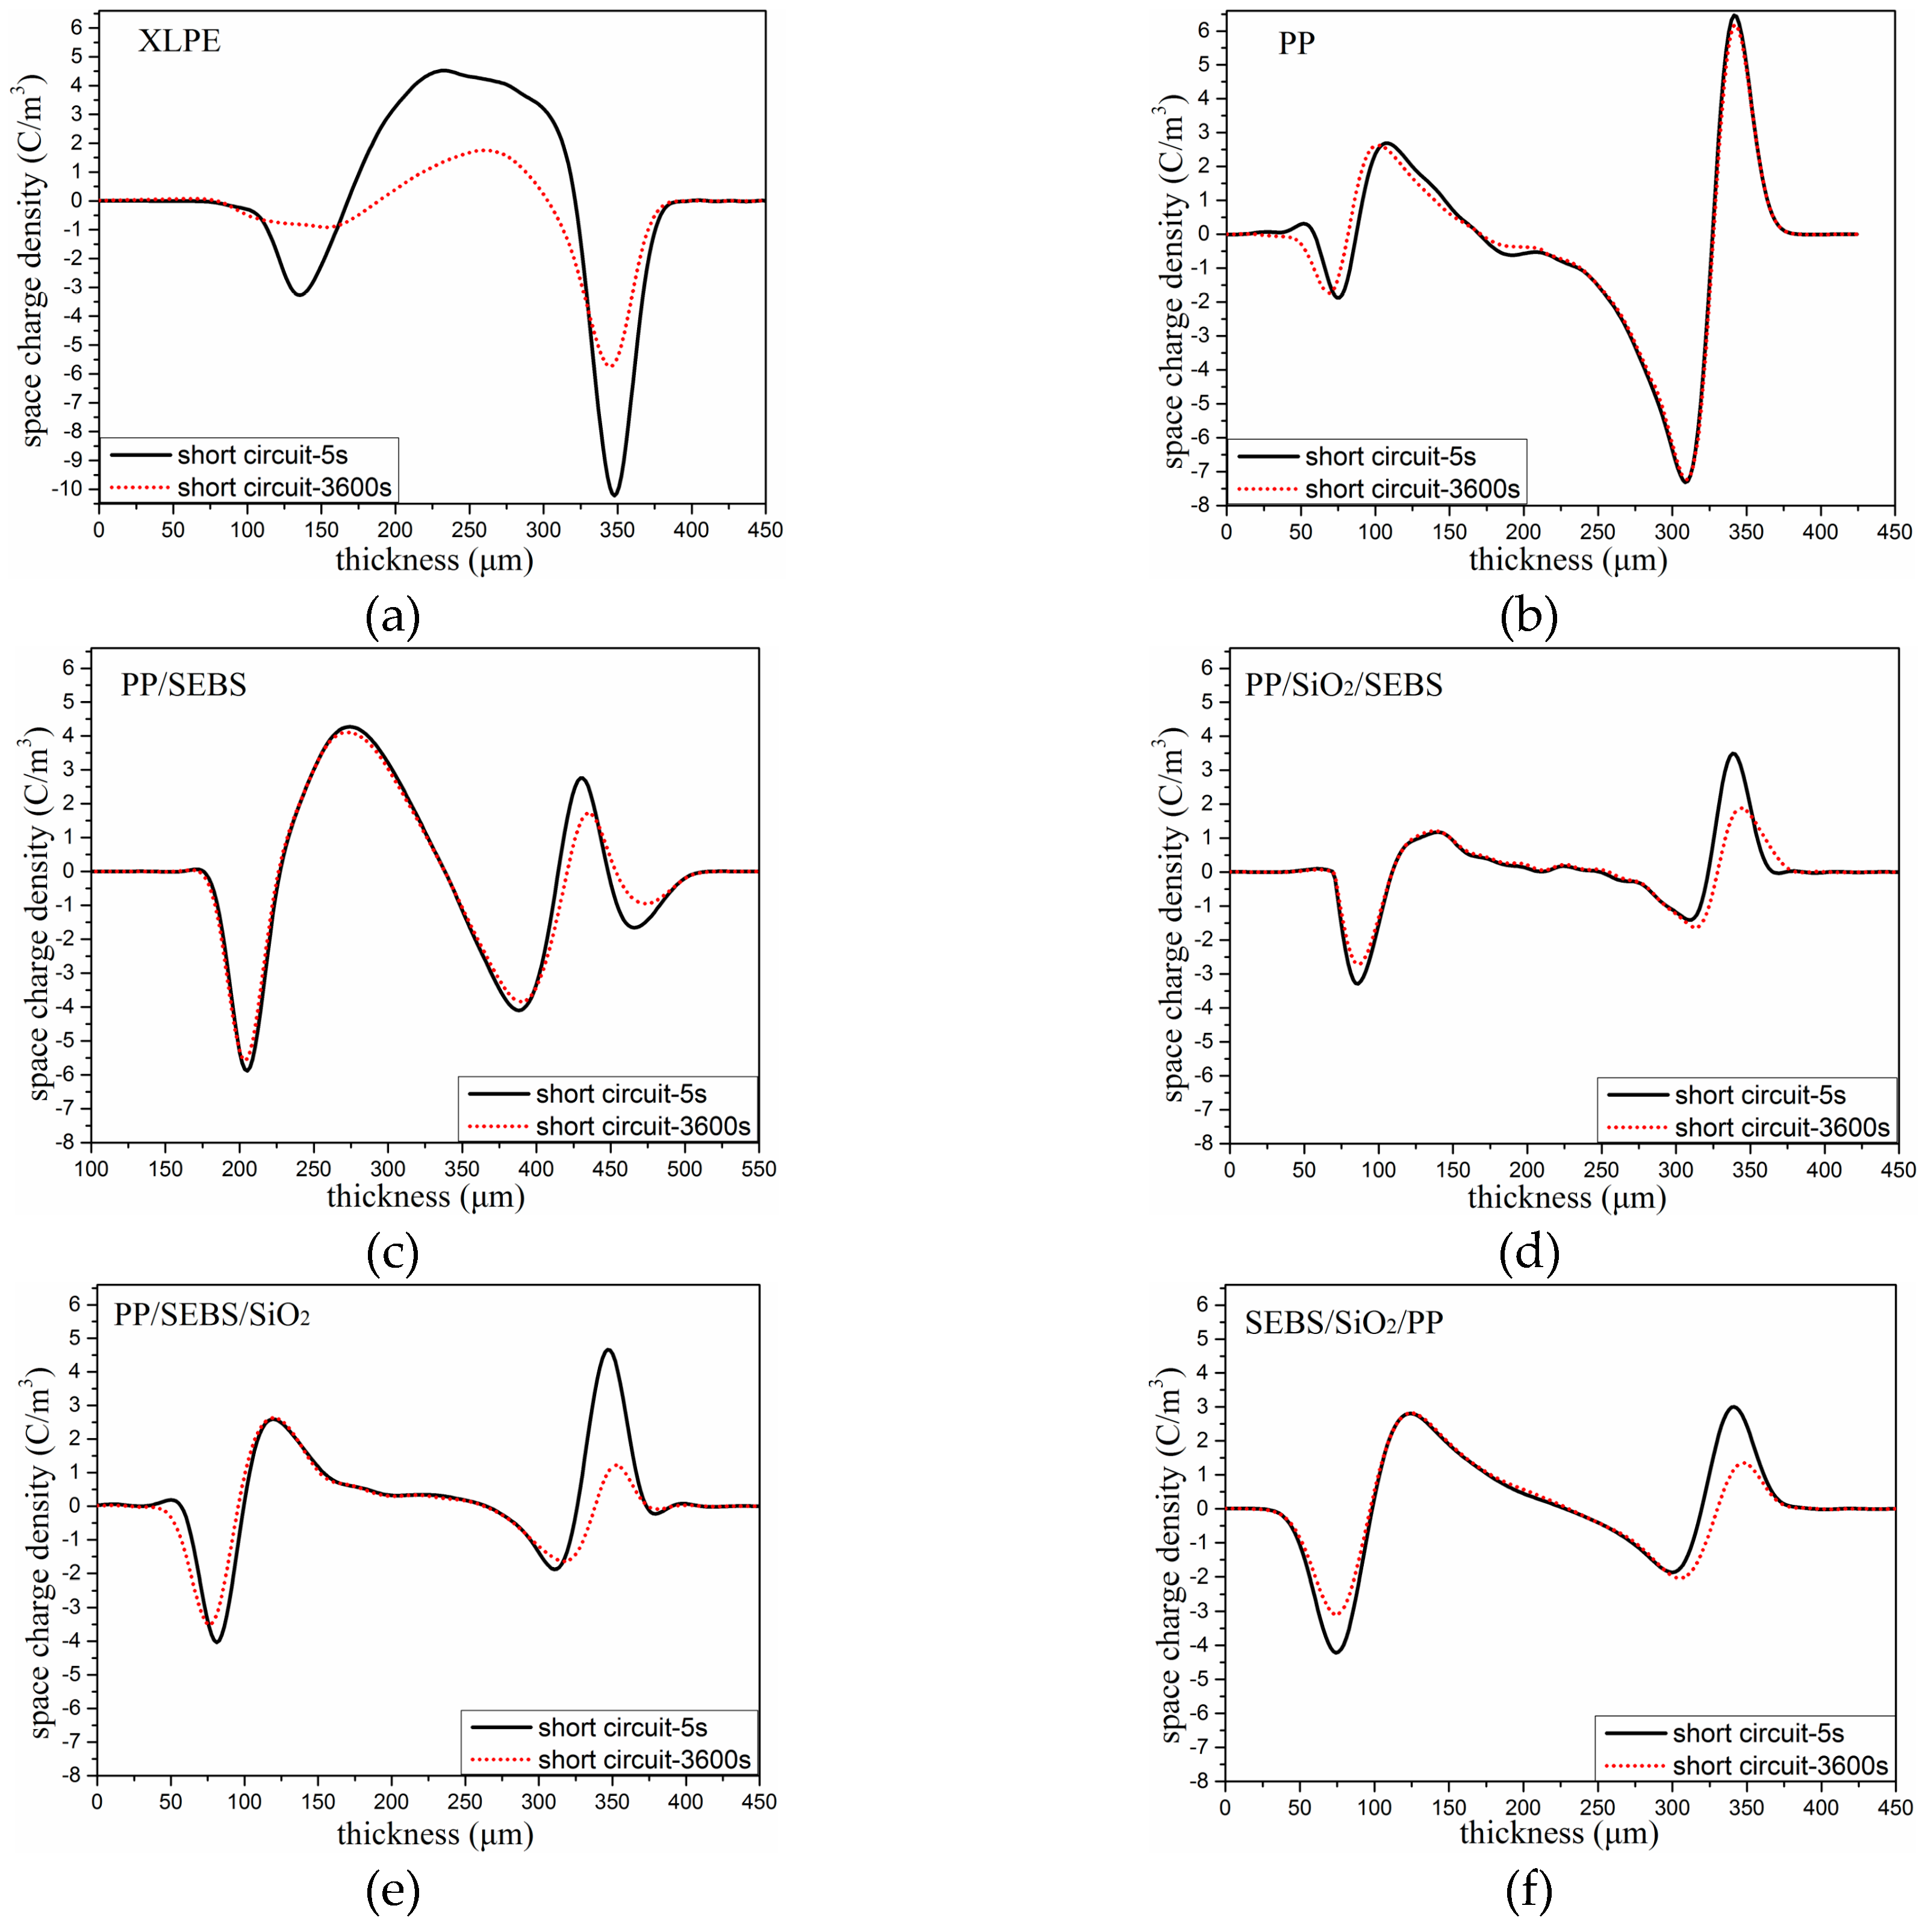
3.4. Space Charge Distribution
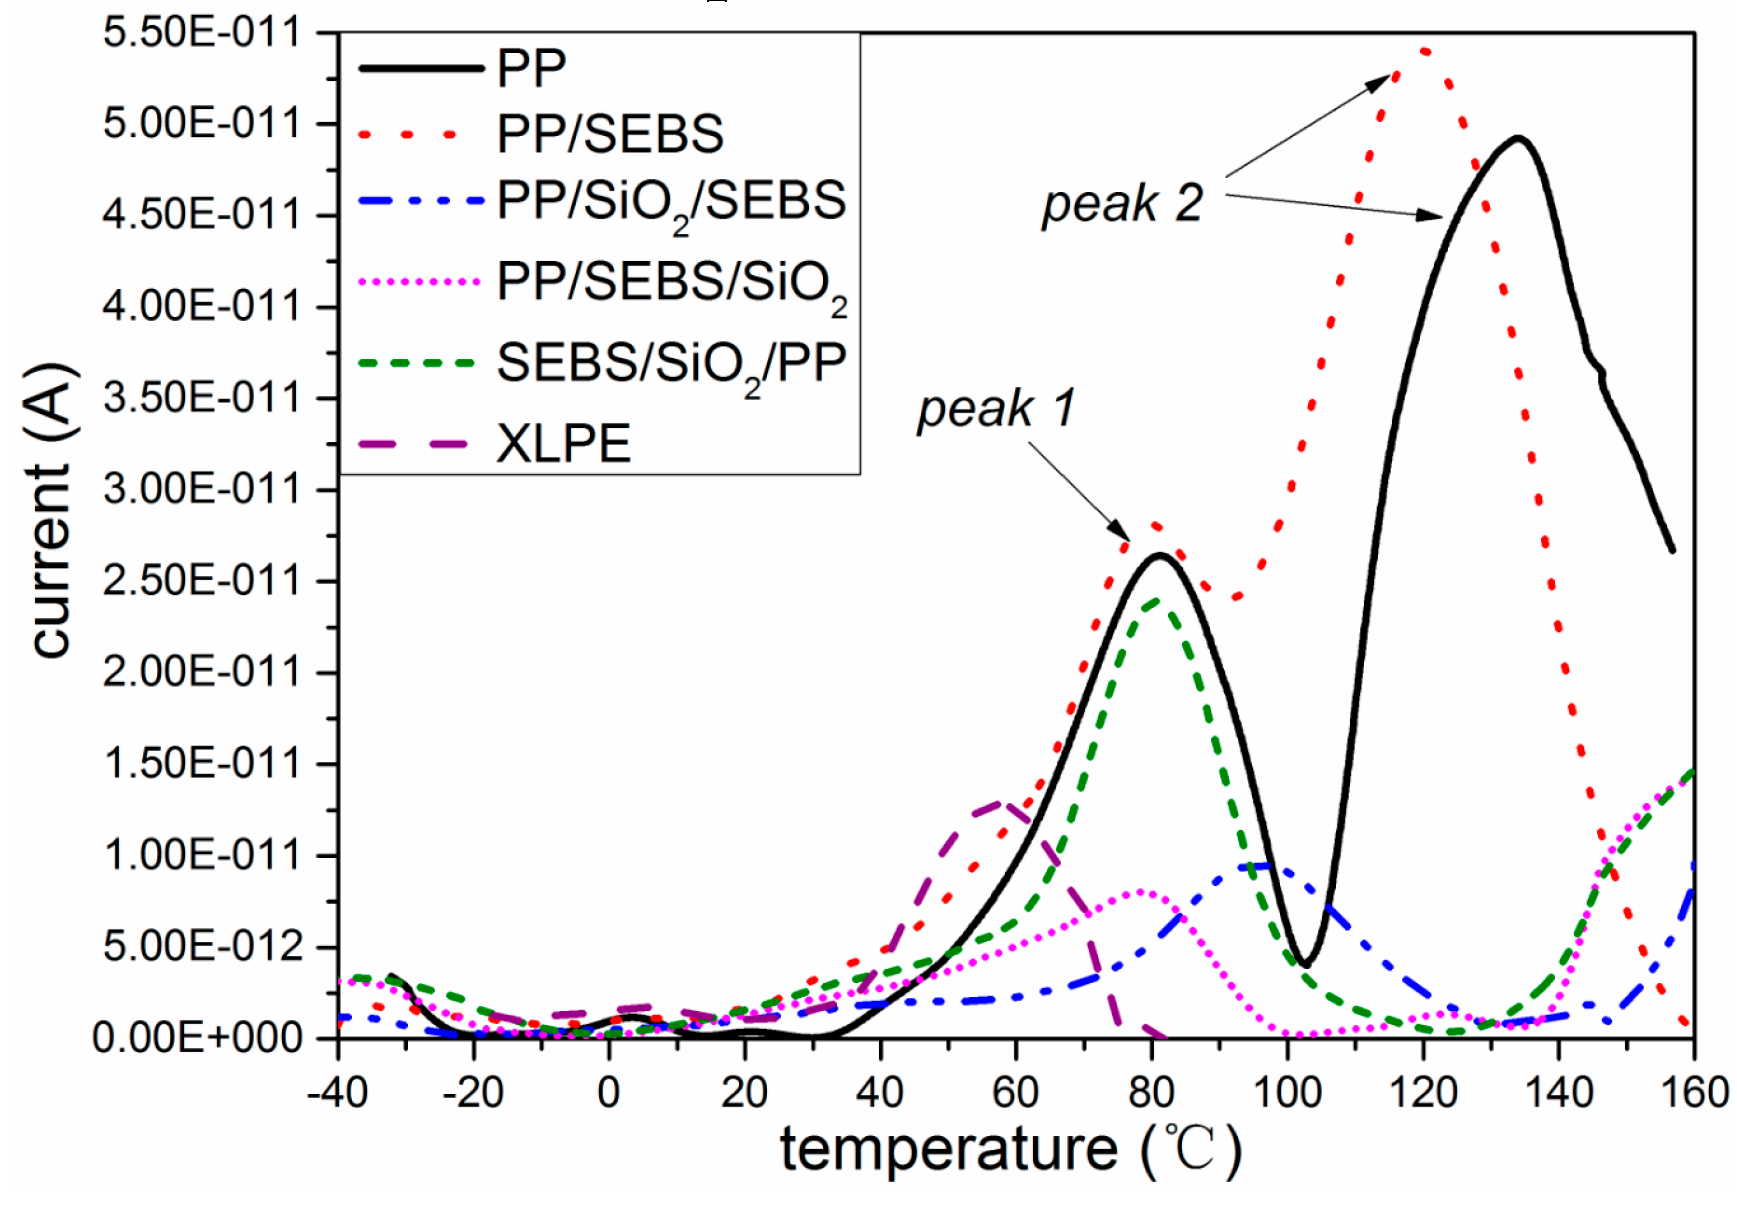
3.5. Thermally Stimulated Depolarization Current
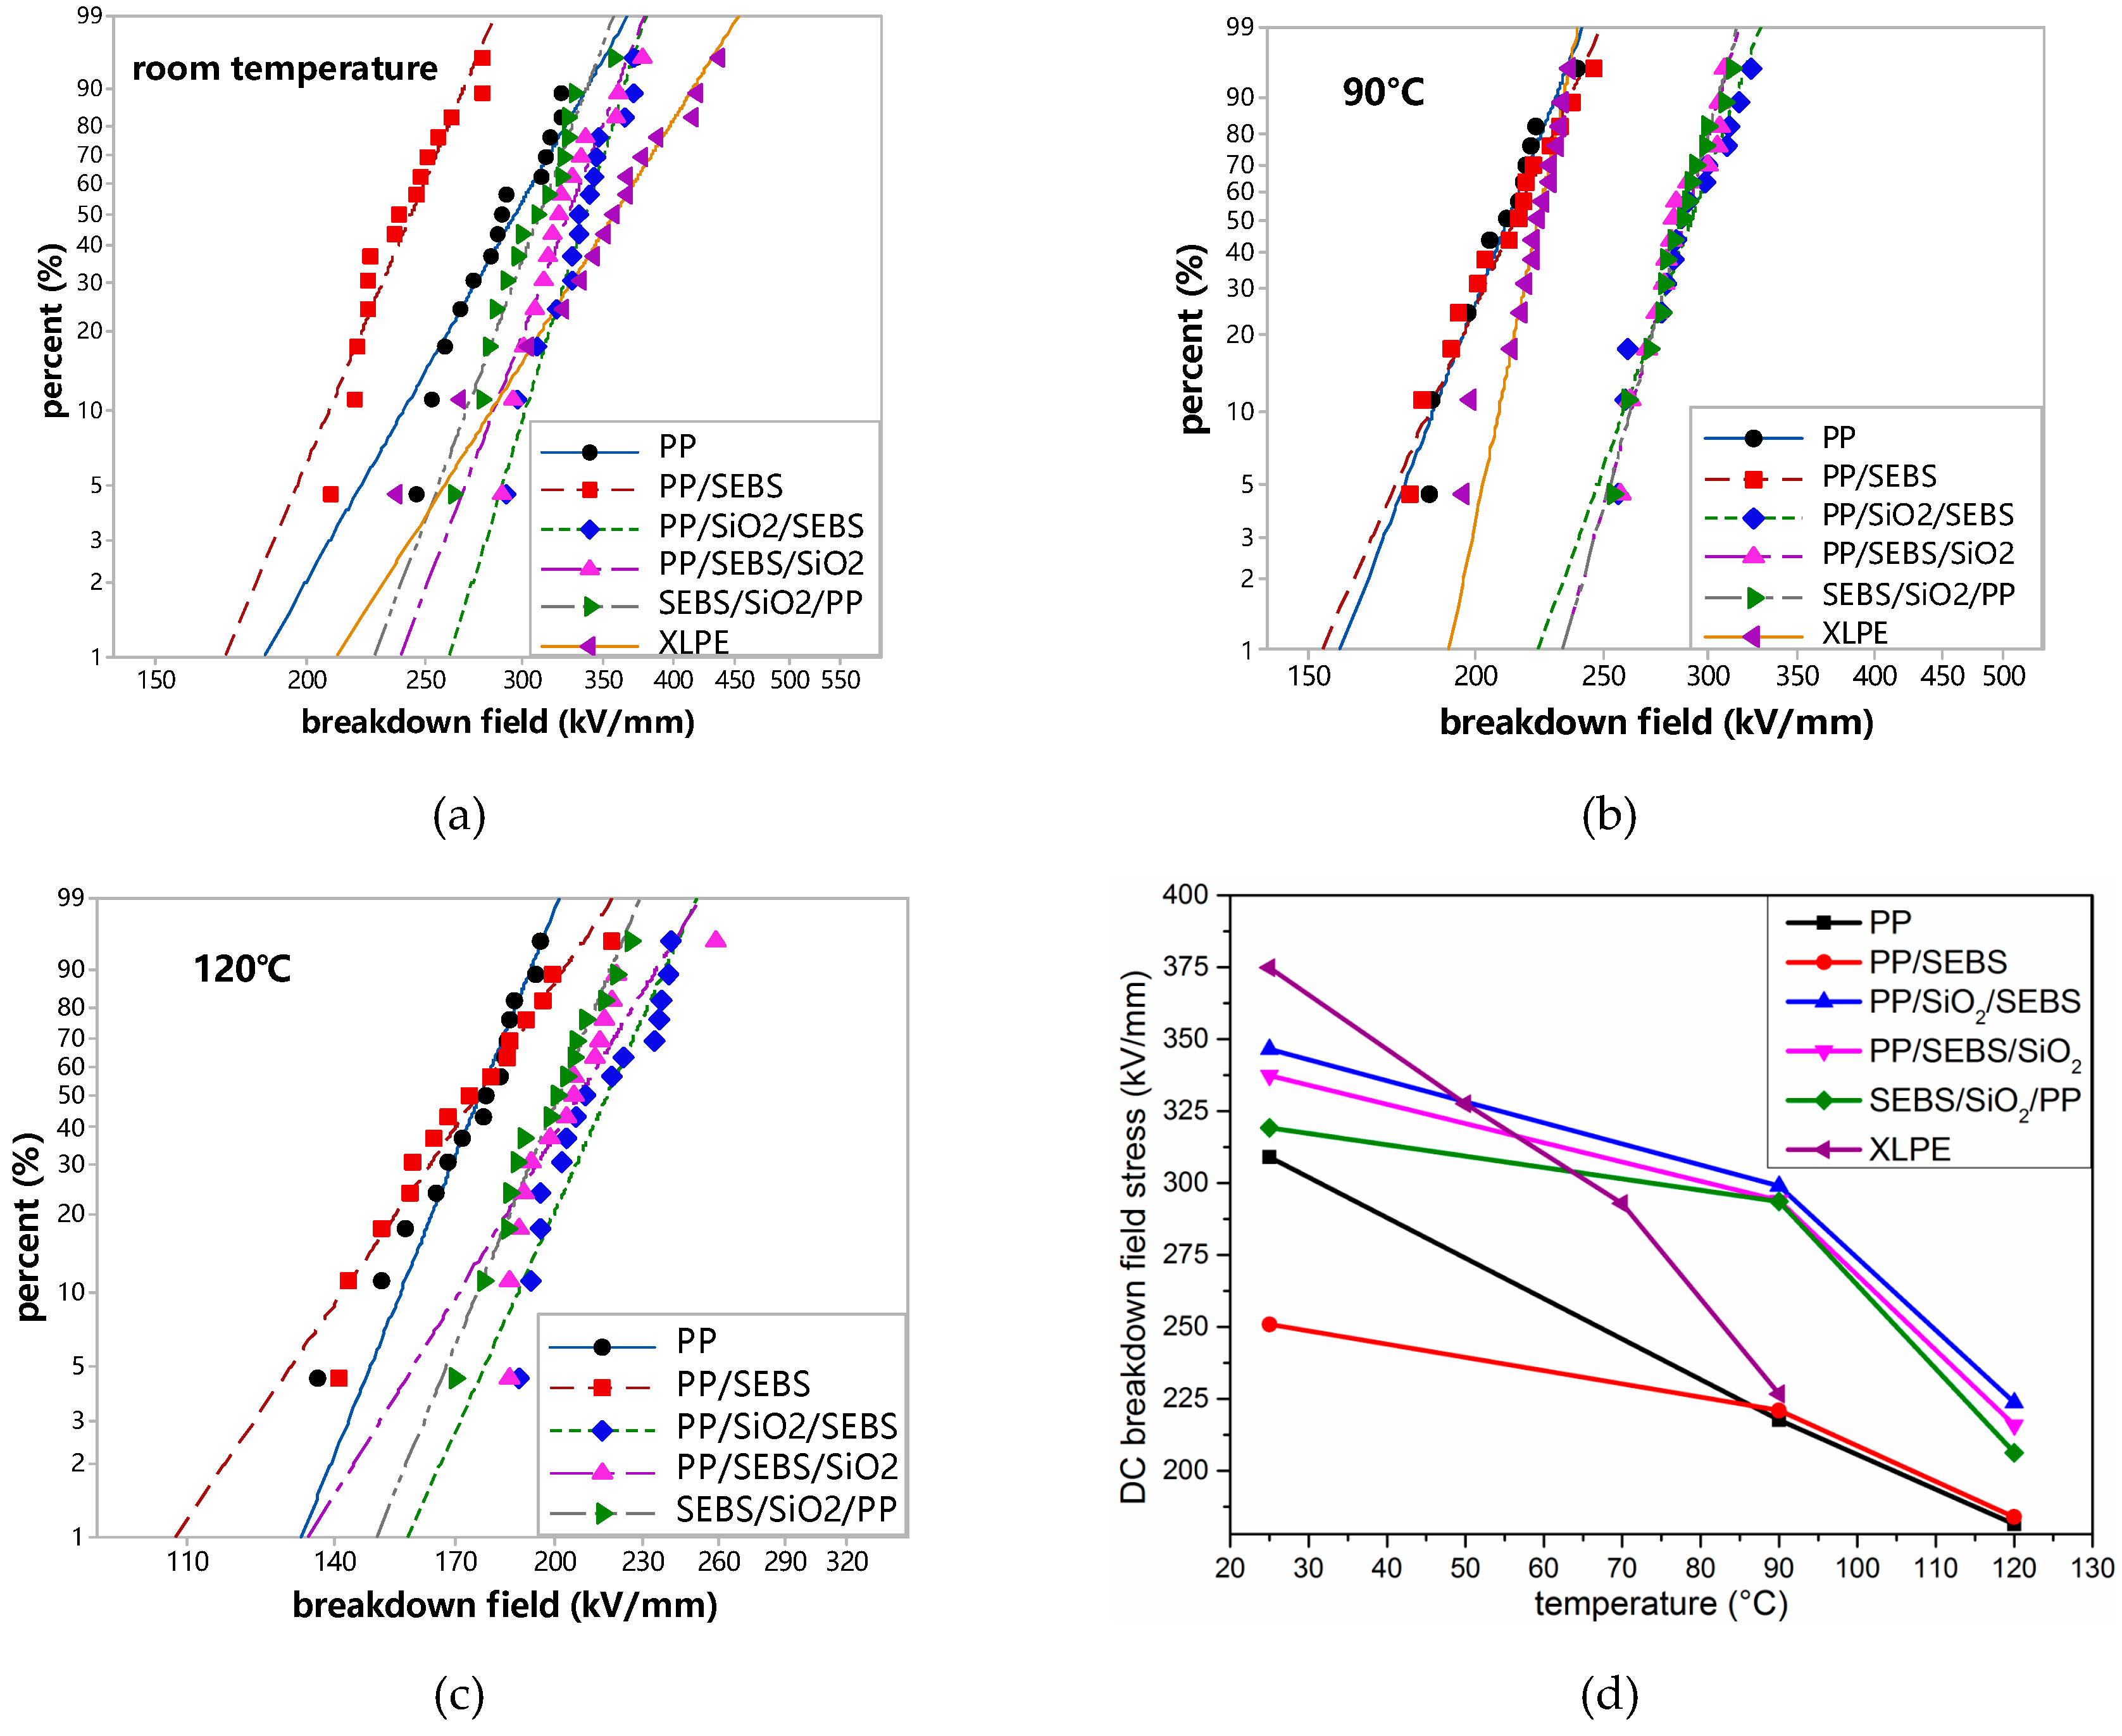
3.6. DC Breakdown Strength
4. Conclusions
Author Contributions
Funding
Conflicts of Interest
References
- Montanari, G.C.; Seri, P.; Lei, X.; Ye, H.; Zhuang, Q.; Morshuis, P.; Stevens, G.; Vaughan, A. Next generation polymeric high voltage direct current cables—A quantum leap needed? IEEE Electr. Insul. Mag. 2018, 34, 24–31. [Google Scholar] [CrossRef]
- Hanley, T.L.; Burford, R.P.; Fleming, R.J.; Barber, K.W. A general review of polymeric insulation for use in HVDC cables. IEEE Electr. Insul. Mag. 2003, 19, 13–24. [Google Scholar] [CrossRef]
- Wang, S.; Chen, P.; Li, H. Improved DC performance of crosslinked polyethylene insulation depending on a higher purity. IEEE Trans. Dielectr. Electr. Insul. 2017, 24, 1809–1817. [Google Scholar] [CrossRef]
- Maekawa, Y.; Watanabe, K.; Maruyama, S. Research and Development of DC +/− 500 kV Eexteruded Cables. CIGRÉ Session 2002, 2002, 21–203. [Google Scholar]
- He, J.; Chen, G. Insulation materials for HVDC polymeric cables. IEEE Trans. Dielectr. Electr. Insul. 2017, 24, 1307. [Google Scholar] [CrossRef]
- Huang, X.; Fan, Y.; Zhang, J. Polypropylene based thermoplastic polymers for potential recyclable HVDC cable insulation applications. IEEE Trans. Dielectr. Electr. Insul. 2017, 24, 1446–1456. [Google Scholar] [CrossRef]
- Du, B.X.; Xu, H.; Li, J. Effects of mechanical stretching on space charge behaviors of PP/POE blend for HVDC cables. IEEE Trans. Dielectr. Electr. Insul. 2017, 24, 1438–1445. [Google Scholar] [CrossRef]
- Gupta, A.K.; Purwar, S.N. Crystallization of PP in PP/SEBS blends and its correlation with tensile properties. J. Appl. Polym. Sci. 1984, 29, 1595–1609. [Google Scholar] [CrossRef]
- Green, C.D.; Vaughan, A.S.; Stevens, G.C.; Pye, A.; Sutton, S.J.; Geussens, T.; Fairhurst, M.J. Thermoplasticcable insulation comprising a blend of isotactic polypropylene and a propylene-ethylene copolymer. IEEE Trans. Dielectr. Electr. Insul. 2015, 22, 639–648. [Google Scholar] [CrossRef]
- Guo, Q.; Li, X.; Li, W. The balanced insulating performance and mechanical property of PP by introducing PP-g-PS graft copolymer and SEBS elastomer. Ind. Eng. Chem. Res. 2018, 57, 6696–6704. [Google Scholar] [CrossRef]
- Zhou, Y.; He, J.; Hu, J. Evaluation of polypropylene/polyolefin elastomer blends for potential recyclable HVDC cable insulation applications. IEEE Trans. Dielectr. Electr. Insul. 2015, 22, 673–681. [Google Scholar] [CrossRef]
- Zha, J.W.; Wang, J.; Wang, S.J. Effect of Modified ZnO on Electrical Properties of PP/SEBS Nanocomposites for HVDC Cables. Trans. Dielectr. Electr. Insul. 2018, 25, 2358–2365. [Google Scholar] [CrossRef]
- Chi, X.H.; Cheng, L.; Liu, W.F. Characterization of Polypropylene Modified by Blending Elastomer and Nano-Silica. Materials 2018, 11, 1321. [Google Scholar] [CrossRef]
- Aboulfaraj, M.; Ulrich, B.; Dahoun, A. Spherulitic morphology of isotactic polypropylene investigated by scanning electron microscopy. Polymer 1993, 34, 4817–4825. [Google Scholar] [CrossRef]
- Norton, D.R. The spherulitic and lamellar morphology of melt-crystallized isotactic polypropylene. Polymer 1985, 26, 704–716. [Google Scholar] [CrossRef]
- Van, D.W.A.; Mulder, J.J.; Gaymans, R.J. Fracture of polypropylene: The effect of crystallinity. Polymer 1998, 39, 5477–5481. [Google Scholar]
- Holger, S.; Daniel, S.; Vancso, G.J. A nanoscopic view at the spherulitic morphology of isotactic polypropylene by atomic force microscopy. Polym. Bull. 1993, 30, 567–574. [Google Scholar]
- Diao, J.; Huang, X.; Jia, Q. Thermoplastic isotactic polypropylene/ethylene-octene polyolefin copolymer nanocomposite for recyclable HVDC cable insulation. IEEE Trans. Dielectr. Electr. Insul. 2017, 24, 1416–1429. [Google Scholar] [CrossRef]
- Zheng, C.J.; Yang, J.M.; Zhao, H. AC performance, physical and mechanical properties of polypropylene/polyolefin elastomers blends. In Proceedings of the 12th IEEE International Conference on the Properties and Applications of Dielectric Materials, Xi’an, China, 20–24 May 2018; pp. 910–913. [Google Scholar]
- Qazviniha, M.R.; Abdouss, M.; Musavi, M. Physical and mechanical properties of SEBS/polypropylene nanocomposites reinforced by nano CaCO3. Materialwissenschaft und Werkstofftechnik 2016, 47, 47–52. [Google Scholar] [CrossRef]
- Parameswaranpillai, J.; Jose, S.; Siengchin, S. Phase morphology, mechanical, dynamic mechanical, crystallization, and thermal degradation properties of PP and PP/PS blends modified with SEBS elastomer. Int. J. Plast. Technol. 2017, 21, 79–95. [Google Scholar] [CrossRef]
- Bikiaris, D.N.; Papageorgiou, G.Z.; Pavlidou, E. Preparation by melt mixing and characterization of isotactic polypropylene/SiO2 nanocomposites containing untreated and surface-treated nanoparticles. J. Appl. Polym. Sci. 2006, 100, 13. [Google Scholar] [CrossRef]
- Qian, J.; He, P.; Nie, K. Nonisothermal crystallization of PP/nano-SiO2 composites. J. Appl. Polym. Sci. 2004, 91, 1013–1019. [Google Scholar] [CrossRef]
- Grein, C.; Bernreitner, K.; Gahleitner, M. Potential and limits of dynamic mechanical analysis as a tool for fracture resistance evaluation of isotactic polypropylenes and their polyolefin blends. J. Appl. Polym. Sci. 2004, 93, 1854–1867. [Google Scholar] [CrossRef]
- Lan, L.; Wu, J.; Yin, Y. Effect of temperature on space charge trapping and conduction in cross-linked polyethylene. IEEE Trans. Dielectr. Electr. Insul. 2014, 21, 1784–1791. [Google Scholar] [CrossRef]
- Ieda, M. Electrical Conduction and Carrier Traps in Polymeric Materials. IEEE Trans. Dielectr. Electr. Insul. 1984, 19, 162–178. [Google Scholar] [CrossRef]
- Mizutani, T.; Suzuoki, Y.; Ieda, M. Thermally stimulated currents in polyethylene and ethylene-vinyl-acetate copolymers. J. Appl. Phys. 1977, 48, 2408–2413. [Google Scholar] [CrossRef]
- Pillai, P.K.C.; Narula, G.K.; Tripathi, A.K.; Mendiratta, R.G. Thermally stimulated discharge current studies in polarized polypropylene. Phys. Status Solidi A 1981, 67, 649–654. [Google Scholar] [CrossRef]
- Iwamoto, M.; Wu, C.X. Thermally-Stimulated Current. Phys. Prop. Org. Monolayers 2001, 156–167. [Google Scholar]
- Yin, Y. Thermally Stimulated Currents of SiO2/Low-density Polyethylene Microand Nano-composites. Trans. Electr. Electron. Eng. 2010, 5, 385–390. [Google Scholar] [CrossRef]
- Rong, M.Z.; Zhang, M.Q.; Zheng, Y.X. Structure-property relationships of irradiation grafted nano-inorganic particle filled polypropylene composites. Polymer 2001, 42, 167–183. [Google Scholar] [CrossRef]
- Han, B.; Wang, X.; Sun, Z.; Yang, J.; Lei, Q. Space charge suppression induced by deep traps in polyethylene/zeolite nanocomposite. Appl. Phys. Lett. 2013, 102, 012902. [Google Scholar] [CrossRef]
- Tian, F.; Lei, Q.Q.; Wang, X.; Wang, Y. Effect of deep trapping states on space charge suppression in polyethylene/ZnO nanocomposite. Appl. Phys. Lett. 2011, 99, 142903. [Google Scholar] [CrossRef]


| Sample | PP (phr) | SEBS (phr) | Nano-SiO2 (phr) | Blending Order |
|---|---|---|---|---|
| PP | 100 | 0 | 0 | - |
| PP/SEBS | 75 | 25 | 1 | masterbatch 1 |
| PP/SiO2/SEBS | 75 | 25 | 1 | masterbatch 2 + SEBS |
| PP/SEBS/SiO2 | 75 | 25 | 1 | masterbatch 1 + SiO2 |
| SEBS/SiO2/PP | 75 | 25 | 1 | masterbatch 3 + PP |
| Sample | Tc (°C) | Tm (°C) | Xc (%) |
|---|---|---|---|
| PP | 116.2 | 165.8 | 46.22 |
| PP/SEBS | 113.2 | 164.2 | 46.23 |
| PP/SiO2/SEBS | 113.5 | 165 | 44.69 |
| PP/SEBS/SiO2 | 113.8 | 164.6 | 44.56 |
| SEBS/SiO2/PP | 114.4 | 164.3 | 43.68 |
| Time (s) | Average Space Charge Density (C/m3) | |||||
|---|---|---|---|---|---|---|
| XLPE | PP | PP/SEBS | PP/SiO2/SEBS | PP/SEBS/SiO2 | SEBS/SiO2/PP | |
| 5 | 3.01 | 2.16 | 2.59 | 0.73 | 0.83 | 1.35 |
| 3600 | 1.34 | 1.52 | 2.43 | 0.72 | 0.81 | 1.34 |
© 2019 by the authors. Licensee MDPI, Basel, Switzerland. This article is an open access article distributed under the terms and conditions of the Creative Commons Attribution (CC BY) license (http://creativecommons.org/licenses/by/4.0/).
Share and Cite
Gao, M.; Yang, J.; Zhao, H.; He, H.; Hu, M.; Xie, S. Preparation Methods of Polypropylene/Nano-Silica/Styrene-Ethylene-Butylene-Styrene Composite and Its Effect on Electrical Properties. Polymers 2019, 11, 797. https://doi.org/10.3390/polym11050797
Gao M, Yang J, Zhao H, He H, Hu M, Xie S. Preparation Methods of Polypropylene/Nano-Silica/Styrene-Ethylene-Butylene-Styrene Composite and Its Effect on Electrical Properties. Polymers. 2019; 11(5):797. https://doi.org/10.3390/polym11050797
Chicago/Turabian StyleGao, Mingze, Jiaming Yang, Hong Zhao, Hui He, Ming Hu, and Shuhong Xie. 2019. "Preparation Methods of Polypropylene/Nano-Silica/Styrene-Ethylene-Butylene-Styrene Composite and Its Effect on Electrical Properties" Polymers 11, no. 5: 797. https://doi.org/10.3390/polym11050797
APA StyleGao, M., Yang, J., Zhao, H., He, H., Hu, M., & Xie, S. (2019). Preparation Methods of Polypropylene/Nano-Silica/Styrene-Ethylene-Butylene-Styrene Composite and Its Effect on Electrical Properties. Polymers, 11(5), 797. https://doi.org/10.3390/polym11050797