Chemically Denatured Structures of Porcine Pepsin using Small-Angle X-ray Scattering

Abstract

1. Introduction
2. Materials and Methods
2.1. Materials and Sample Preparation
2.2. SDS-PAGE Analysis
2.3. Asymmetrical Flow Field-Flow Fractionation with Multi-Angle Light Scattering (AF4-MALS)
2.4. Raman Spectroscopy
2.5. SAXS Measurements in Solution
2.6. Construction of 3D Structural Models
3. Results and Discussion
4. Conclusions
Author Contributions
Funding
Acknowledgments
Conflicts of Interest
References
- Adel, A.; Nadia, M.; Mohamed, O.; Abdelhafidh, G. Study of thermally and chemically unfolded conformations of bovine serum albumin by means of dynamic light scattering. Mater. Sci. Eng. C 2008, 28, 594–600. [Google Scholar] [CrossRef]
- Shortle, D. The denatured state (the other half of the folding equation) and its role in protein stability. FASEB J. 1996, 10, 27–34. [Google Scholar] [CrossRef] [PubMed]
- Dill, K.A.; Shortle, D. Denatured states of proteins. Annu. Rev. Biochem. 1991, 60, 795–825. [Google Scholar] [CrossRef] [PubMed]
- Dobson, C.M. Unfolded proteins, compact states and molten globules. Curr. Opin. Struct. Biol. 1992, 2, 6–12. [Google Scholar] [CrossRef]
- Sipe, J.D. Amyloidosis. Annu. Rev. Biochem. 1992, 61, 947–975. [Google Scholar] [CrossRef]
- Prusiner, S.B.; Scott, M.R.; DeArmond, S.J.; Cohen, F.E. Prion protein biology. Cell 1998, 93, 337–348. [Google Scholar] [CrossRef]
- Dobson, C.M. Protein misfolding, evolution and disease. Trends Biochem. Sci. 1999, 24, 329–332. [Google Scholar] [CrossRef]
- Sigler, P.B.; Xu, Z.; Rye, H.S.; Burston, S.G.; Fenton, W.A.; Horwich, A.L. Structure and function in GroEL-mediated protein folding. Annu. Rev. Biochem. 1998, 67, 581–608. [Google Scholar] [CrossRef]
- Ellis, R.J. Molecular chaperones: Pathways and networks. Curr. Biol. 1999, 9, R137–R139. [Google Scholar] [CrossRef]
- Bychkova, V.E.; Pain, R.H.; Ptitsyn, O.B. The ‘molten globule’ state is involved in the translocation of proteins across membranes? FEBS Lett. 1988, 238, 231–234. [Google Scholar] [CrossRef]
- Beermann, B.B.; Hinz, H.J.; Hofmann, A.; Huber, R. Acid induced equilibrium unfolding of annexin V wild type shows two intermediate states. FEBS Lett. 1998, 423, 265–269. [Google Scholar] [CrossRef]
- Privalov, P.L. Thermodynamic problems of protein structure. Annu. Rev. Biophys. Biophys. Chem. 1989, 18, 47–69. [Google Scholar] [CrossRef] [PubMed]
- Udgaonkar, J.B.; Baldwin, R.L. NMR evidence for an early framework intermediate on the folding pathway of ribonuclease A. Nature 1988, 335, 694–699. [Google Scholar] [CrossRef] [PubMed]
- Matouschek, A.; Kellis, J.T.; Serrano, L.; Fersht, A.R. Mapping the transition state and pathway of protein folding by protein engineering. Nature 1989, 340, 122–126. [Google Scholar] [CrossRef] [PubMed]
- Cegielska-Radziejewska, R.; Lesnierowski, G.; Kijowski, J. Antibacterial activity of hen egg white lysozyme modified by thermochemical technique. Eur. Food Res. Technol. 2009, 228, 841–845. [Google Scholar] [CrossRef]
- Vilcacundo, R.; Méndez, P.; Reyes, W.; Romero, H.; Pinto, A.; Carrillo, W. Antibacterial Activity of Hen Egg White Lysozyme Denatured by Thermal and Chemical Treatments. Sci. Pharm. 2018, 86, 48. [Google Scholar] [CrossRef]
- Enea, O.; Jollocoeur, C. Heat capacities and volumes of several oligopeptides in urea-water mixtures at 25.degree.C. Some implications for protein unfolding. J. Phys. Chem. 1982, 86, 3870–3881. [Google Scholar] [CrossRef]
- Liepinsh, E.; Otting, G. Specificity of urea binding to proteins. J. Am. Chem. Soc. 1994, 116, 9670–9674. [Google Scholar] [CrossRef]
- Sielecki, A.R.; Fedorov, A.A.; Boodhoo, A.; Andreeva, N.S.; James, N.G. Molecular and crystal structures of monoclinic porcine pepsin refined at 1.8 Å resolution. J. Mol. Biol. 1990, 214, 143–170. [Google Scholar] [CrossRef]
- Shortle, D. Mutational studies of protein structures and their stabilities. Q. Rev. Biophys. 1992, 25, 205–250. [Google Scholar] [CrossRef]
- Dyson, H.J.; Wright, P.E. Insights into protein folding from NMR. Annu. Rev. Phys. Chem. 1996, 47, 369–395. [Google Scholar] [CrossRef] [PubMed]
- Dobson, C.M.; Hore, P.J. Kinetic studies of protein folding using NMR spectroscopy. Nat. Struct. Biol. 1998, 5, 504–507. [Google Scholar] [CrossRef] [PubMed]
- Davies, D.R. The structure and function of the aspartic proteinases. Annu. Rev. Biophys. Biophys. Chem. 1990, 19, 189–215. [Google Scholar] [CrossRef]
- Abad-Zapatero, C.; Rydel, T.J.; Erickson, J. Revised 2.3 Å structure of porcine pepsin: Evidence for a flexible subdomain. Proteins 1990, 8, 62–81. [Google Scholar] [CrossRef]
- Lin, Y.; Fusek, M.; Lin, X.; Hartsuck, J.A.; Kezdy, F.J.; Tang, J. pH dependence of kinetic parameters of pepsin, rhizopuspepsin, and their active-site hydrogen bond mutants. J. Biol. Chem. 1992, 267, 18413–18418. [Google Scholar]
- Favilla, R.; Parisoli, A.; Mazzini, A. Alkaline denaturation and partial refolding of pepsin investigated with DAPI as an extrinsic probe. Biophys. Chem. 1997, 67, 75–83. [Google Scholar] [CrossRef]
- Wang, J.L.; Edelman, G.M. Fluorescent probes for conformational states of proteins IV. The pepsinogen-pepsin conversion. J. Biol. Chem. 1971, 246, 1185–1191. [Google Scholar]
- Antonov, V.K.; Ginodman, L.M.; Kapitannikov, Y.V.; Barshev-skaya, T.N.; Gurova, A.G.; Rumsh, L.D. Mechanism of pepsin catalysis: General base catalysis by the active-site carboxylate ion. FEBS Lett. 1978, 88, 87–90. [Google Scholar] [CrossRef]
- Cornish-Bowden, A.J.; Knowles, J.R. The pH-dependence of pepsin-catalysed reactions. Biochem. J. 1969, 113, 353–362. [Google Scholar] [CrossRef]
- Campos, L.A.; Sancho, J. The active site of pepsin is formed in the intermediate conformation dominant at mildly acidic pH. FEBS Lett. 2003, 538, 89–95. [Google Scholar] [CrossRef]
- Jin, K.S.; Rho, Y.; Kim, J.; Kim, H.; Kim, I.J.; Ree, M. Synchrotron small-angle X-ray scattering studies of the structure of porcine pepsin under various pH conditions. J. Phys. Chem. B 2008, 112, 15821–15827. [Google Scholar] [CrossRef] [PubMed]
- Kohn, J.E. Random-coil behavior and the dimensions of chemically unfolded proteins. Proc. Natl. Acad. Sci. USA 2004, 101, 12491–12496. [Google Scholar] [CrossRef] [PubMed]
- Wilkins, D.K.; Grimshaw, S.B.; Receveur, V.; Dobson, C.M.; Jones, J.A.; Smith, L.J. Hydrodynamic radii of native and denatured proteins measured by pulse field gradient NMR techniques. Biochemistry 1999, 38, 16424–16431. [Google Scholar] [CrossRef] [PubMed]
- Stumpe, M.C.; Grubmuller, H. Interaction of urea with amino acids: Implications for urea-induced protein denaturation. J. Am. Chem. Soc. 2007, 129, 16126–16131. [Google Scholar] [CrossRef]
- Tuukkanen, A.T.; Spilotros, A.; Svergun, D.I. Progress in small angle scattering from biological solutions at high brilliance synchrotrons. IUCrJ 2017, 4, 518–528. [Google Scholar] [CrossRef]
- Giehm, L.; Svergun, D.I.; Otzen, D.E.; Vestergaard, B. Low-resolution structure of a vesicle disrupting α-synuclein oligomer that accumulates during fibrillation. Proc. Natl. Acad. Sci. USA 2011, 108, 3246–3251. [Google Scholar] [CrossRef]
- Ryan, T.M.; Xun, Y.; Cowieson, N.P.; Mata, J.P.; Jackson, A.; Pauw, B.R.; Smith, A.J.; Kirby, N.; McGillivray, D. Combined pressure and temperature denaturation of ribonuclease A produces alternate denatured states. Biochem. Biophys. Res. Commun. 2016, 473, 834–839. [Google Scholar] [CrossRef]
- Mojumdar, A.; De March, M.; Marino, F.; Onesti, S. The human RecQ4 helicase contains a functional RecQ C-terminal region (RQC) that is essential for activity. J. Biol. Chem. 2017, 292, 4176–4184. [Google Scholar] [CrossRef]
- Pande, M.; Kumari, N.K.P.; Dubey, V.K.; Tripathi, P.; Jagannadham, M.V. Stability and unfolding studies on alkaline denatured state (Ip) of pepsin. Process Biochem. 2009, 44, 906–911. [Google Scholar] [CrossRef]
- Kim, K.W.; Kim, J.; Yun, Y.D.; Ahn, H.; Min, B.; Kim, N.H.; Rah, S.; Kim, H.Y.; Lee, C.S.; Seo, I.D.; et al. Small-angle X-ray scattering beamline BL4C SAXS at Pohang light source II. Biodesign 2017, 5, 24–29. [Google Scholar]
- Glatter, O.; Kratky, O. Small Angle X-ray Scattering; Academic Press: London, UK, 1982. [Google Scholar]
- Semenyuk, A.; Svergun, D. GNOM—A program package for small-angle scattering data processing. J. Appl. Crystallogr. 1991, 24, 537–540. [Google Scholar] [CrossRef]
- Fischer, H.; de Oliveira Neto, M.; Napolitano, H.B.; Polikarpov, I.; Craievich, A.F. Determination of the molecular weight of proteins in solution from a single small-angle X-ray scattering measurement on a relative scale. J. Appl. Crystallogr. 2010, 43, 101–109. [Google Scholar] [CrossRef]
- Svergun, D.I.; Petoukhov, M.V.; Koch, M.H.J. Determination of domain structure of proteins from X-ray solution scattering. Biophys. J. 2001, 80, 2946–2953. [Google Scholar] [CrossRef]
- Svergun, D.; Barberato, C.; Koch, M.H.J. CRYSOL—A program to evaluate X-ray solution scattering of biological macromolecules from atomic coordinates. J. Appl. Crystallogr. 1995, 28, 768–773. [Google Scholar] [CrossRef]
- Kozin, M.B.; Svergun, D.I. Automated matching of high-and low-resolution structural models. J. Appl. Crystallogr. 2001, 34, 33–41. [Google Scholar] [CrossRef]
- Tria, G.; Mertens, H.D.T.; Kachala, M.; Svergun, D.I. Advanced ensemble modelling of flexible macromolecules using X-ray solution scattering. IUCrJ 2015, 2, 207–217. [Google Scholar] [CrossRef]
- Mensch, C.; Bultinck, P.; Johannessen, C. The effect of protein backbone hydration on the amide vibrations in Raman and Raman optical activity spectra. Phys. Chem. Chem. Phys. 2019, 21, 1988–2005. [Google Scholar] [CrossRef]
- Mensch, C.; Barron, L.D.; Johannessen, C. Ramachandran mapping of peptide conformation using a large database of computed Raman and Raman optical activity spectra. Phys. Chem. Chem. Phys. 2016, 18, 31757–31768. [Google Scholar] [CrossRef]
- Cai, S.; Singh, B.R. A distinct utility of the amide III infrared band for secondary structure estimation of aqueous protein solutions using partial least squares methods. Biochemistry 2004, 43, 2541–2549. [Google Scholar] [CrossRef]
- Barron, L.D.; Hecht, L.; Blanch, E.W.; Bell, A.F. Solution structure and dynamics of biomolecules from Raman optical activity. Prog. Biophys. Mol. Biol. 2000, 73, 1–49. [Google Scholar] [CrossRef]
- Kikhney, A.G.; Svergun, D.I. A practical guide to small angle X-ray scattering (SAXS) of flexible and intrinsically disordered proteins. FEBS Lett. 2015, 589, 2570–2577. [Google Scholar] [CrossRef] [PubMed]
- Flory, P.J. Principles of Polymer Chemistry; Cornell University Press: Ithaka, NY, USA, 1953. [Google Scholar]
- Roe, R.-J. Methods of X-ray and Neutron Scattering in Polymer Science; Oxford University Press: New York, NY, USA, 2000. [Google Scholar]
- Glatter, O. Data evaluation in small-angle scattering: Calculation of radial electron-density distribution by means of indirect Fourier transformation. Acta Phys. Austriaca 1977, 47, 83–102. [Google Scholar]
- Svergun, D.I. Determination of the regularization parameter in indirect-transform methods using perceptual criteria. J. Appl. Crystallogr. 1992, 25, 495–503. [Google Scholar] [CrossRef]
- Perez, J.; Vachette, P.; Russo, D.; Desmadril, M.; Durand, D. Heat-induced unfolding of neocarzinostatin, a small all-beta protein investigated by small-angle X-ray scattering. J. Mol. Biol. 2001, 308, 721–743. [Google Scholar] [CrossRef] [PubMed]
- Kubota, K.; Metoki, Y.; Athauda, S.; Shibata, C.; Takahashi, K. Stability profiles of nepenthesin in urea and guanidine hydrochloride: Comparison with porcine pepsin A. Biosci. Biotechnol. Biochem. 2010, 74, 2323–2326. [Google Scholar] [CrossRef]


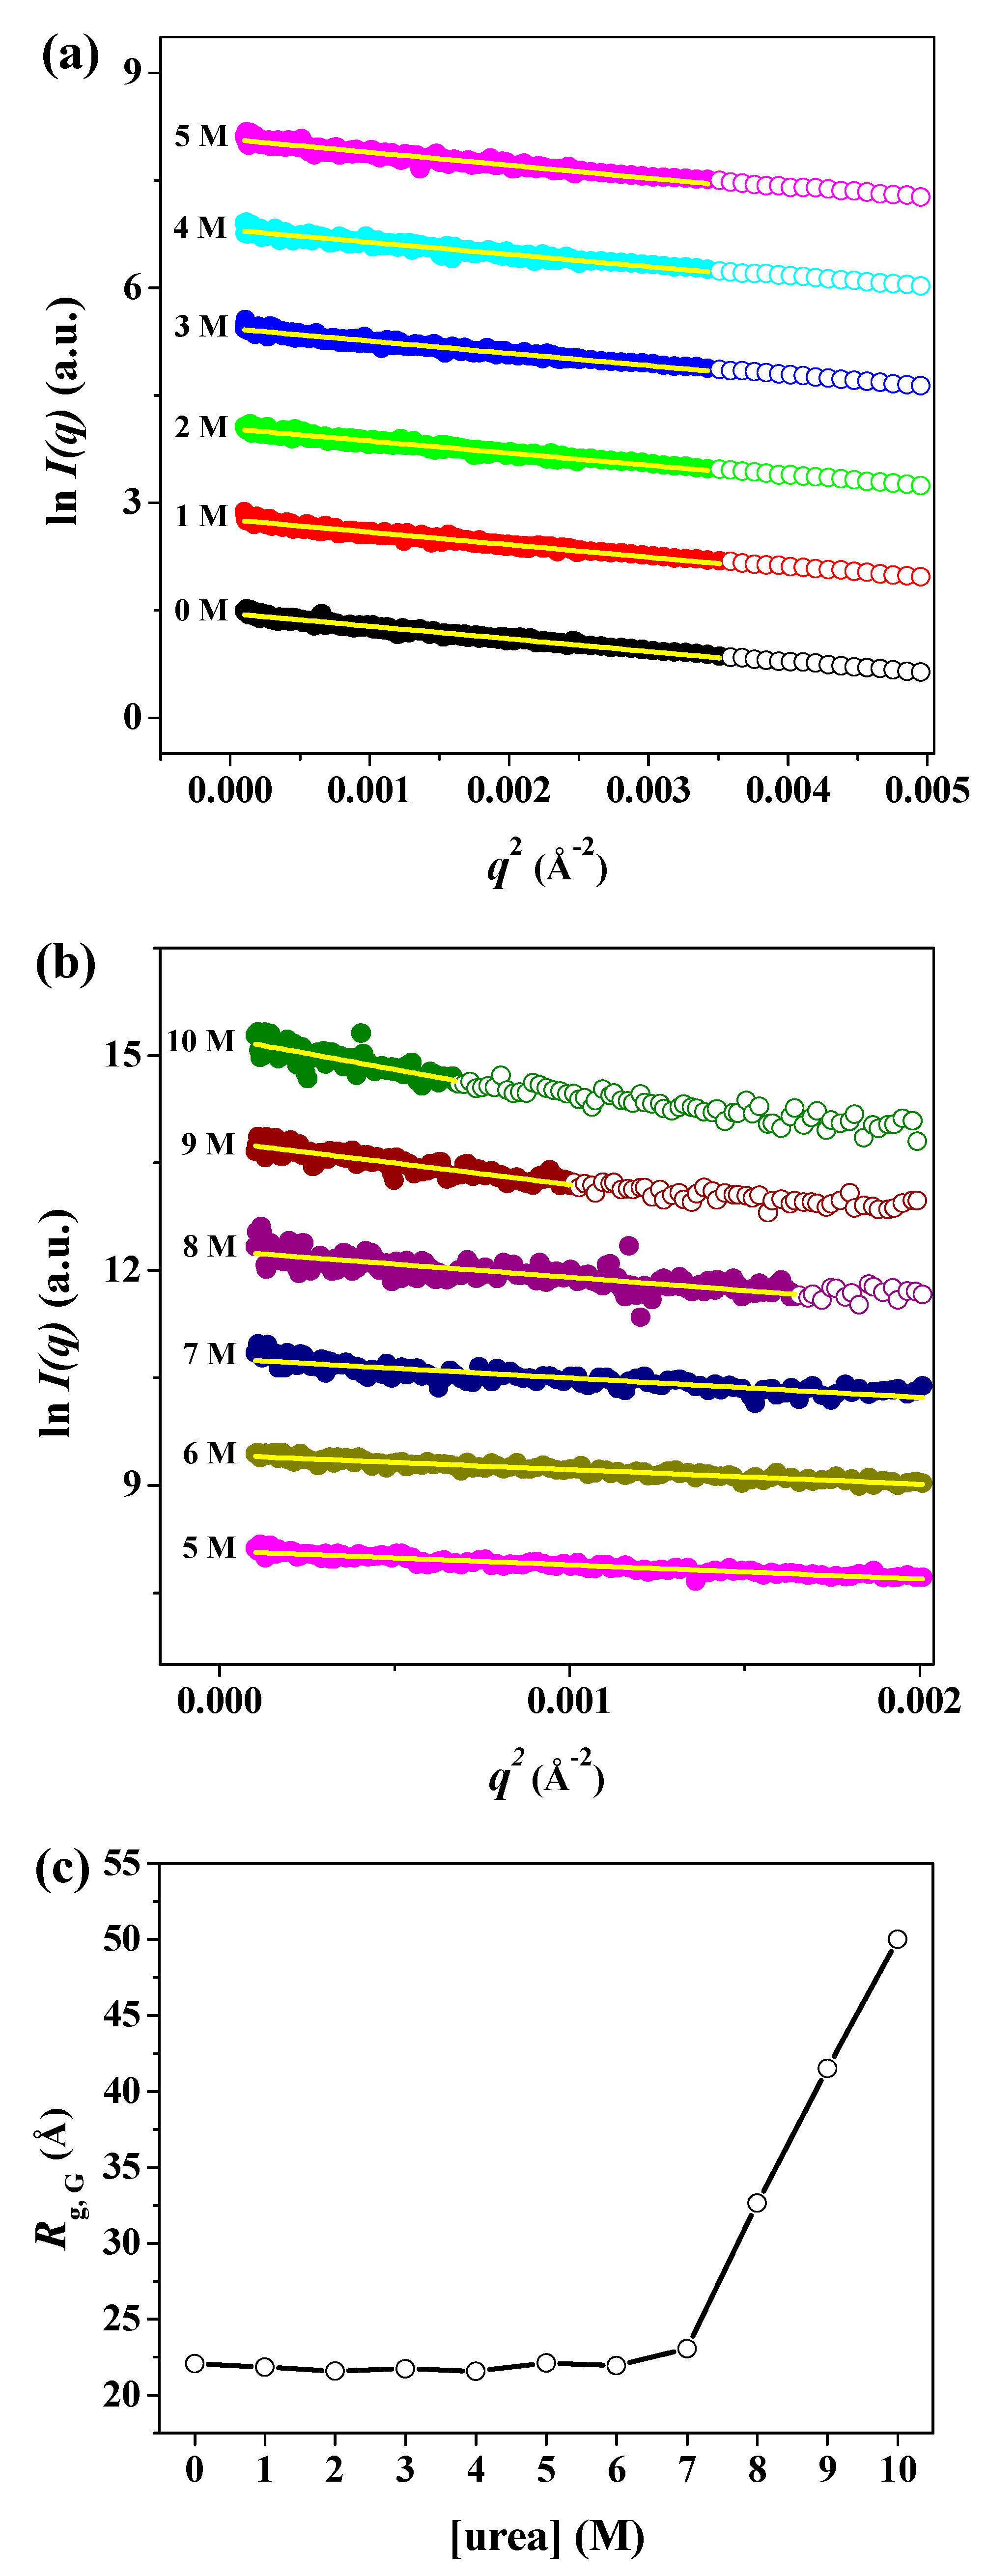
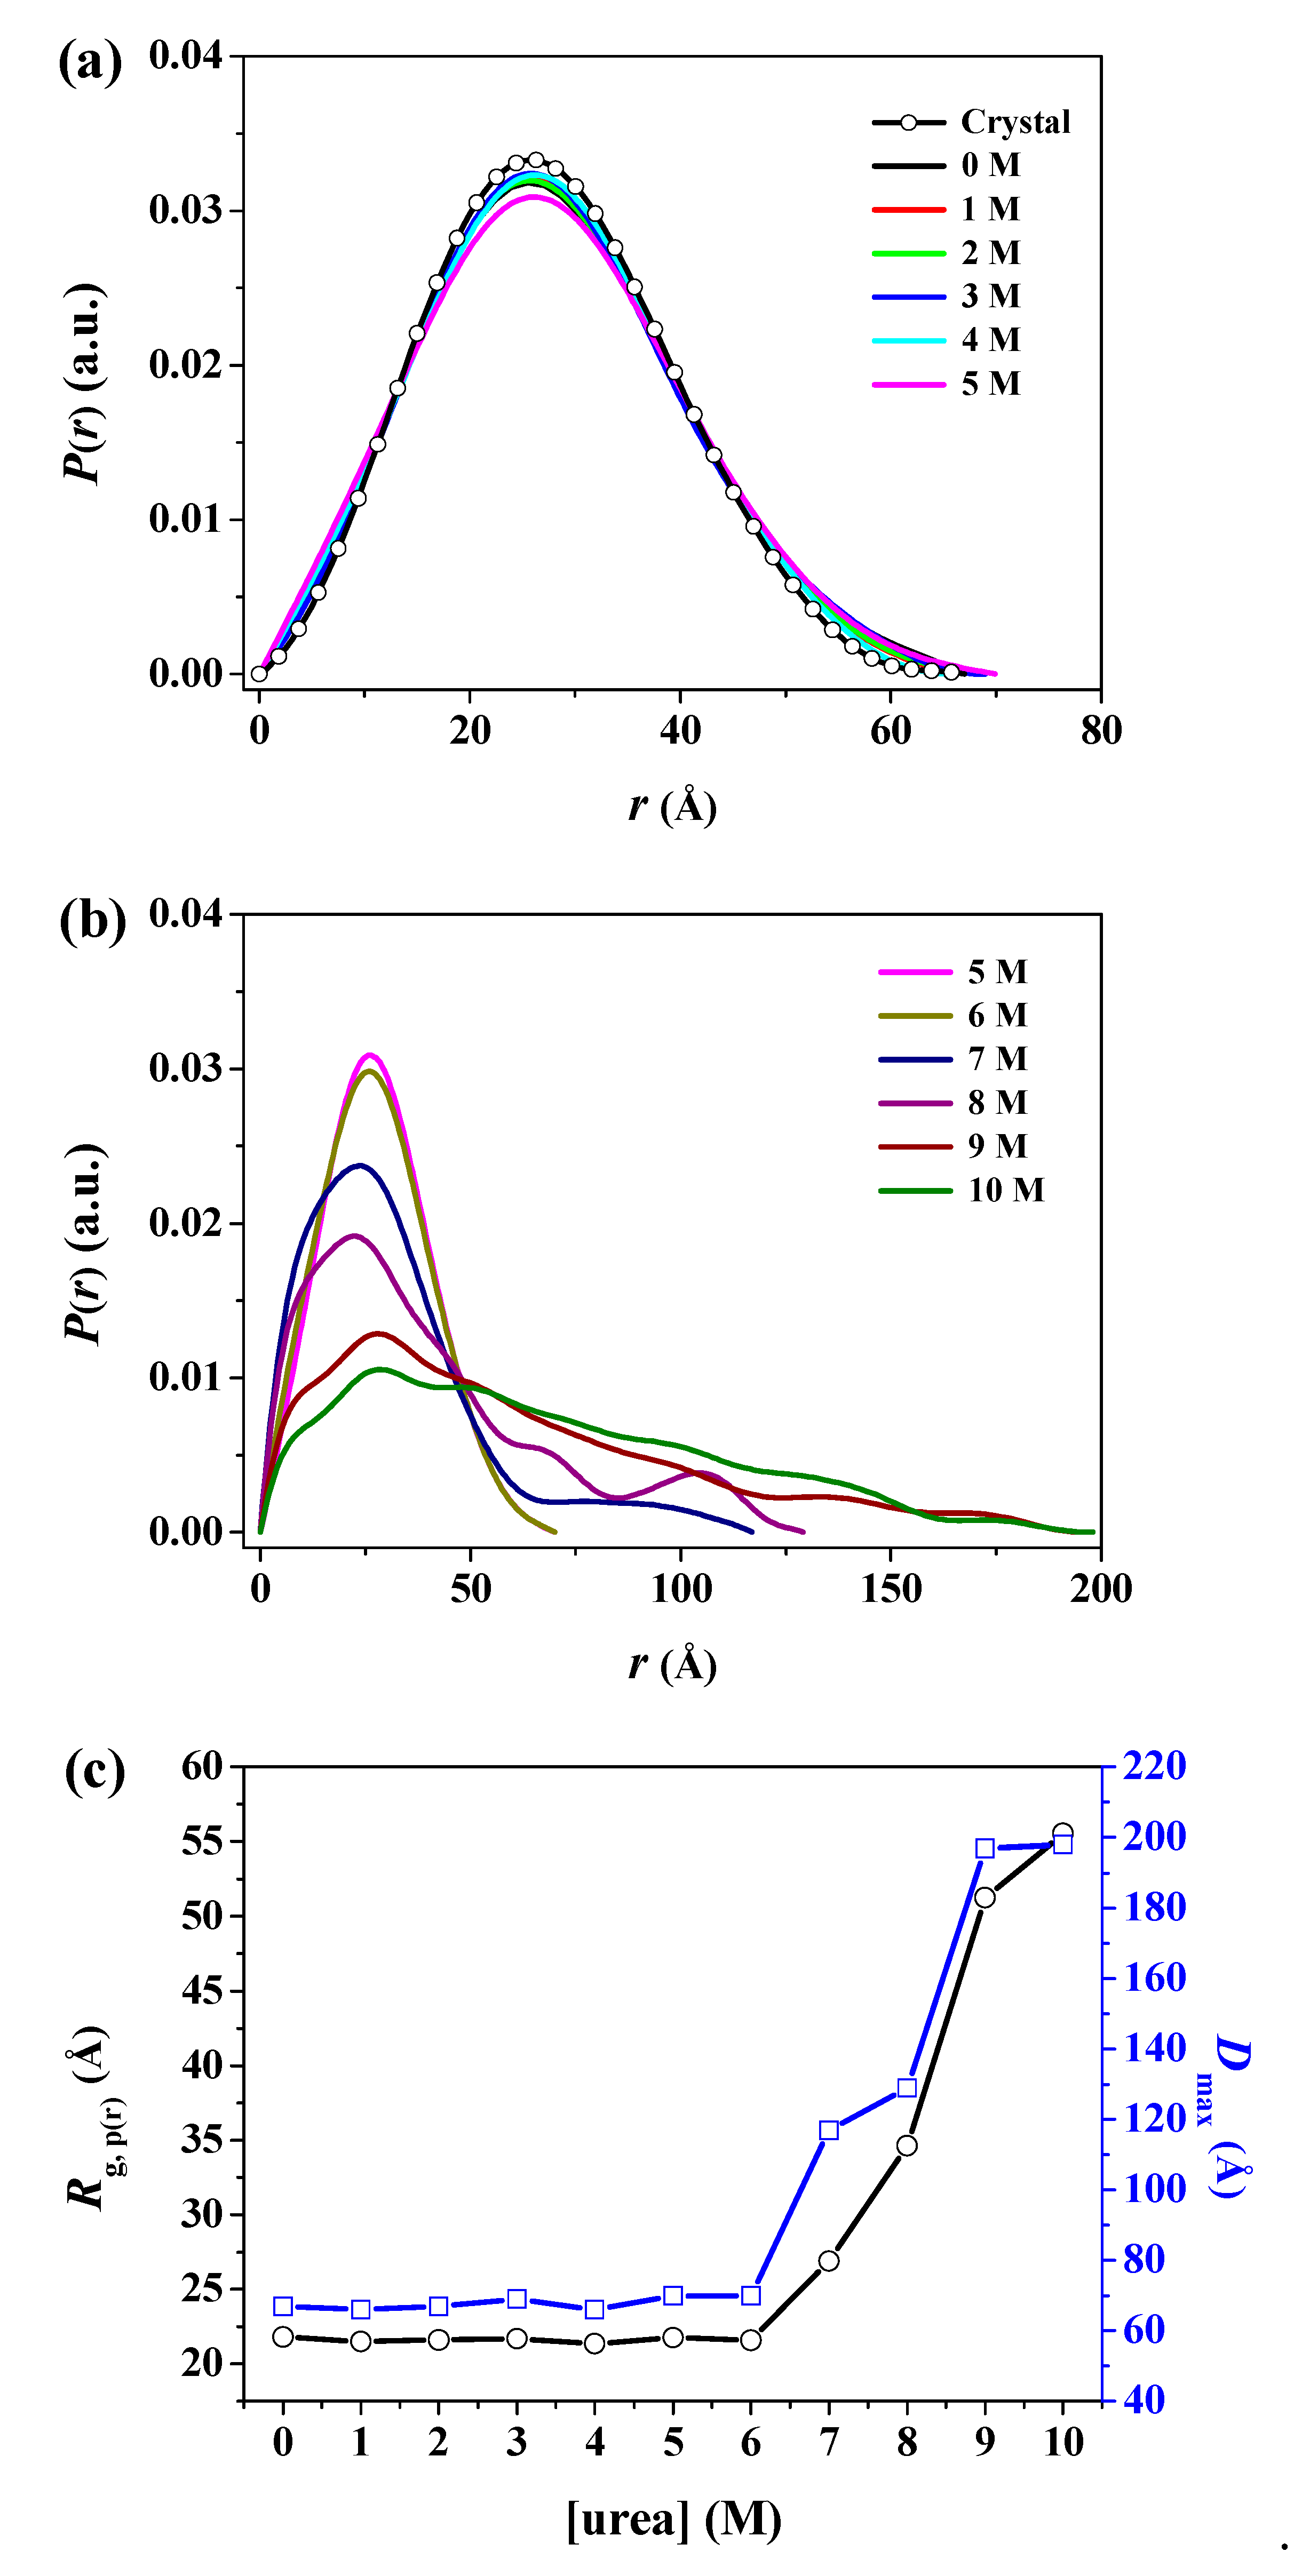
| Sample | Rg,Ga (Å) | Rg,p(r)b (Å) | Rg,p(r)/Rg,0Mc | Dmaxd (Å) | MMSAXSe (kDa) |
|---|---|---|---|---|---|
| Crystal | 21.34 ± 0.01 | 21.20 ± 0.19 | 0.97 | 67.0 | - |
| 0 M | 22.08 ± 0.22 | 21.79 ± 0.13 | 1.00 | 67.0 | 39.04 |
| 1 M | 21.84 ± 0.23 | 21.50 ± 0.15 | 0.99 | 66.0 | 35.48 |
| 2 M | 21.59 ± 0.24 | 21.60 ± 0.15 | 0.99 | 67.0 | 36.94 |
| 3 M | 21.73 ± 0.26 | 21.68 ± 0.21 | 0.99 | 69.0 | 37.08 |
| 4 M | 21.58 ± 0.27 | 21.34 ± 0.20 | 0.98 | 66.0 | 31.33 |
| 5 M | 22.12 ± 0.31 | 21.76 ± 0.21 | 0.99 | 69.9 | 28.39 |
| 6 M | 21.96 ± 0.38 | 21.57 ± 0.24 | 0.99 | 70.0 | 33.67 |
| 7 M | 23.07 ± 0.79 | 26.89 ± 2.54 | 1.23 | 117.0 | 20.85 |
| 8 M | 32.66 ± 1.61 | 34.62 ± 4.25 | 1.59 | 129.0 | 25.89 |
| 9 M | 41.54 ± 3.43 | 51.25 ± 5.98 | 2.35 | 197.0 | 39.67 |
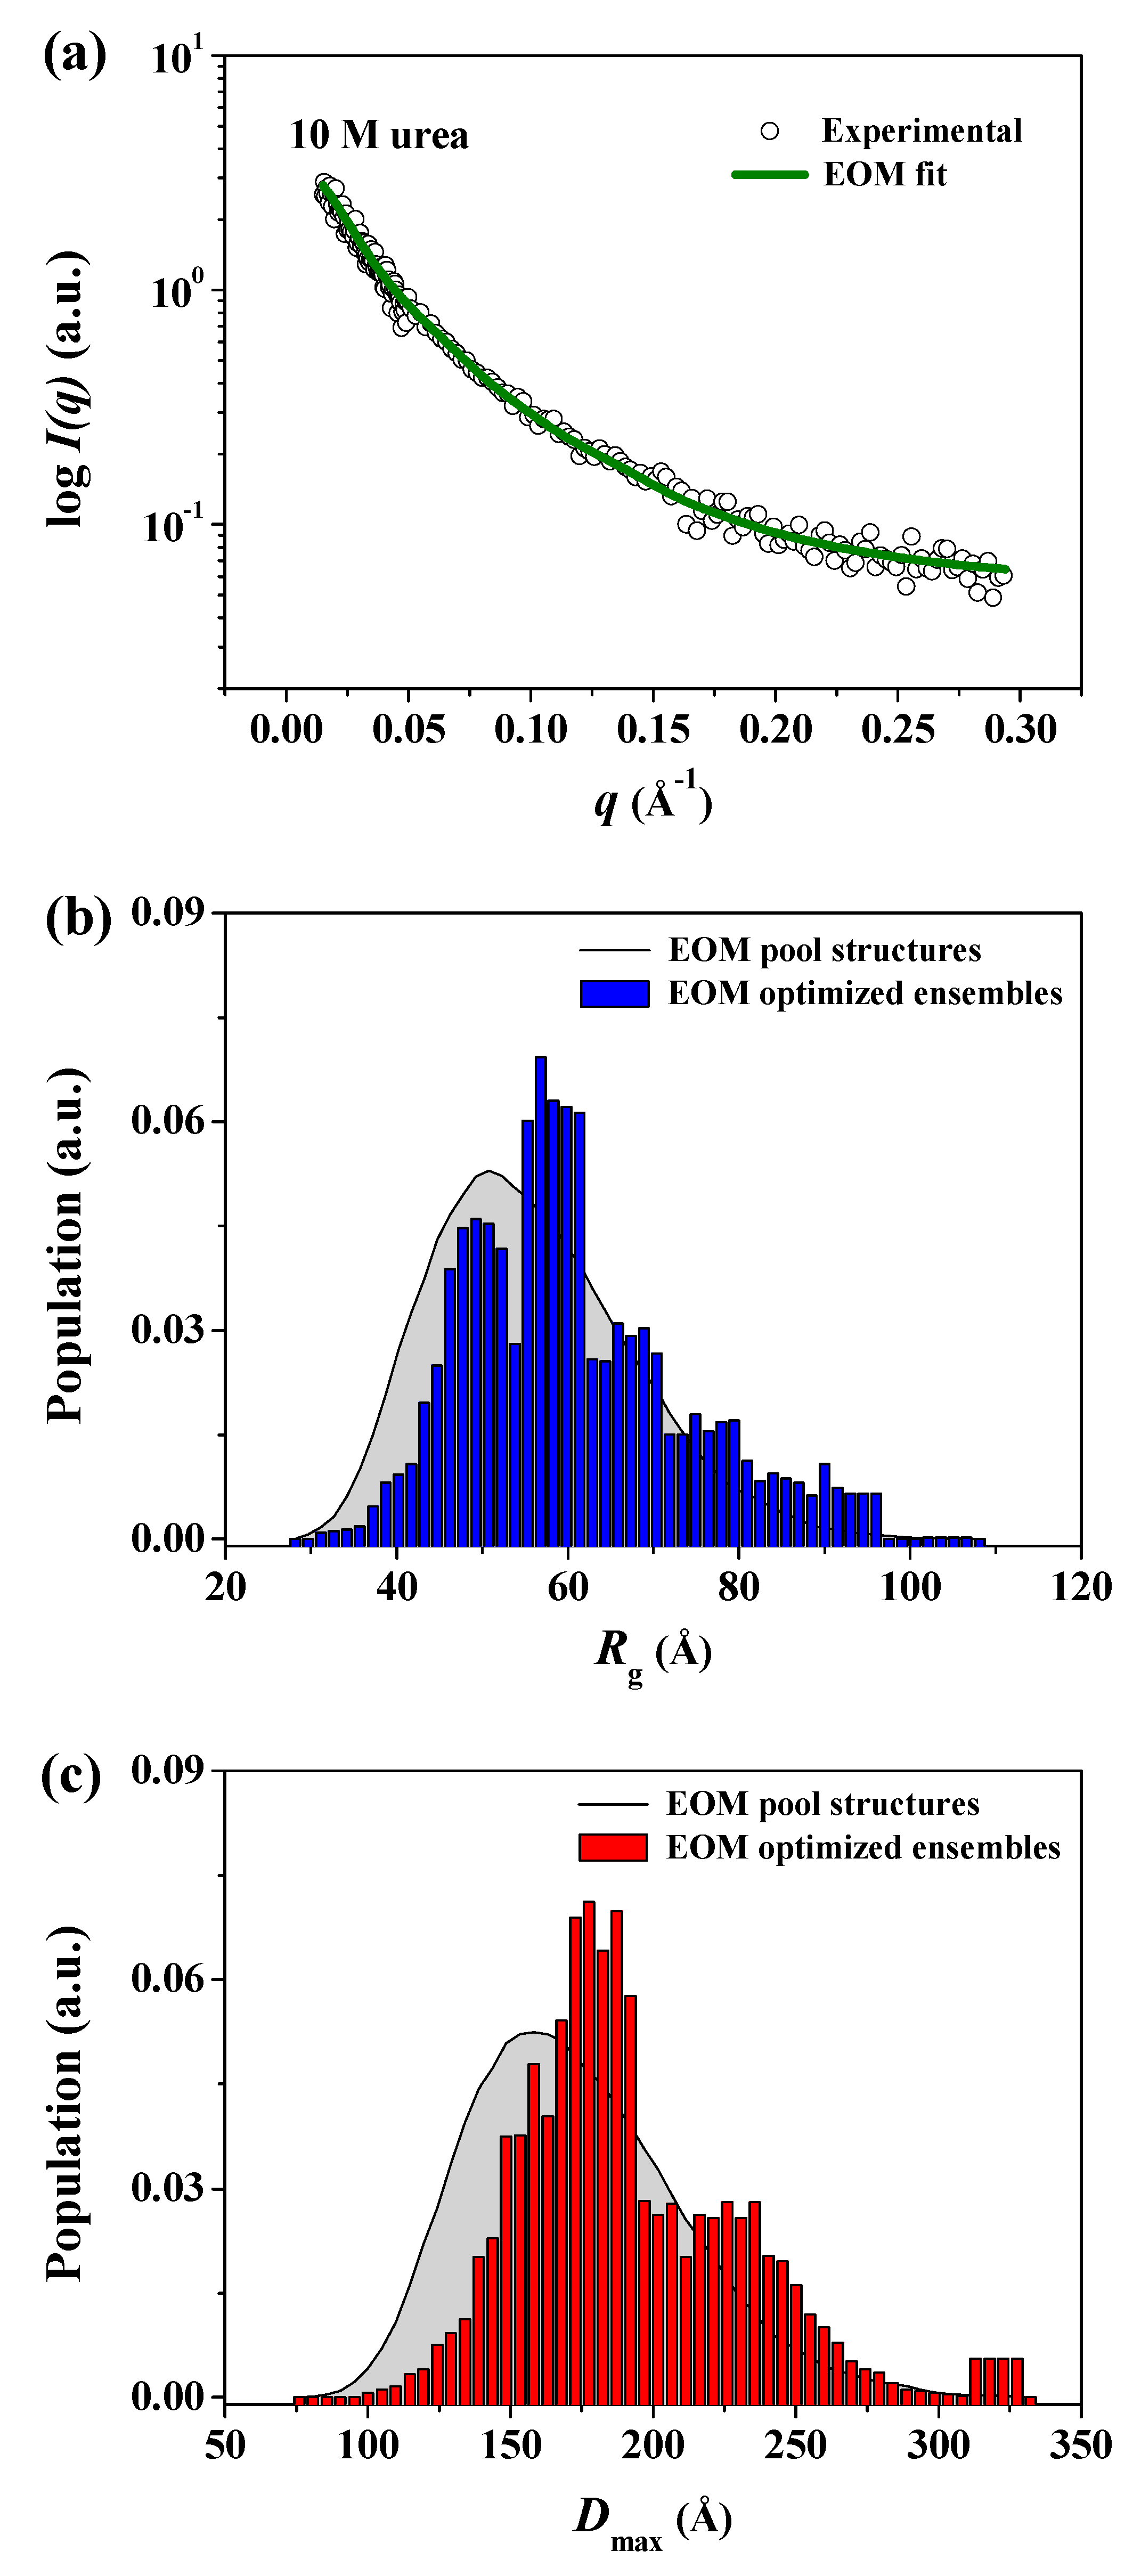
| 10 M | 50.01 ± 5.08 | 55.52 ± 6.41 | 2.55 | 198.0 | 34.18 |
© 2019 by the authors. Licensee MDPI, Basel, Switzerland. This article is an open access article distributed under the terms and conditions of the Creative Commons Attribution (CC BY) license (http://creativecommons.org/licenses/by/4.0/).
Share and Cite
Rho, Y.; Kim, J.H.; Min, B.; Jin, K.S. Chemically Denatured Structures of Porcine Pepsin using Small-Angle X-ray Scattering. Polymers 2019, 11, 2104. https://doi.org/10.3390/polym11122104
Rho Y, Kim JH, Min B, Jin KS. Chemically Denatured Structures of Porcine Pepsin using Small-Angle X-ray Scattering. Polymers. 2019; 11(12):2104. https://doi.org/10.3390/polym11122104
Chicago/Turabian StyleRho, Yecheol, Jun Ha Kim, Byoungseok Min, and Kyeong Sik Jin. 2019. "Chemically Denatured Structures of Porcine Pepsin using Small-Angle X-ray Scattering" Polymers 11, no. 12: 2104. https://doi.org/10.3390/polym11122104
APA StyleRho, Y., Kim, J. H., Min, B., & Jin, K. S. (2019). Chemically Denatured Structures of Porcine Pepsin using Small-Angle X-ray Scattering. Polymers, 11(12), 2104. https://doi.org/10.3390/polym11122104