The Production Possibility of the Antimicrobial Filaments by Co-Extrusion of the PLA Pellet with Chitosan Powder for FDM 3D Printing Technology

 ,
,  ,
,
Abstract
1. Introduction
2. Materials and Methods
2.1. Materials
2.2. Filament Preparation
2.3. Filament Characterization
2.3.1. Density
2.3.2. Topography Evaluation
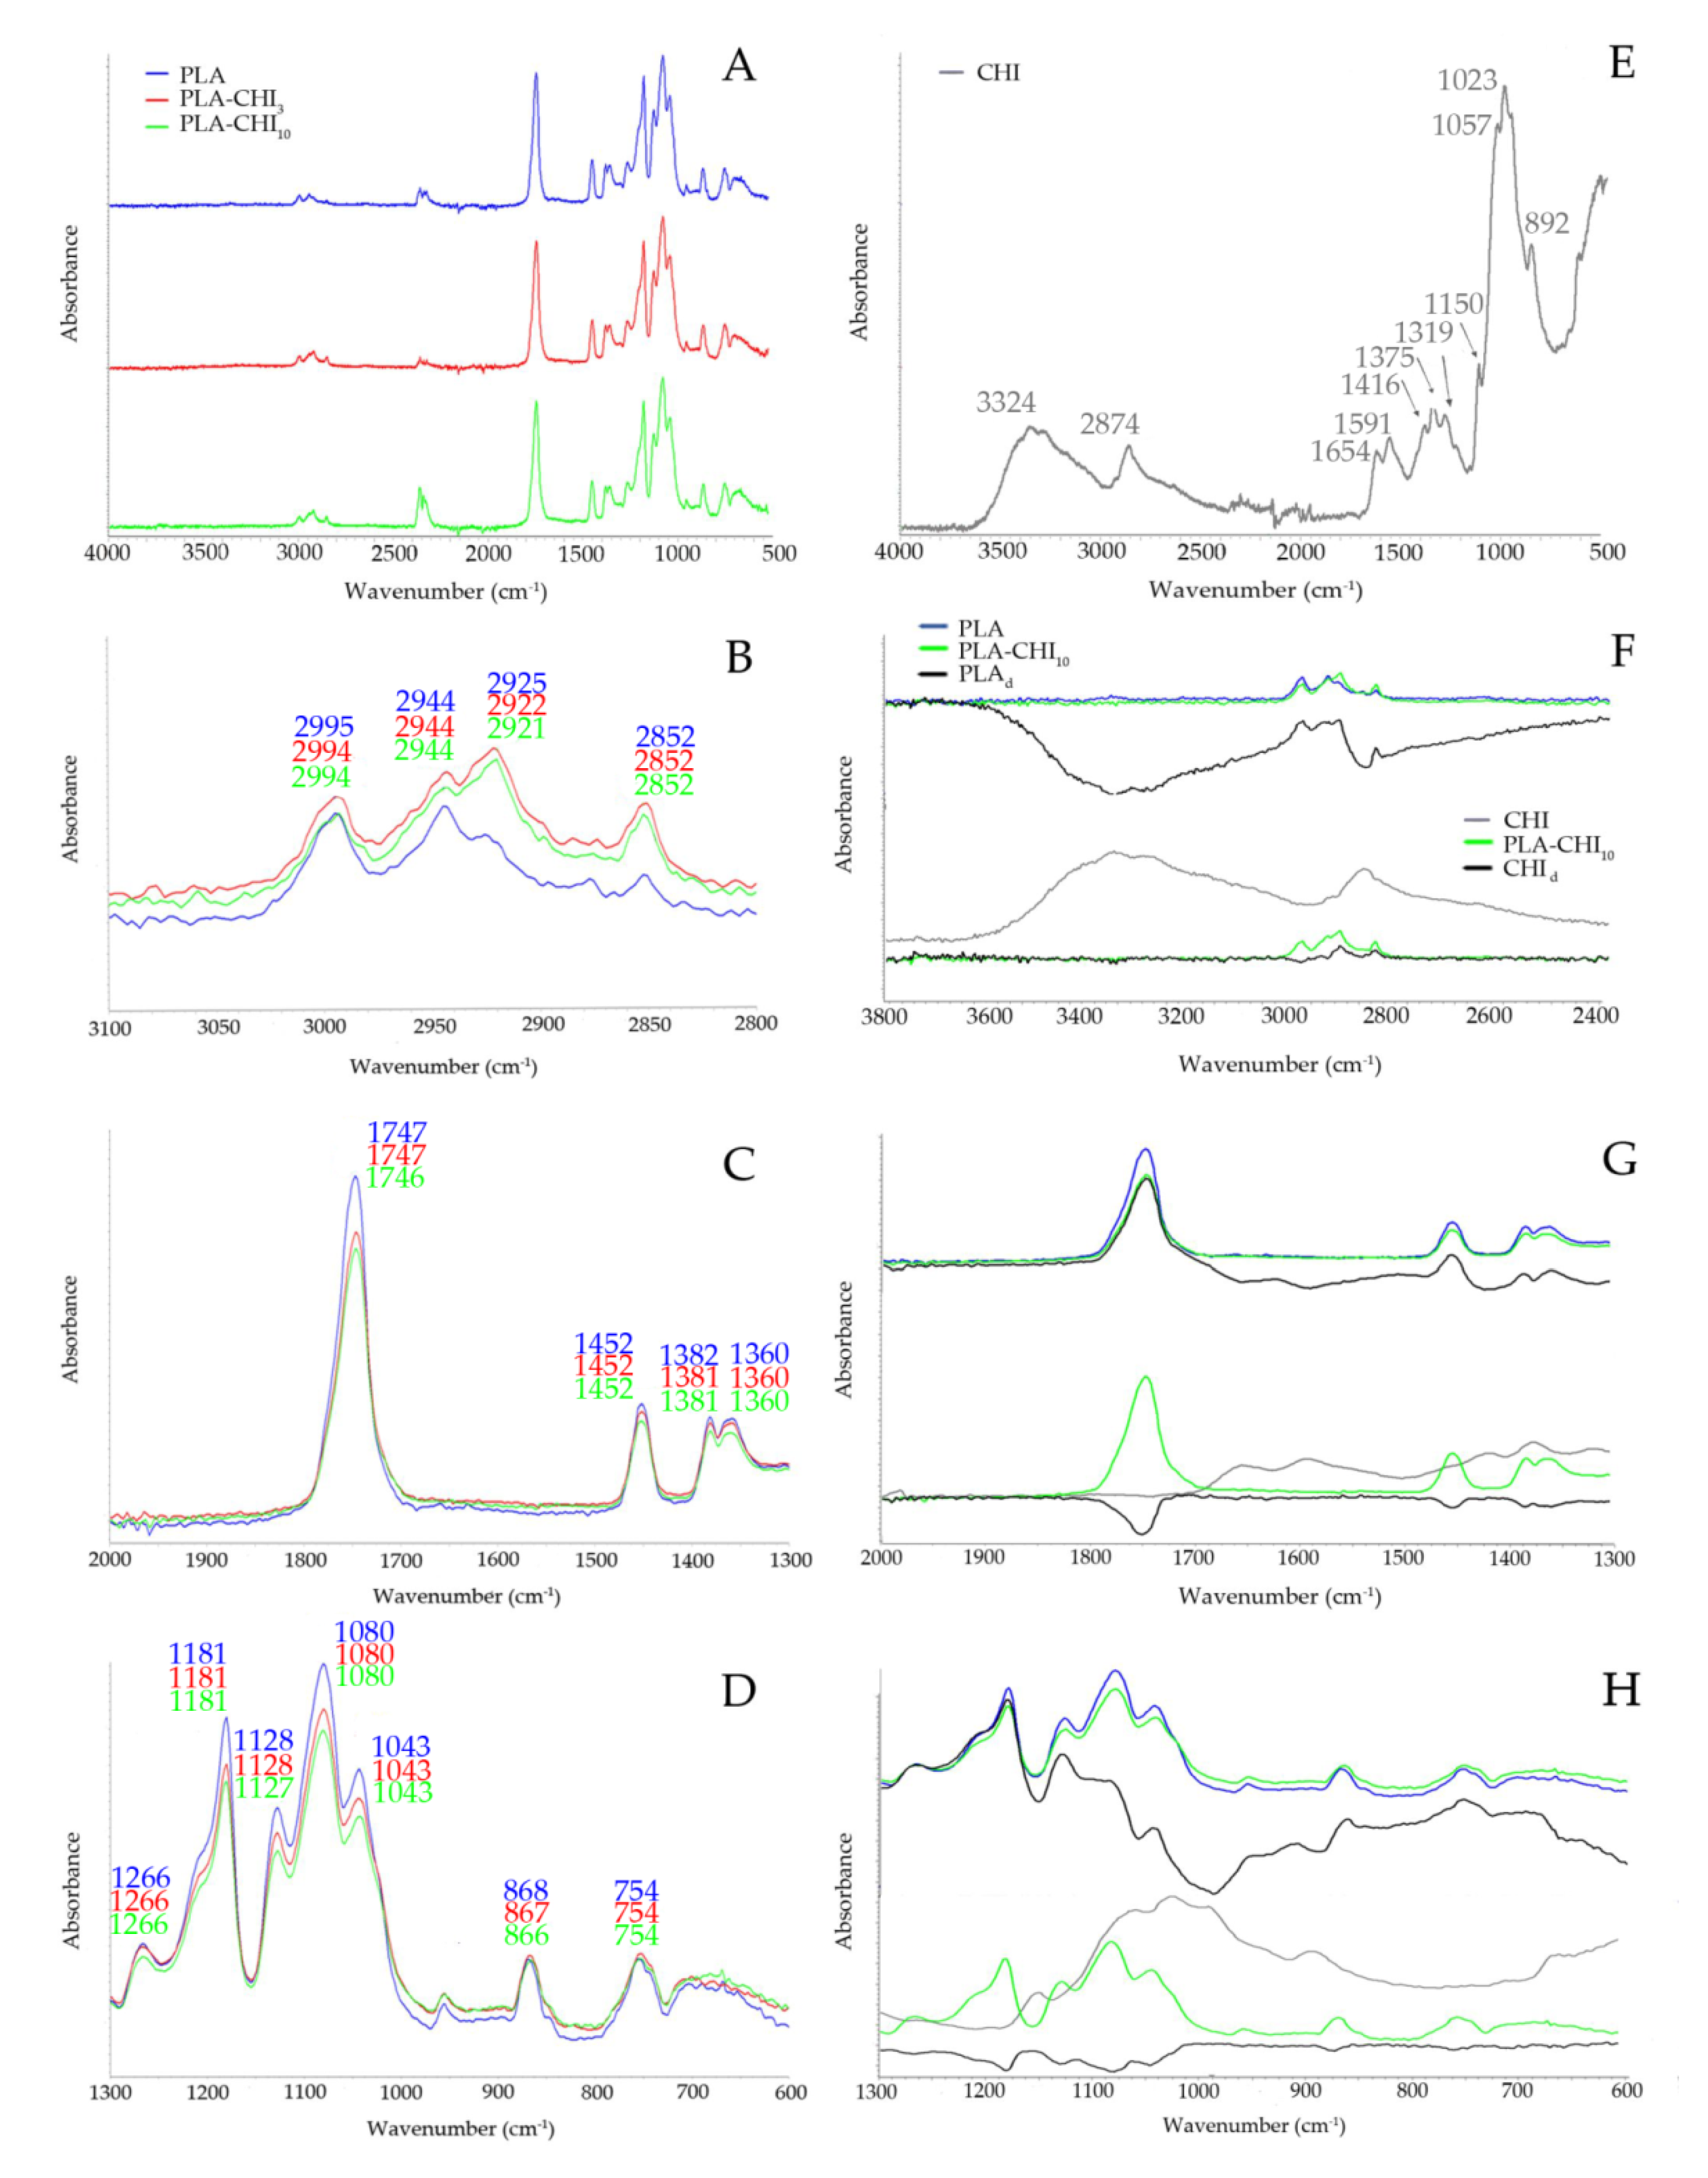
2.3.3. Fourier-Transform Infrared Spectroscopy (FT-IR) Study
2.3.4. Mechanical Properties
2.3.5. Thermal Properties
2.3.6. Antimicrobial Properties
2.3.7. Statistical Analysis of the Data
2.4. 3D Print Preparation
3. Results and Discussion
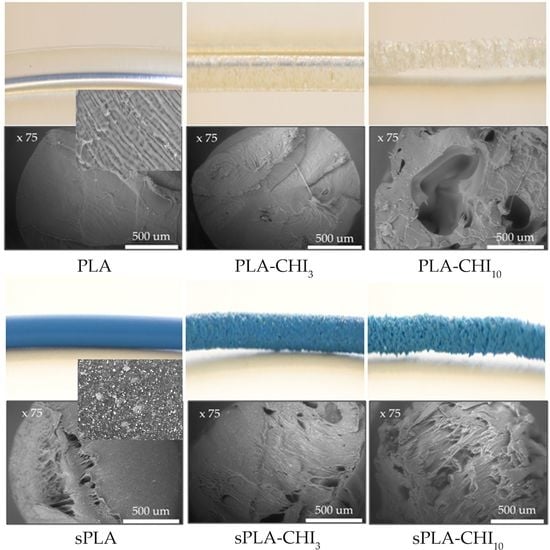
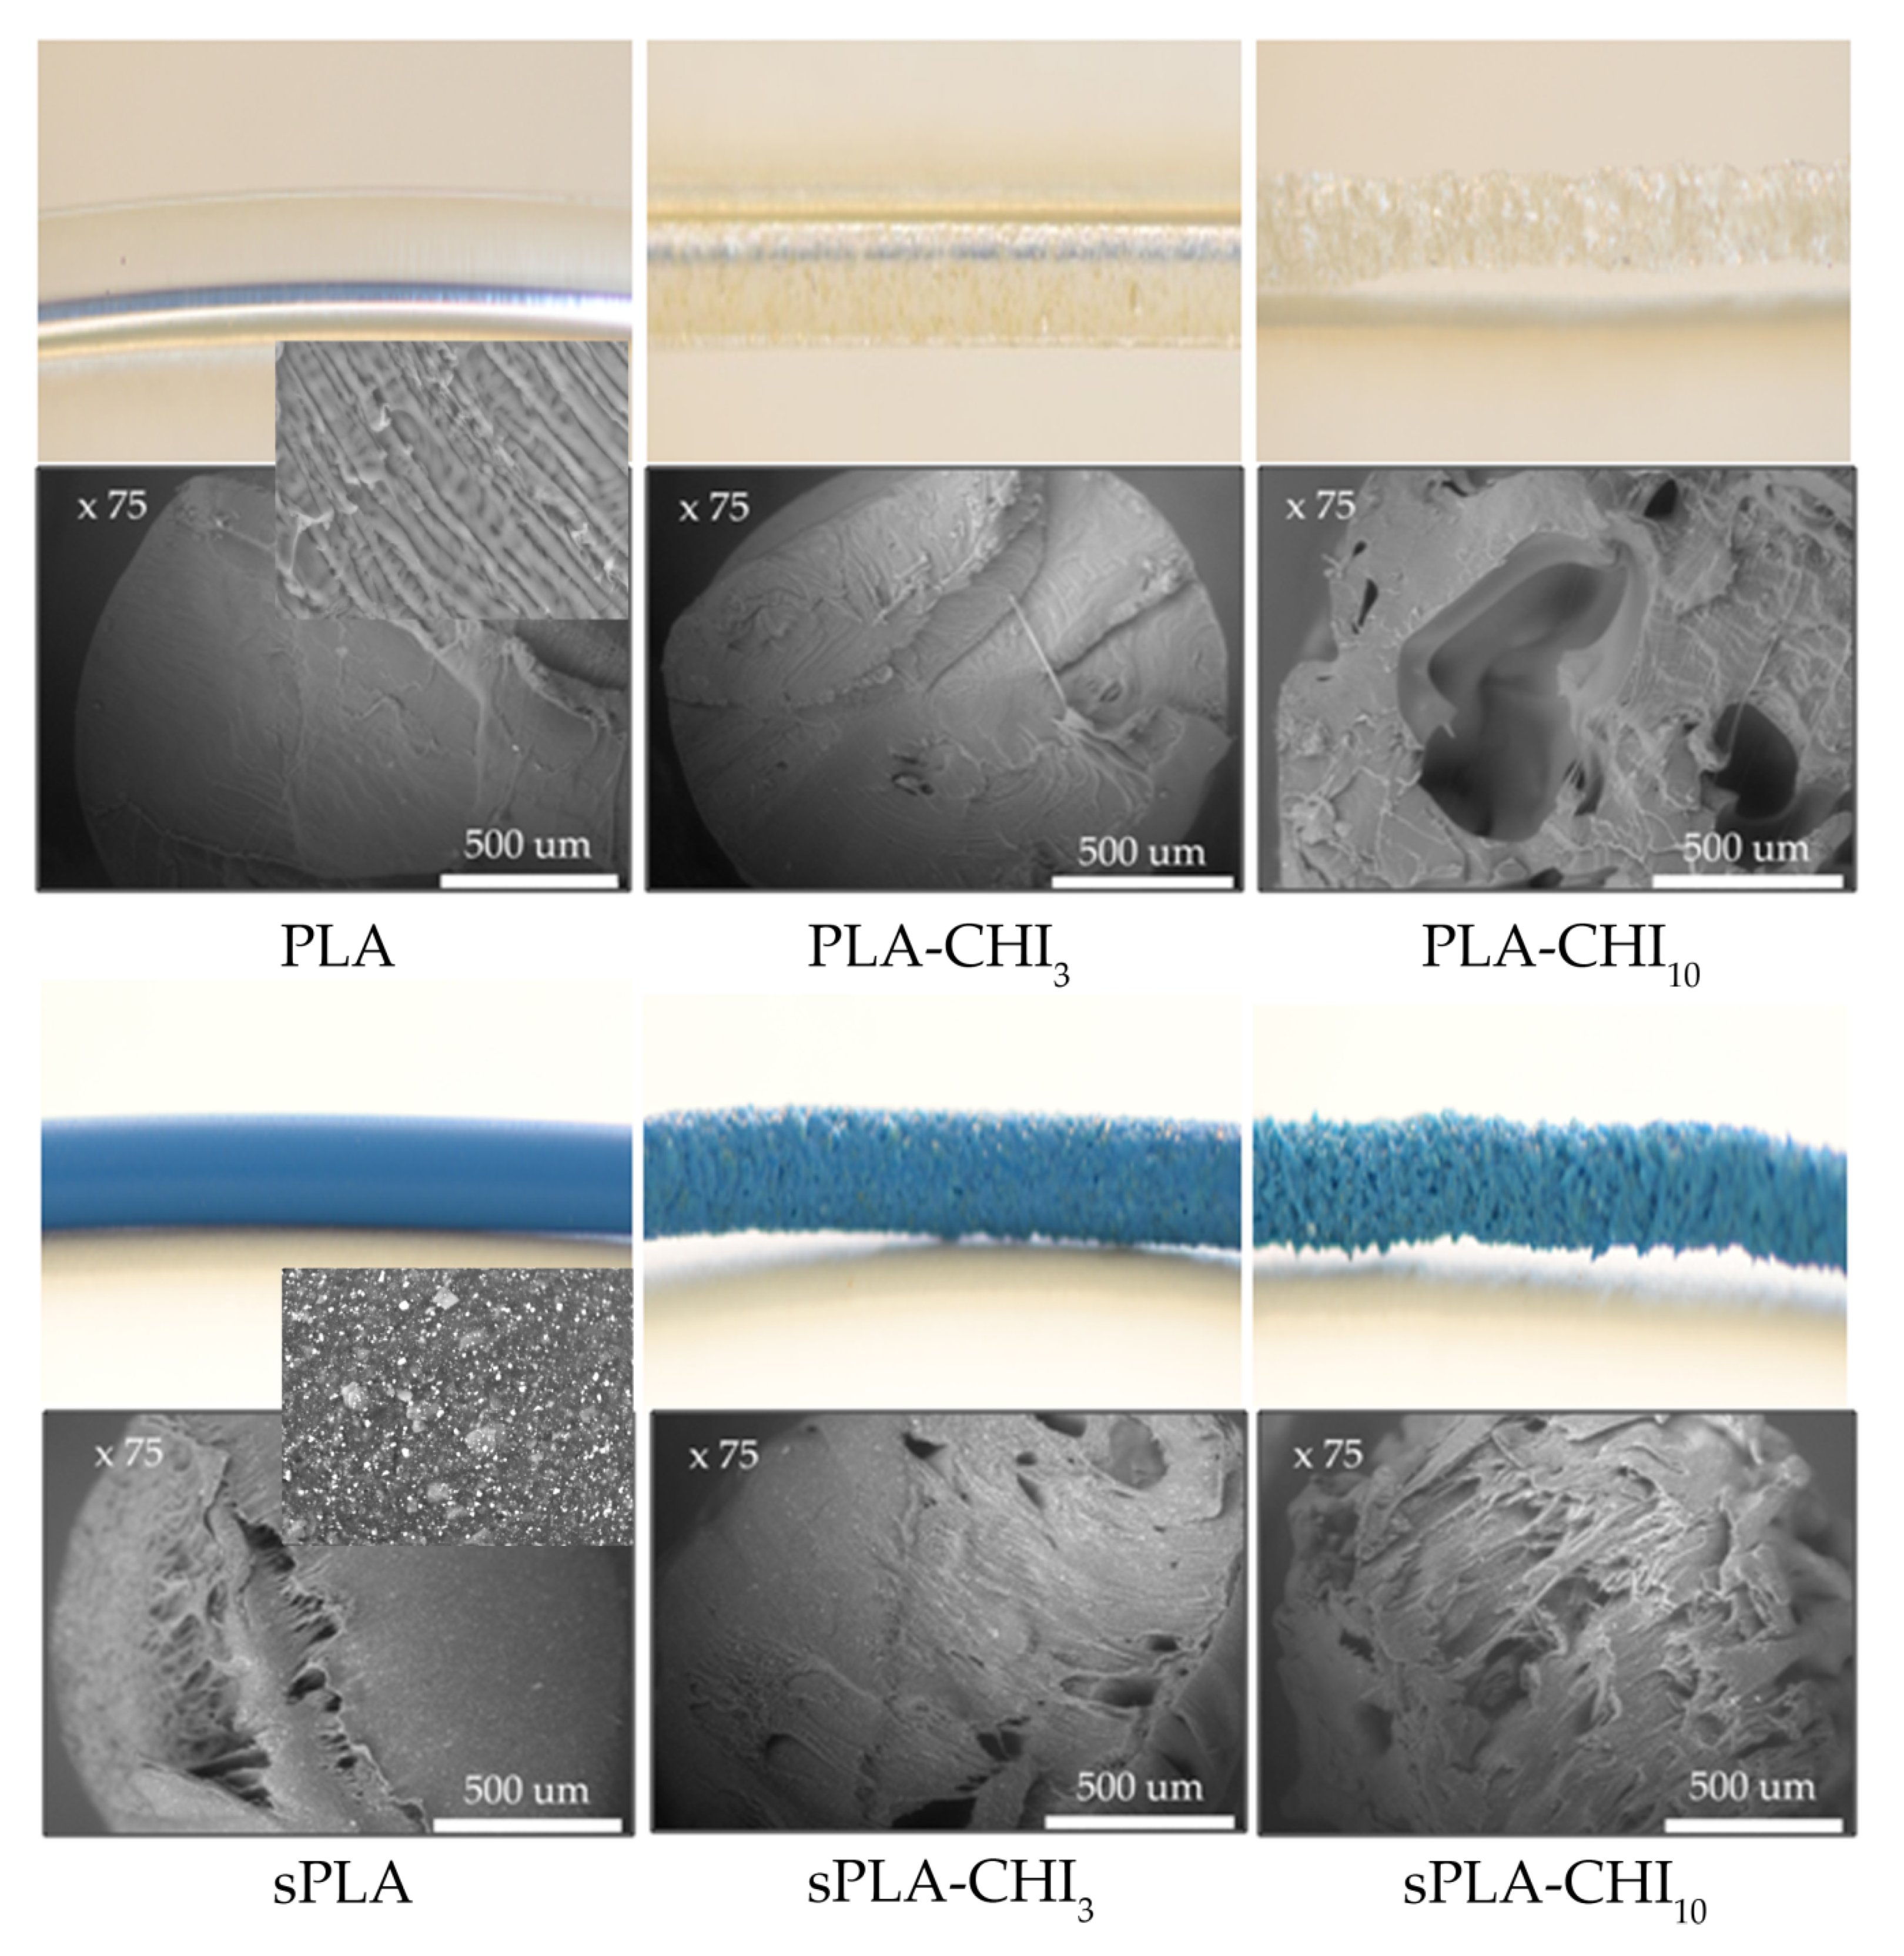
3.1. Structure of Filaments
3.2. Mechanical Properties
3.3. Thermal Properties
3.4. Antimicrobial Properties
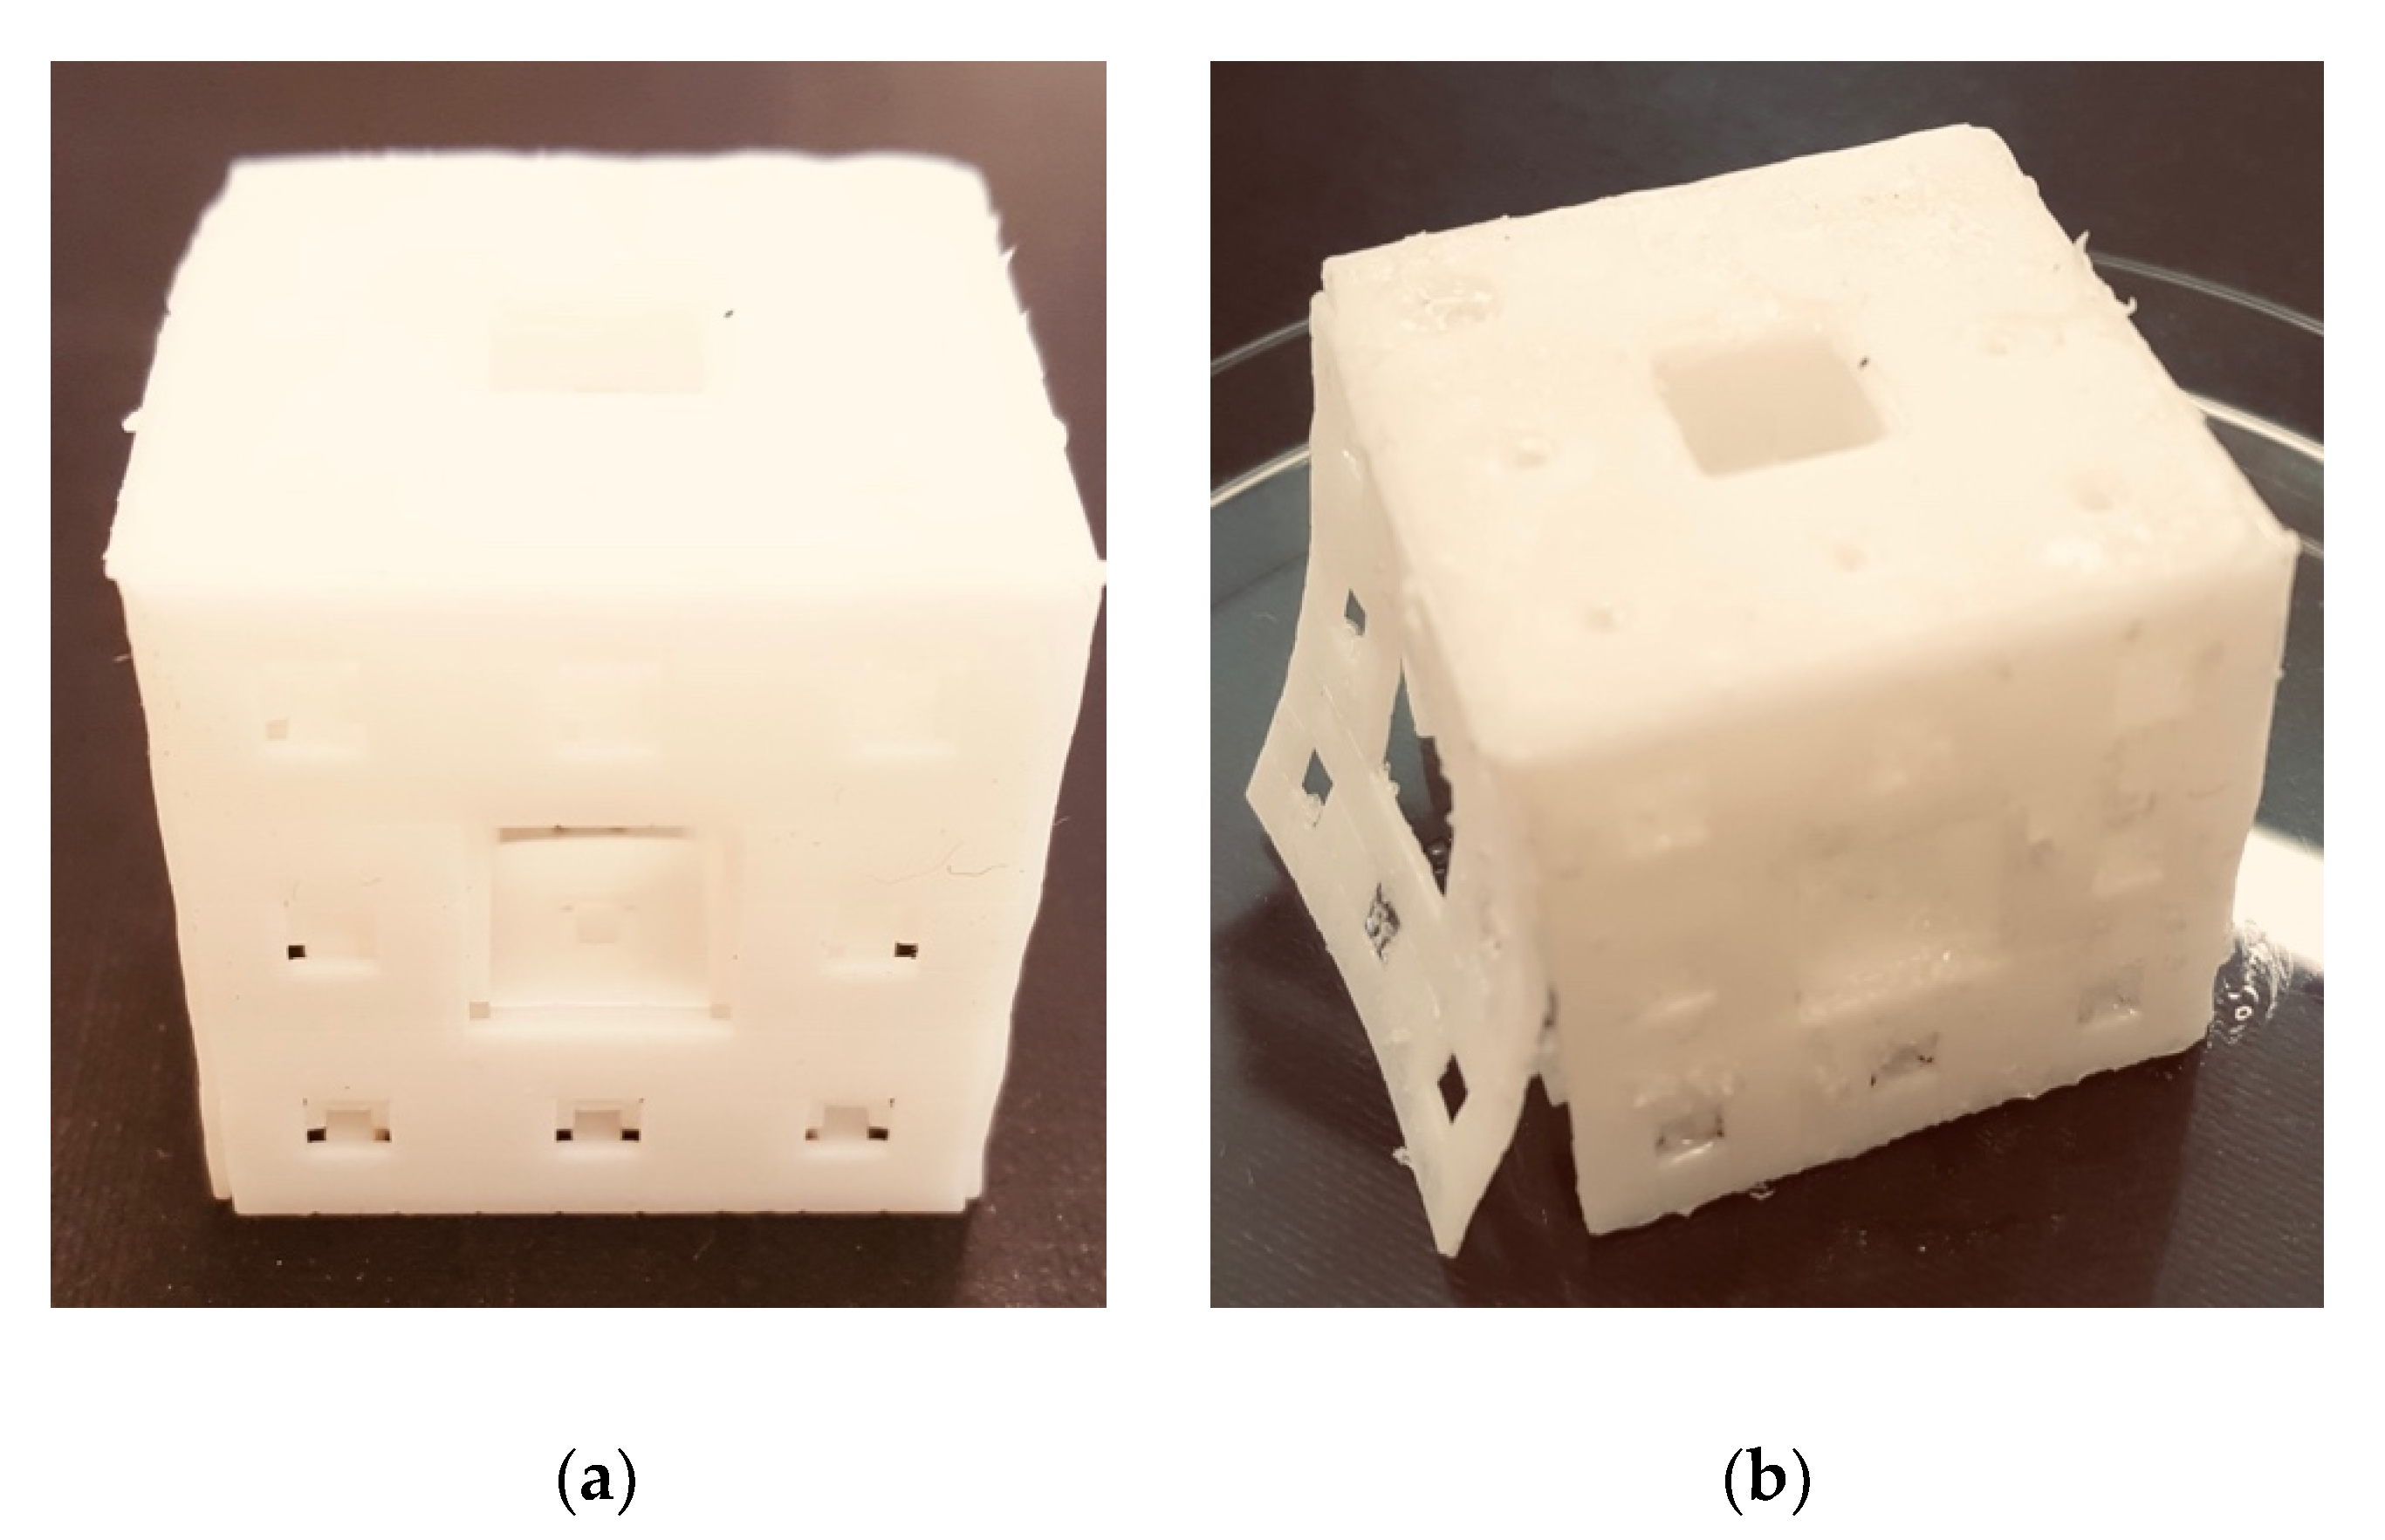
3.5. Sample Print Effect
4. Conclusions
Author Contributions
Funding
Acknowledgments
Conflicts of Interest
References
- Appuhamillage, G.A. New 3D Printable Polymeric Materials for Fused Filament Fabrication. Ph.D. Thesis, The University of Texas at Dallas, Richardson, TX, USA, 2018. [Google Scholar]
- Ackland, D.C.; Robinson, D.; Redhead, M.; Lee, P.V.S.; Moskaljuk, A.; Dimitroulis, G. A personalized 3D-printed prosthetic joint replacement for the human temporomandibular joint: From implant design to implantation. J. Mech. Behav. Biomed. Mater. 2017, 69, 404–411. [Google Scholar] [CrossRef]
- Mils, D.; Weisman, J.; Nicholson, C.; Jammalamadaka, U.; Tappa, K.; Wilson, C. Antibiotic and chemotherapeutic enhanced three-dimensional printer filament and constructs for biomedical applications. Int. J. Nanomed. 2015, 10, 357–370. [Google Scholar] [CrossRef]
- Ballard, D.H.; Tappa, K.; Boyer, C.J.; Jammalamadaka, U.; Hemmanur, K.; Weisman, J.A.; Alexander, J.S.; Mills, D.K.; Woodard, P.K. Antiibiotics in 3D-printed implants, instruments and materials: Benefits, challenges and future directions. J. 3D Print. Med. 2019, 3, 83–93. [Google Scholar] [CrossRef]
- Lee Ventola, C. Medical Applications for 3D Printing: Current and Projected Uses. Pharmacol. Ther. 2014, 39, 704–711. [Google Scholar]
- Tymrak, B.; Kreiger, M.; Pearce, J. Mechanical properties of components fabricated with open-source 3-D printers under realistic environmental conditions. Mater. Des. 2014, 58, 242–246. [Google Scholar] [CrossRef]
- Caulfield, B.; McHugh, P.; Lohfeld, S. Dependence of mechanical properties of polyamide components on build parameters in the SLS process. J. Mater. Process. Technol. 2007, 182, 477–488. [Google Scholar] [CrossRef]
- Garcia, C.R.; Correa, J.; Espalin, D.; Barton, J.H.; Rumpf, R.C.; Wicker, R.; Gonzalez, V. 3D printing of anisotropic metamaterials. Prog. Electromagn. Res. Lett. 2012, 34, 75–82. [Google Scholar] [CrossRef]
- Wang, X.; Jiang, M.; Zhou, Z.; Gou, J.; Hui, D. 3D printing of polymer matrix composites: A review and prospective. Compos. Part B Eng. 2017, 110, 442–458. [Google Scholar] [CrossRef]
- Jiang, T.; Munguia-Lopez, J.G.; Flores-Torres, S.; Kort-Mascortm, J.; Kinsella, J.M. Extrusion bioprinting of soft materials: An emerging technique for biological model fabrication. Appl. Phys. 2019, 6, 011310. [Google Scholar] [CrossRef]
- Tai, C.; Bouissil, S.; Gantumur, E.; Carranza, M.S.; Yoshii, A.; Sakai, S.; Pierre, G.; Michaud, P.; Delattre, C. Use of natural polysaccharides in the development of 3D bioprinting technology. Appl. Sci. 2019, 9, 2596. [Google Scholar] [CrossRef]
- Le Duigou, A.; Castro, M.; Bevan, R.; Martin, N. 3D printing of wood fibre biocomposites: From mechanical to actuation functionality. Mater. Design. 2016, 96, 106–114. [Google Scholar] [CrossRef]
- Muzarelli, R.A.A. Chitins and chitosans for the repair of wounded skin. Carbohydr. Polym. 2009, 76, 167–182. [Google Scholar] [CrossRef]
- Rinaudo, M. Chitin and chitosan: Properties and applications. Prog. Polym. Sci. 2006, 31, 603–632. [Google Scholar] [CrossRef]
- Vunain, E.; Mishra, A.K.; Mamba, B.B. Fundamentals of chitosan for biomedical applications. Chitosan Based Biomater. 2017, 1, 3–30. [Google Scholar]
- Kean, T.J.; Thanou, M. Utility of chitosan for 3D Printing and Bioprinting. In Sustainable Agriculture Reviews; Springer: Cham, Switzerland, 2019; Volume 35, pp. 279–284. [Google Scholar]
- Bergonzi, C.; Di Natale, A.; Zimetti, F.; Marchi, C.; Bianchera, A.; Bernini, F.; Silvestri, M.; Bettini, R.; Elviri, L. Study of 3D-printed chitosan scaffold features after different post-printing gelation processes. Sci. Rep. 2019, 9, 362. [Google Scholar] [CrossRef] [PubMed]
- Wang, X.; Wei, C.; Cao, W.; Jiang, L.; Hou, Y.; Chang, J. Fabrication of Multiple-layered Hydrogel Sacaffolds with Elaborate Structure and Good Mechanical Properties via 3D-printing and Ionic Reinforcment. ACS Appl. Mater. Interfaces 2018, 10, 18338–18350. [Google Scholar] [CrossRef] [PubMed]
- Li, H.; Tan, Y.J.; Liu, S.; Li, L. Three-dimensional bioprinting of oppositely charged hydrogels with super strong interface bonding. ACS Appl. Mater. Interfaces 2018, 10, 11164–11174. [Google Scholar] [CrossRef]
- Cai, K.; Yao, K.; Cui, Y.; Lin, S.; Yang, Z.; Li, X.; Xie, H.; Qing, T.; Luo, J. Surface modification of poly (D, L-lactic acid) with chitosan and its effects on the culture of osteoblasts in vitro. J. Biomed. Mater. Res. 2002, 60, 398–404. [Google Scholar] [CrossRef]
- Wang, J.; Nor Hidayah, Z.; Razak, S.I.A.; Kadir, M.R.A.; Nayan, N.H.M.; Li, Y.; Amin, K.A.M. Surface entrapment of chitosan on 3D printed polylactic acid scaffold and its biomimetic growth of hydroxyapatite. Compos. Interfaces 2019, 26, 465–478. [Google Scholar] [CrossRef]
- Sébastien, F.; Stéphane, G.; Copinet, A.; Coma, V. Novel biodegradable films made from chitosan and poly (lactic acid) with antifungal properties against mycotoxinogen strains. Carbohydr. Polym. 2006, 65, 185–193. [Google Scholar] [CrossRef]
- Grande, R.; Carvalho, A.J.F. Compatible ternary blends of chitosan/poly (vinyl alcohol)/poly (lactic acid) produced by oil-in-water emulsion processing. Biomacromolecules 2011, 12, 907–914. [Google Scholar] [CrossRef] [PubMed]
- Wu, C.S. Modulation, functionality, and cytocompatibility of. three-dimensional printing materials made from chitosan-based polysaccharide composites. Mater. Sci. Eng. C 2016, 69, 27–36. [Google Scholar] [CrossRef] [PubMed]
- Mohanty, A.K.; Misra, M.; Drzal, L.T. Natural Fibers, Biopolymers, and Biocomposites, 1st ed.; CRC press: Boca Raton, FL, USA, 2005; pp. 2–31. [Google Scholar]
- Ngo, T.D.; Kashani, A.; Imbalzano, G.; Nguyen, K.T.Q.; Hui, D. Additive manufiacturing (3D printing): A review of materials, methods, applications and challenges. Compos. Part B 2018, 143, 172–196. [Google Scholar] [CrossRef]
- Cheng, Y.; Deng, S.; Chen, P.; Ruan, R. Polylactic acid (PLA) synthesis and modifications: A review. Front. Chem. China 2009, 4, 259–264. [Google Scholar] [CrossRef]
- Auras, R.; Harte, B.; Selke, S. An Overview of Polylactides as Packaging Materials. Macromol. Biosci. 2004, 4, 835–864. [Google Scholar] [CrossRef]
- Daver, F.; Marcian Lee, K.P.; Brandt, M.; Shanks, R. Cork–PLA composite filaments for fused deposition modelling. Compos. Sci. Technol. 2018, 168, 230–237. [Google Scholar] [CrossRef]
- Chieng, B.W.; Ibrahim, N.A.; Yunus, W.M.Z.W.; Hussein, M.Z. Poly (lactic acid)/Poly (ethylene glycol) Polymer Nanocomposites: Effects of Graphene Nanoplatelets. Polymers 2014, 6, 93–104. [Google Scholar] [CrossRef]
- Yang, H.M.; Lee, H.J.; Jang, K.S.; Park, C.W.; Yang, H.W.; Heo, W.D.; Kim, J.D. Poly (amino acid)-coated iron oxide nanoparticles as ultra-small magnetic resonance probes. J. Mater. Chem. 2009, 19, 4566–4574. [Google Scholar] [CrossRef]
- Palacio, J.; Orozco, W.H.; López, B.L. Effect of the Molecular weight on the Physicochemical Properties of Poly (lactic acid) Nanoparticles and on the Amount of Ovoalbumin Adsorption. J. Braz. Chem. Soc. 2011, 22, 2304–2311. [Google Scholar]
- Popa, E.E.; Rapa, M.; Popa, O.; Mustatea, G.; Popa, V.I.; Mitelut, A.C.; Popa, M.E. Polylactic Acid/Cellulose Fibres Based Composites for Food Packaging Applications. Mater. Plast. 2017, 54, 673–677. [Google Scholar]
- Staroszczyk, H.; Sztuka, K.; Wolska, J.; Wojtasz-Pająk, A.; Kołodziejska, I. Interactions of fish gelatin and chitosan in uncrosslinked and crosslinked with EDC films: FT-IR study. Spectrochim. Acta Part A Mol. Biomol. Spectrosc. 2014, 117, 707–712. [Google Scholar] [CrossRef] [PubMed]
- Kasaai, M.R. A review of several reported procedures to determine the degree of N-acetylation for chitin and chitosan using infrared spectroscopy. Carbohydr. Polym. 2008, 71, 497–508. [Google Scholar] [CrossRef]
- Číková, E.; Kuliček, J.; Janigová, I.; Omastová, M. Electrospinning of Ethylene Vinyl Acetate/Poly (Lactic Acid) Blends on a Water Surface. Materials 2018, 11, 1737. [Google Scholar] [CrossRef] [PubMed]
- Kamthai, S.; Magaraphan, R. Thermal and mechanical properties of polylactic acid (PLA) and bagasse carboxymethyl cellulose (CMCB) composite by adding isosorbide diesters. In AIP Conference Proceedings; AIP Publishing: College Park, MD, USA, 2015; Volume 1664, p. 060006. [Google Scholar]
- Farah, S.; Anderson, D.G.; Manger, R. Physical and mechanical properties of PLA, and their functions in widespread applications—A comprehensive review. Adv. Drug Deliv. Rev. 2016, 107, 367–392. [Google Scholar] [CrossRef] [PubMed]
- Mirón, V.; Ferrándiz, S.; Juárez, D.; Mengual, A. Manufacturing and characterization of 3D printer filament using tailoring materials. Procedia Manuf. 2017, 13, 888–894. [Google Scholar] [CrossRef]
- Vanleene, M.; Ray, C.; Ho Ba Tho, M.C. Relationships between density and Young’s modulus with microporosity and physico-chemical properties of Wistar rat cortical bone from growth to senescence. Med. Eng. Phys. 2008, 30, 1049–1056. [Google Scholar] [CrossRef] [PubMed]
- Materials Data Book. Available online: http://www-mdp.eng.cam.ac.uk/web/library/enginfo/cueddatabooks/materials.pdf (accessed on 3 July 2019).
- Carrasco, F.; Pagès, P.; Gámez-Pérez, J.; Santana, O.O.; Maspoch, M.L. Processinfg of poly (lactic acid): Characterization of chemical structure, thermal stability and mechanical properties. Polym. Degrad. Stab. 2010, 95, 116–125. [Google Scholar] [CrossRef]
- Noootsuwan, N.; Wattanathana, W.; Jongrungruangchok, S.; Veranitisagul, C.; Koonsaeng, N.; Laobuthee, A. Development of novel hybrid materials from polylactic acid and nano-silver coated carbon black with distinct antimicrobial and electrical properties. J. Polym. Res. 2018, 25, 90. [Google Scholar] [CrossRef]
- Mucha, M.; Królikowski, Z. Application of dsc to study crystallization kinetics of polypropylene containing fillers. J. Therm. Anal. Calorim. 2003, 74, 549–557. [Google Scholar] [CrossRef]
- Bonilla, J.; Fortunati, E.; Vargas, M.; Chiralt, A.; Kenny, J.M. Effect of chitosan on the phisicochemical and antimicrobial properties of PLA films. J. Food Eng. 2016, 119, 236–243. [Google Scholar] [CrossRef]
- Fortunati, E.; Peltzer, M.; Armentano, I.; Torre, L.; Jiménez, A.; Kenny, J.M. Effects of modified cellulose nanocrystals on the barrier and migration properties of PLA nano-biocomposites. Carbohydr. Polym. 2012, 90, 948–956. [Google Scholar] [CrossRef]
- Goy, R.C.; de Britto, D.; Assis, O.B.G. A Review of the Antimicrobial Activity of Chitosan. Polímeros 2009, 19, 241–247. [Google Scholar] [CrossRef]
- Kong, M.; Chen, X.G.; Xing, K.; Park, H.J. Antimicrobial properties of chitosan and mode of action: A state of the art review. Int. J. Food Microbiol. 2010, 144, 51–63. [Google Scholar] [CrossRef]
- Xie, W.; Xu, P.; Wang, W.; Liu, Q. Preparation and antibacterial activity of a water-soluble chitosan derivative. Carbohydr. Polym. 2002, 1, 35–40. [Google Scholar] [CrossRef]
- Mania, S.; Tylingo, R.; Augustin, E.; Gucwa, K.; Szwacki, J.; Staroszczyk, H. Investigation of an elutable N-propylphosphonic acid chitosan derivative composition with a chitosan matrix prepared from carbonic acid solution. Cabohydr. Polym. 2018, 179, 196–206. [Google Scholar] [CrossRef] [PubMed]
- Damian, L.; Paţchia, S. Method for Testing the Antimicrobial Character of the Materials and Their Fitting to the Scope. Bull. Transilv. Univ. Braș. 2014, 7, 37–44. [Google Scholar]
- Kaźmierczak, D.; Guzińska, K.; Dymel, M. Antibacterial Activity of PLA Fibers Estimated by Quantitative Methods. Fibres Text. East. Eur. 2016, 2, 126–130. [Google Scholar] [CrossRef]


| Type of Filament | Description |
|---|---|
| PLA | Polylactic acid |
| PLA-CHI3 | Polylactic acid modified with 3% (w/w) addition of chitosan |
| PLA-CHI10 | Polylactic acid modified with 10% (w/w) addition of chitosan |
| sPLA | Soft form of polylactic acid |
| sPLA-CHI3 | Soft form of polylactic acid modified with 3% (w/w) addition of chitosan |
| sPLA-CHI10 | Soft form of polylactic acid modified with 10% (w/w) addition of chitosan |
| Type of Filament | Density [g/mL] |
|---|---|
| PLA | 1.28 ± 0.006 a |
| PLA-CHI3 | 1.23 ± 0.025 a |
| PLA-CHI10 | 0.70 ± 0.008 b |
| sPLA | 1.47 ± 0.044 A |
| sPLA-CHI3 | 1.35 ± 0.069 A |
| sPLA-CHI10 | 1.11 ± 0.023 B |
| Type of Filament | Diameter [mm] | Tensile Strenght [MPa] | Elongation at Break [%] | Young’s Modulus [MPa] |
|---|---|---|---|---|
| PLA | 1.74 ± 0.02 a | 58.9 ± 1.4 a | 32.8 ± 2.2 a | 1987 ± 72 a |
| PLA-CHI3 | 1.76 ± 0.09 a | 61.4 ± 0.6 a | 6.3 ± 0.6 b | 2018 ± 102 a |
| PLA-CHI10 | 1.77 ± 0.05 a | 24.9 ± 1.4 b | 2.9 ± 0.4 c | 1428 ± 85 b |
| sPLA | 1.75 ± 0.01 A | 17.0 ± 0.3 A | 572.2 ± 50.3 A | 16.4 ± 2.1 A |
| sPLA-CHI3 | 1.77 ± 0.03 A | 8.7 ± 0.4 B | 25.3 ± 2.83 B | 15.9 ± 1.7 A |
| sPLA-CHI10 | 1.75 ± 0.02 A | 7.6 ± 0.3 C | 9.1 ± 0.75 C | 3.8 ± 0.4 B |
| Type of Filament | Tg [°C] | Tc [°C] | Tm [°C] |
|---|---|---|---|
| PLA | 63.9 | - | 154.1 |
| PLA-CHI3 | 63.0 | 123.2 | 152.6 |
| PLA-CHI10 | 61.9 | 125.6 | 152.0 |
| sPLA | 66.7 | 99.9 | 154.5 |
| sPLA-CHI3 | 63.1 | 95.5 | 152.8 |
| sPLA-CHI10 | 64.4 | 95.1 | 151.0 |
| Type of Filament | cfu/mL | Average Reduction [%] | Average Reduction [log] |
|---|---|---|---|
| Inoculum | 5.36 · 105 | - | - |
| PLA * | 7.62·105 [6.45·105] | −32.16 [−18.41] | −0.15 [−0.08] |
| PLA-CHI3 * | 3.23·105 [3.08·105] | 39.74 [41.27] | 0.22 [0.24] |
| PLA-CHI10 | 7.01·104 | 86.92 | 0.88 |
| sPLA | 6.99·105 | −30.41 | −0.12 |
| sPLA-CHI3 | 3.54·105 | 33.96 | 0.18 |
| sPLA-CHI10 | 2.87·105 | 46.46 | 0.27 |
| Type of Filament | cfu/mL | Average Reduction [%] | Average Reduction [log] |
|---|---|---|---|
| Inoculum | 4.23 · 105 | - | - |
| PLA * | 4.96·105 [5.04·105] | −17.26 [−18.41] | −0.07 [−0.08] |
| PLA-CHI3 * | 3.84·105 [3.75·105] | 9.22 [12.06] | 0.04 [0.05] |
| PLA-CHI10 | 2.64·105 | 37.59 | 0.20 |
| sPLA | 4.74·105 | −12.06 | 0.05 |
| sPLA-CHI3 | 3.99·105 | 5.67 | 0.03 |
| sPLA-CHI10 | 3.35·105 | 20.80 | 0.10 |
© 2019 by the authors. Licensee MDPI, Basel, Switzerland. This article is an open access article distributed under the terms and conditions of the Creative Commons Attribution (CC BY) license (http://creativecommons.org/licenses/by/4.0/).
Share and Cite
Mania, S.; Ryl, J.; Jinn, J.-R.; Wang, Y.-J.; Michałowska, A.; Tylingo, R. The Production Possibility of the Antimicrobial Filaments by Co-Extrusion of the PLA Pellet with Chitosan Powder for FDM 3D Printing Technology. Polymers 2019, 11, 1893. https://doi.org/10.3390/polym11111893
Mania S, Ryl J, Jinn J-R, Wang Y-J, Michałowska A, Tylingo R. The Production Possibility of the Antimicrobial Filaments by Co-Extrusion of the PLA Pellet with Chitosan Powder for FDM 3D Printing Technology. Polymers. 2019; 11(11):1893. https://doi.org/10.3390/polym11111893
Chicago/Turabian StyleMania, Szymon, Jacek Ryl, Jia-Rong Jinn, Ya-Jane Wang, Anna Michałowska, and Robert Tylingo. 2019. "The Production Possibility of the Antimicrobial Filaments by Co-Extrusion of the PLA Pellet with Chitosan Powder for FDM 3D Printing Technology" Polymers 11, no. 11: 1893. https://doi.org/10.3390/polym11111893
APA StyleMania, S., Ryl, J., Jinn, J.-R., Wang, Y.-J., Michałowska, A., & Tylingo, R. (2019). The Production Possibility of the Antimicrobial Filaments by Co-Extrusion of the PLA Pellet with Chitosan Powder for FDM 3D Printing Technology. Polymers, 11(11), 1893. https://doi.org/10.3390/polym11111893