Quantification Methods for Textile-Adhered Bacteria: Extraction, Colorimetric, and Microscopic Analysis


Abstract

1. Introduction
2. Materials and Methods
2.1. Materials
2.2. Adhering Bacteria to Substrates
2.3. Evaluation Methods for Bacterial Adhesion on Polymeric Substrates
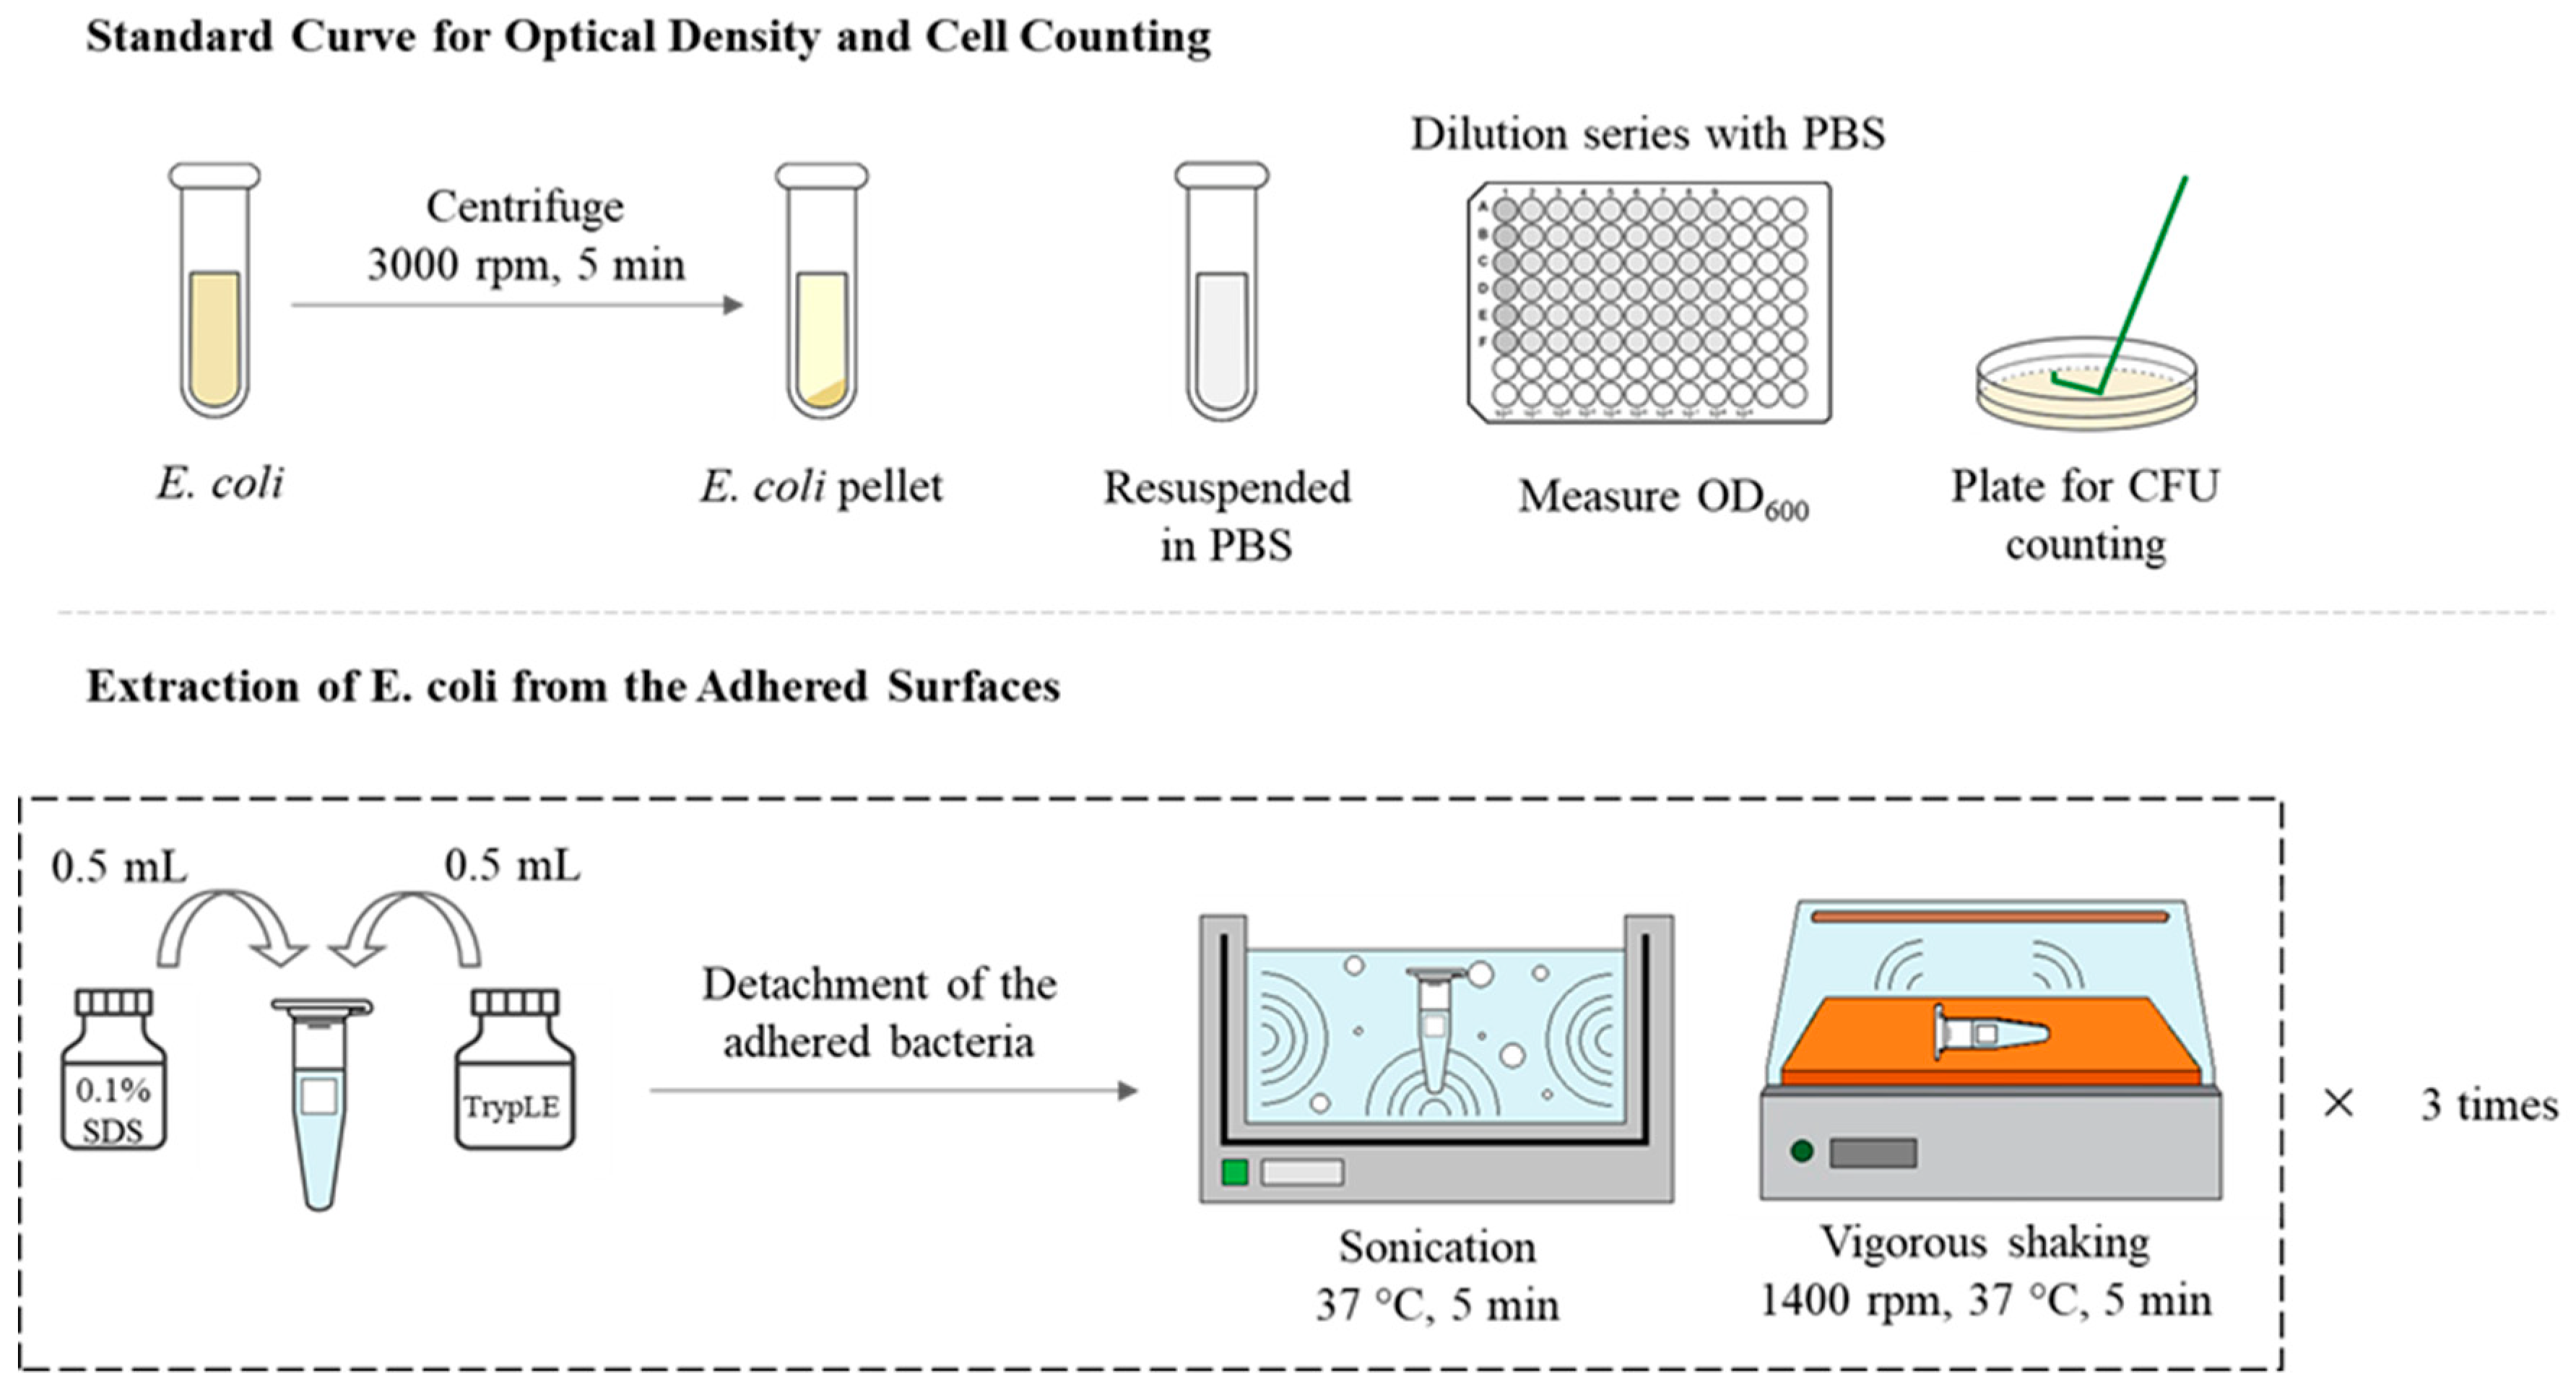
2.3.1. Method 1: Extraction of Surface-Adhered Bacteria and CFU Counting
2.3.2. Method 2: INT-staining of Bacteria and Colorimetric Analysis
2.3.3. Method 3: Microscopic Analysis
2.4. Statistical Analysis
3. Results and Discussion
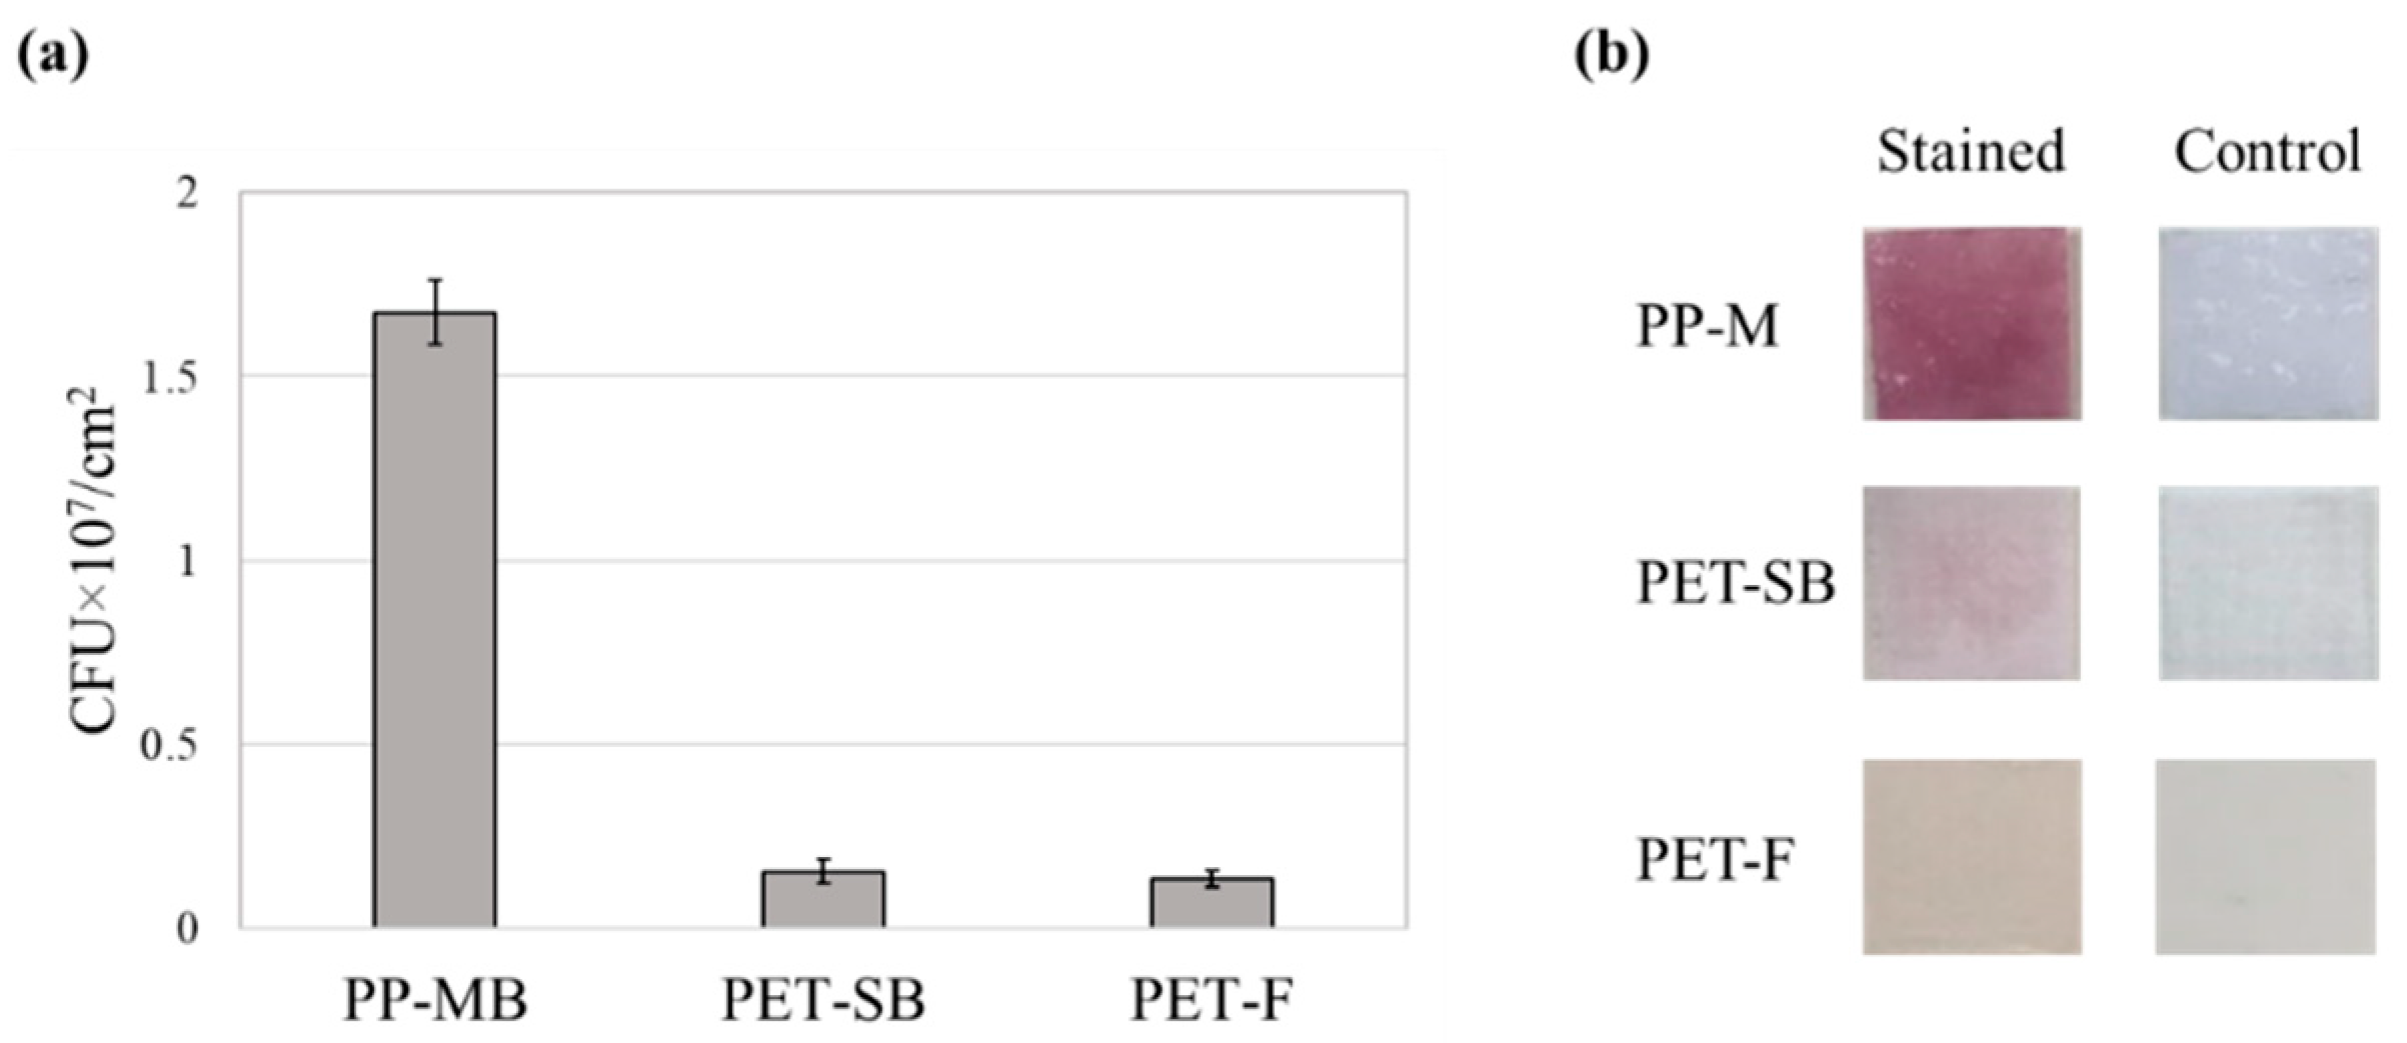
3.1. Method 1: Extraction Method
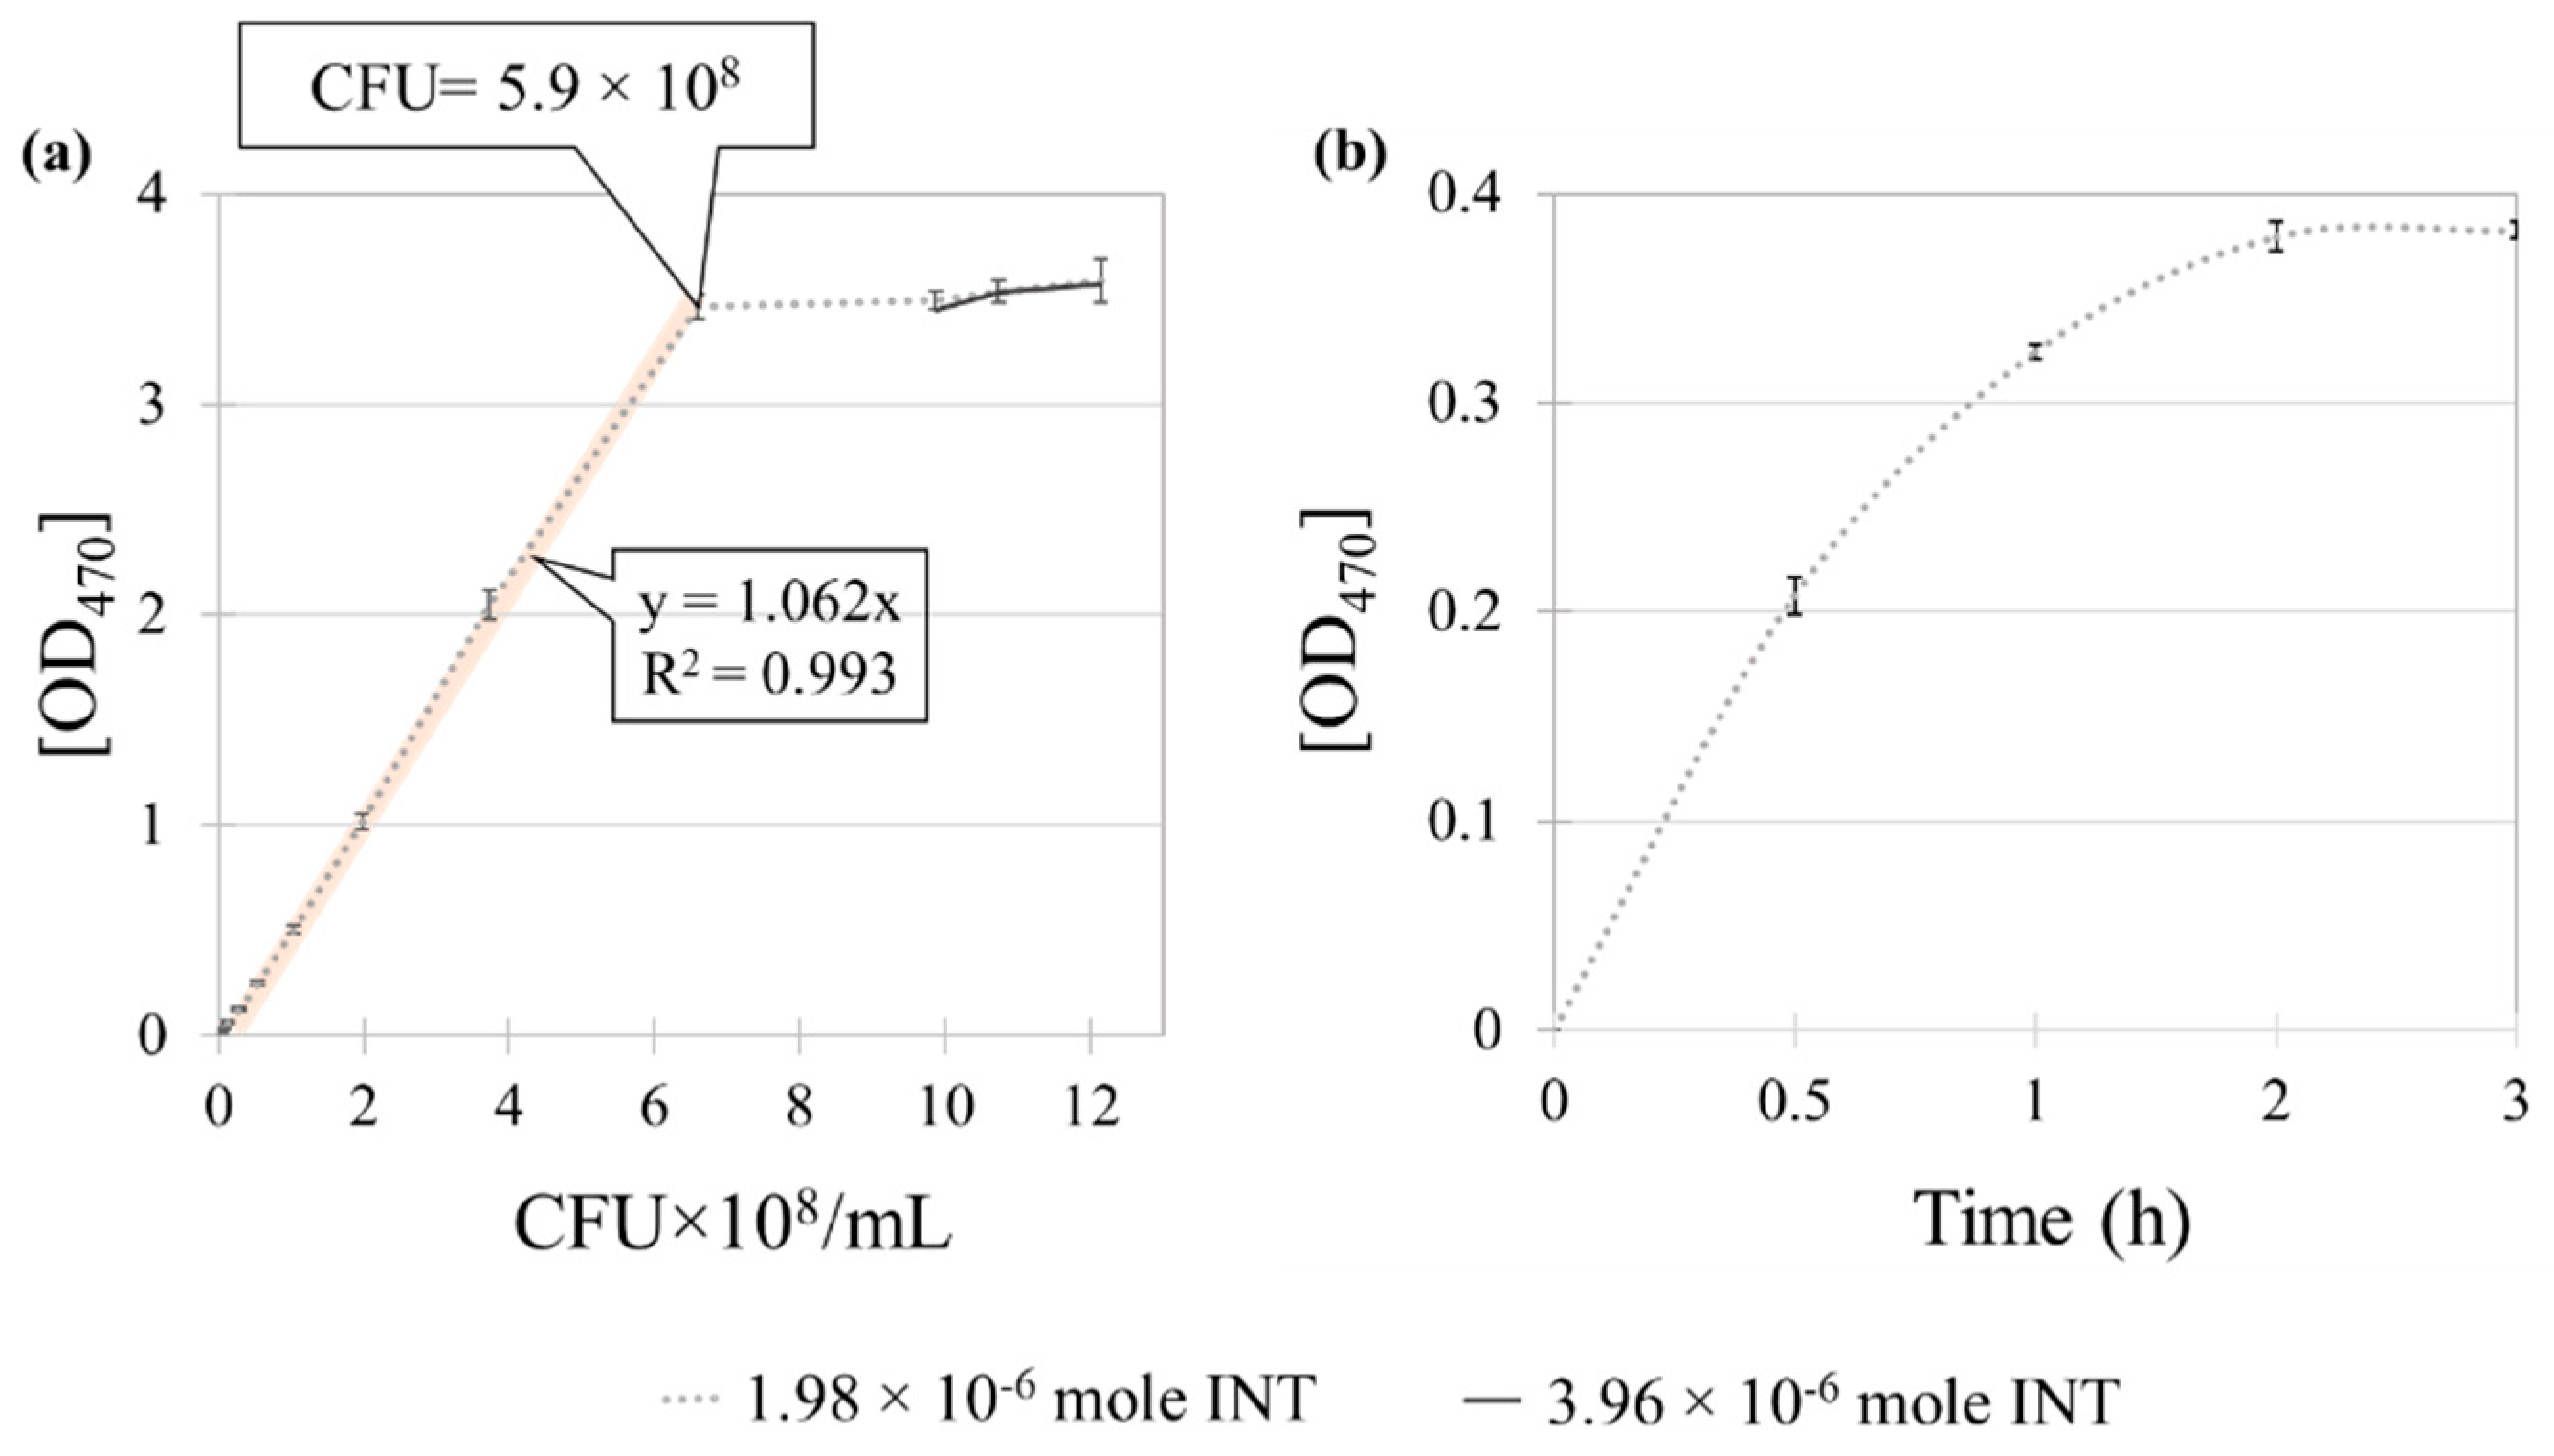
3.2. Method 2: Colorimetric Analysis with INT Staining
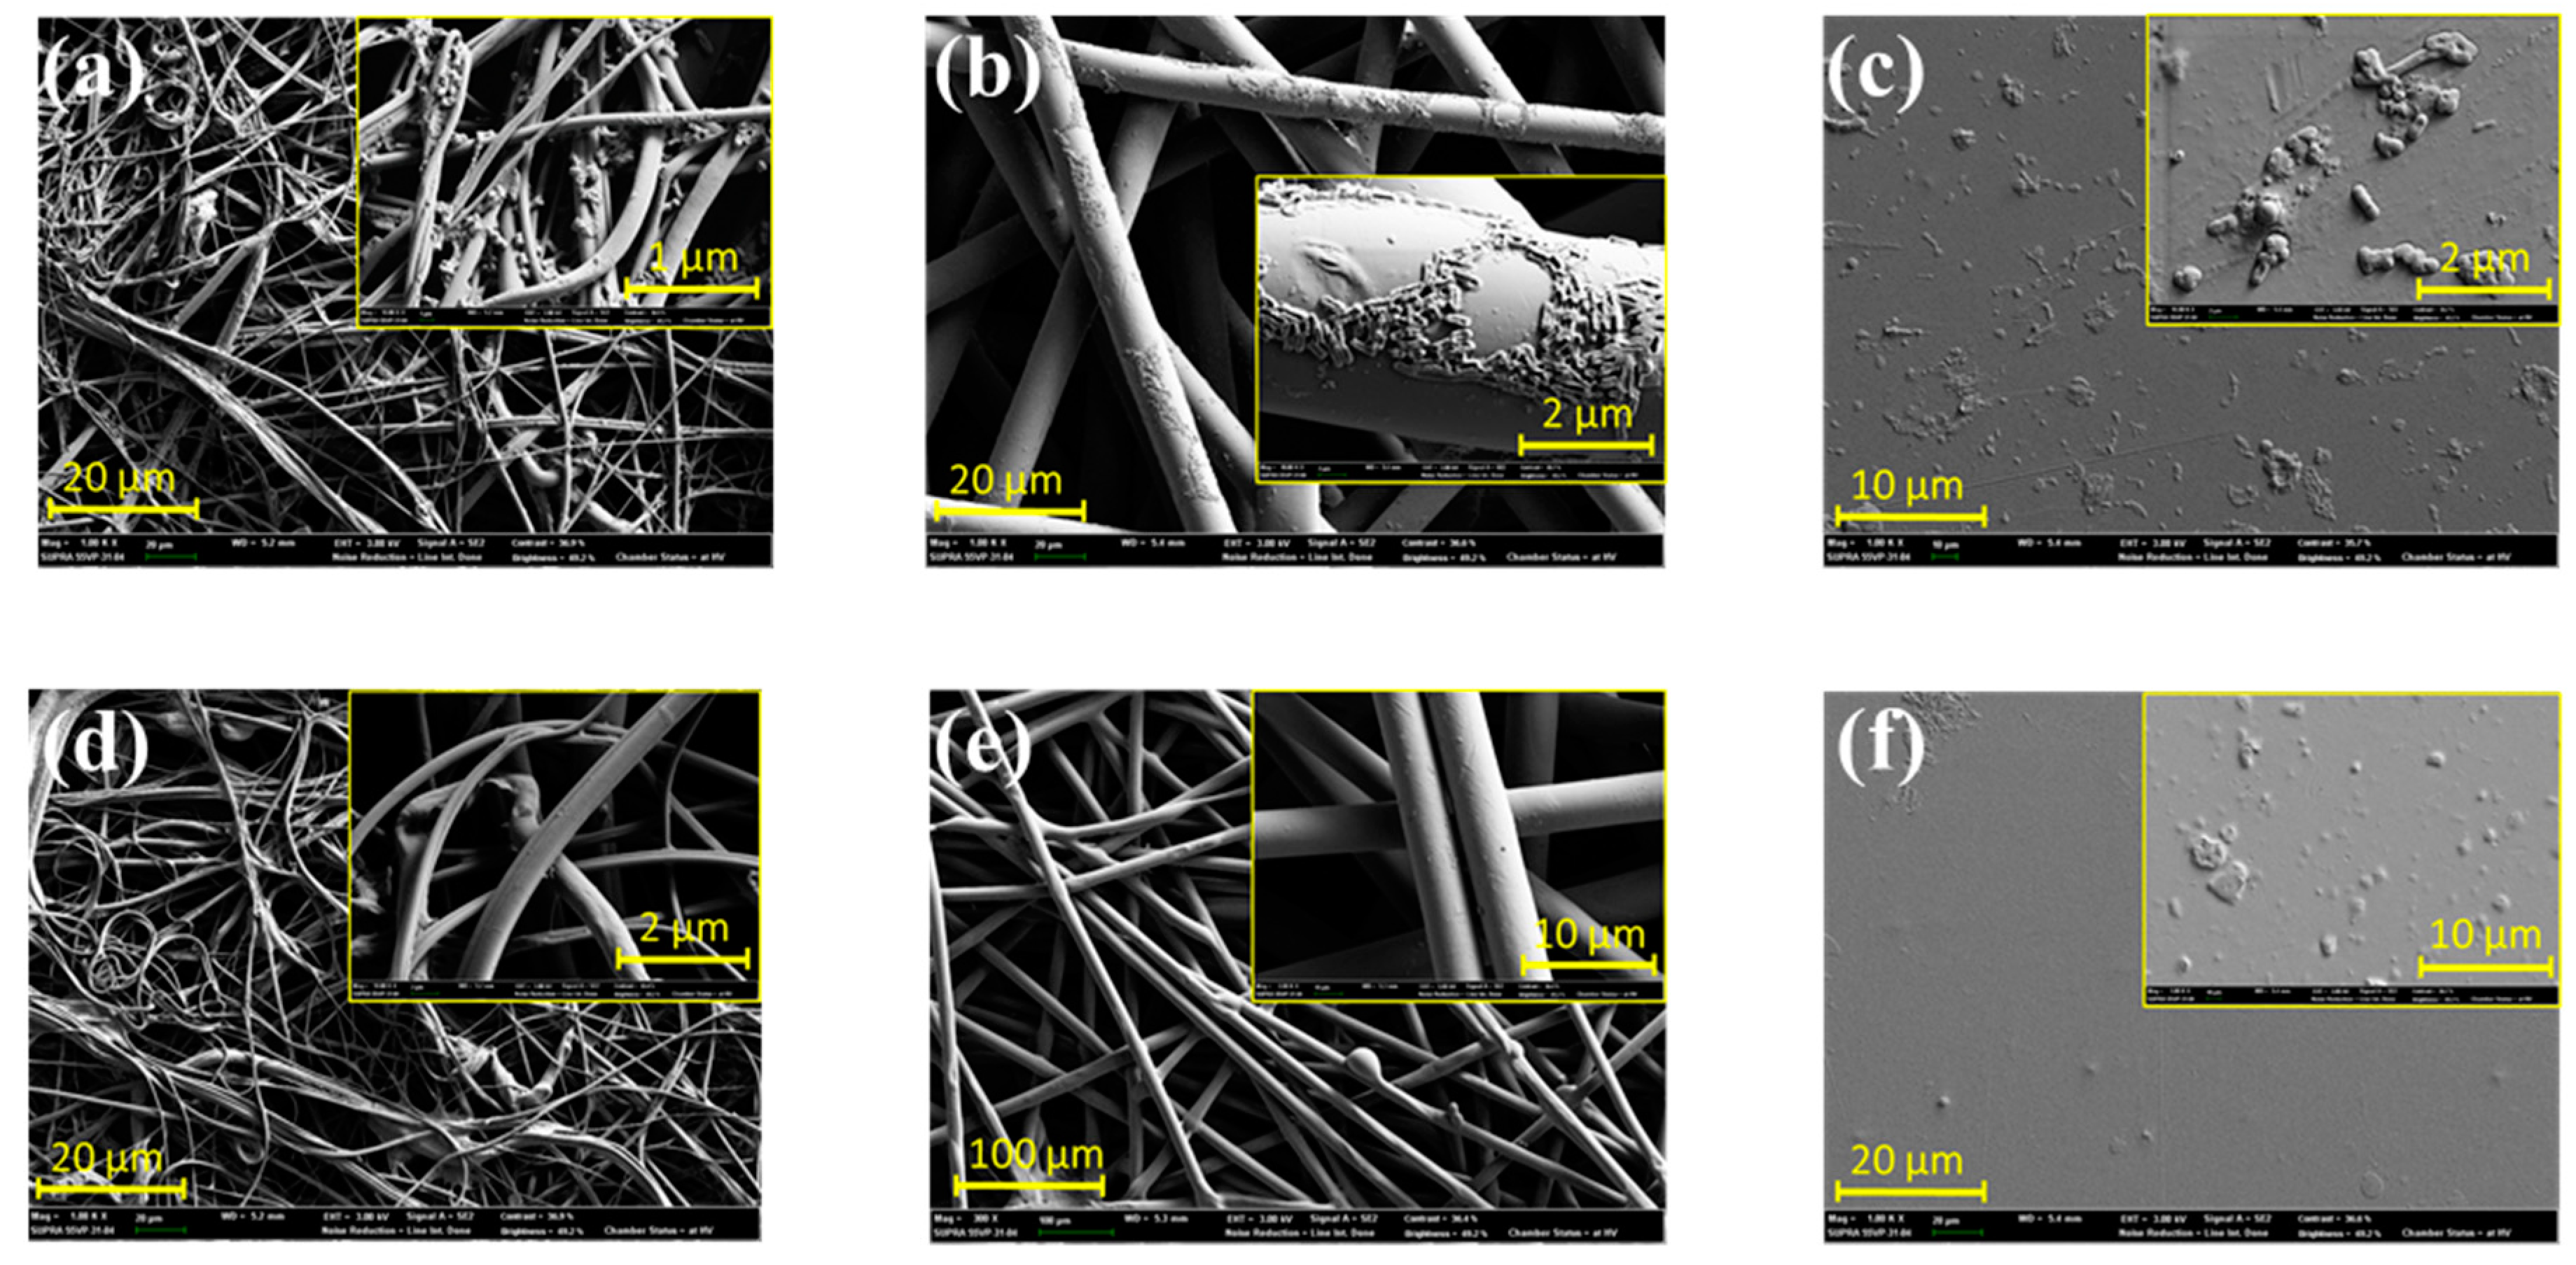
3.3. Method 3: Microscopic Analysis
3.4. Comparison of Methods
4. Conclusions
Author Contributions
Funding
Acknowledgments
Conflicts of Interest
References
- Lorenzetti, M.; Dogša, I.; Stošicki, T.; Stopar, D.; Kalin, M.; Kobe, S.; Novak, S. The influence of surface modification on bacterial adhesion to titanium-based substrates. ACS Appl. Mater. Interfaces 2015, 7, 1644–1651. [Google Scholar] [CrossRef] [PubMed]
- Damodaran, V.B.; Murthy, N.S. Bio-Inspired strategies for designing antifouling biomaterials. Biomaterials 2016, 20, 18. [Google Scholar] [CrossRef] [PubMed]
- Wang, B.; Jin, T.; Xu, Q.; Liu, H.; Ye, Z.; Chen, H. Direct loading and tunable release of antibiotics from polyelectrolyte multilayers to reduce bacterial adhesion and biofilm formation. Bioconjugate Chem. 2016, 27, 1305–1313. [Google Scholar] [CrossRef] [PubMed]
- Hori, K.; Matsumoto, S. Bacterial adhesion:from mechanism to control. Biochem. Eng. J. 2010, 48, 424–434. [Google Scholar] [CrossRef]
- Dhand, C.; Harini, S.; Venkatesh, M.; Dwivedi, N.; Ng, A.; Liu, S.; Verma, N.K.; Ramakrishna, S.; Beuerman, R.W.; Loh, X.J.; et al. Multifunctional polyphenols- and catecholamines-based self-defensive films for health care applications. ACS Appl. Mater. Interfaces 2016, 8, 1220–1232. [Google Scholar] [CrossRef]
- Ong, Y.-L.; Razatos, A.; Georgiou, G.; Sharma, M.M. Adhesion forces between E. coli bacteria and biomaterial surfaces. Langmuir 1999, 15, 2719–2725. [Google Scholar] [CrossRef]
- Wei, T.; Tang, Z.; Yu, Q.; Chen, H. Smart antibacterial surfaces with switchable bacteria-killing and bacteria-releasing capabilities. ACS Appl. Mater. Interfaces 2017, 9, 37511–37523. [Google Scholar] [CrossRef]
- Tamayo, L.; Azócar, M.; Kogan, M.; Riveros, A.; Páez, M. Copper-polymer nanocomposites: An excellent and cost-effective biocide for use on antibacterial surfaces. Mater. Sci. Eng. C 2016, 69, 1391–1409. [Google Scholar] [CrossRef]
- Cheng, G.; Zhang, Z.; Chen, S.; Bryers, J.D.; Jiang, S. Inhibition of bacterial adhesion and biofilm formation on zwitterionic surfaces. Biomaterials 2007, 28, 4192–4199. [Google Scholar] [CrossRef]
- Ward, M.A.; Georgiou, T.K. Thermoresponsive polymers for biomedical applications. Polymers 2011, 3, 1215–1242. [Google Scholar] [CrossRef]
- Paladini, F.; Pollini, M.; Sannino, A.; Ambrosio, L. Metal-based antibacterial substrates for biomedical applications. Biomacromolecules 2015, 16, 1873–1885. [Google Scholar] [CrossRef] [PubMed]
- Hong, H.R.; Kim, J.; Park, C.H. Facilefabrication of multifunctional fabrics: Use of copper and silver nanoparticles for antibacterial, superhydrophobic, conductive fabrics. RSC Adv. 2018, 8, 41782–41794. [Google Scholar] [CrossRef]
- Jiang, H.; Manolache, S.; Wong, A.C.L.; Denes, F.S. Plasma-enhanced deposition of silver nanoparticles onto polymer and metal surfaces for the generation of antimicrobial characteristics. J. Appl. Polym. Sci. 2004, 93, 1411–1422. [Google Scholar] [CrossRef]
- Zhang, S.; Wang, L.; Liang, X.; Vorstius, J.; Keatch, R.; Corner, G.; Nabi, G.; Davidson, F.; Gadd, G.M.; Zhao, Q. Enhanced antibacterial and antiadhesive activities of silver-PTFE nanocomposite coating for urinary catheters. ACS Biomater. Sci. Eng. 2019, 5, 2804–2814. [Google Scholar] [CrossRef]
- Zille, A.; Fernandes, M.M.; Francesko, A.; Tzanov, T.; Fernandes, M.; Oliveira, F.R.; Almeida, L.; Amorim, T.; Carneiro, N.; Esteves, M.F.; et al. Size and aging effects on antimicrobial efficiency of silver nanoparticles coated on polyamide fabrics activated by atmospheric DBD plasma. ACS Appl. Mater. Interfaces 2015, 7, 13731–13744. [Google Scholar] [CrossRef]
- Tripathi, D.K.; Tripathi, A.; Shweta; Singh, S.; Singh, Y.; Vishwakarma, K.; Yadav, G.; Sharma, S.; Singh, V.K.; Mishra, R.K.; et al. Uptake, accumulation and toxicity of silver nanoparticle in autotrophicplants, and heterotrophic microbes: A concentric review. Front. Microbiol. 2017, 8, 7. [Google Scholar] [CrossRef]
- Tay, C.Y.; Cai, P.; Setyawati, M.I.; Fang, W.; Tan, L.P.; Hong, C.H.; Chen, X.; Leong, D.T. Nanoparticles strengthen intracellular tension and retard cellular migration. Nano Lett. 2014, 14, 83–88. [Google Scholar] [CrossRef]
- Setyawati, M.I.; Yuan, X.; Xie, J.; Leong, D.T. The influence of lysosomal stability of silver nanomaterials on their toxicity to human cells. Biomaterials 2014, 35, 6707–6715. [Google Scholar] [CrossRef]
- Tay, C.Y.; Fang, W.; Setyawati, M.I.; Chia, S.L.; Tan, K.S.; Hong, C.H.; Leong, D.T. Nano-hydroxyapatite and nano-titanium dioxide exhibit different subcellular distribution and apoptotic profile in human oral epithelium. ACS Appl. Mater. Interfaces 2014, 6, 6248–6256. [Google Scholar] [CrossRef]
- Rivera Gil, P.; Oberdorster, G.; Elder, A.; Puntes, V.; Parak, W.J. Correlating physico-chemical with toxicological properties of nanoparticles: The present and the future. ACS Nano 2010, 4, 5527–5531. [Google Scholar] [CrossRef]
- Setyawati, M.I.; Tay, C.Y.; Chia, S.L.; Goh, S.L.; Fang, W.; Neo, M.J.; Chong, H.C.; Tan, S.M.; Loo, S.C.; Ng, K.W.; et al. Titanium dioxide nanomaterials cause endothelial cell leakiness by disrupting the homophilic interaction of VE-cadherin. Nat. Commun. 2013, 4, 1673. [Google Scholar] [CrossRef] [PubMed]
- AshaRani, P.V.; Low Kah Mun, G.; Hande, M.P.; Valiyaveettil, S. Cytotoxicity and genotoxicity of silver nanoparticles in human cells. ACS Nano 2009, 3, 279–290. [Google Scholar] [CrossRef] [PubMed]
- Cheng, X.; Zhang, W.; Ji, Y.; Meng, J.; Guo, H.; Liu, J.; Wu, X.; Xu, H. Revealing silver cytotoxicity using Au nanorods/Ag shell nanostructures: Disrupting cell membrane and causing apoptosis through oxidative damage. RSC Adv. 2013, 3, 2296–2305. [Google Scholar] [CrossRef]
- Zeng, L.; Wu, Y.; Xu, J.-F.; Wang, S.; Zhang, X. Supramolecular switching surface for antifouling and bactericidal activities. ACS Appl. Bio. Mater. 2019, 2, 638–643. [Google Scholar] [CrossRef]
- Hallab, N.J.; Bundy, K.J.; O’Connor, K.; Moses, R.L.; Jacobs, J.J. Evaluation of metallic and polymeric biomaterial surface energy and surface roughness characteristics for directed cell adhesion. Tissue Eng. 2001, 7, 55–71. [Google Scholar] [CrossRef]
- Bennett, S.M.; Finlay, J.A.; Gunari, N.; Wells, D.D.; Meyer, A.E.; Walker, G.C.; Callow, M.E.; Callow, J.A.; Bright, F.V.; Detty, M.R. The role of surface energy and water wettability in aminoalkyl/fluorocarbon/hydrocarbon-modified xerogel surfaces in the control of marine biofouling. Biofouling 2010, 26, 235–246. [Google Scholar] [CrossRef]
- Müller, C.; Lüders, A.; Hoth-Hannig, W.; Hannig, M.; Ziegler, C. Initial bioadhesion on dental materials as a function of contact time, pH, surface wettability, and isoelectric point. Langmuir 2010, 26, 4136–4141. [Google Scholar] [CrossRef]
- Gittens, R.A.; Scheideler, L.; Rupp, F.; Hyzy, S.L.; Geis-Gerstorfer, J.; Schwartz, Z.; Boyan, B.D. A review on the wettability of dental implant surfaces II: Biological and clinical aspects. Acta Biomater. 2014, 10, 2907–2918. [Google Scholar] [CrossRef]
- Moradi, S.; Hadjesfandiari, N.; Toosi, S.F.; Kizhakkedathu, J.N.; Hatzikiriakos, S.G. Effect of extreme wettability on platelet adhesion on metallic implants: From superhydrophilicity to superhydrophobicity. ACS Appl. Mater. Interfaces 2016, 8, 17631–17641. [Google Scholar] [CrossRef]
- Long, J.; Fan, P.; Gong, D.; Jiang, D.; Zhang, H.; Li, L.; Zhong, M. Superhydrophobic surfacesfabricated by femtosecond laser with tunable water adhesion: From lotus leaf to rose petal. ACS Appl. Mater. Interfaces 2015, 7, 9858–9865. [Google Scholar] [CrossRef]
- Yuan, Y.; Hays, M.P.; Hardwidge, P.R.; Kim, J. Surface characteristics influencing bacterial adhesion to polymeric substrates. RSC Adv. 2017, 7, 14254–14261. [Google Scholar] [CrossRef]
- Cheng, Z.; Du, M.; Lai, H.; Zhang, N.; Sun, K. From petal effect to lotus effect: A facile solution immersion process for the fabrication of super-hydrophobic surfaces with controlled adhesion. Nanoscale 2013, 5, 2776–2783. [Google Scholar] [CrossRef] [PubMed]
- Jin, M.; Feng, X.; Xi, J.; Zhai, J.; Cho, K.; Feng, L.; Jiang, L. Super-hydrophobic PDMS surface with ultra-low adhesive force. Macromol. Rapid Common. 2005, 26, 1805–1809. [Google Scholar] [CrossRef]
- Zhang, P.; Lin, L.; Zang, D.; Guo, X.; Liu, M. Designing bioinspired anti-Biofouling surfaces based on a superwettability strategy. Small 2017, 13, 1503334. [Google Scholar] [CrossRef] [PubMed]
- Burks, G.A.; Velegol, S.B.; Paramonova, E.; Lindenmuth, B.E.; Feick, J.D.; Logan, B.E. Macroscopic and nanoscale measurements of the adhesion of bacteria with varying outer layer surface composition. Langmuir 2003, 19, 2366–2371. [Google Scholar] [CrossRef]
- Carpentier, B. Sanitary quality of meat chopping board surfaces: A bibliographical study. Food Microbiol. 1997, 14, 31–37. [Google Scholar] [CrossRef]
- Fang, H.H.P.; Chan, K.-Y.; Xu, L.-C. Quantification of bacterial adhesion forces using atomic force microscopy (AFM). J. Microbiol. Methods 2000, 40, 89–97. [Google Scholar] [CrossRef]
- Evans-Hurrell, J.A.; Adler, J.; Denyer, S.; Rogers, T.G.; Williams, P. A method for the enumeration of bacterial adhesion to epithelial cells using image analysis. FEMS Microbiol. Lett. 1993, 107, 77–82. [Google Scholar] [CrossRef]
- Caldwell, D.E.; Germida, J.J. Evaluation of difference imagery for visualizing and quantitating microbial growth. Can. J. Microbiol. 1985, 31, 35–44. [Google Scholar] [CrossRef]
- An, Y.H.; Friedman, R.J. Laboratory methods for studies of bacterial adhesion. J. Microbiol. Methods 1997, 30, 141–152. [Google Scholar] [CrossRef]
- Li, J.; Kleintschek, T.; Rieder, A.; Cheng, Y.; Baumbach, T.; Obst, U.; Schwartz, T.; Levkin, P.A. Hydrophobic liquid-infused porous polymer surfaces for antibacterial applications. ACS Appl. Mater. Interfaces 2013, 5, 6704–6711. [Google Scholar] [CrossRef] [PubMed]
- Asadishad, B.; Ghoshal, S.; Tufenkji, N. Method for the direct observation and quantification of survival of bacteria attached to negatively or positively charged surfaces in an aqueous medium. Environ. Sci. Technol. 2011, 45, 8345–8351. [Google Scholar] [CrossRef] [PubMed]
- Stiefel, P.; Schneider, J.; Amberg, C.; Maniura-Weber, K.; Ren, Q. A simple and rapid method for optical visualization and quantification of bacteria on textiles. Sci. Rep. 2016, 6, 39635. [Google Scholar] [CrossRef] [PubMed]
- Stiefel, P.; Schmidt-Emrich, S.; Maniura-Weber, K.; Ren, Q. Critical aspects of using bacterial cell viability assays with the fluorophores SYTO9 and propidium iodide. BMC Microbiol. 2015, 15, 36. [Google Scholar] [CrossRef] [PubMed]
- Disney, M.D.; Zheng, J.; Swager, T.M.; Seeberger, P.H. Detection of bacteria with carbohydrate-functionalized fluorescent polymers. J. Am. Chem. Soc. 2004, 126, 13343–13346. [Google Scholar] [CrossRef]
- Link, A.J.; Tirrell, D.A. Cell surface labeling of Escherichia coli via copper(I)-catalyzed [3+2] cycloaddition. J. Am. Chem. Soc. 2003, 125, 11164–11165. [Google Scholar] [CrossRef]
- Din, N.; Gilkes, N.R.; Tekant, B.; Miller, R.C.; Warren, R.A.J.; Kilburn, D.G. Non–hydrolytic disruption of cellulose fibres by the binding domain of a bacterial cellulase. Nat. Biotechnol. 1991, 9, 1096–1099. [Google Scholar] [CrossRef]
- Lin, J.; Chen, X.; Chen, C.; Hu, J.; Zhou, C.; Cai, X.; Wang, W.; Zheng, C.; Zhang, P.; Cheng, J.; et al. Durably antibacterial and bacterially antiadhesive cotton fabrics coated by cationic fluorinated polymers. ACS Appl. Mater. Interfaces 2018, 10, 6124–6136. [Google Scholar] [CrossRef]
- Nakanishi, J.; Kikuchi, Y.; Takarada, T.; Nakayama, H.; Yamaguchi, K.; Maeda, M. Photoactivation of a substrate for cell adhesion under standard fluorescence microscopes. J. Am. Chem. Soc. 2004, 126, 16314–16315. [Google Scholar] [CrossRef]
- Yu, Q.; Cho, J.; Shivapooja, P.; Ista, L.K.; López, G.P. Nanopatterned smart polymer surfaces for controlled attachment, killing, and release of bacteria. ACS Appl. Mater. Interfaces 2013, 5, 9295–9304. [Google Scholar] [CrossRef]
- Prévost, V.; Anselme, K.; Gallet, O.; Hindié, M.; Petithory, T.; Valentin, J.; Veuillet, M.; Ploux, L. Real-time imaging of bacteria/osteoblast dynamic coculture on bone implant material in an in vitro postoperative contamination model. ACS Biomater. Sci. Eng. 2019, 5, 3260–3269. [Google Scholar] [CrossRef]
- Keller, N.; Bruchmann, J.; Sollich, T.; Richter, C.; Thelen, R.; Kotz, F.; Schwartz, T.; Helmer, D.; Rapp, B.E. Study of biofilm growth on slippery liquid-infused porous surfaces made from fluoropor. ACS Appl. Mater. Interfaces 2019, 11, 4480–4487. [Google Scholar] [CrossRef] [PubMed]
- Bopp, S.K.; Lettieri, T. Comparison of four different colorimetric and fluorometric cytotoxicity assays in a zebrafish liver cell line. BMC Pharmacol. 2008, 8, 8. [Google Scholar] [CrossRef] [PubMed]
- Taylor, J.P.; Wilson, B.; Mills, M.S.; Burns, R.G. Comparison of microbial numbers and enzymatic activities in surface soils and subsoils using various techniques. Soil. Biol. Biochem. 2002, 34, 387–401. [Google Scholar] [CrossRef]
- Böckelmann, U.; Szewzyk, U.; Grohmann, E. A New Enzymatic method for the detachment of particle associated soil bacteria. J. Microbiol. Methods 2003, 55, 201–211. [Google Scholar] [CrossRef]
- Jang, Y.; Choi, W.T.; Johnson, C.T.; García, A.J.; Singh, P.M.; Breedveld, V.; Hess, D.W.; Champion, J.A. Inhibition of bacterial adhesion on nanotextured stainless steel 316L by electrochemical etching. ACS Biomater. Sci. Eng. 2018, 4, 90–97. [Google Scholar] [CrossRef]
- Ismail, R.; Aviat, F.; Michel, V.; Le Bayon, I.; Gay-Perret, P.; Kutnik, M.; Federighi, M. Methods for recovering microorganisms from solid surfaces used in the food industry: A review of the literature. Int. J. Environ. Res. Public Health 2013, 10, 6169–6183. [Google Scholar] [CrossRef]
- Merten, O.-W. Cell detachment. In Encyclopedia of Industrial Biotechnology; Flickinger, M.C., Ed.; Wiley: Hoboken, NJ, USA, 2010; pp. 1–22. [Google Scholar]
- Singer, M.M.; Tjeerdema, R.S. Fate and effects of the surfactant sodium dodecyl sulfate. Rev. Environ. Contam. Toxicol. 1993, 133, 95–149. [Google Scholar]
- Schiavone, B.I.P.; Rosato, A.; Marilena, M.; Gibbons, S.; Bombardelli, E.; Verotta, L.; Franchini, C.; Corbo, F. Biological evaluation of hyperforin and its hydrogenated analogue on bacterial growth and biofilm production. J. Nat. Prod. 2013, 76, 1819–1823. [Google Scholar] [CrossRef]
- Maldonado, F.; Packard, T.T.; Gómez, M. Understanding tetrazolium reduction and the importance of substrates in measuring respiratory electron transport activity. J. Exp. Mar. Biol. Ecol. 2012, 434–435, 110–118. [Google Scholar] [CrossRef]


| Substrate | Material | Thickness (mm) | Basis Weight (g/m2) | Solidity (Unitless) | Porosity (%) | Mean Fiber Diameter (μm) |
|---|---|---|---|---|---|---|
| PET-F | PET film | 0.05 (± 0.03, n = 3) | 49 (± 3, n = 3) | - | - | NA |
| PET-SB | PET spunbond | 0.15 (± 0.01, n = 3) | 27 (± 1, n = 3) | 0.02 | 98 | 19.8 (± 0.8, n = 15) |
| PP-MB | PP meltblown | 0.25 (± 0.02, n = 3) | 28 (± 1, n = 3) | 0.02 | 98 | 1.4 (± 1.1, n = 15) |
| Surface | Pixel Count |
|---|---|
| PET-F surface (414 μm × 591 μm) | 258,400 |
| PET-F covered with bacteria | 14,739 |
| Percentage of surface area covered with bacteria | 5.7% |
| Method | Relevancy | Limitation |
|---|---|---|
| Extraction | Optical density of cell suspension linearly predicts the CFU. Count both live and dead cells. | Complete detachment of bacteria is not assured, especially for porous substrates. |
| Colorimetric | Cell detachment procedure is not necessary. Visualization of bacterial presence is possible, even in the naked eye. Count only the live cells. | Window for accurate quantification is narrow. Observation by the naked eye is difficult at the low level of bacterial concentration. |
| Microscopy | Direct observation on bacterial distribution on surfaces is possible. Only the topmost surface is observable. | Quantification is not accurate. Observation in depth layer is not possible. |
© 2019 by the authors. Licensee MDPI, Basel, Switzerland. This article is an open access article distributed under the terms and conditions of the Creative Commons Attribution (CC BY) license (http://creativecommons.org/licenses/by/4.0/).
Share and Cite
Hemmatian, T.; Kim, J. Quantification Methods for Textile-Adhered Bacteria: Extraction, Colorimetric, and Microscopic Analysis. Polymers 2019, 11, 1666. https://doi.org/10.3390/polym11101666
Hemmatian T, Kim J. Quantification Methods for Textile-Adhered Bacteria: Extraction, Colorimetric, and Microscopic Analysis. Polymers. 2019; 11(10):1666. https://doi.org/10.3390/polym11101666
Chicago/Turabian StyleHemmatian, Tahmineh, and Jooyoun Kim. 2019. "Quantification Methods for Textile-Adhered Bacteria: Extraction, Colorimetric, and Microscopic Analysis" Polymers 11, no. 10: 1666. https://doi.org/10.3390/polym11101666
APA StyleHemmatian, T., & Kim, J. (2019). Quantification Methods for Textile-Adhered Bacteria: Extraction, Colorimetric, and Microscopic Analysis. Polymers, 11(10), 1666. https://doi.org/10.3390/polym11101666