3.1. Molecular Characterization
The molecular characterization data of the polymers under investigation are reported in
Table 2: all the samples were characterized by high and similar molecular weights, proving that no significant thermal degradation reactions occurred during polymerization.
1H-NMR and
13C-NMR analysis have been carried out to
(i) verify the chemical structure,
(ii) calculate the actual composition, and
(iii) calculate the degree of randomness (b). As an example,
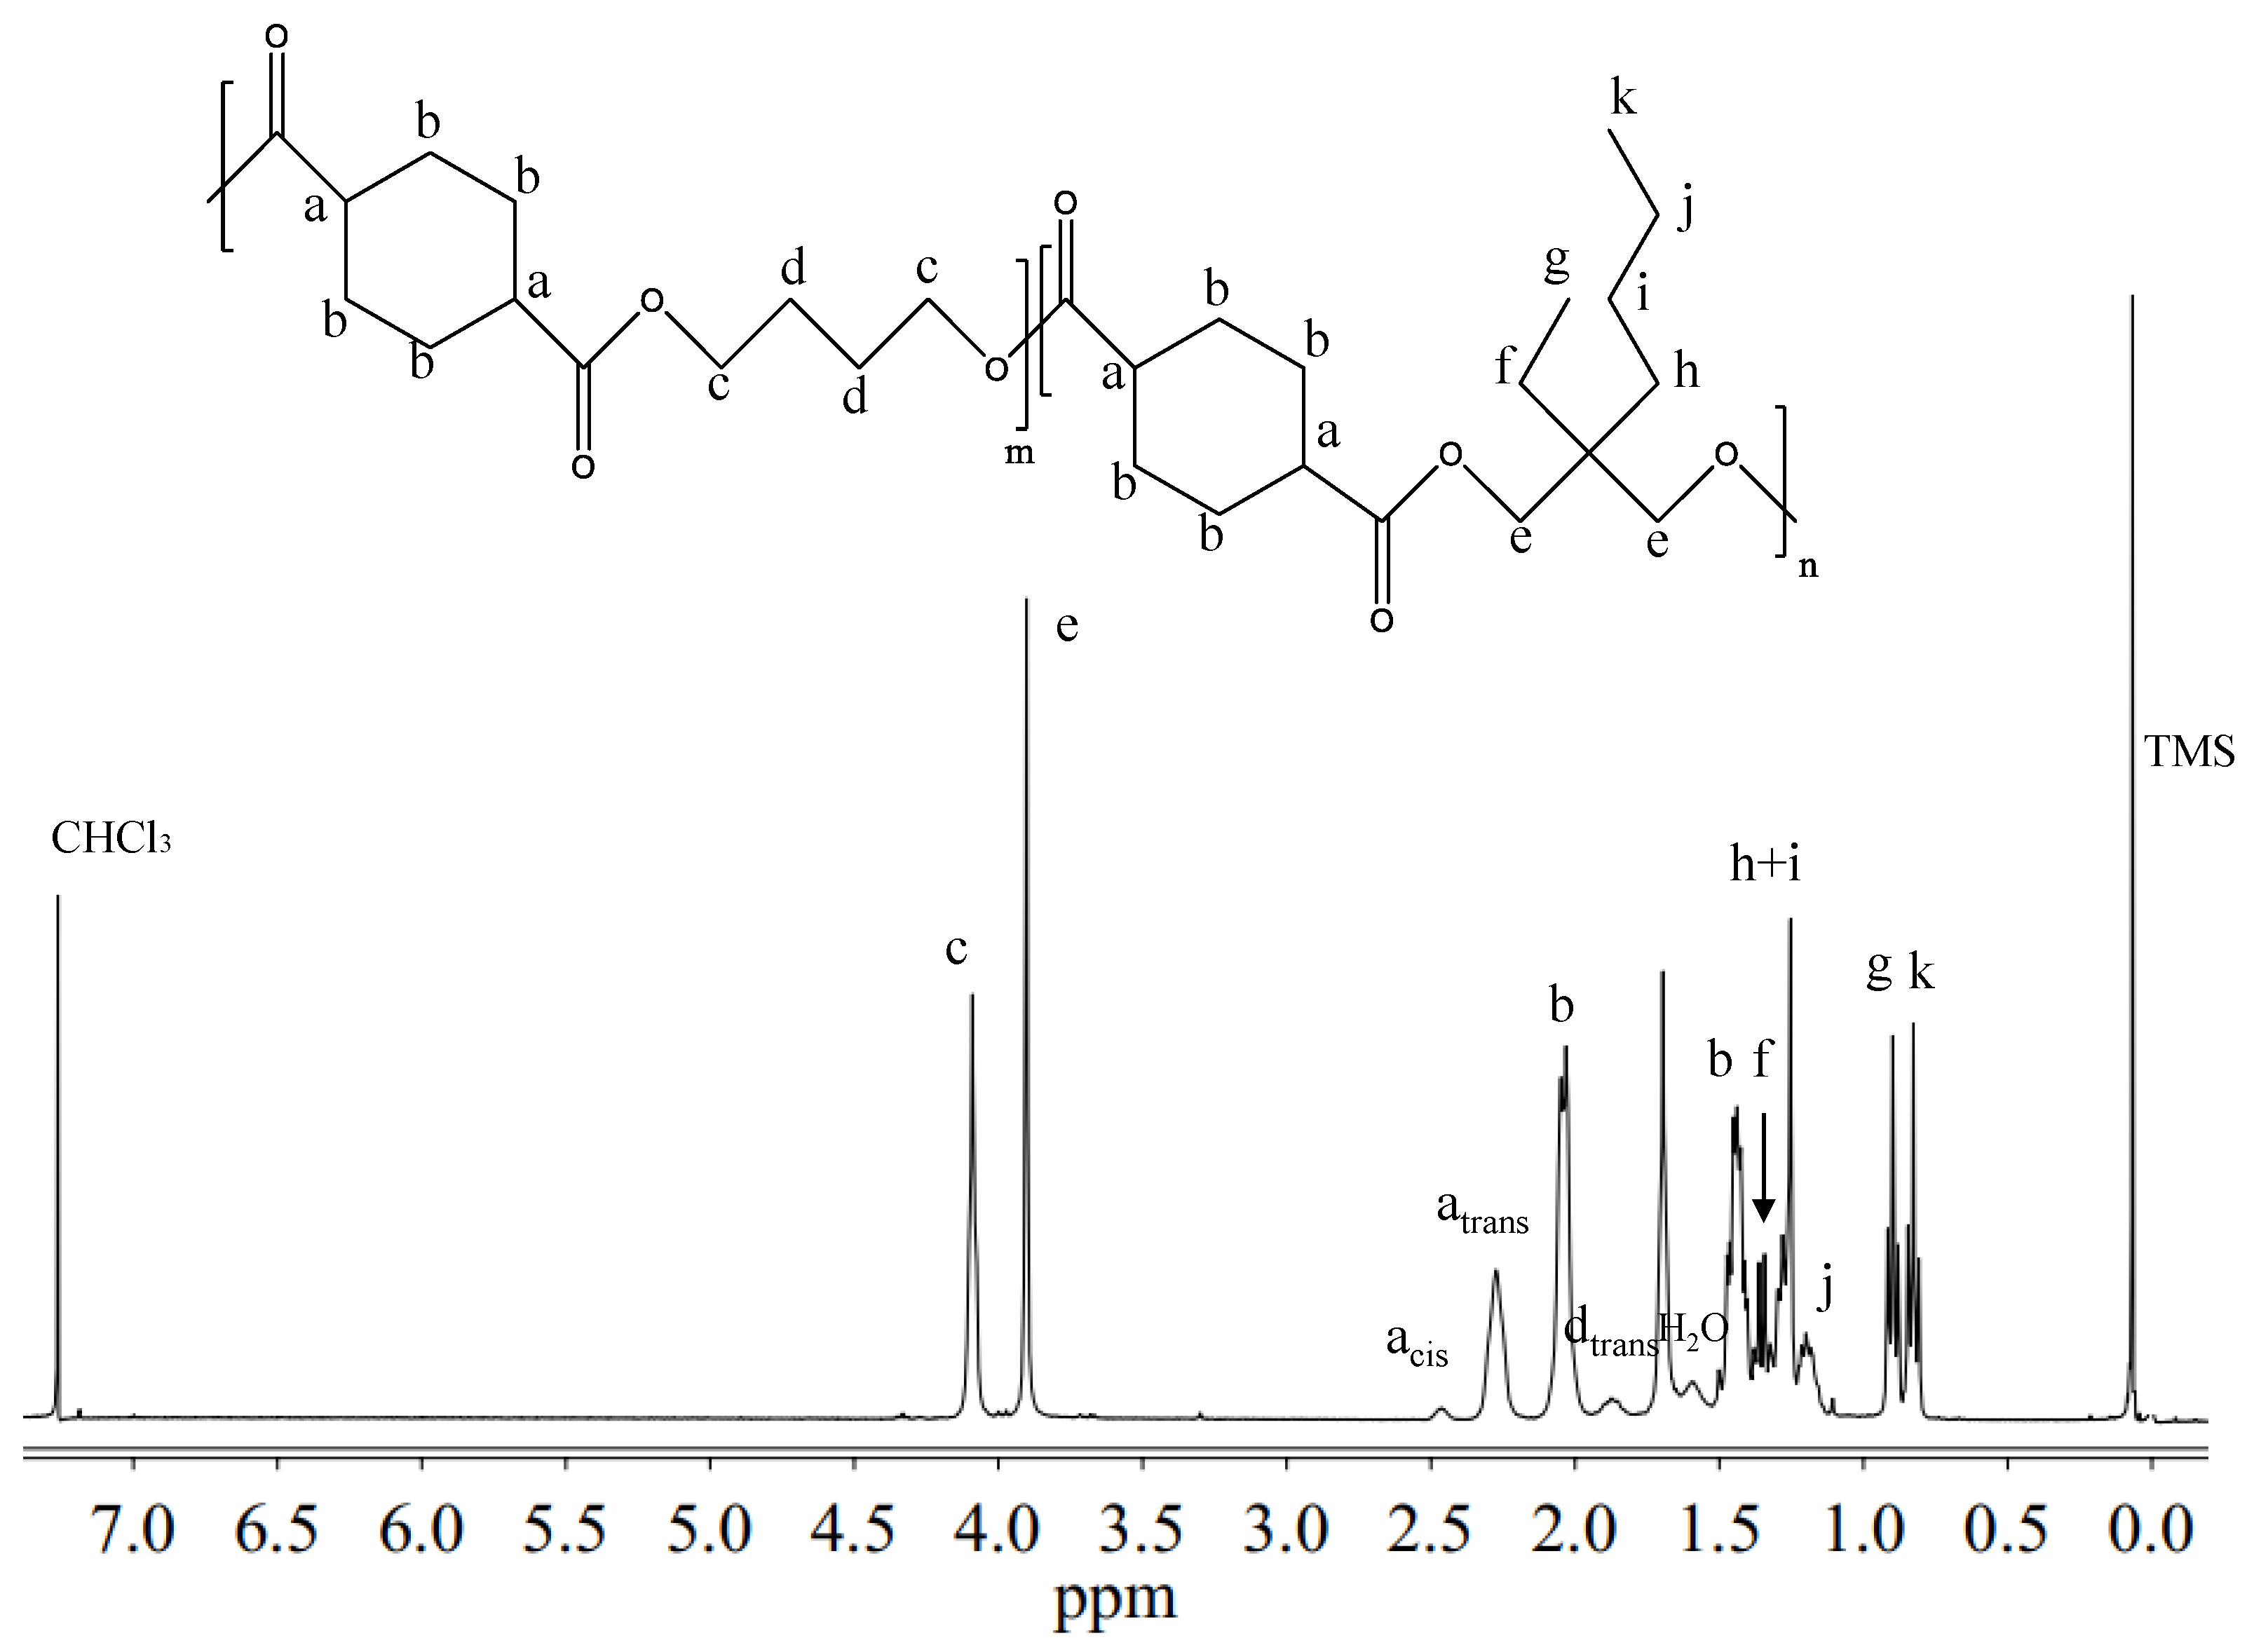
Figure 2 reports the
1H-NMR spectrum of P(BCE
65BEPCE
35) with the corresponding resonance assignments.
The chemical structure of the copolymer is confirmed, since no additional peaks were found in the spectrum. The copolymer composition was determined from the relative areas of the resonance peak of the
c protons of the butylene sub-unit, located at 4.11 ppm and of the signal at 3.90 ppm corresponding to the
e protons of the butyl-ethyl propylene moiety for P(BCE
mBEPCE
n) (see
Figure 2). In the case of P(BCE
80NCE
20), the signal of neopentyl subunit at 3.85 ppm has been used for calculating the composition (data not shown). For all the copolymers, the actual composition is close to the feed one (see
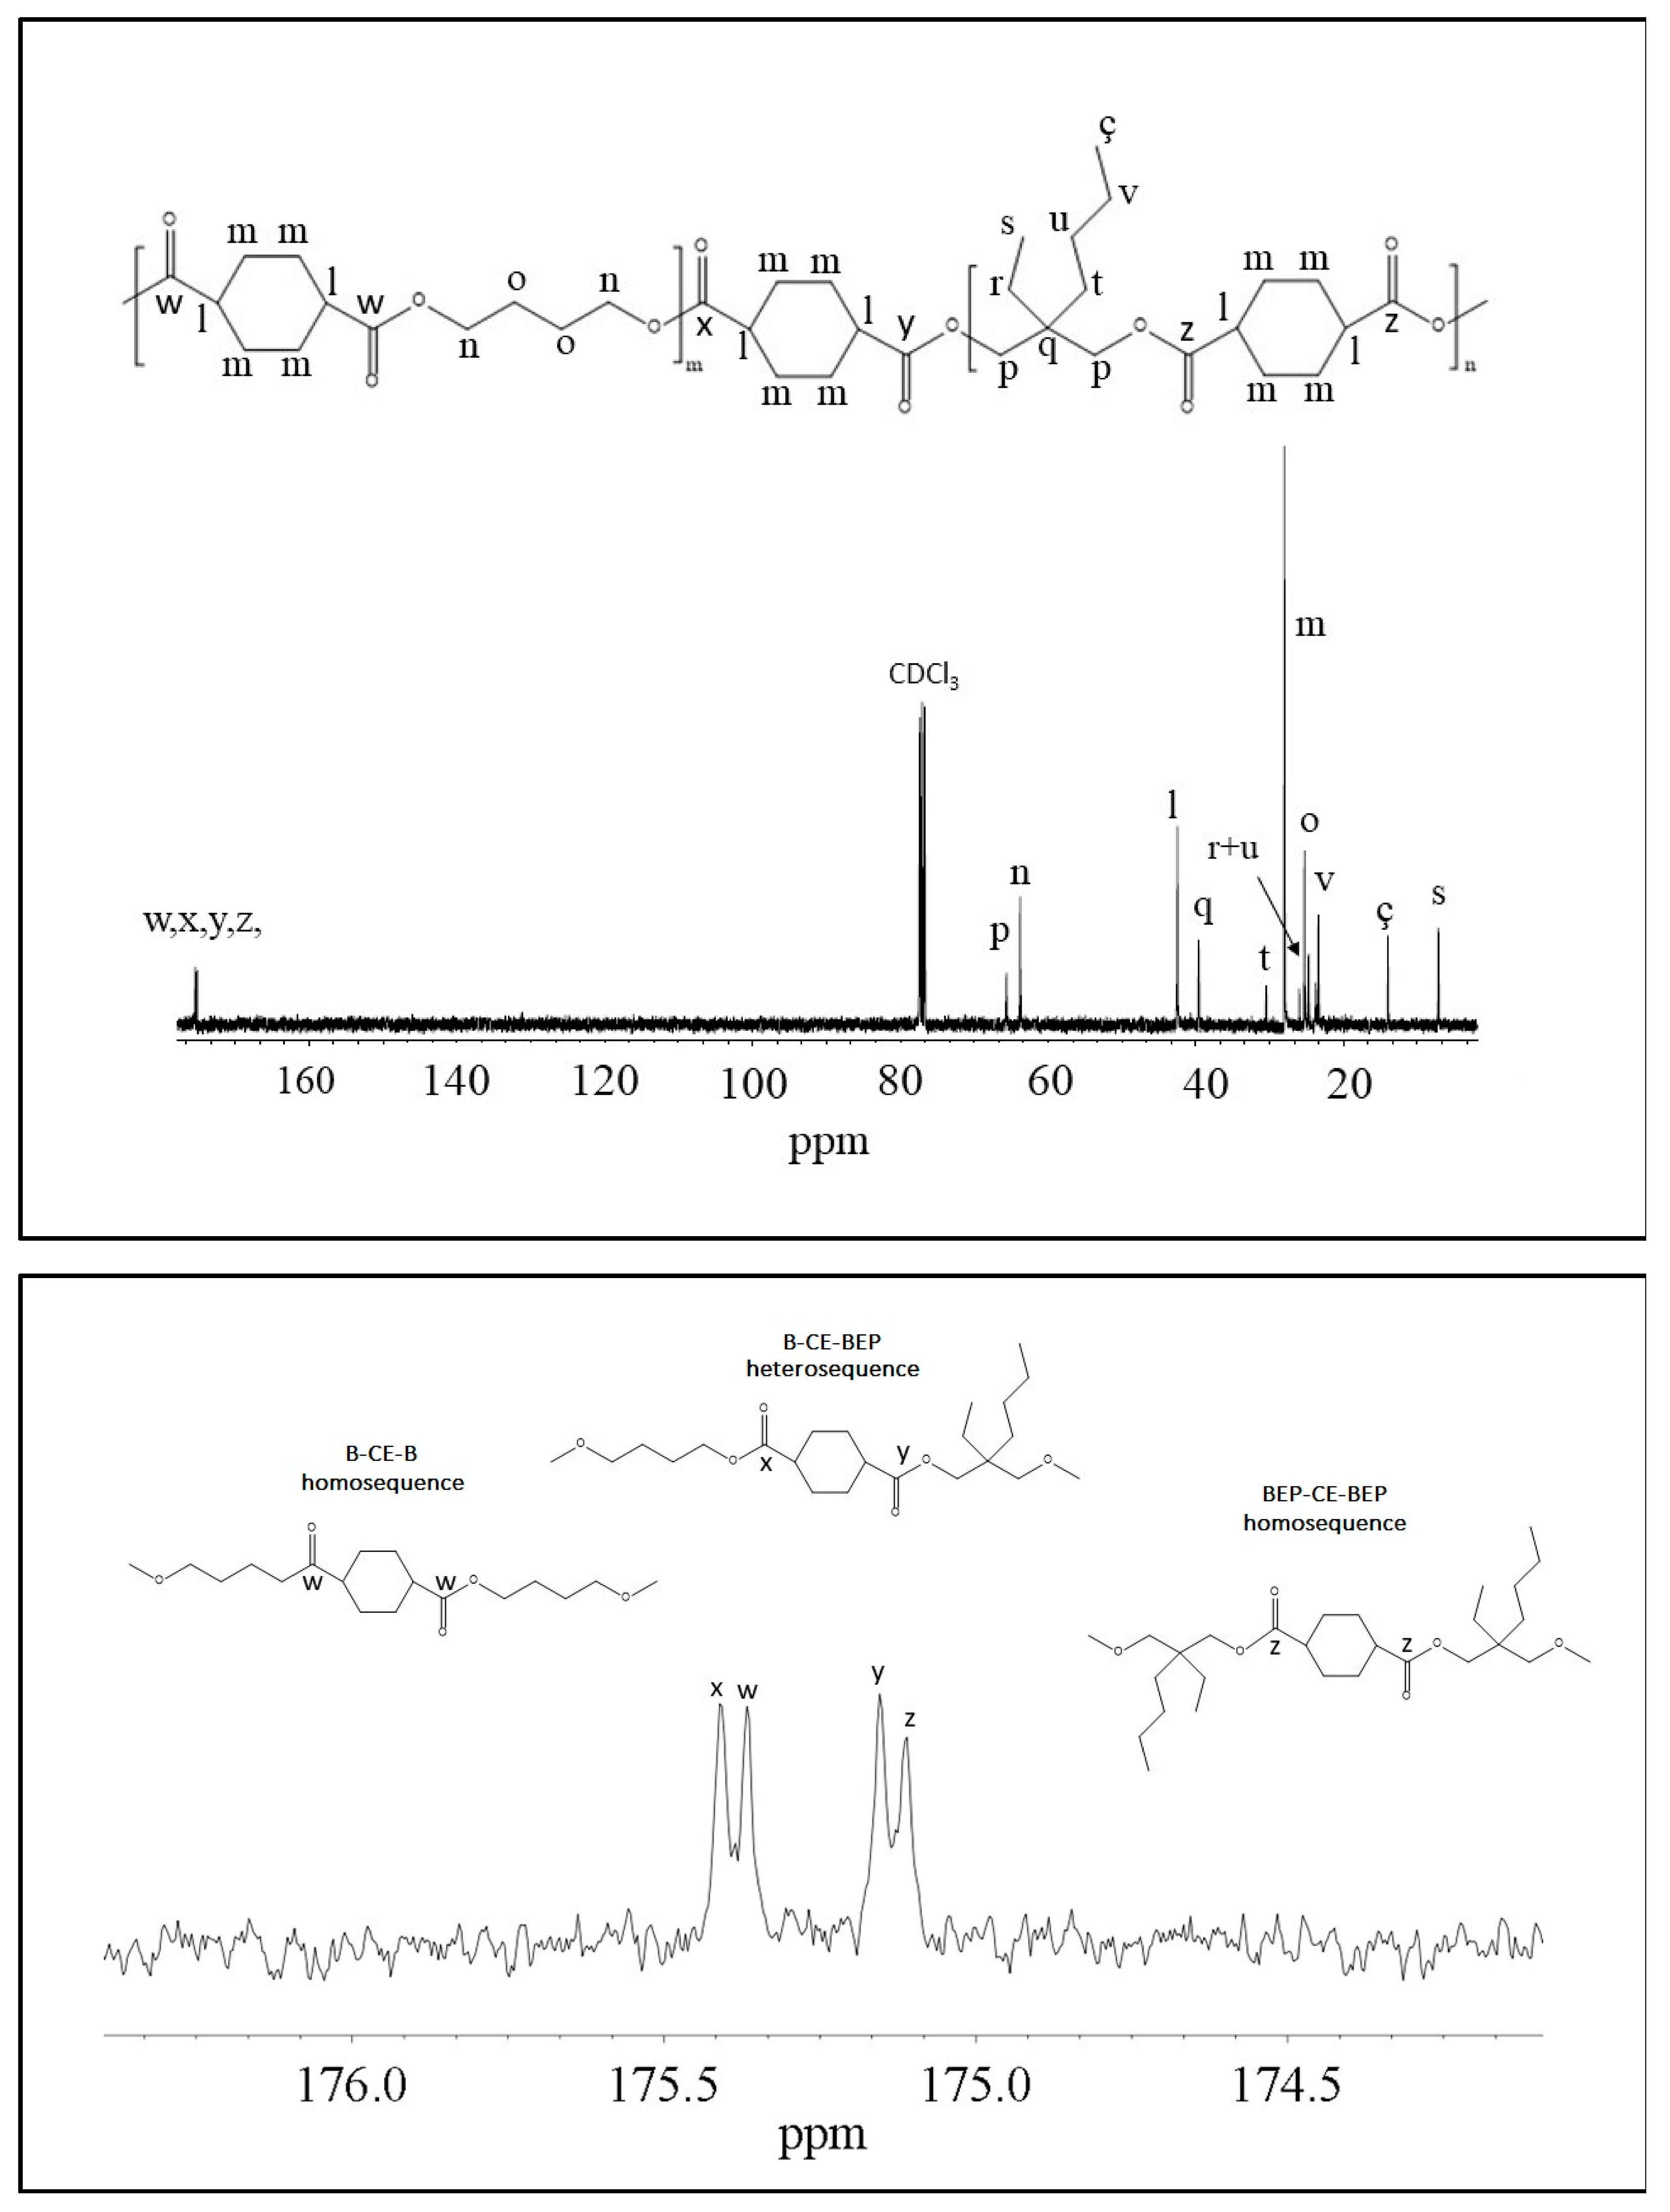
Table 2), proving a good control in the polymerization process. The degree of randomness (b) has been calculated by
13C-NMR spectroscopy. In
Figure 3, as example, is reported the
13C-NMR spectrum of P(BCE
65BEPCE
35) with the peaks assignments (top) and the magnification of the region in between 176.50 and 174 ppm, where the signals due to the ester groups carbons are located (bottom). In this region, together with the signals of the ester carbons at 175.38 and 175.13 ppm, corresponding to the B-CE-B (
w carbon) and BEP-CE-BEP (
z carbon) triads, respectively, two additional peaks can be detected. These signals refer to the B-CE-BEP and BEP-CE-B (
x and
y carbons) triads, due to transesterification reactions. The degree of randomness b has been calculated from the intensity of the
w,
z,
x, and
y peaks.
It is worth noting that
b is equal to 1 for random copolymers, equal to 2 for alternate copolymers, equal to 0 for a mixture of two corresponding homopolymers and 0 <
b < 1 for block copolymers. The degree of randomness was calculated according to Equation (1):
where B-BEP and BEP-B are the probability of finding a B unit next to a BEP one and the probability of finding a BEP unit close to a B one, respectively.
In turn, the two probabilities can be expressed as Equation (2):
where,
Iw,
Ix,
Iy,
Iz represent the integrated intensities of the resonance peaks of the B-CE-B, B-CE-BEP, BEP-CE-B, and BEP-CE-BEP triads, respectively (
Figure 3 bottom).
For all the copolymers, the calculated b is practically equal to 1. Therefore, we can conclude that the experimental conditions adopted allowed us to synthesized copolymers with a random distribution of sequences.
3.2. Thermal Characterization
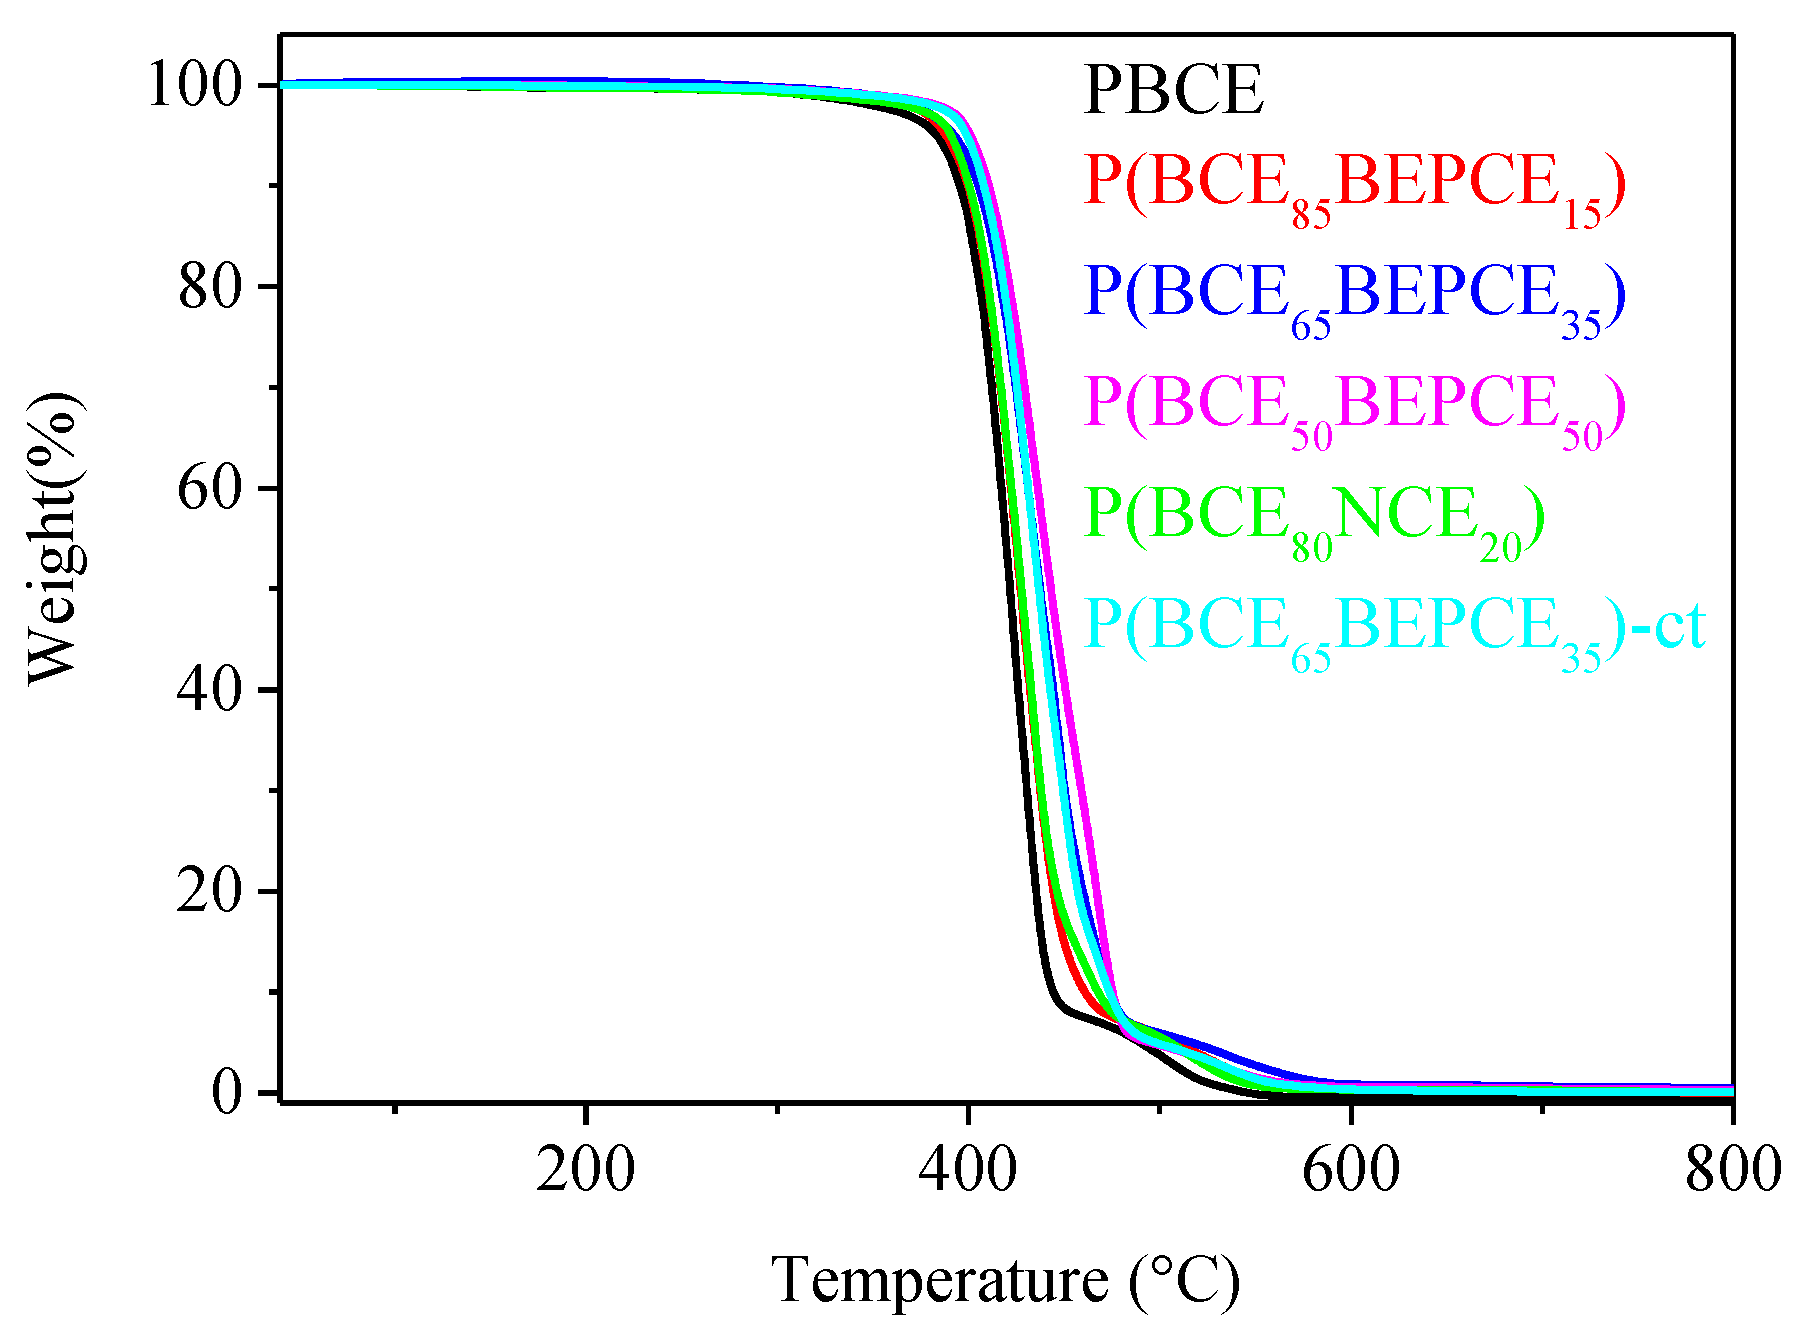
The thermal stability of the samples under investigation has been analysed by TGA under nitrogen flow. The temperatures of 5% weight loss (
T5%) and maximum weight loss rate (
Tmax) have been collected in
Table 3. In all cases, the weight loss takes place in one step and is 100% (see
Figure 4). All the copolymers under study show very good thermal stability, with the weight loss starting above 380 °C. Both
T5% and
Tmax increase in the copolymers evidencing the thermal degradation takes place at higher temperature. This result is probably due to the presence of ramifications on the carbon in the β position with respect to the ester oxygen that hinders the β-scission process. The observed trend appears to be correlated to copolymer composition.
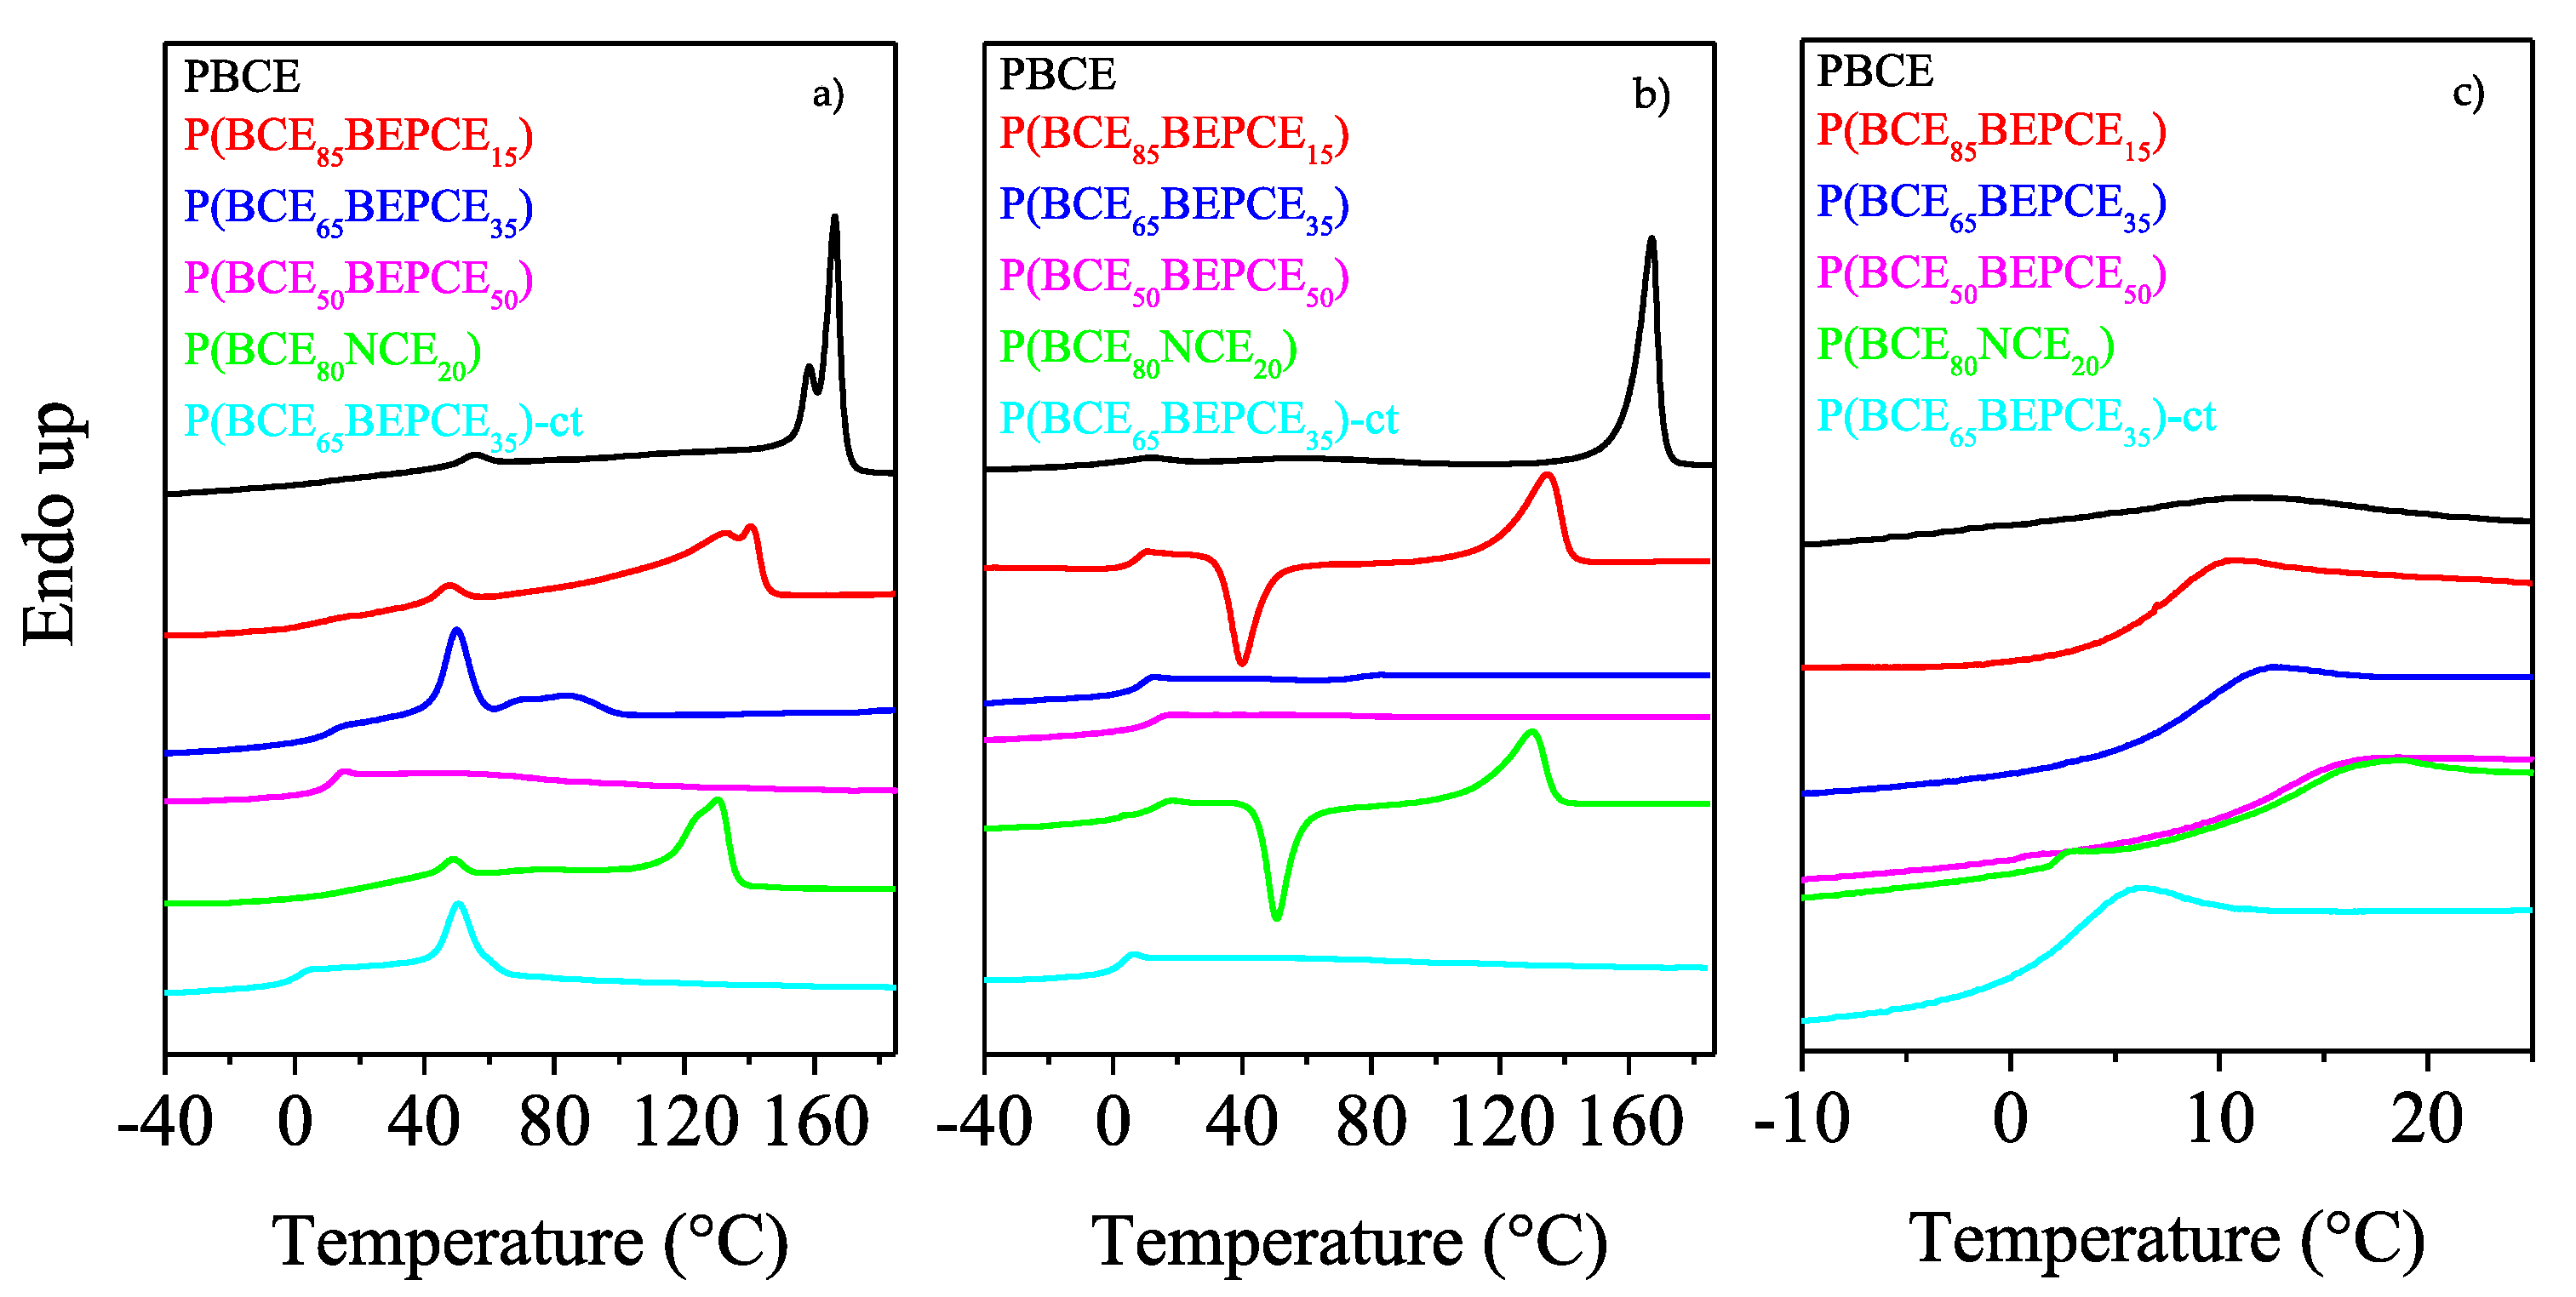
The calorimetric curves and the relative thermal data of the samples under investigation are reported in
Figure 5 and
Table 3, respectively. Regarding the calorimetric study, we can exclude an influence of molecular weight on the glass transition and melting of the synthesized polymers due to the samples being characterized by high and similar
Mn.
As one can see from the first calorimetric scan (
Figure 5a), all the samples, except for P(BCE
50BEPCE
50), are semicrystalline, with the corresponding DSC traces characterized by the presence of a baseline deviation associated to the glass to rubber transition, followed by endothermic peaks at higher temperatures related to the melting of ordered portions. The P(BCE
50BEPCE
50) sample just shows the glass-to-rubber transition at 11 °C.
Concerning the semicrystalline samples, two different endothermic phenomena can be seen: the first one at intermediate and fixed temperature, around 50 °C, whose intensity increases with the comonomeric unit content, from now on referred to as peak I; the second one at higher temperature, characterized by a double peak, whose position and area progressively decrease with the co-units amount, from now on referred to as peak II.
The evolution of peak II in the copolymers under study is typical of most copolyester systems, for which, as the co-units amount increases, the formation of a crystalline phase with lower degree of perfection occurs. As concerns the multiple nature of peak II, it can be ascribed to melting/crystallization processes of low ordered crystals typical of copolymer system in which the co-units hinder the crystallization process, or can be due to the presence of different crystal lattices [
15,
16,
17,
18].
On the other side, Peak I shows a peculiar behavior not typical of copolyesters, since it is located at the same temperature regardless of the composition and increases in intensity when the co-unit content rises. The calorimetric curve of the copolymer containing cis/trans-1,4-cyclohexanedicarboxylate moieties, P(BCE65BEPCE35)-ct, is very similar to that of P(BCE65BEPCE35) in which just trans-1,4-cyclohexanedicarboxylate subunits are present, the only difference being represented by the low melting peak at 85 °C in P(BCE65BEPCE35) trace. The absence of this endotherm in P(BCE65BEPCE35)-ct can be explained by the additional crystallization hindering of the cis/trans isomerism in the acid subunit that further reduces the structural regularity in the macromolecular chain.
X-ray diffraction analysis can provide more elements to identify the origin of these endothermic phenomena: peak I and peak II.
As it is well known, a partially crystalline material usually exhibits different glass transition behaviour than completely amorphous analogous. In fact, although some conflicting results are reported in the literature [
19], crystallinity usually acts like crosslinking and raises
Tg values through its restrictive effect on the segmental motion of amorphous polymer chains. Therefore, to study the influence of chemical structure on the glass transition of random copolymers, the phenomenon should be examined in the total absence of crystallinity. In this view, all the samples under investigation were subjected to rapid cooling (quenching) from the melt (see the Experimental section for the details). The DSC curves and the thermal characterization data of the so-treated samples are reported in
Figure 5b and collected in
Table 3 as a function of co-unit content.
The effect of copolymerization on the thermal behaviour of the PBCE homopolymer is evidenced by the calorimetric curves obtained after melt quenching. As one can see, the PBCE curves of I and II scans are practically the same (see
Figure 5a,b), evidencing that, due to its high crystallization rate, this homopolymer cannot be quenched in the amorphous state under the experimental conditions adopted. On the contrary, the DSC traces of all the copolymers change after melt quenching in liquid nitrogen. Firstly, the glass transition phenomenon becomes more evident, as a consequence of an increased amorphous phase amount in the quenched samples. Secondly, a different crystallization capability can be evidenced as the glycol co-unit content is increased. In particular, for the samples containing up to 20 mol% of glycol co-units, P(BCE
85BEPCE
15 e P(BCE
80NCE
20), the corresponding DSC traces are characterized by the glass to rubber transition step, an exothermic peak and an endothermic one, located at higher temperatures. This kind of DSC trace is typical of materials that, once the glass transition temperature is exceeded, are able to crystallize in the temperature window in between
Tg and
Tm and then undergo melting of the crystals developed during the heating. Moreover, with the areas under the two peaks equal (Δ
Hcc = Δ
HII), we can assert that the copolymers had been quenched into the amorphous phase, with the presence of BEPCE and NCE co-units along the PBCE chains hindering its crystallization capability. This effect is even more evident in the copolymers with higher glycol co-unit content, P(BCE
65BEPCE
35) e P(BCE
50BEPCE
50), for which just the glass to rubber transition step has been detected in the second scan DSC trace. P(BCE
65BEPCE
35)-ct has the same phase behavior of P(BCE
65BEPCE
35) e P(BCE
50BEPCE
50), i.e., is completely amorphous after melt quenching (the corresponding DSC trace evidences only the glass transition phenomenon).
The co-unit nature has a direct effect also on the polymer chain mobility as indicated by the
Tg and the corresponding Δ
cp values reported in
Table 3, and as shown by the DSC curves magnification of
Figure 5c. As already reported in the literature, the presence of alkyl pendant groups hinders the rotation around the C–C σ bond, beacause of their high steric hindrance, reducing the macromolecular mobility (
Tg rises). However, if the pendant groups are long enough, they are able to exert an internal plasticizing effect, which leads to a decrease of the
Tg value. The entity of this latter effect is proportional to the length of the side alkyl group. In the copolymers under study, both these opposite effects are supposed to influence chain mobility, i.e.,
Tg position.
To analyze the effect of the presence of the different co-units, both in the glycol and acid mioeties, on the
Tg of PBCE homopolymer, in
Figure 5c, we have reported the temperature region at which the glass to rubber transition occurs.
As one can see, the
Tg step, rather low for the semicrystalline PBCE, increases in height in the copolymers, as a consequence of the presence of the only amorphous phase after melt quenching. Therefore, any effect of crystal phase on glass transition temperature can be excluded: the
Tg position will be solely due to chain mobility. It is interesting to note that for all samples, except for P(BCE
65BEPCE
35)-ct, despite the absence of crystalline domains, the glass to rubber transition step progressively moves towards higher temperature (see also
Table 3), similar to other copolymeric systems previously investigated [
20,
21]: the chain stiffening, due to the steric hindrance of the alkyl pendants introduced by copolymerization, prevails over their plasticizing effect.
For the NCE co-unit containing copolymer, P(BCE
80NCE
20), the balance of the steric hindrance and plasticizing effect of side pendants is different, and determines the same
Tg increase observed for P(BCE
mBEPCE
n) with lower co-unit weight fraction. In fact, as one can see in
Figure 5c, the calorimetric trace of P(BCE
80NCE
20) practically overlaps that of P(BCE
50BEPCE
50) (see
Table 3). This result indicates that in the case of NCE comonomeric units, the internal plasticizing effect is minor, probably due to the lower length of the neopentyl side chains.
The only case in which a decrease in Tg value with respect to PBCE homopolymer has been observed is for the copolymer with cis/trans-1,4-cyclohexanedicarboxylate moieties, P(BCE65BEPCE35)-ct. The different ring isomerism causes a decrease in the chain symmetry and probably limits interchain interactions with a consequent lowering of the glass transition temperature.
3.3. Structural Characterization
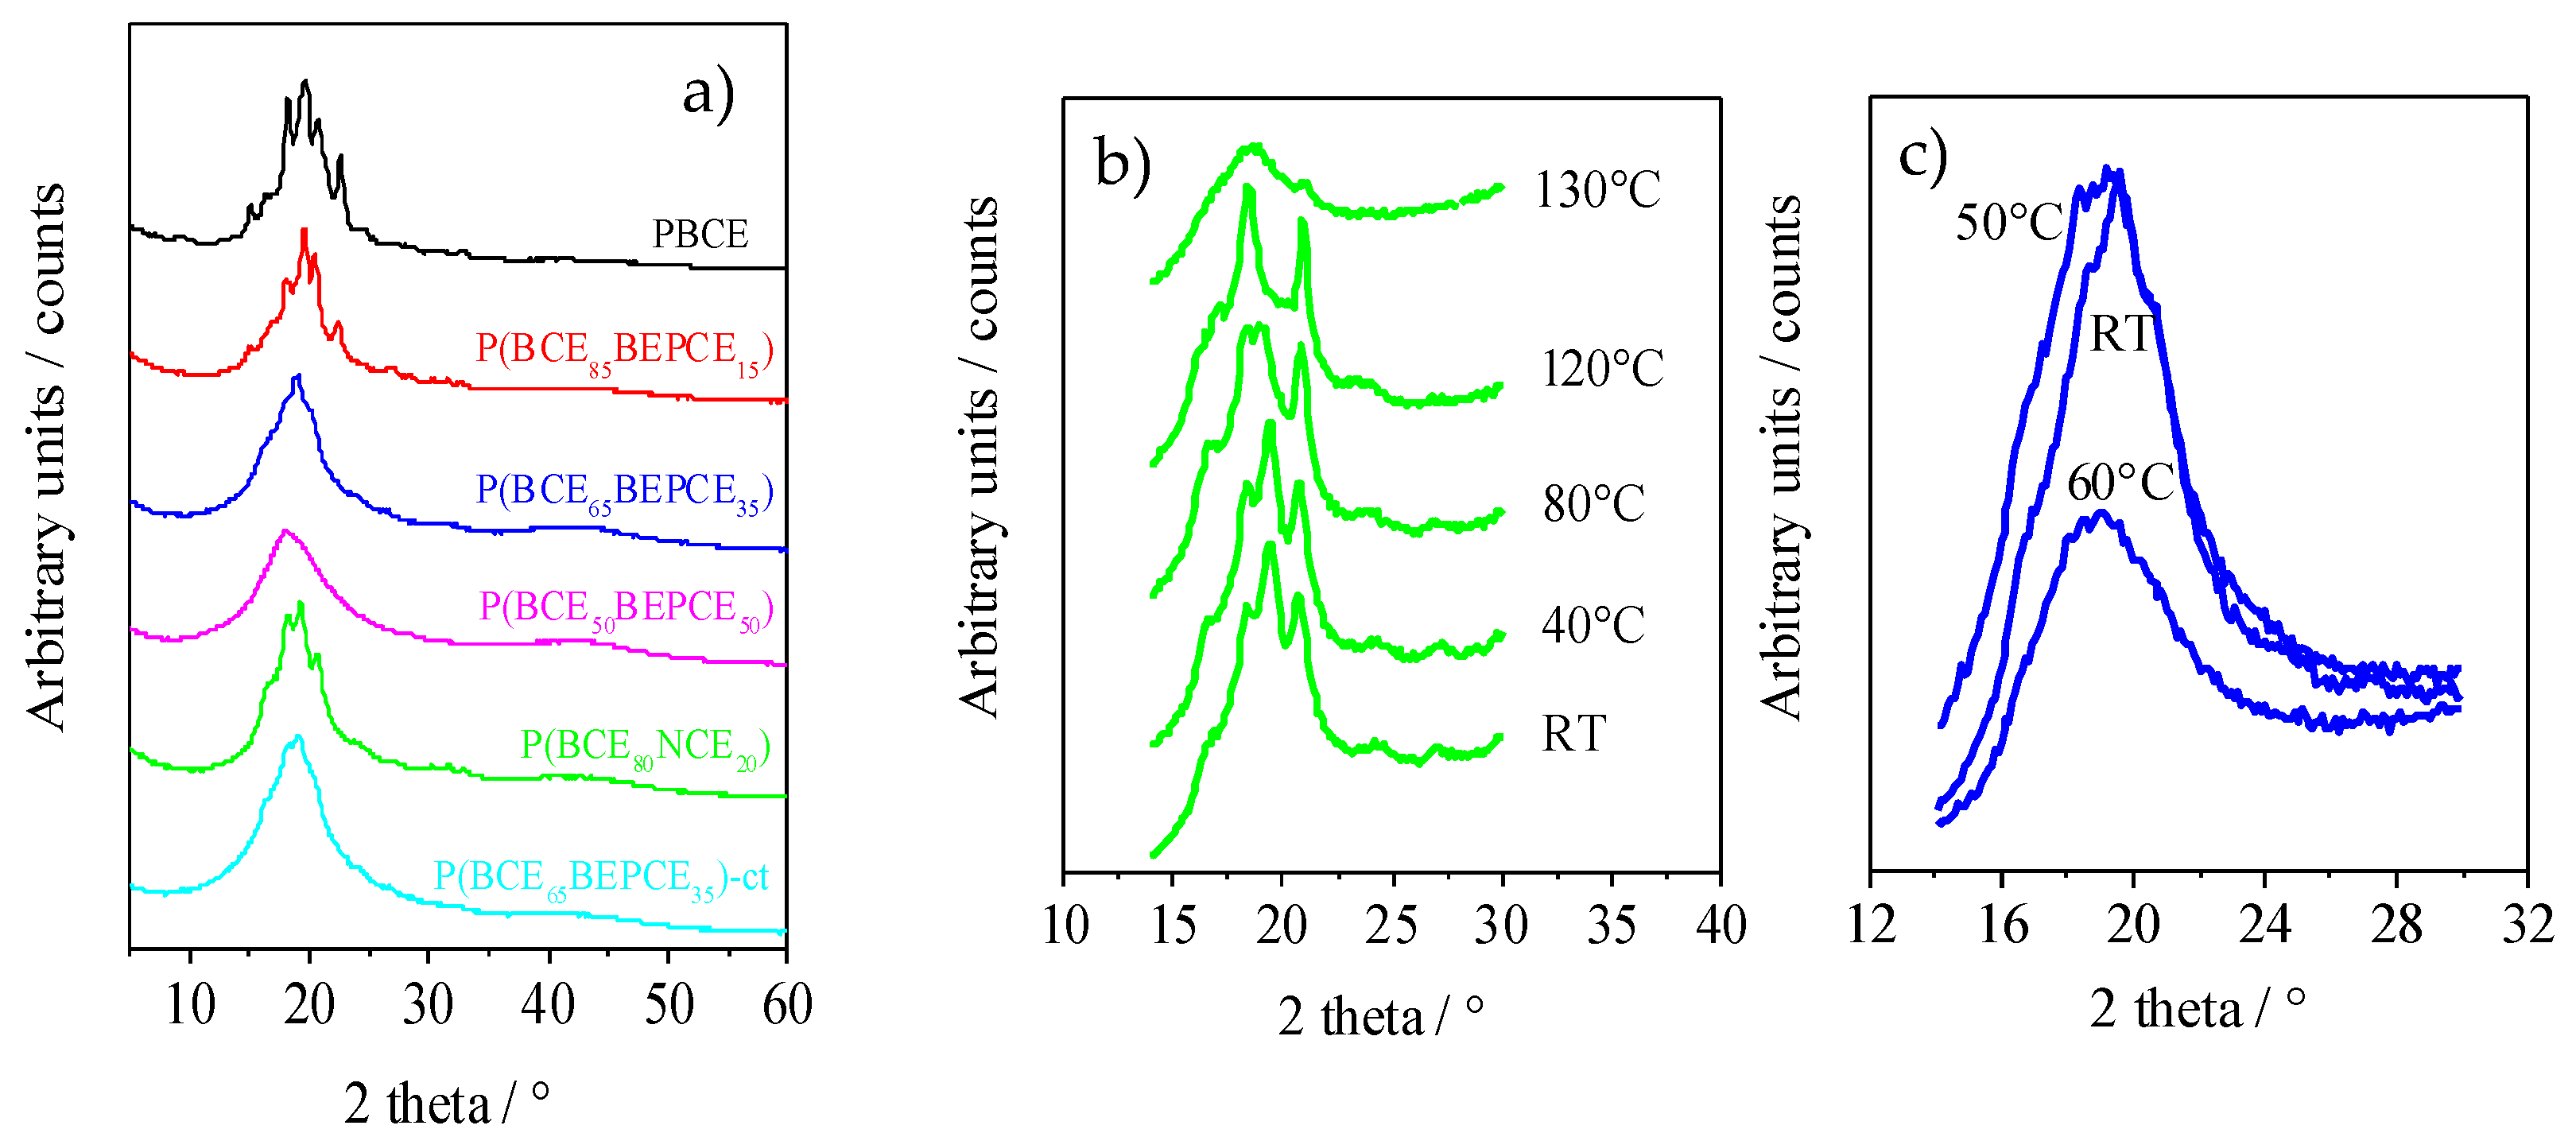
The XRD patterns of the polymers of this study are reported in
Figure 6a. The results, corresponding to the films of the calorimetric I scan traces, show that copolymerization induces wide crystallinity variation. The PBCE homopolymer is characterized by a more defined profile containing several peaks located at 9.3°, 15.1°, 16.6°, 18.2°, 19.3°, 20.7°, and 22.7°. As one can see from
Figure 6a, copolymerization causes a decrease in the intensity of XRD reflections even for low percentages of co-unit content. This effect is more pronounced for some peaks, particularly the ones at 9.3°, 15.1°, and 22.7°, that, still present in P(BCE
85BEPCE
15), disappear in the P(BCE
80NCE
20) copolymer containing a higher co-unit content, for which just the peaks at 16.6°, 18.2°, 19.3°, and 20.7° can be detected. These reflections, reduced consistently in intensity, are also the only ones visible in the copolymers with 35 mol% of BEPCE segments: P(BCE
65BEPCE
35) and P(BCE
65BEPCE
35)-ct. The disappearance of some peaks by copolymerization is not surprising, taking into account that previous studies have highlighted the polymorphic nature of PBCE homopolymer [
6,
22]. In this view, the selective reduction of the peaks 9.3°, 15.1°, and 22.7°, can be associated with the disappearance of an ordered phase whose formation is progressively compromised by the insertion of BEPCE and NCE segments in the main polymer chain. In the case of the P(BCE
50BEPCE
50) copolymer, no clear diffractometric reflections can be detected in the relative WAXS spectrum.
Moreover, the XRD results show no evidence of co-crystallization, either in P(BCE80NCE20) or in P(BCEmBEPCEn). This result is in agreement with the calorimetric data showing a lowering of TI proportional to the quantity of co-unit and independent on its nature.
Finally, the comparison of P(BCE65BEPCE35) and P(BCE65BEPCE35)-ct shows that the different isomerism of cyclohexane ring does not affect the nature of the crystalline phase developed.
The XRD measurements carried out at room temperature do not clarify the complex scenario evidenced for this copolyester system by DSC analysis. Consequently, temperature scanning diffractometric experiments have also been performed to follow the structural evolution of the polymers under study. In
Figure 6b, the XRD spectrum of P(BCE
80NCE
20) at different temperatures is reported. As one can see, as temperature increases, reflections at 18.2° and 20.7° arise and progressively grow at the expense of the peaks at 16.6° and 19.3°. The disappearance of these occurs at a temperature close to that of the endothermic peak I evidenced by calorimetric analysis (
Figure 5a), that is practically the only one present in the DSC traces of P(BCE
65BEPCE
35) and of P(BCE
65BEPCE
35)-ct copolymers. By further increasing the temperature, an improvement of peak resolution can be observed, suggesting that the double DSC peak II could be due to melting/crystallization of low ordered crystals.
In
Figure 6c, WAXS patterns of P(BCE
65BEPCE
35) at different temperatures are reported. It is worth noting that, at room temperature, this sample does not show defined peaks nor the typical bell shape of diffractometric amorphous halo. On the contrary, its corresponding pattern is pretty sharp and characterized by the presence of a broad peak that becomes less defined at 50 °C and suddenly disappears when the temperature reaches 60 °C. Simultaneously, at 60 °C, the XRD pattern presents the typical amorphous halo.
Comparing the evolution of the diffractometric profile measured at 50 °C, which is certainly not characteristic of a semicrystalline material, to the pattern at 60 °C, which is on contrary the typical pattern of a completely amorphous polymer, the presence of a 2D-ordered phase in the polymers under study can be hypothesized. As a matter of fact, in the wide group of main chain mesogenic-containing polymer liquid crystals (PLCs), there are different examples including 1,4-cyclohexane moieties as mesogenic groups [
23].
3.4. Mechanical Characterization
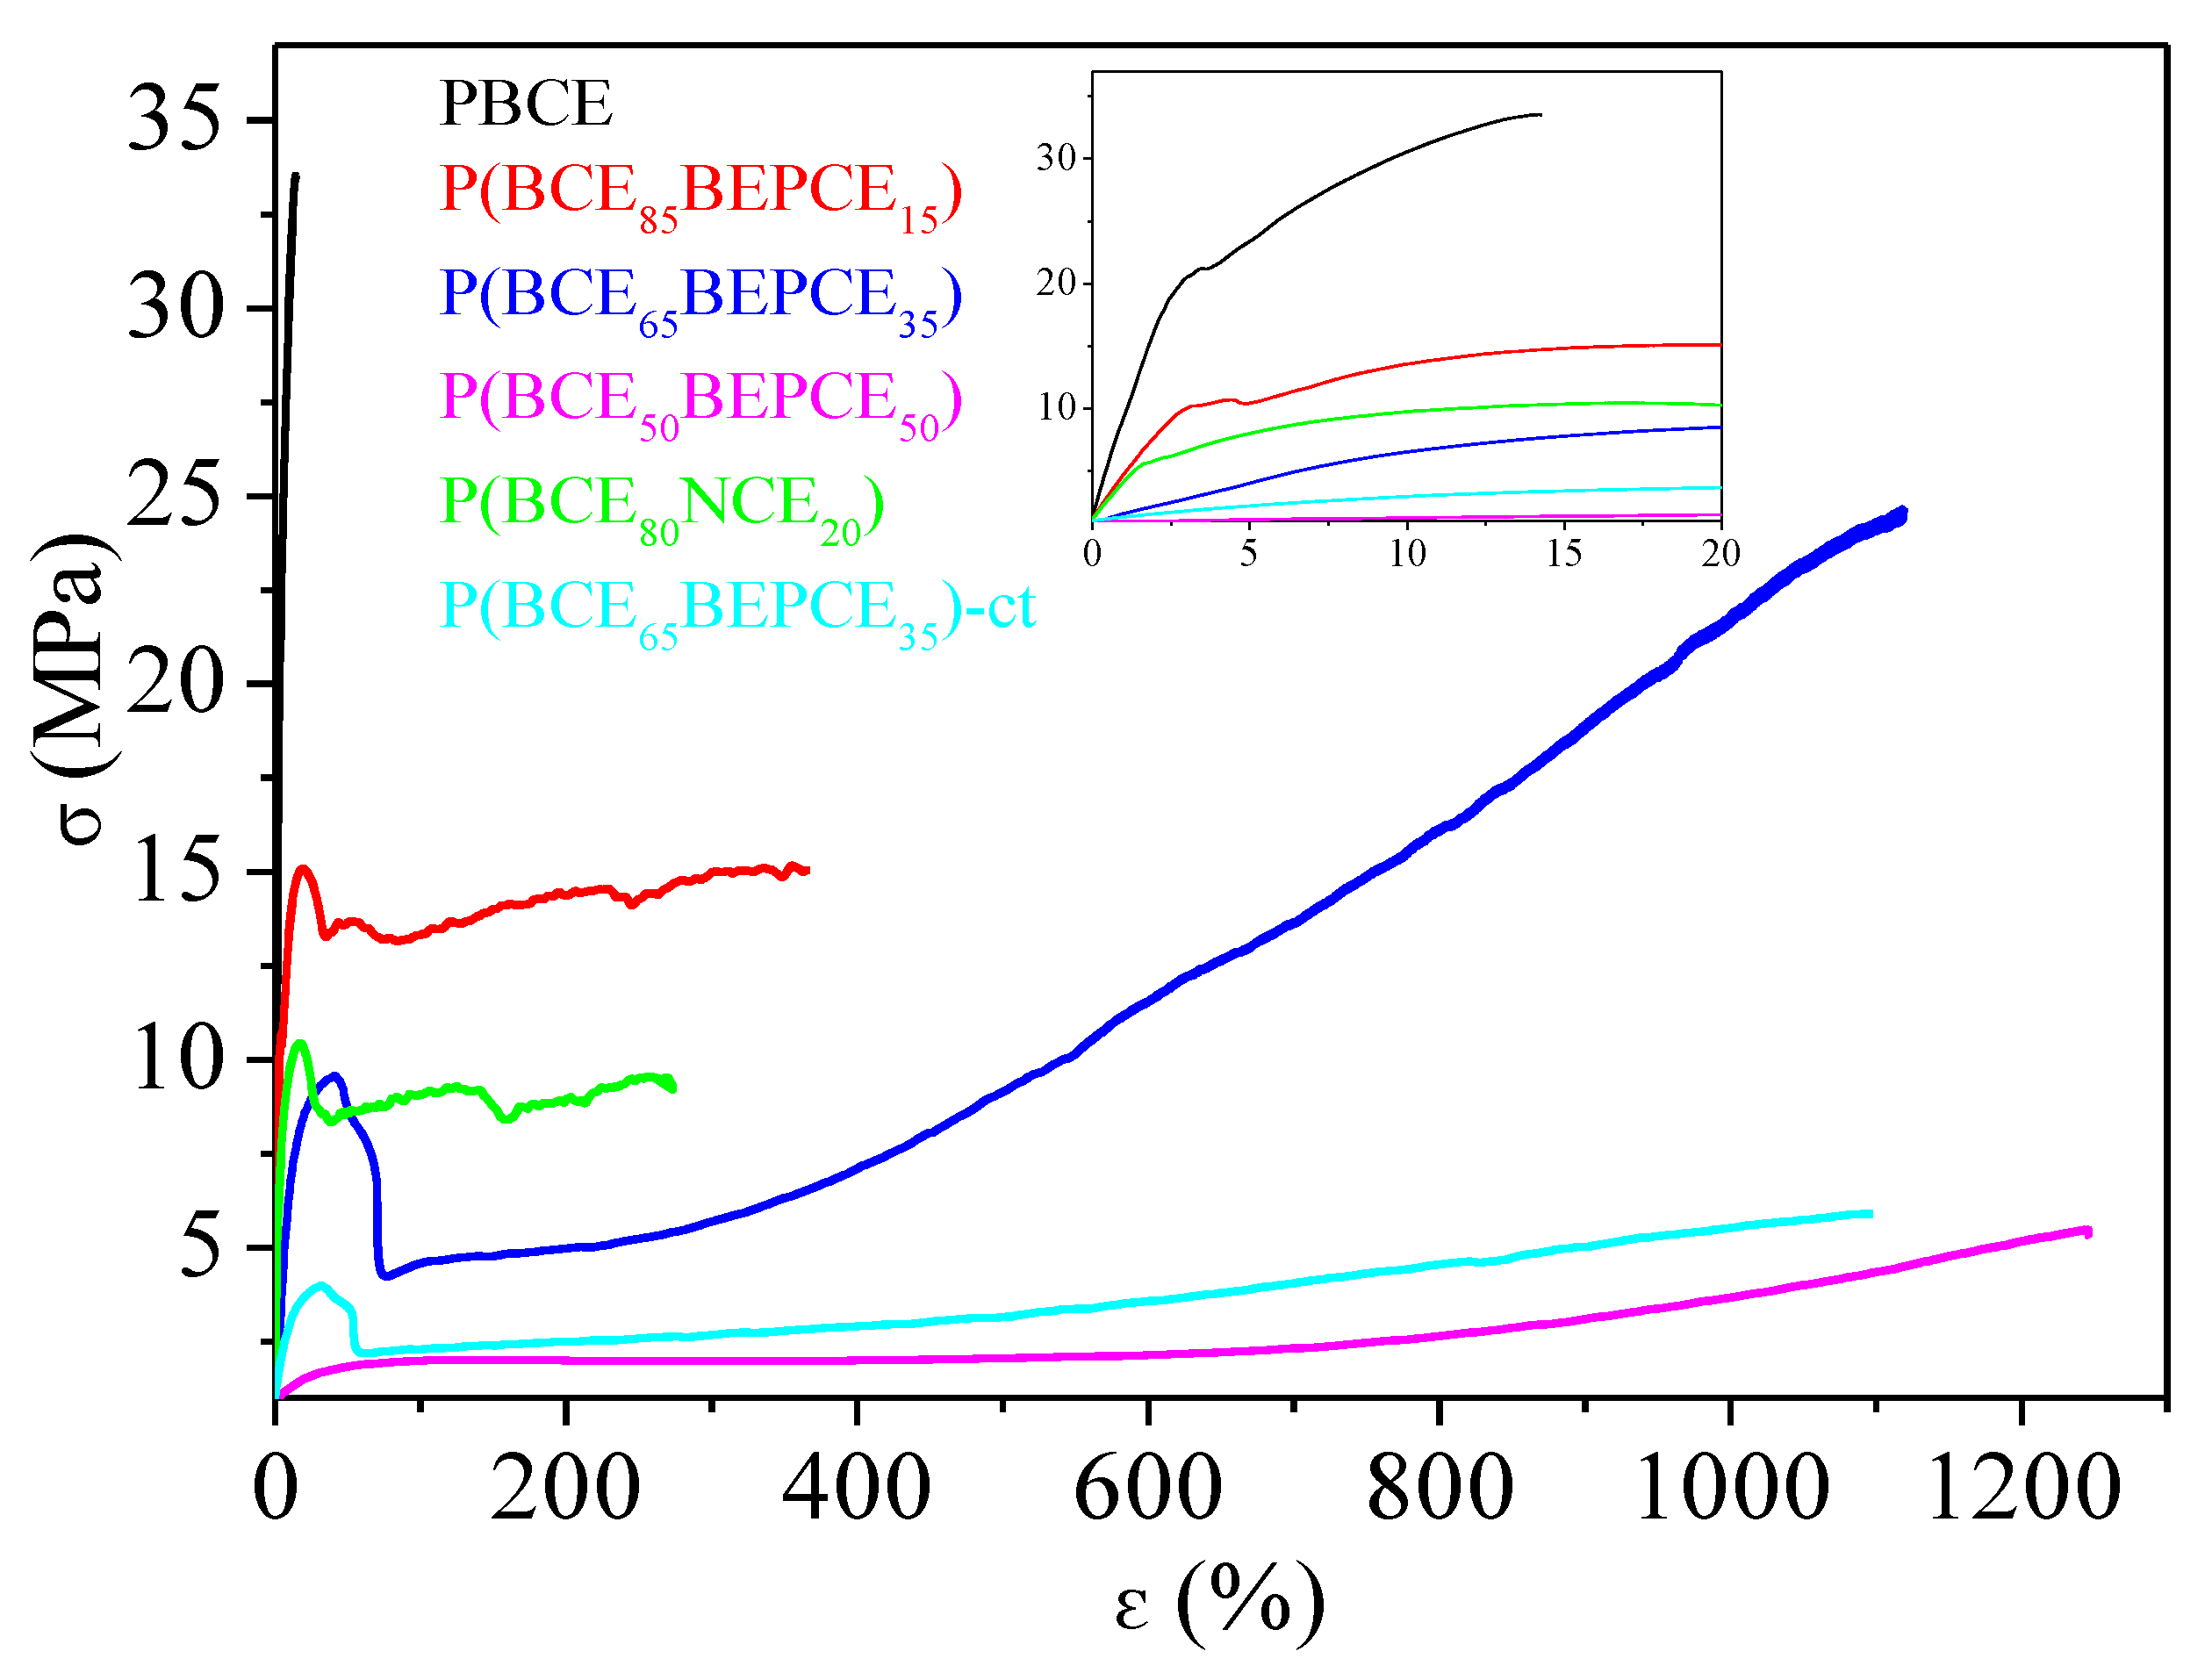
To test the mechanical performances of the materials synthesized, tensile measurements have been performed. The stress strain curves are shown in
Figure 7 and the mechanical data (elastic modulus
E, stress at break σ
b and elongation at break ε
b) are listed in
Table 4.
As one can see, the mechanical characterization has been performed on all samples, even on P(BCE50BEPCE50). This fact is quite surprising taking into account that this copolymer at room temperature is in its rubbery state and both calorimetric and diffractometric analyses do not evidence the presence of crystalline structures. Considering this situation, the possibility of obtaining a freestanding film of P(BCE50BEPCE50) could be attributed to the presence of a 2D-ordered phase, usually referred to as mesophase, developing in the material.
Previous studies have demonstrated that in main chain mesogenic-containing polymer liquid crystals (PLCs) with an even number of flexible –CH
2– groups, a smectic liquid crystal mesophase develops [
24,
25]. The corresponding isotropization is revealed in the DSC curve as a low intensity endothermic peak at a temperature between
Tg and
Tm. This should be the case for the homopolymer PBCE and its copolymers containing a higher amount of even number methylene group subunits (butylene moiety) with respect to the odd number –CH
2– glycol unit, i.e., BEP moieties (P(BCE
85BEPCE
15 and P(BCE
65BEPCE
35). These polymers, in fact, show an endothermic peak at about 50 °C that, as mentioned before, is not directly attributable to a classic 3D-ordered structure, being independent of composition and appearing at the same temperature regardless of the co-unit content.
On the other hand, for PLCs containing an odd number of –CH
2– groups, the formation of a nematic mesophase is favoured [
24,
25]. This kind of 1D-ordered phase can be also detected by DSC analysis, but the relative peak is located above T
m and the corresponding isotropization heat is lower than that of smectic mesophase. This could be the case for P(BCE
50BEPCE
50), which contains equimolar amounts of glycol sub-unit with even number of methylene groups (butylene subunits) and an odd number of –CH
2– (BEP) moieties.
The PBCE homopolymer appeared to be the most rigid material among those investigated, being characterized by the highest elastic modulus and stress at break, accompanied by the lowest elongation at break. The introduction of BEPCE co-units affects the mechanical response of PBCE homopolymer, causing the decrease of both E and σb. The entity of variation is a function of copolymer composition: the higher the co-unit amount, the larger the effect. This result is probably related to the gradual reduction of the crystallinity degree, Xc, in the copolymers with respect to the homopolymer. In particular, for the highest BEPCE co-units content P(BCE50BEPCE50), E decreases by more than two orders of magnitude, while σb is ten times lower. The presence of BEPCE comonomeric units also leads to an increase of εb from 19% for PBCE up to 1290% for P(BCE50BEPCE50).
By comparing P(BCE85BEPCE15) and P(BCE80NCE20) copolymers, it is observed that these samples have very similar composition but different glycol co-units and it is possible to evaluate the effect of side chain length on the mechanical response of the final material. In particular, as one can see, P(BCE80NCE20), although less crystalline, has an elastic modulus comparable to that of P(BCE85BEPCE15) and lower elongation at break. This result can be attributed to the minor plasticizing effect of the shorter side chains of the NCE co-units.
On the other side, comparison of P(BCE65BEPCE35) and P(BCE65NCE35)-ct copolymers, which have very similar compositions but different acid co-units, allows us to determine the effect of cis/trans isomerism of the aliphatic cyclohexane. As already highlighted by the calorimetric and diffractometric results, the two copolymer films have the same degree of crystallinity, Xc, and this explains the same elongation at break εb of the two materials. However, the sample containing cis/trans-1,4-cyclohexanedicarboxylate subunits shows lower elastic modulus and tensile stress. This evidence is probably related to the reduced structural symmetry that lowers the interactions between the different polymer chains and, consequently, facilitates their sliding under stretch.
3.5. Gas Barrier Performance
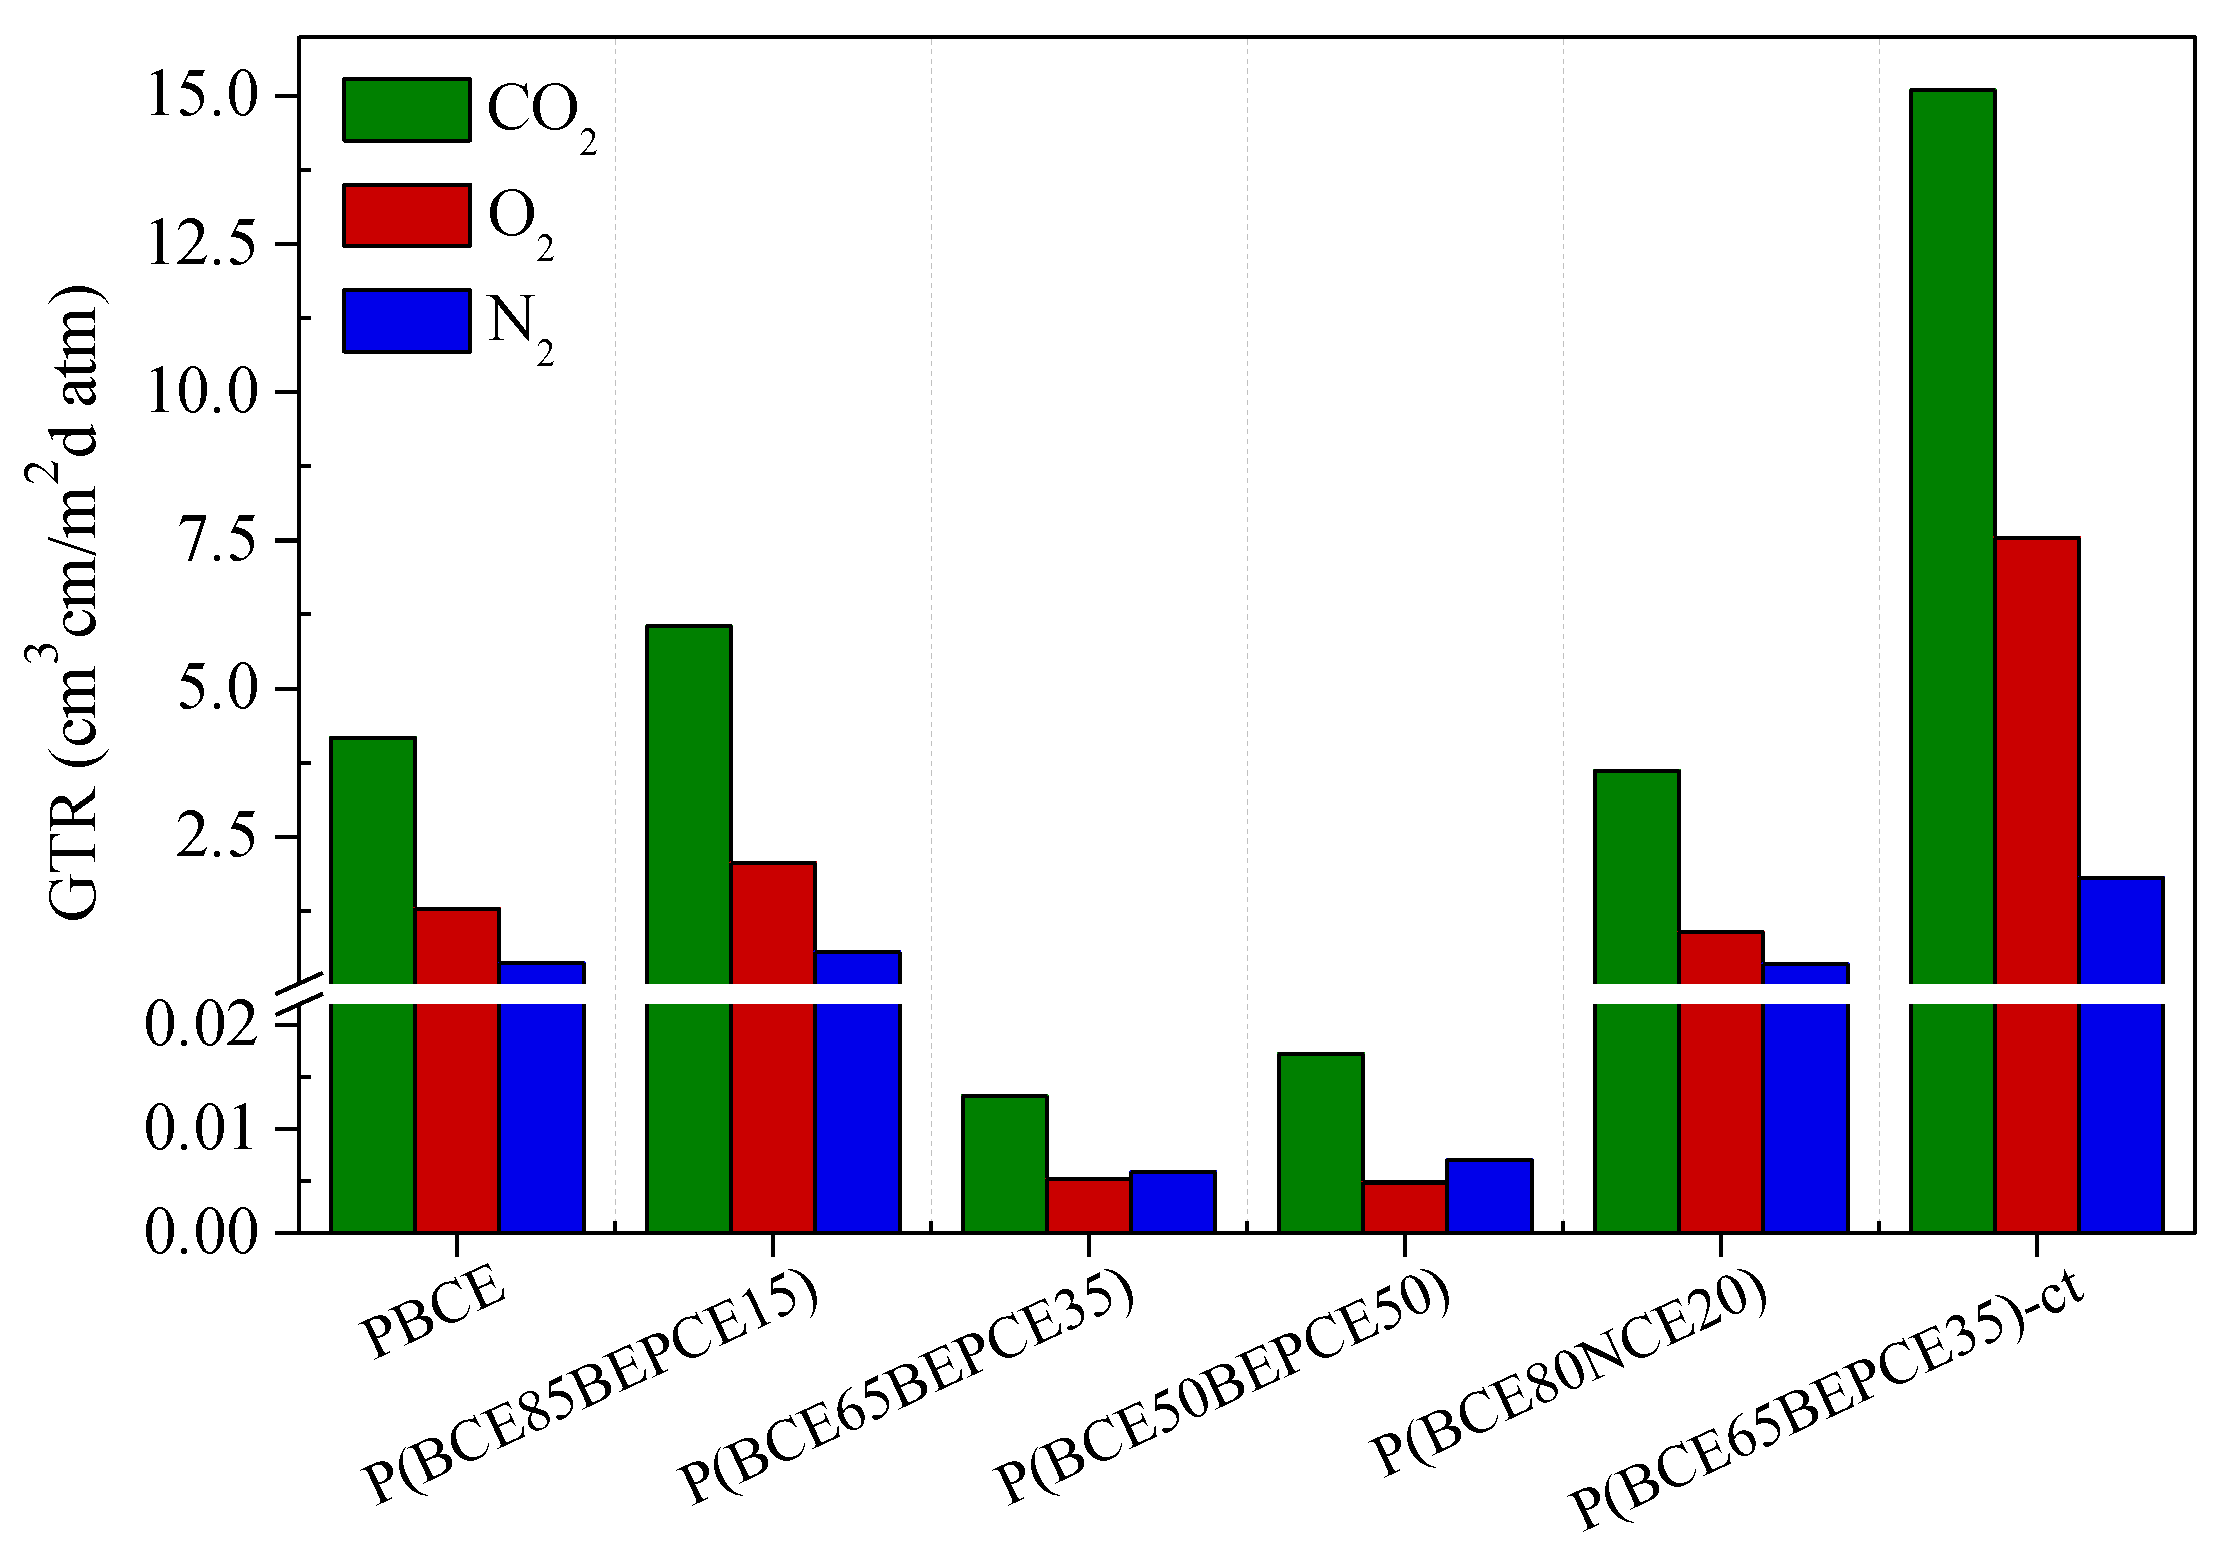
Gas barrier performances to dry N2, O2, and CO2 gases were evaluated at 23 °C, with the aim of enhancing the lifetime of the devices.
The permeability values, expressed as Gas Transmission Rate (GTR), are collected in
Table 4 and shown in
Figure 8 for the films under study.
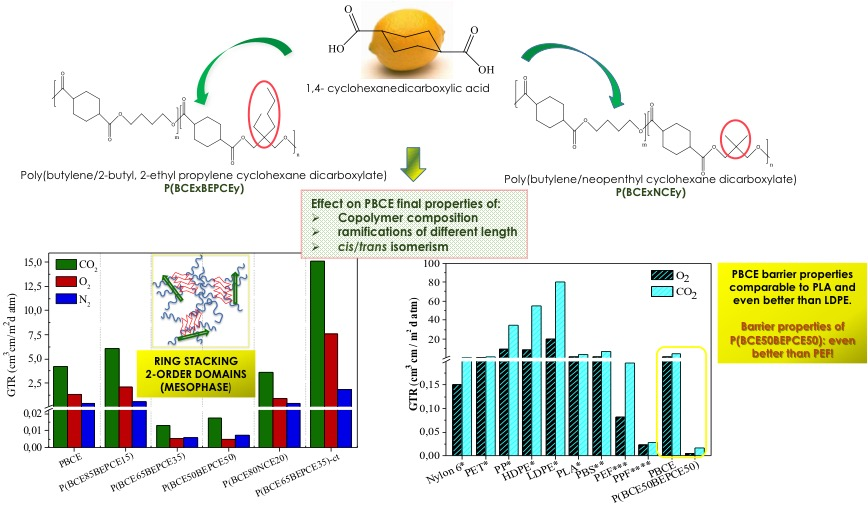
The results show that the introduction of low amount of BEP glycol co-units in the main PBCE polymer chain causes a slight increase of gas permeability. On the contrary, by increasing the percentage of comonomer (35 and 50 mol%), an outstanding improvement of the barrier effect is achieved: the measured GTR value is 50 times lower for N2 and 250 times decreased for O2 and CO2. The result is even more surprising if we consider that the P(BCE65BEPCE35) copolymer is much less crystalline than the PBCE homopolymer and the P(BCE50BEPCE50) sample is even amorphous. Consequently, the very low GTR values cannot be explained, on the basis of the higher crystallinity degree of these materials. Moreover, considering that in the operative conditions, both copolymers P(BCE65BEPCE35) and P(BCE50BEPCE50) are in the rubbery state (Tg < 23 °C), the extraordinary barrier performances cannot be attributable to the glassy state that, as well known, shows a free volume lower than the corresponding rubbery phase. In this view, the experimental data could probably be explained as being due to the polymer chains’ ability to develop a 2D-orderd structure, generally defined as mesophase, which hinders the gas passage. This kind of arrangement is due to the simultaneous presence in the polymer chain of rigid units (aliphatic cyclohexane ring) alternating with flexible segments (aliphatic glycolic moiety). Therefore, the presence of this 2D-organized phase, evidenced by calorimetric and diffractometric experiments and also suggested by the mechanical response obtained, could be responsible for the outstanding barrier properties of these materials, analogous to what happens in crystalline liquids.
By comparing the two copolymers with similar composition but different side chains, P(BCE85BEPCE15) and P(BCE80NCE20), the effect of chain length can be evidenced. The short branch P(BCE80NCE20) copolymer shows better barrier performance. This result is in line with the higher macromolecular rigidity revealed by calorimetric analysis for the NCE containing copolyester. Again, the result observed is not explainable on the basis of crystallinity degree, with the P(BCE80NCE20) sample being less crystalline than P(BCE85BEPCE15). A possible reason for the experimental data could be the less effective arrangement that can be achieved in the copolymer containing longer and more sterically encumbering ramifications. On the contrary, the shorter ramifications in the P(BCE80NCE20) sample favor a more efficient macromolecular chain packing that can better hamper the gas molecules’ transit.
It is also interesting to note how the isomerism of the cyclohexane ring has a remarkable effect on gas barrier properties. In particular, the presence of a cis isomer together with the trans one in P(BCE65BEPCE35)-ct determines a substantial increase of GRT values. To explain this effect, one could consider that, unlike the trans isomer rings that tend to assume the chair conformation in the polymer chain, the rings with cis isomerism are more stable in the boat conformation. Accordingly, in the copolymer with an equimolar mixture of cis and trans acid sub-units, the stacking of the mesogenic aliphatic cyclohexane rings, and thus the formation of 2D ordered domains, will be limited between rings of the same type. This situation leads to less efficient packing and therefore to higher free volume, as also highlighted by the calorimetric analysis (lower Tg), with a consequent increase of gas molecule permeability for P(BCE65BEPCE35)-ct.
Finally, for all samples under consideration, CO2 is the gas that spreads faster through the films despite its larger dimension. This evidence can be related to the lower CO2 solubility in the highly hydrophobic polymer matrix.
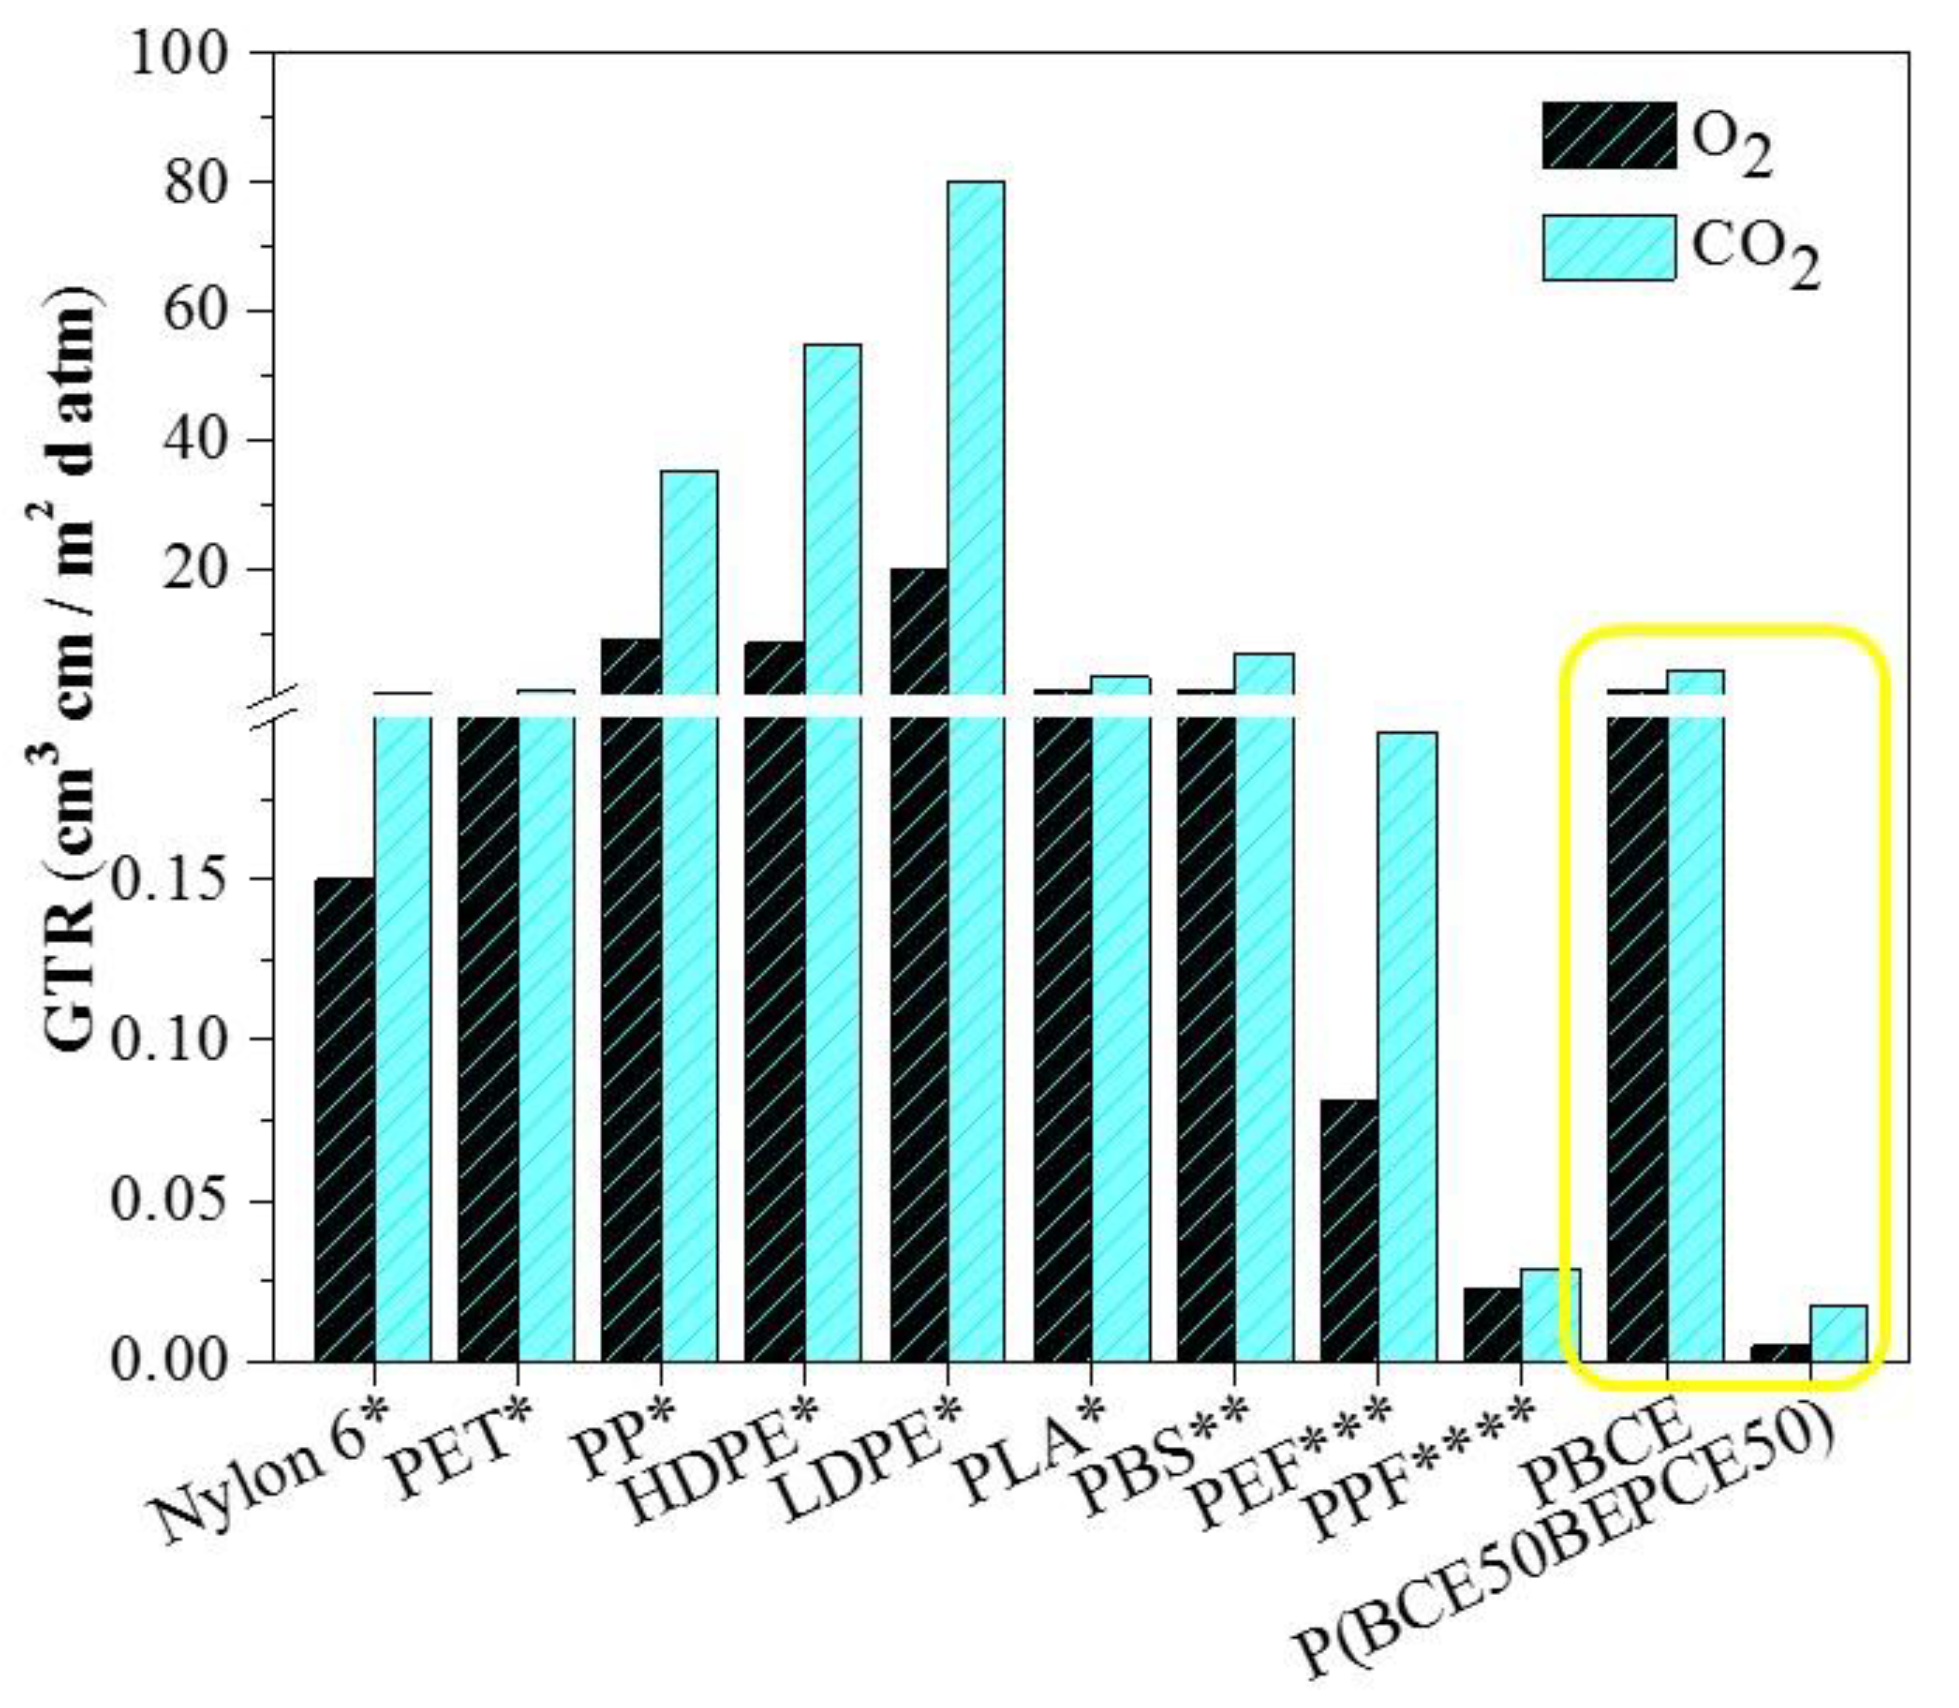
Last but not least, the PBCE homopolymer and the P(BCE
50BEPCE
50) random copolymer, the latter having the best performance among the polymers investigated in the present paper, have been compared with some common petrochemical-based polymeric packaging materials and some biopolymers (see
Figure 9).
As it can be seen, P(BCE50BEPCE50) exhibits excellent barrier properties, being by far the highest performing material among those considered. Whilst this comparison is far from being exhaustive, it can be considered meaningful to highlight the potential of these new materials for use as high barrier films.


 ,
, 


