Flexible Adhesive in Composite-to-Brick Strengthening—Experimental and Numerical Study


Abstract

1. Introduction
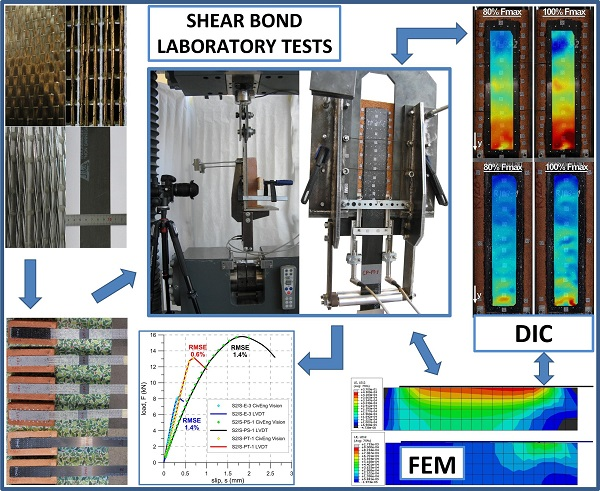
2. Laboratory Tests
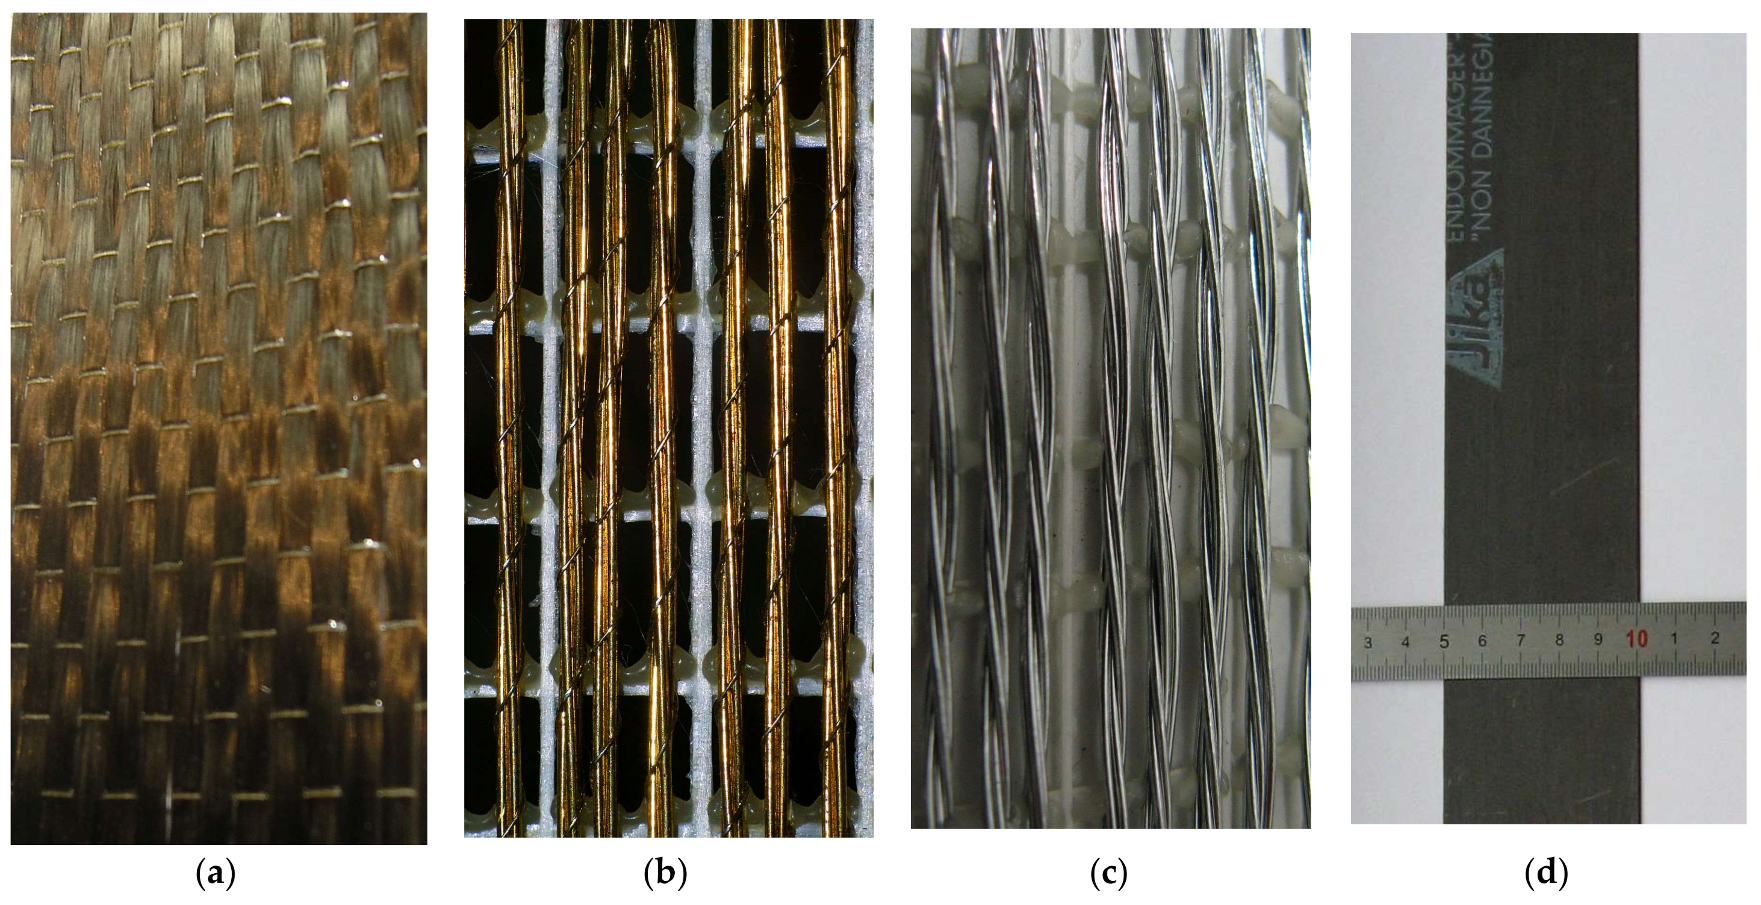
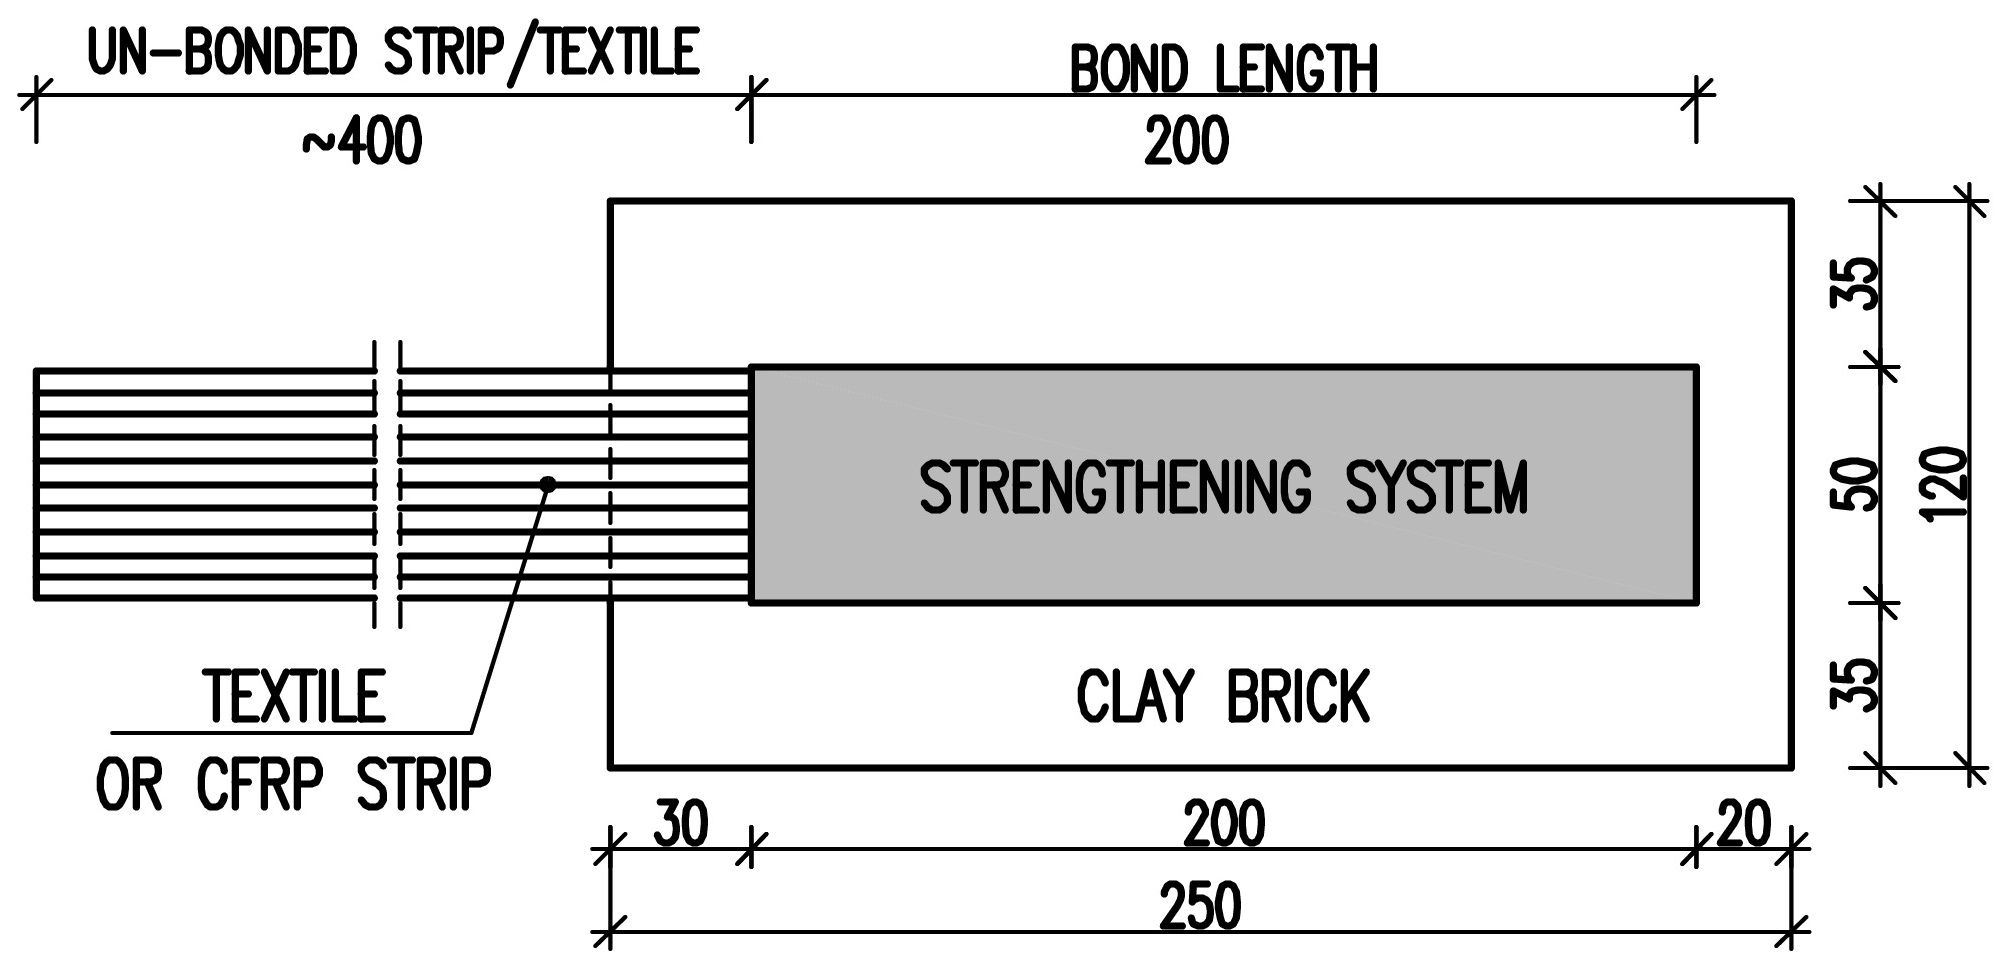
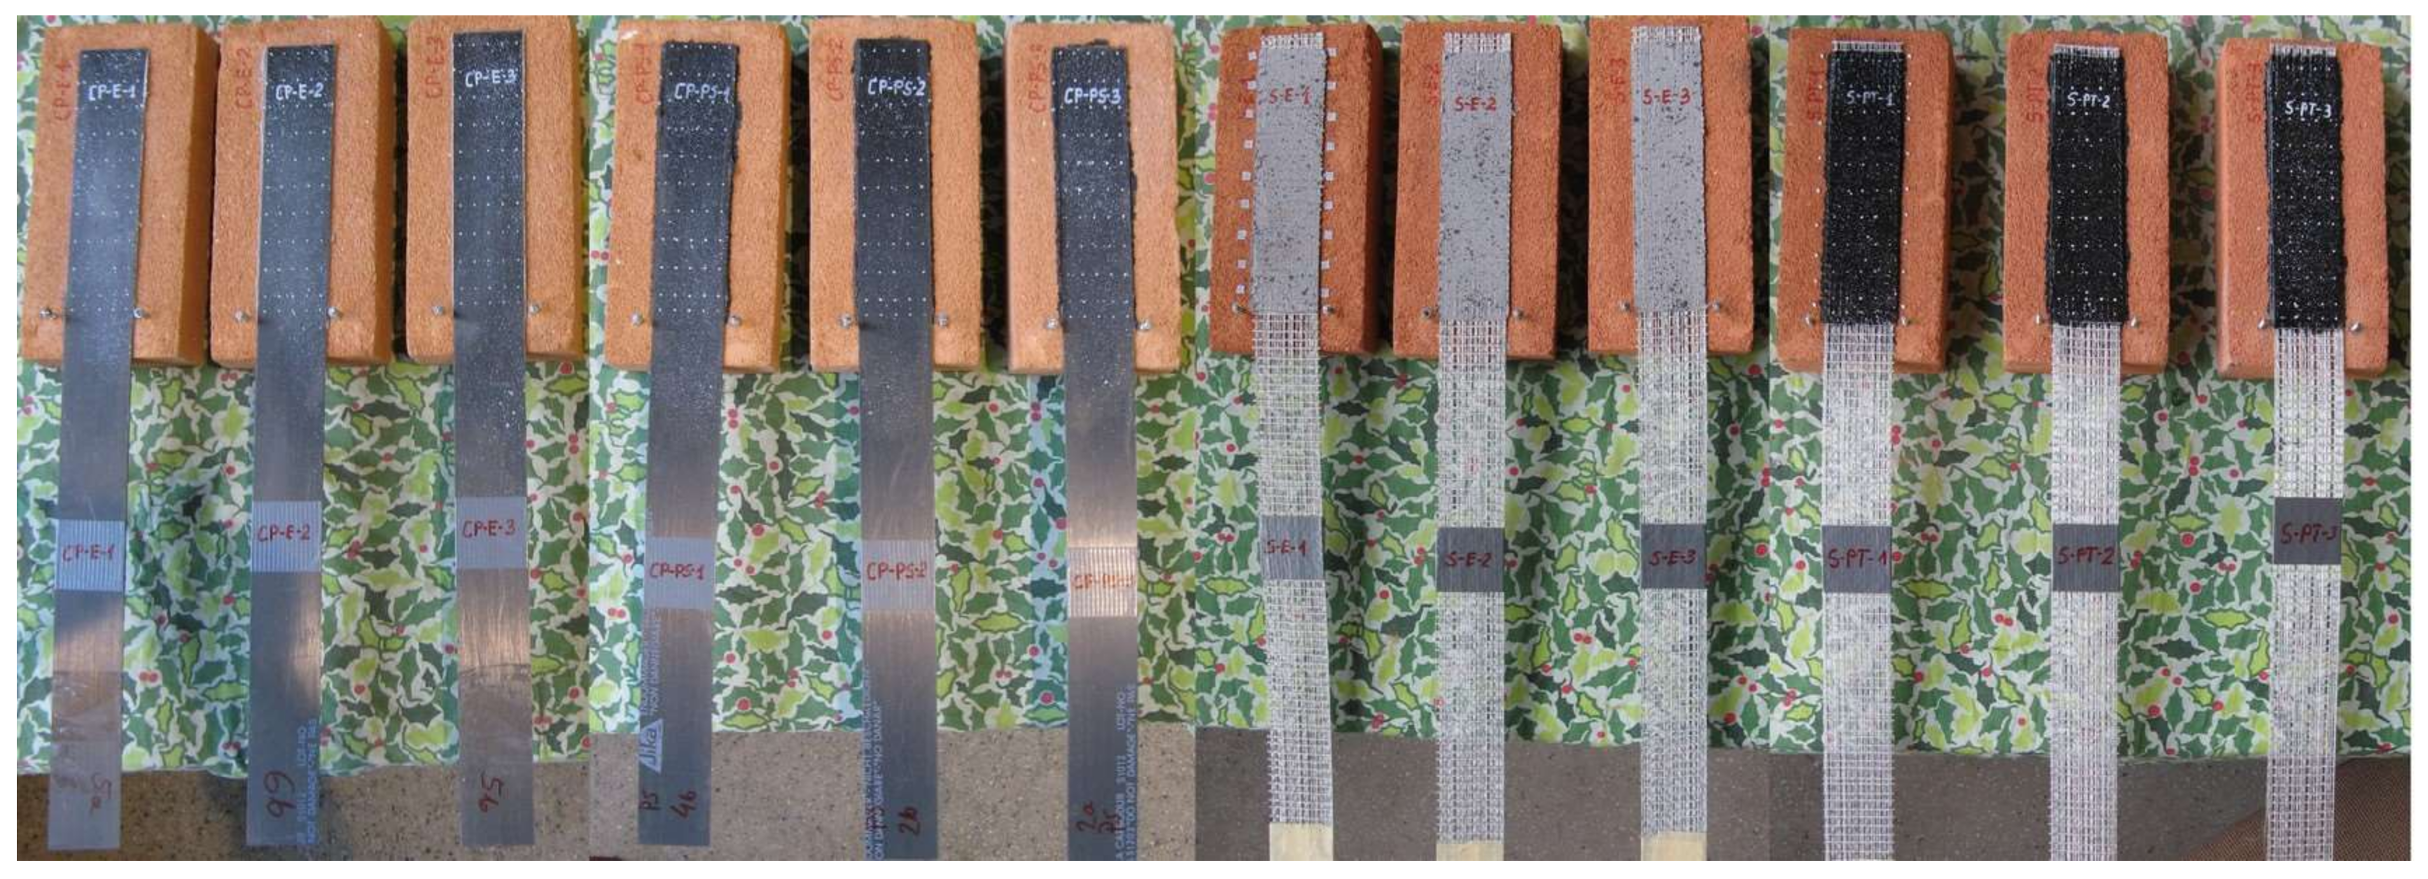
2.1. Materials and Specimen Preparation
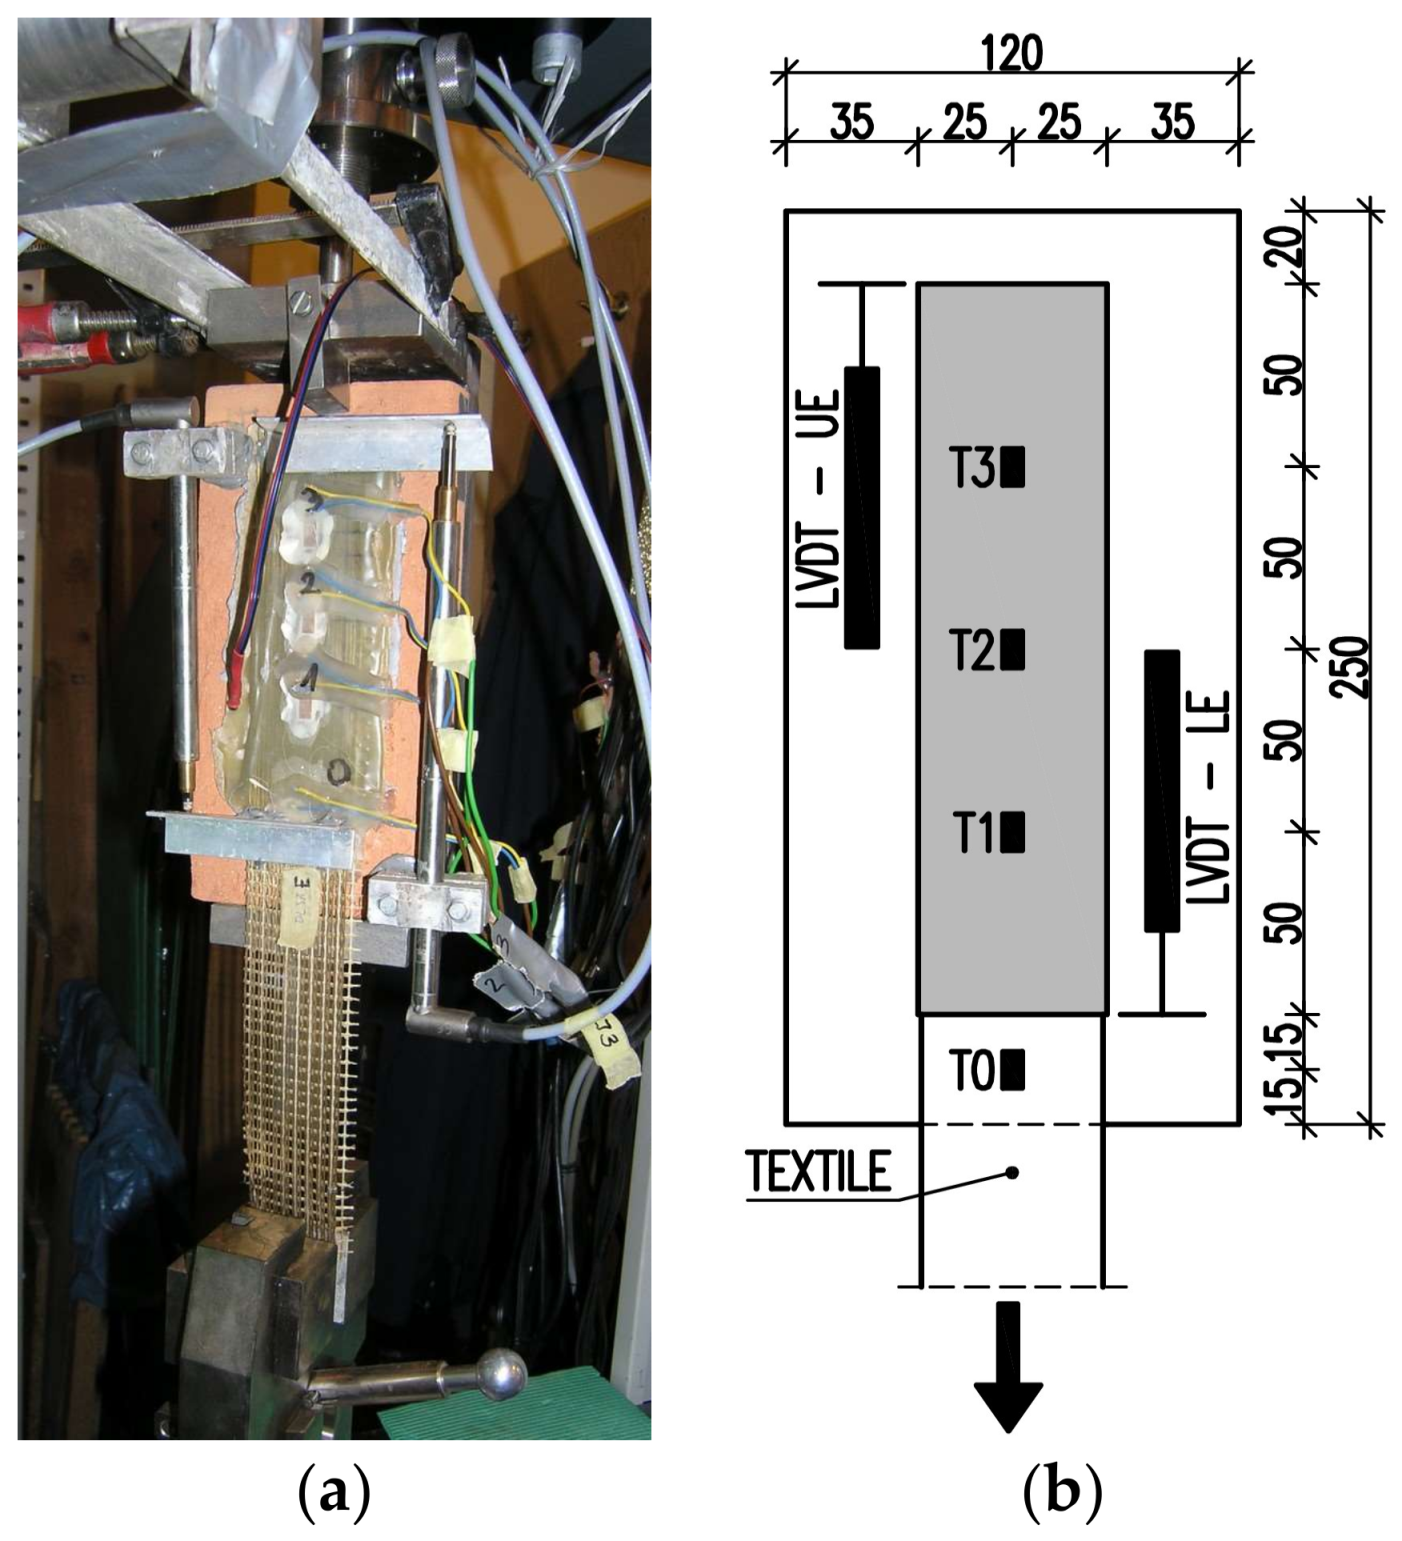
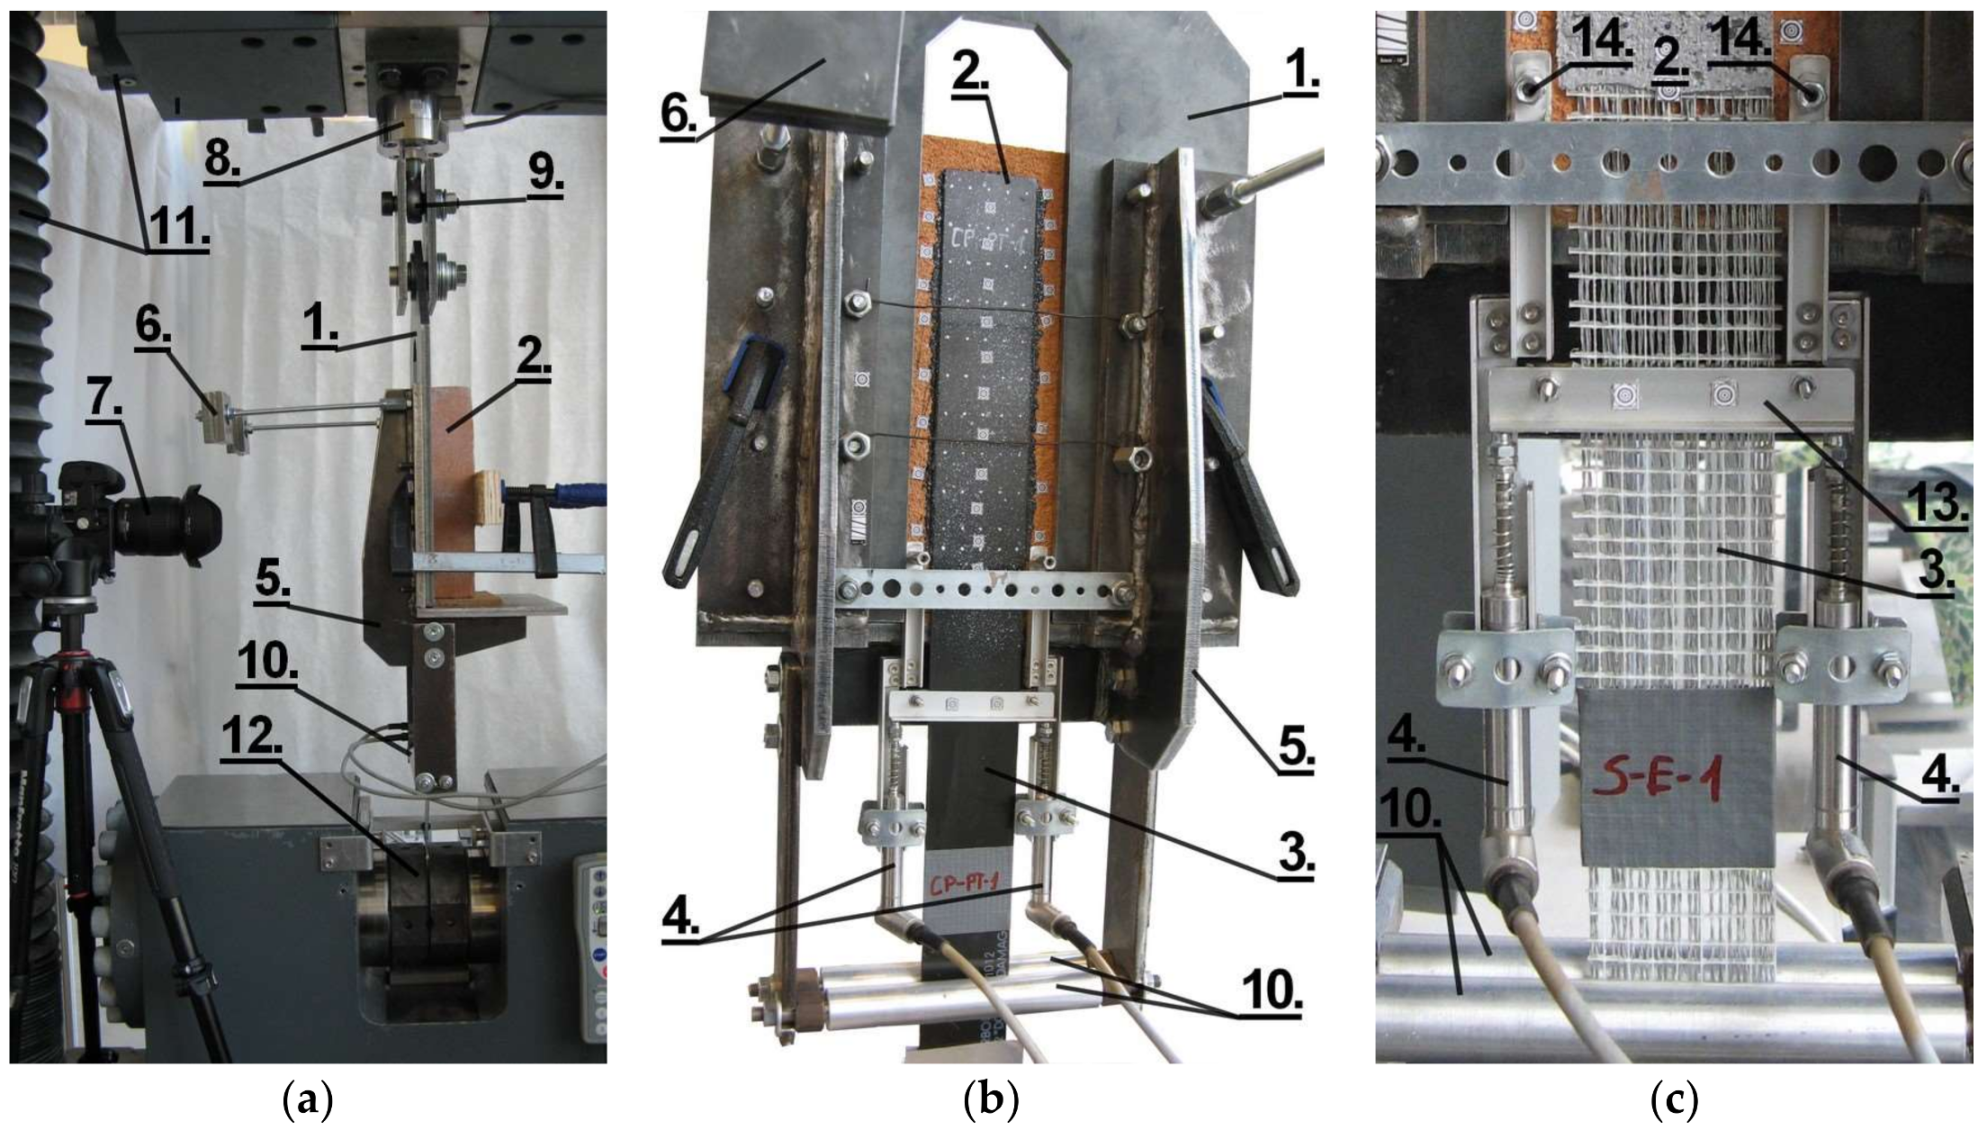
2.2. Test Set-Ups and Experimental Procedure
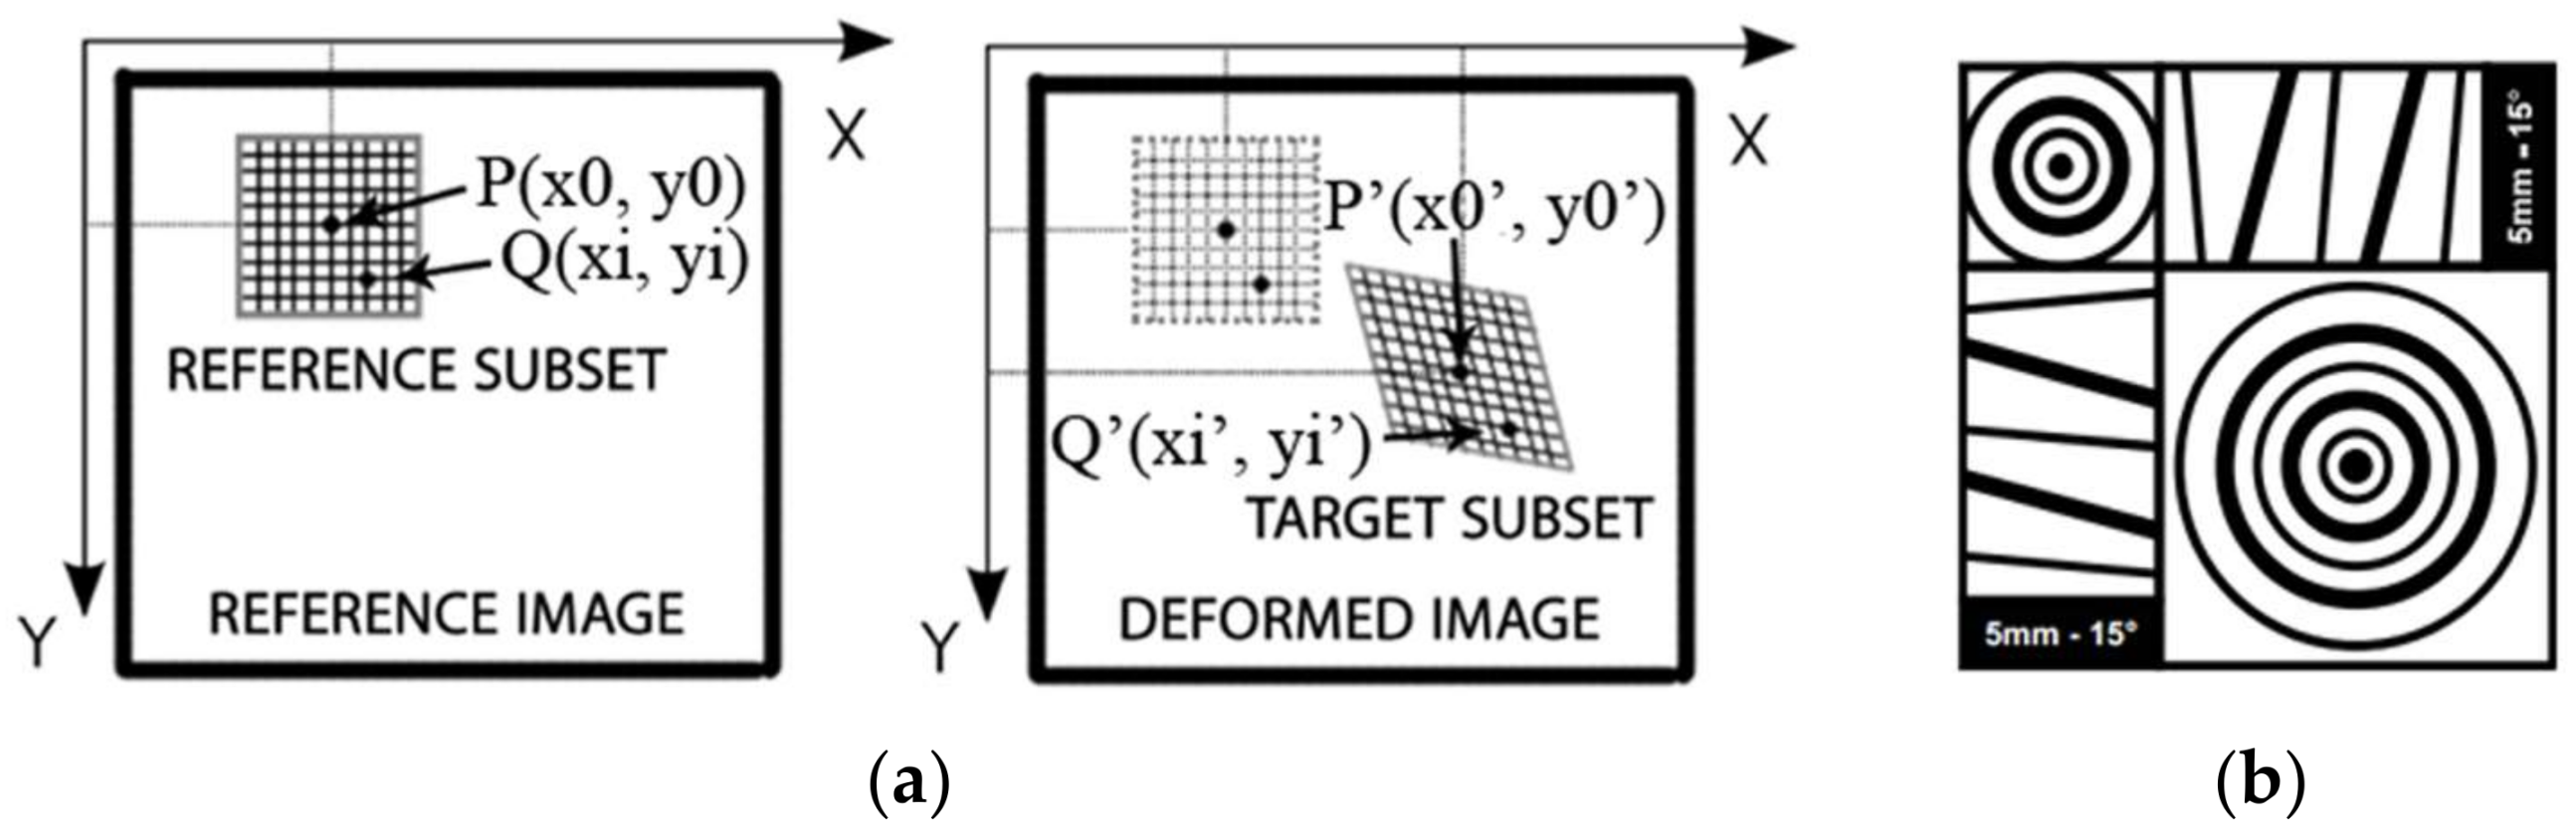
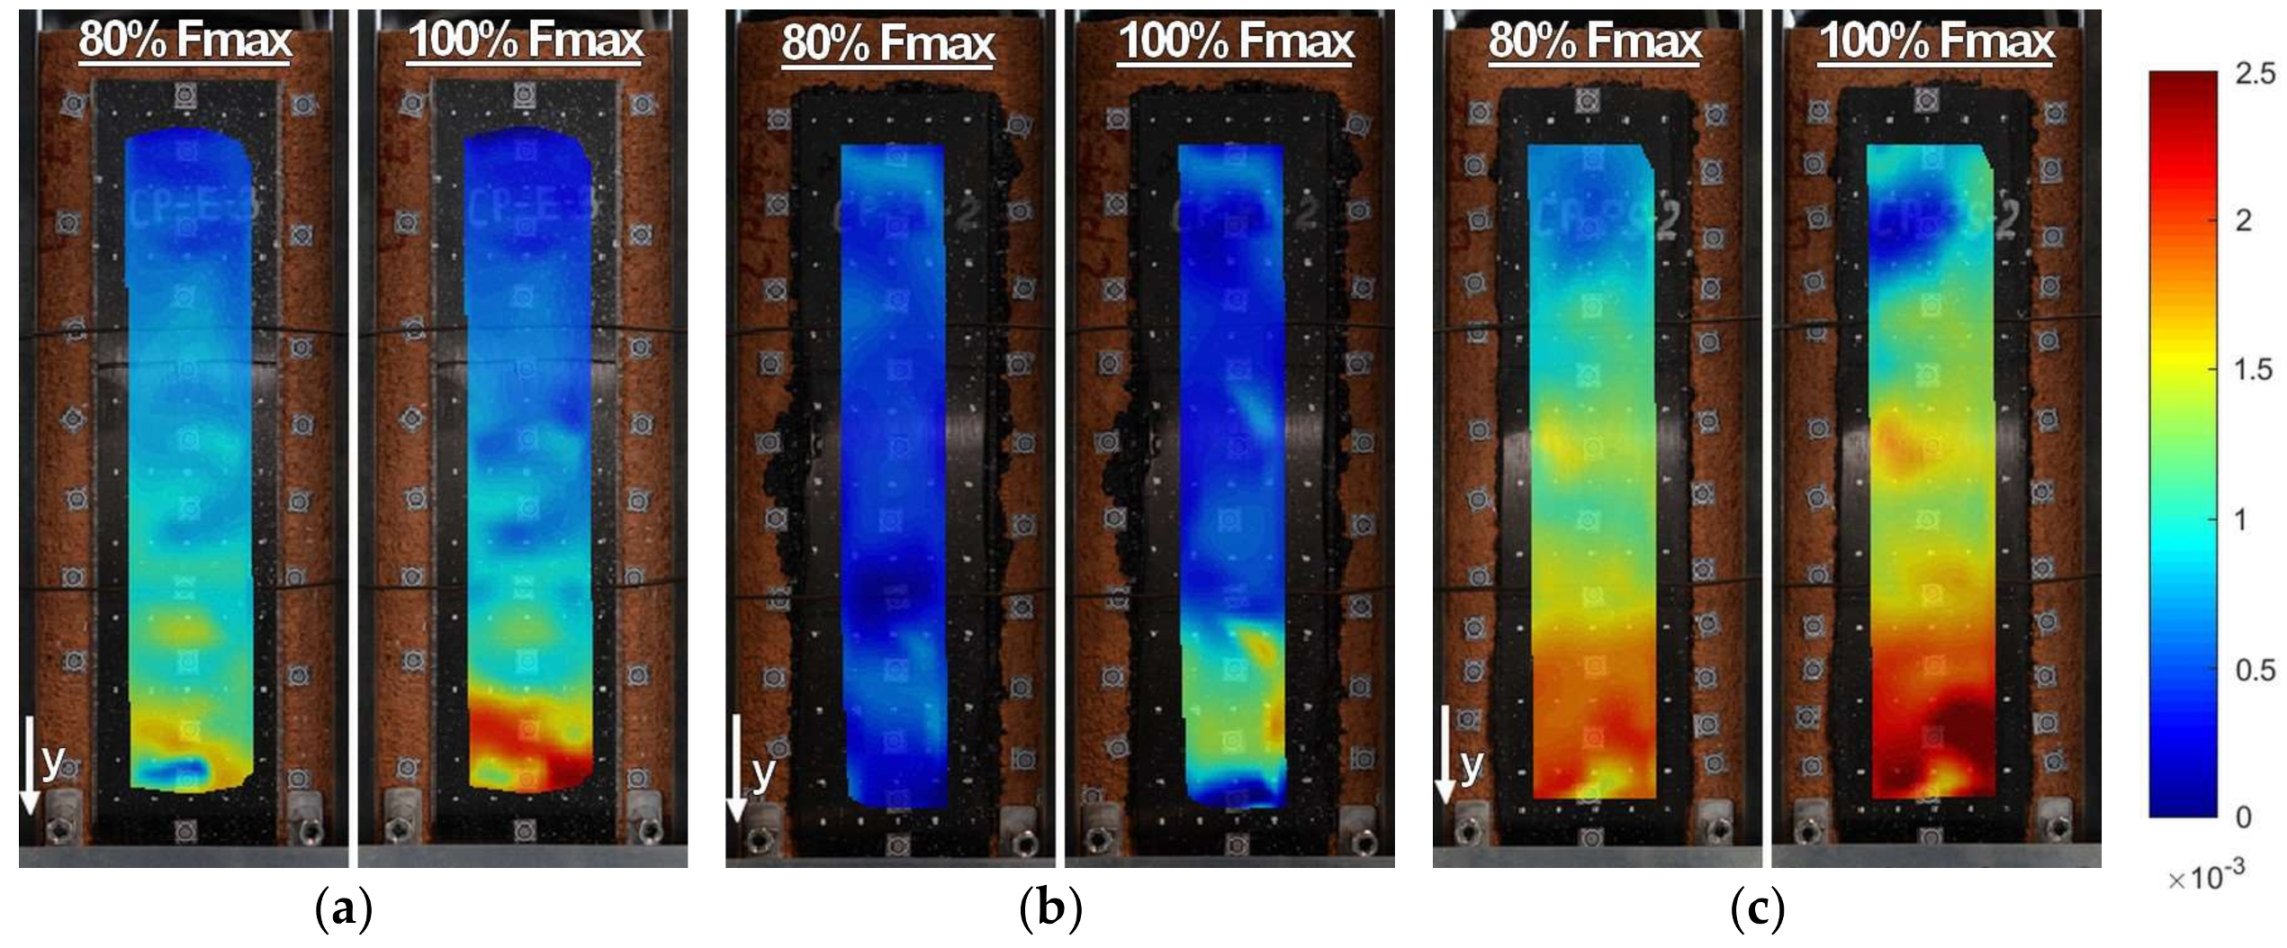
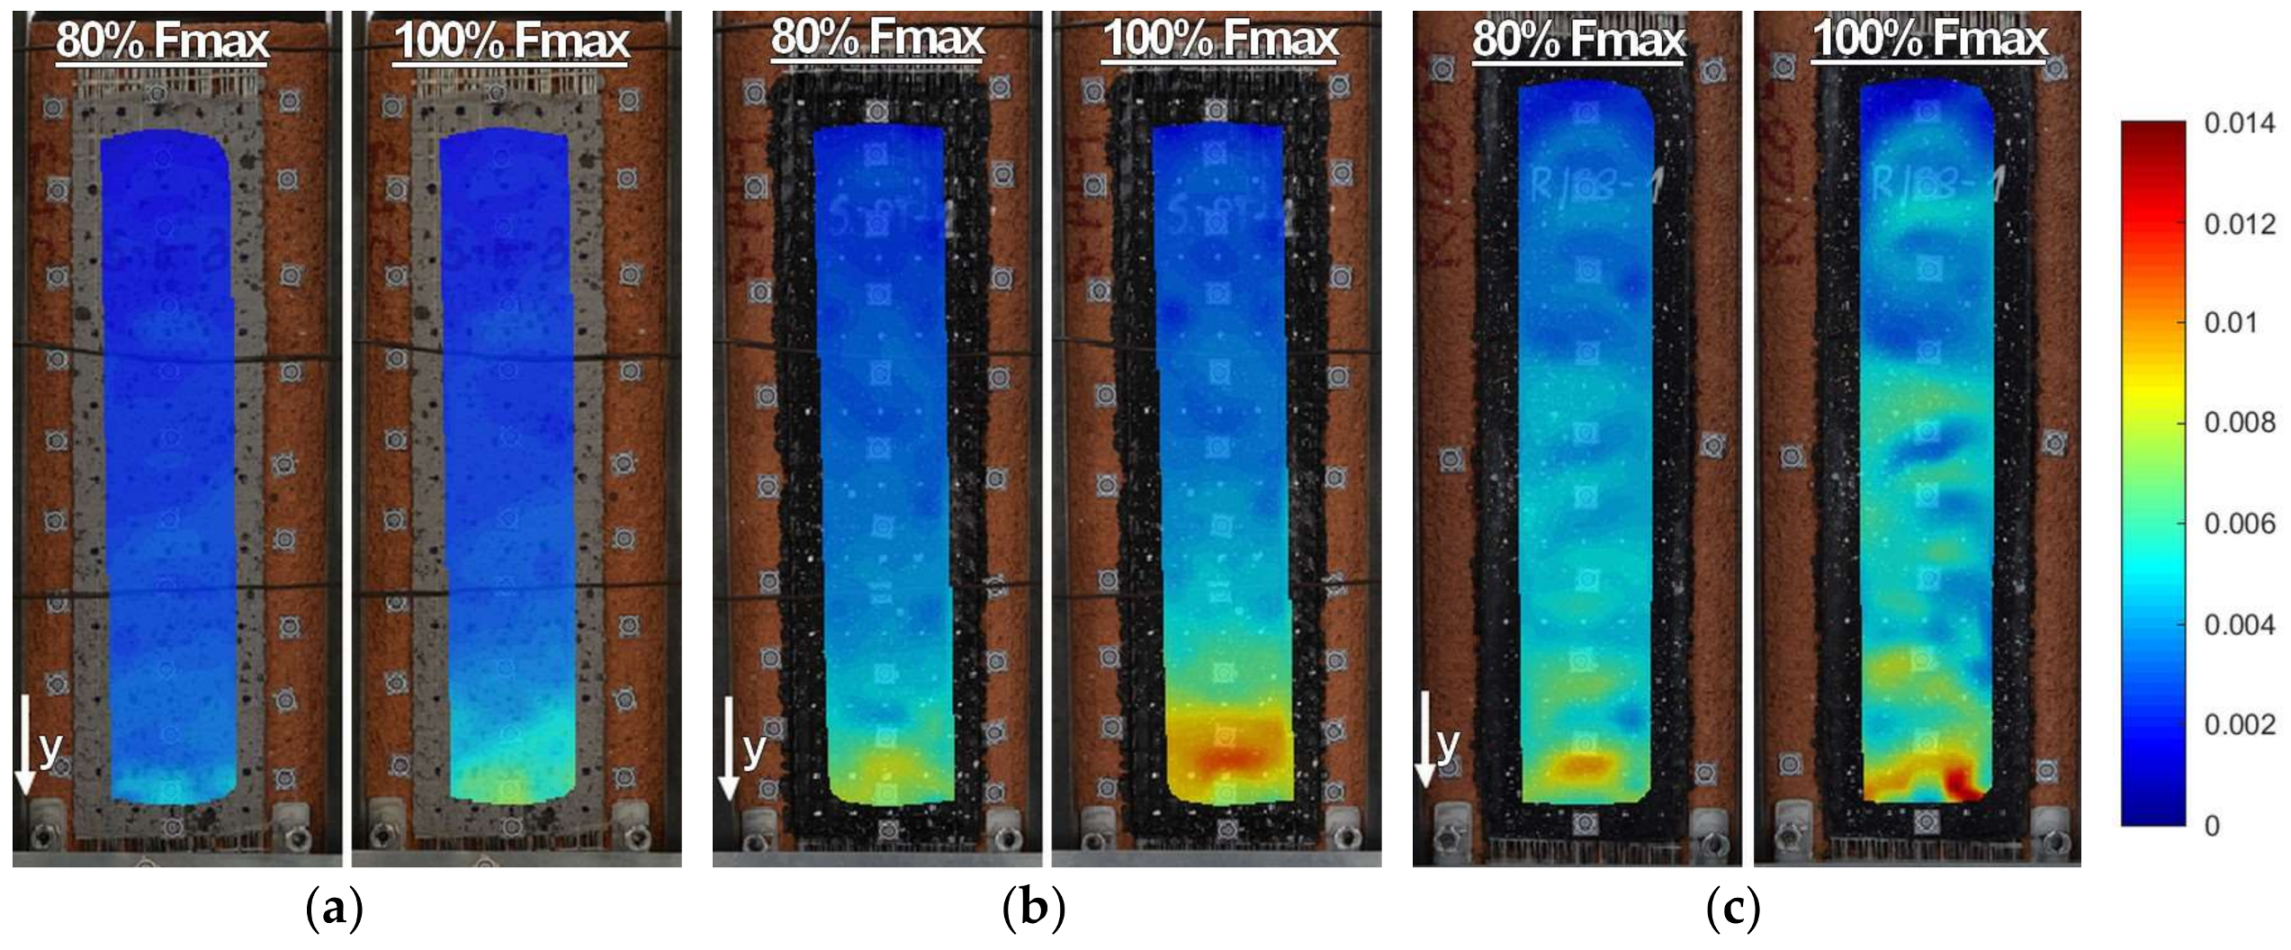
2.3. DIC
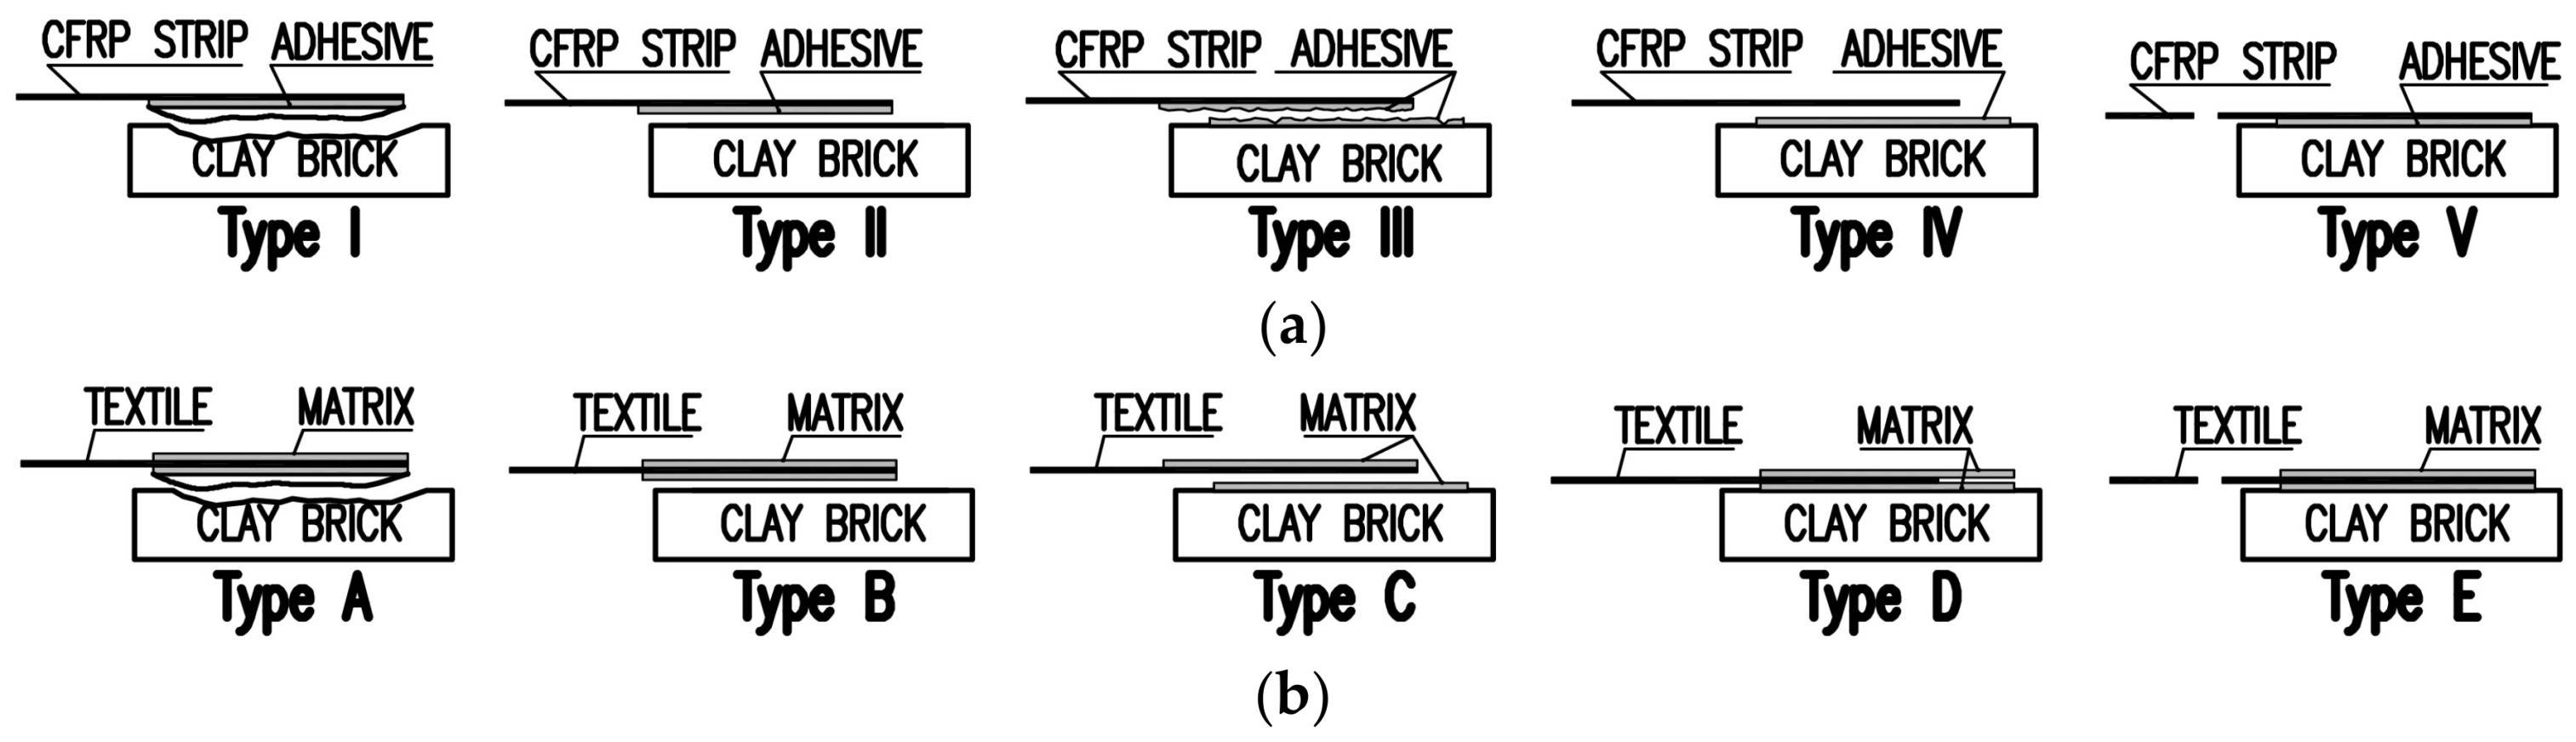
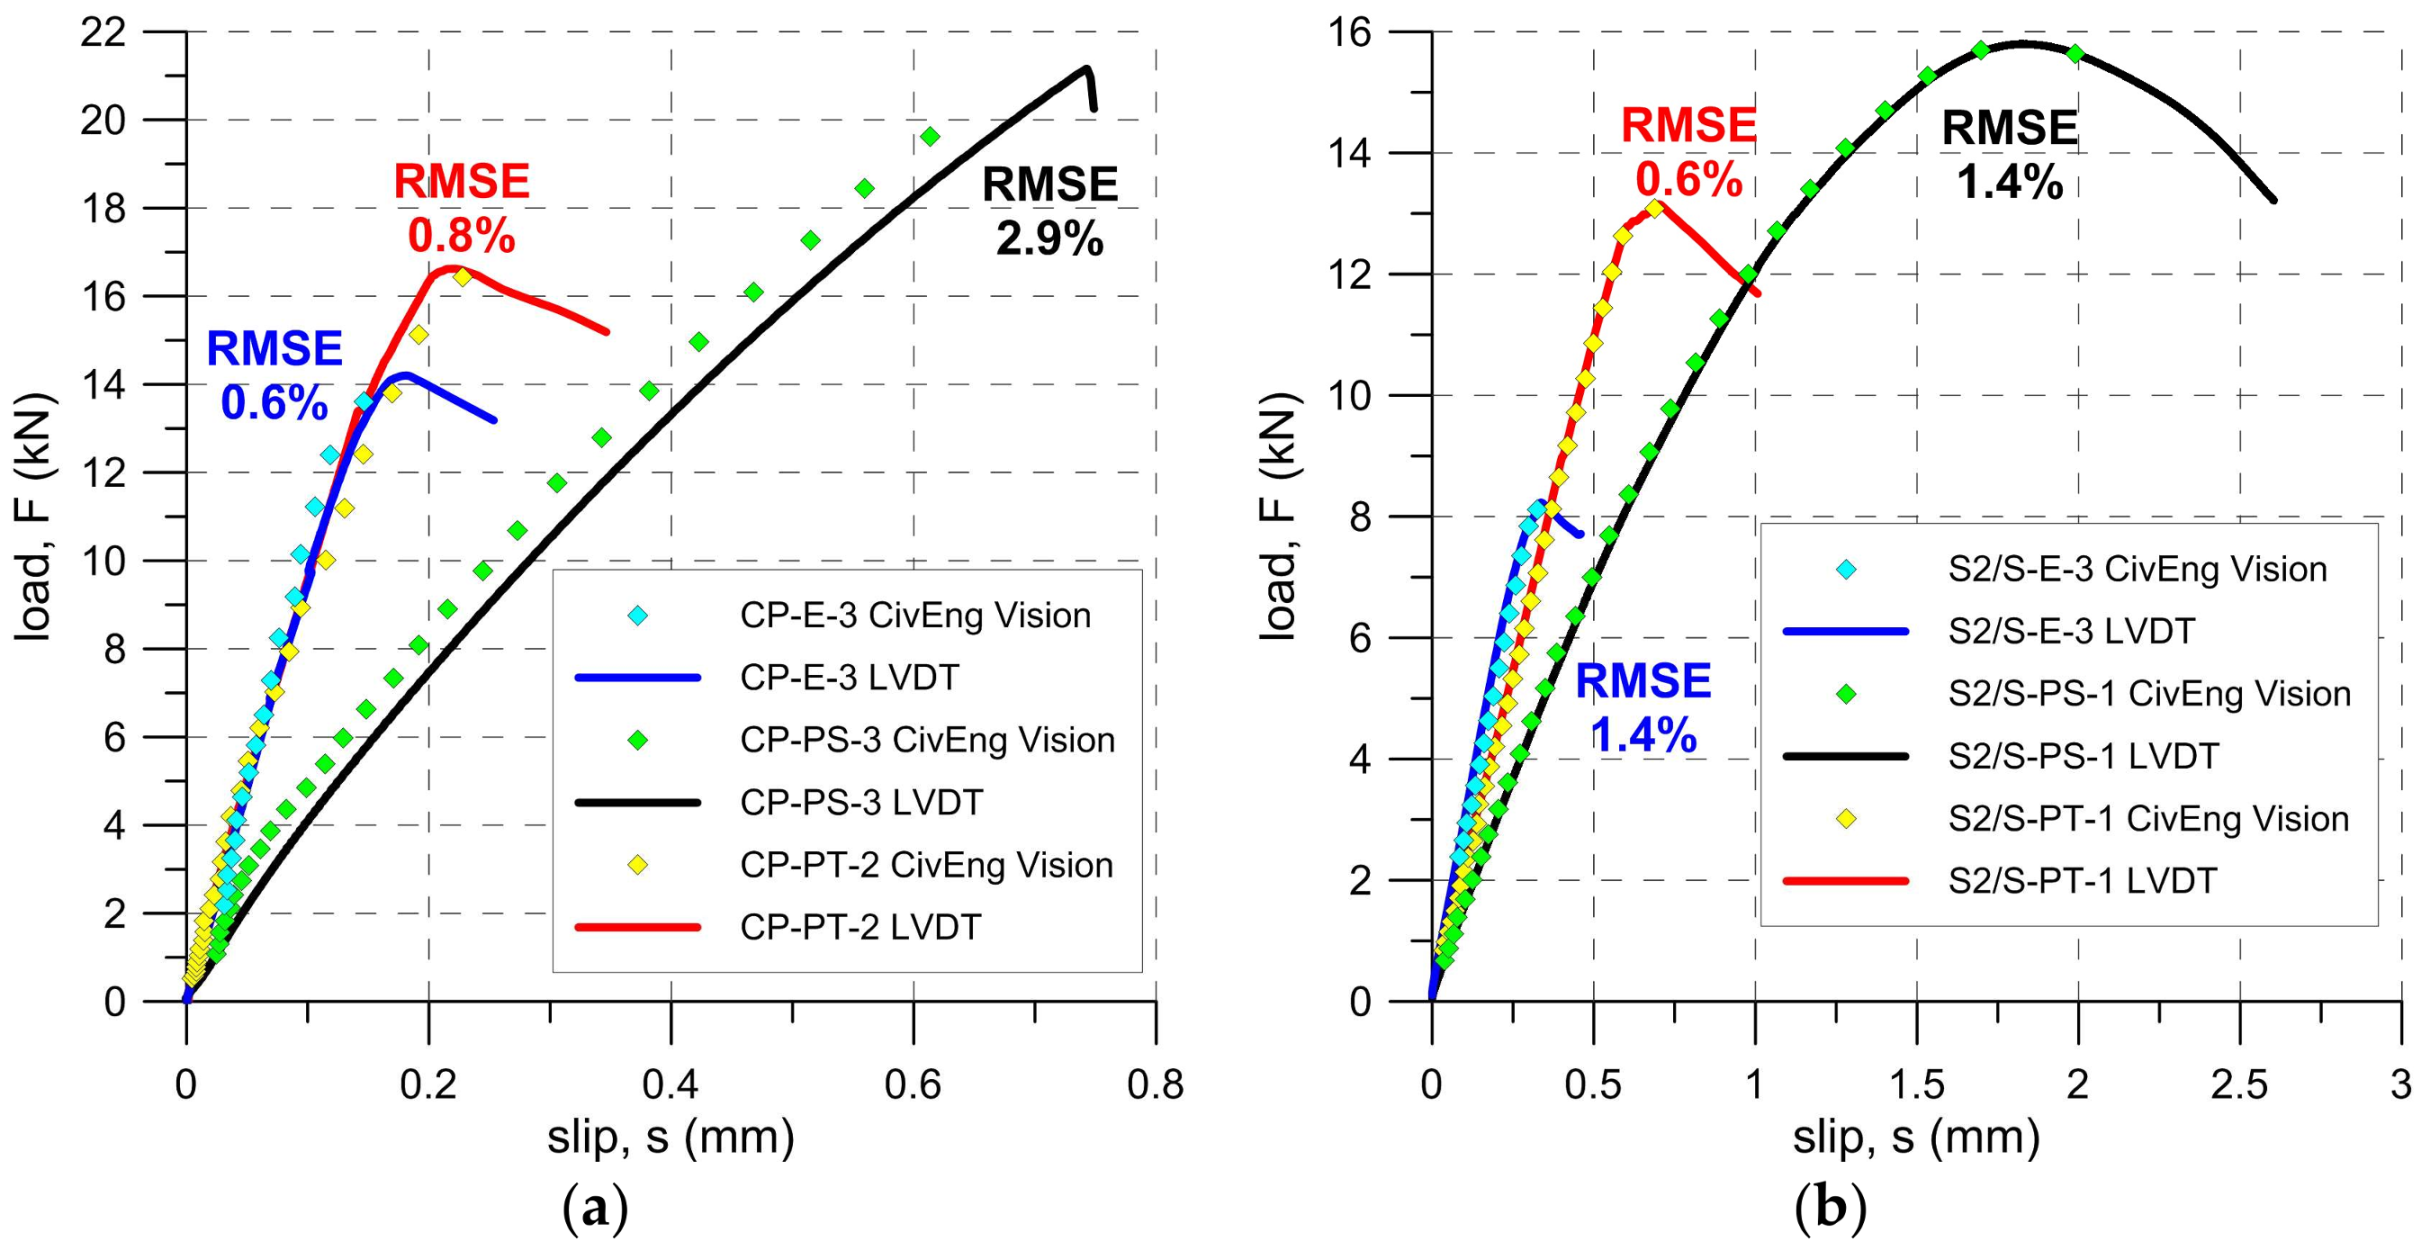
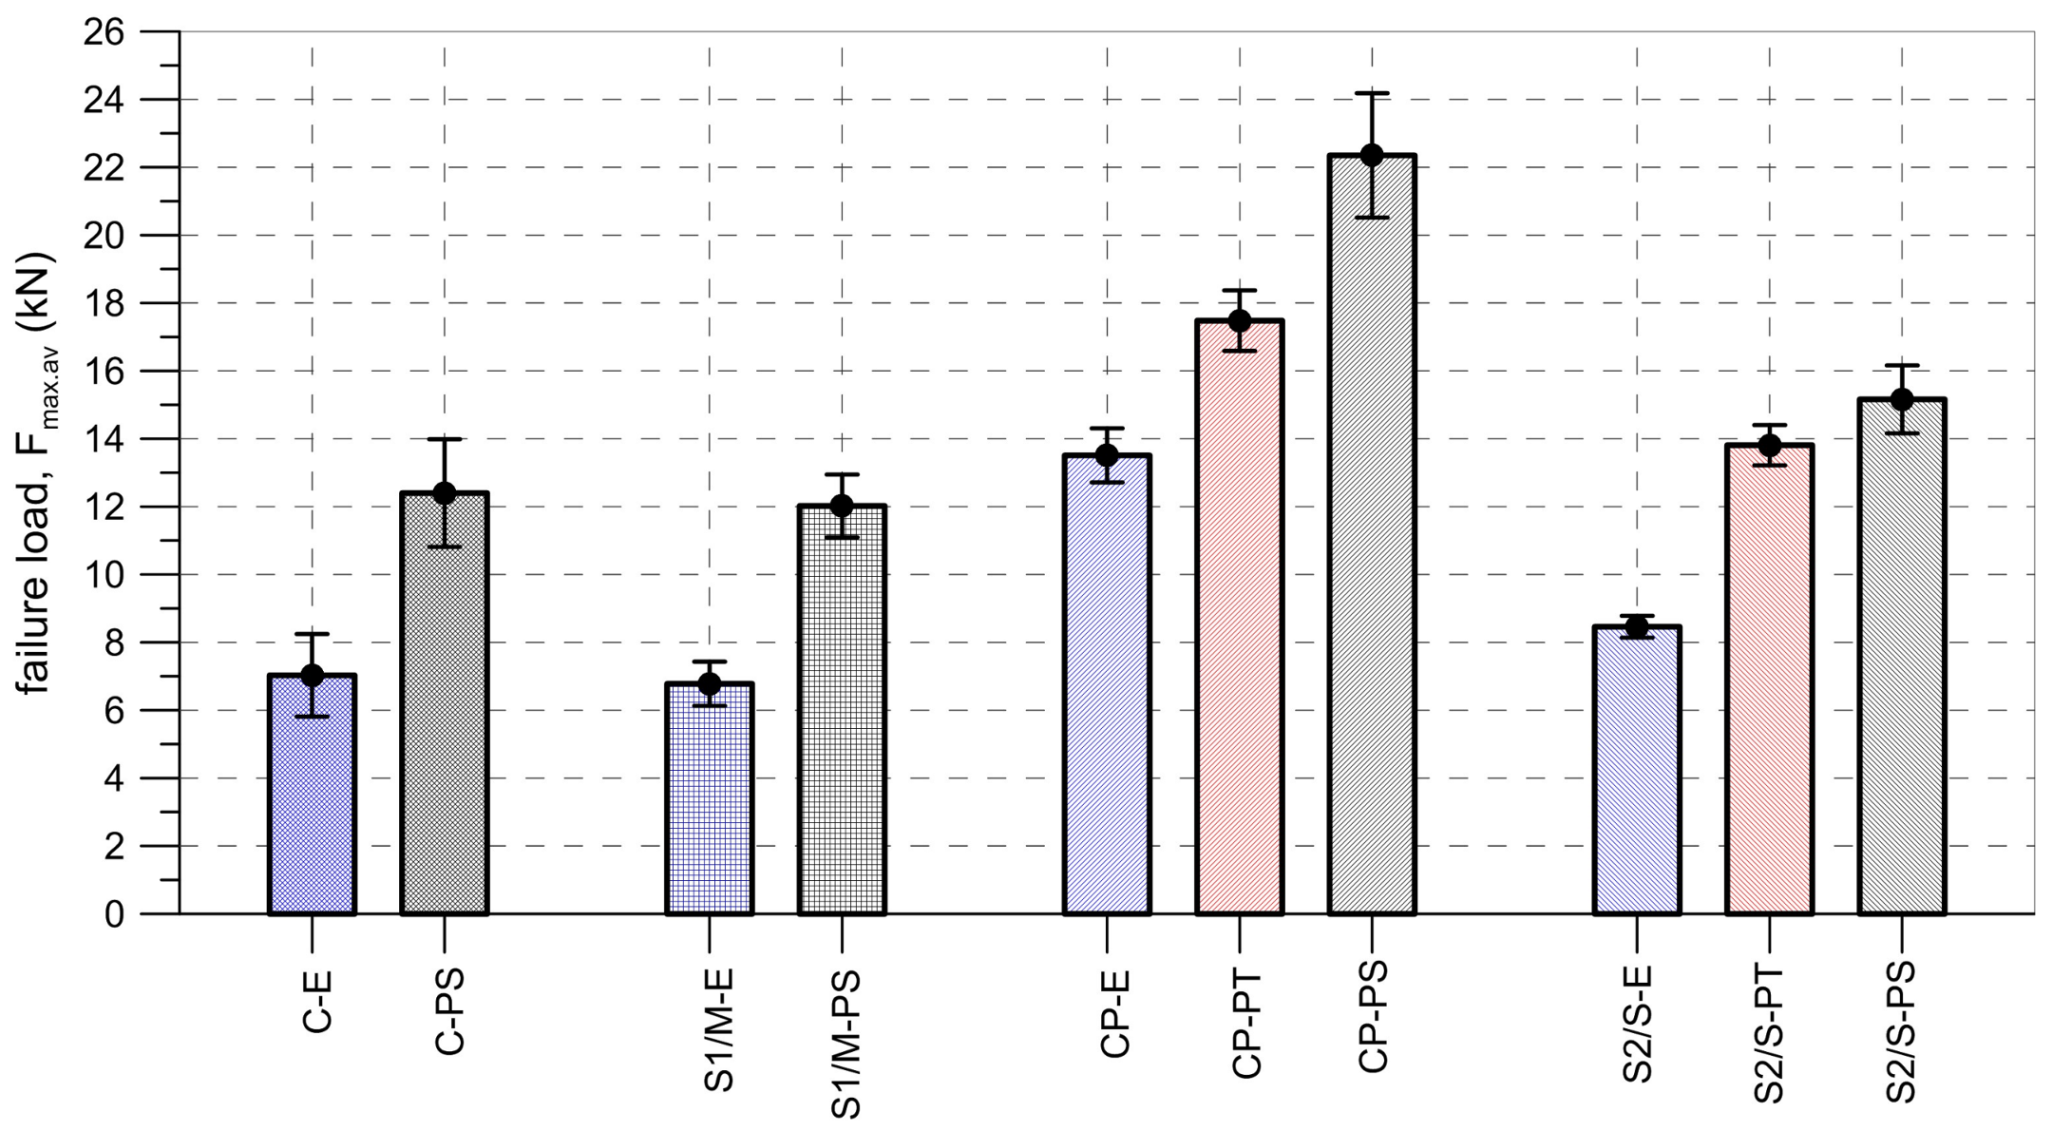
2.4. SLST Results
3. Numerical Analysis
3.1. Material Model Description for Polymer
3.2. FEM Model Description of SLST
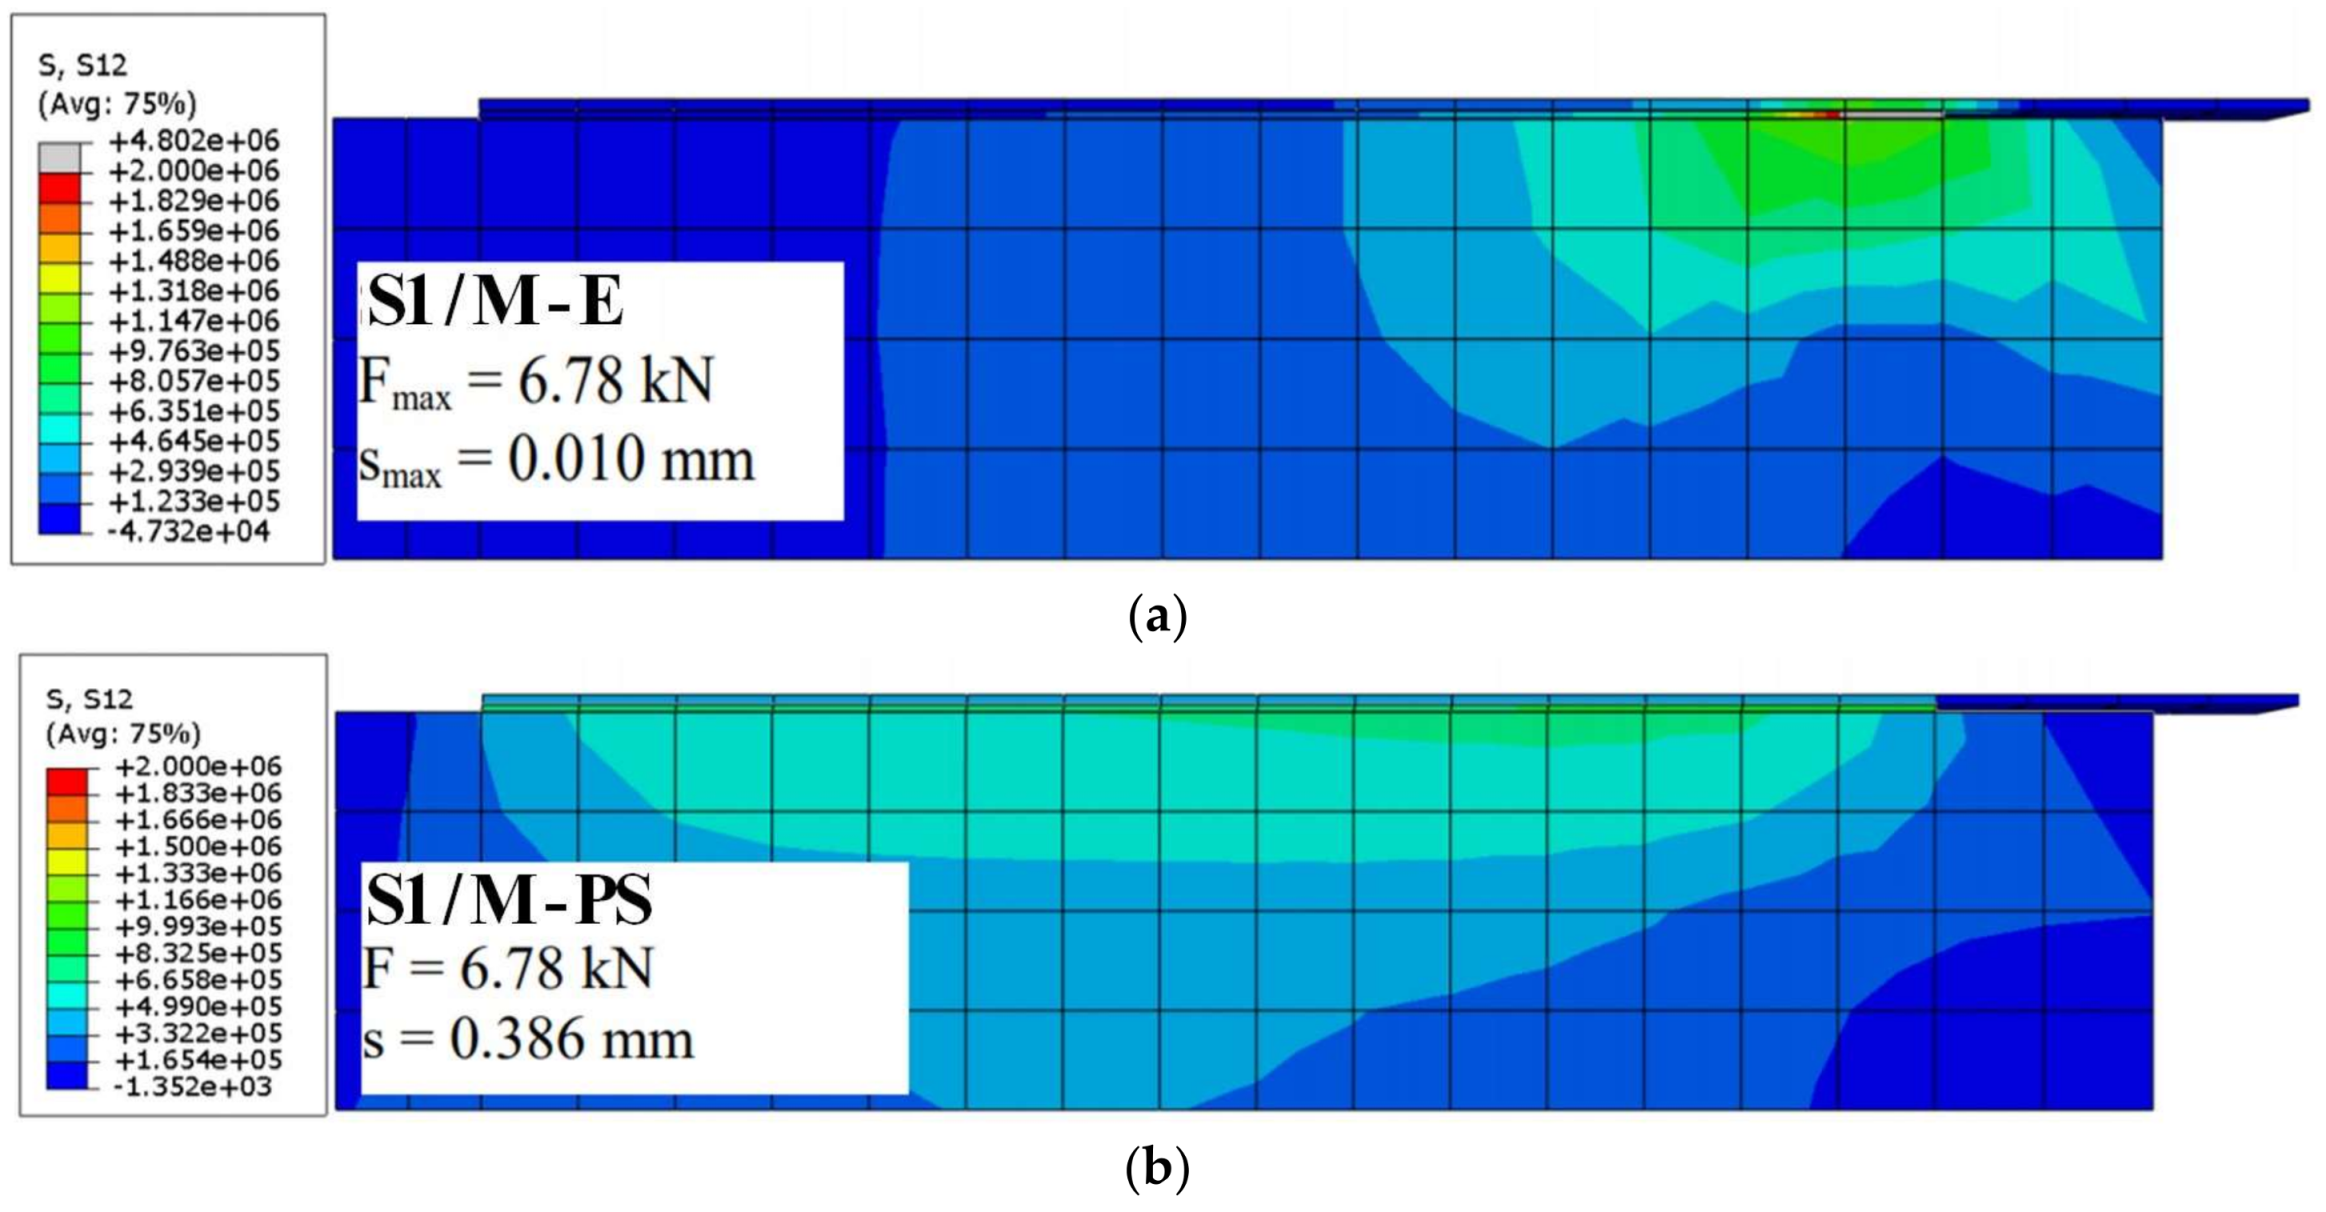
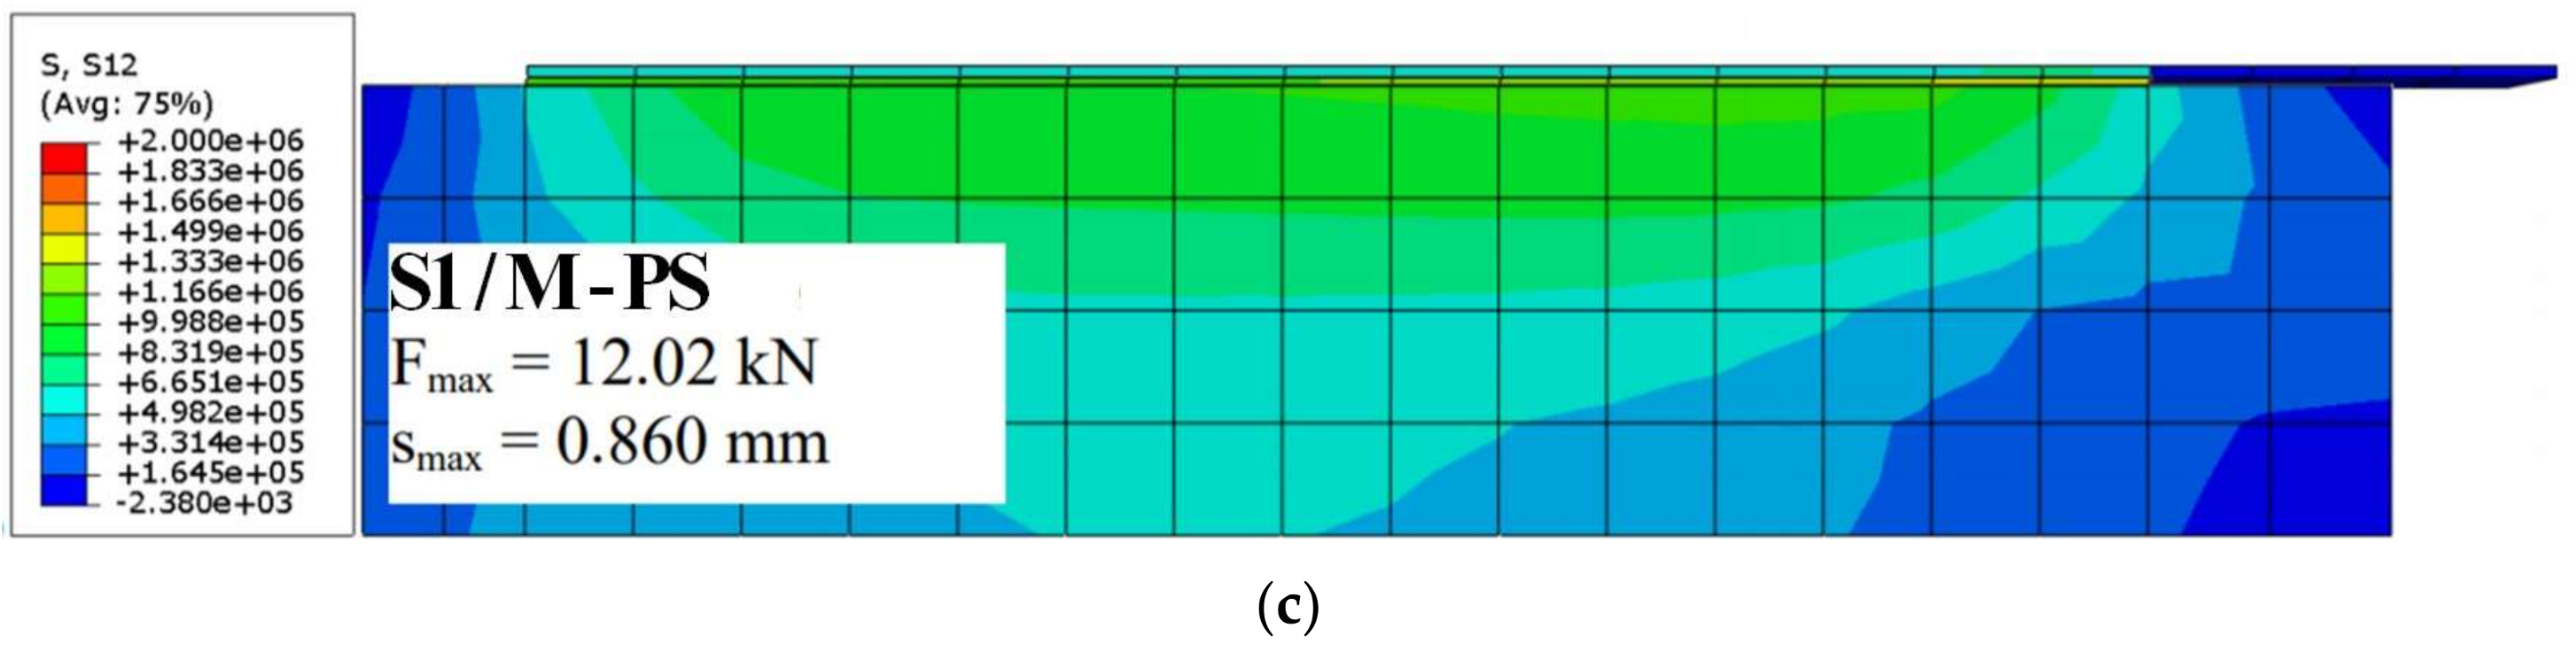
3.3. Numerical Results for Shear Stress Distribution
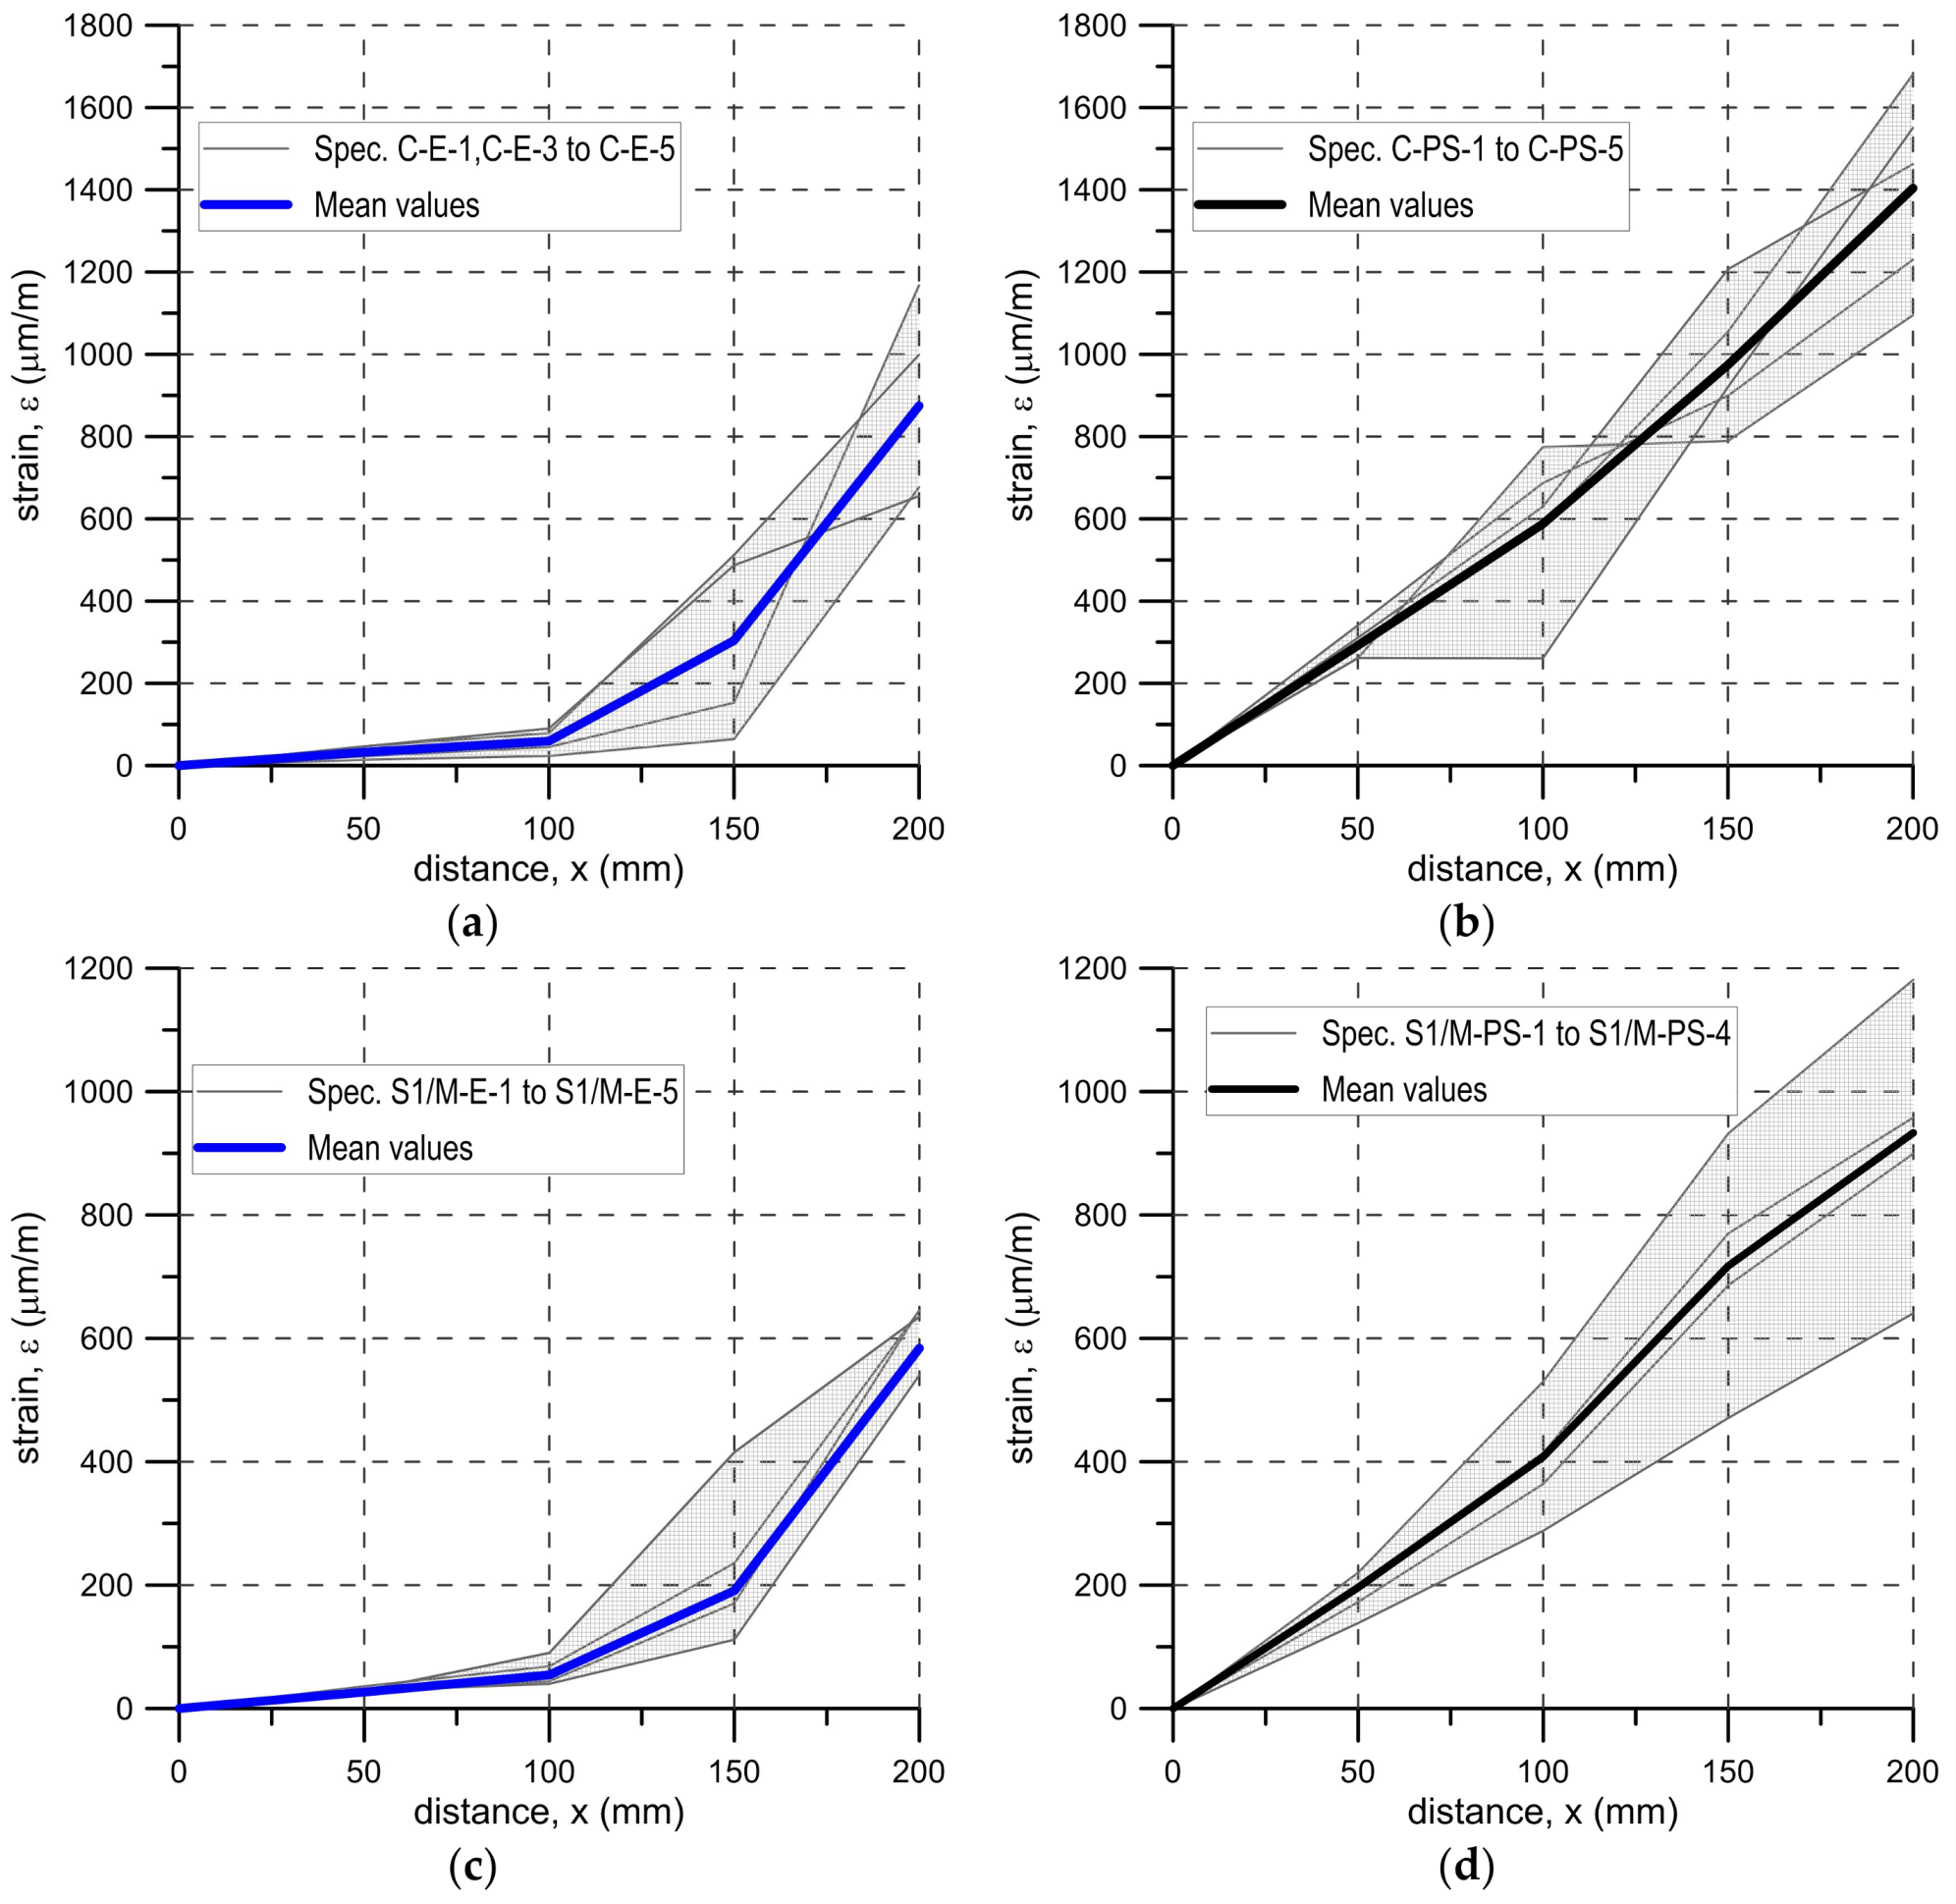
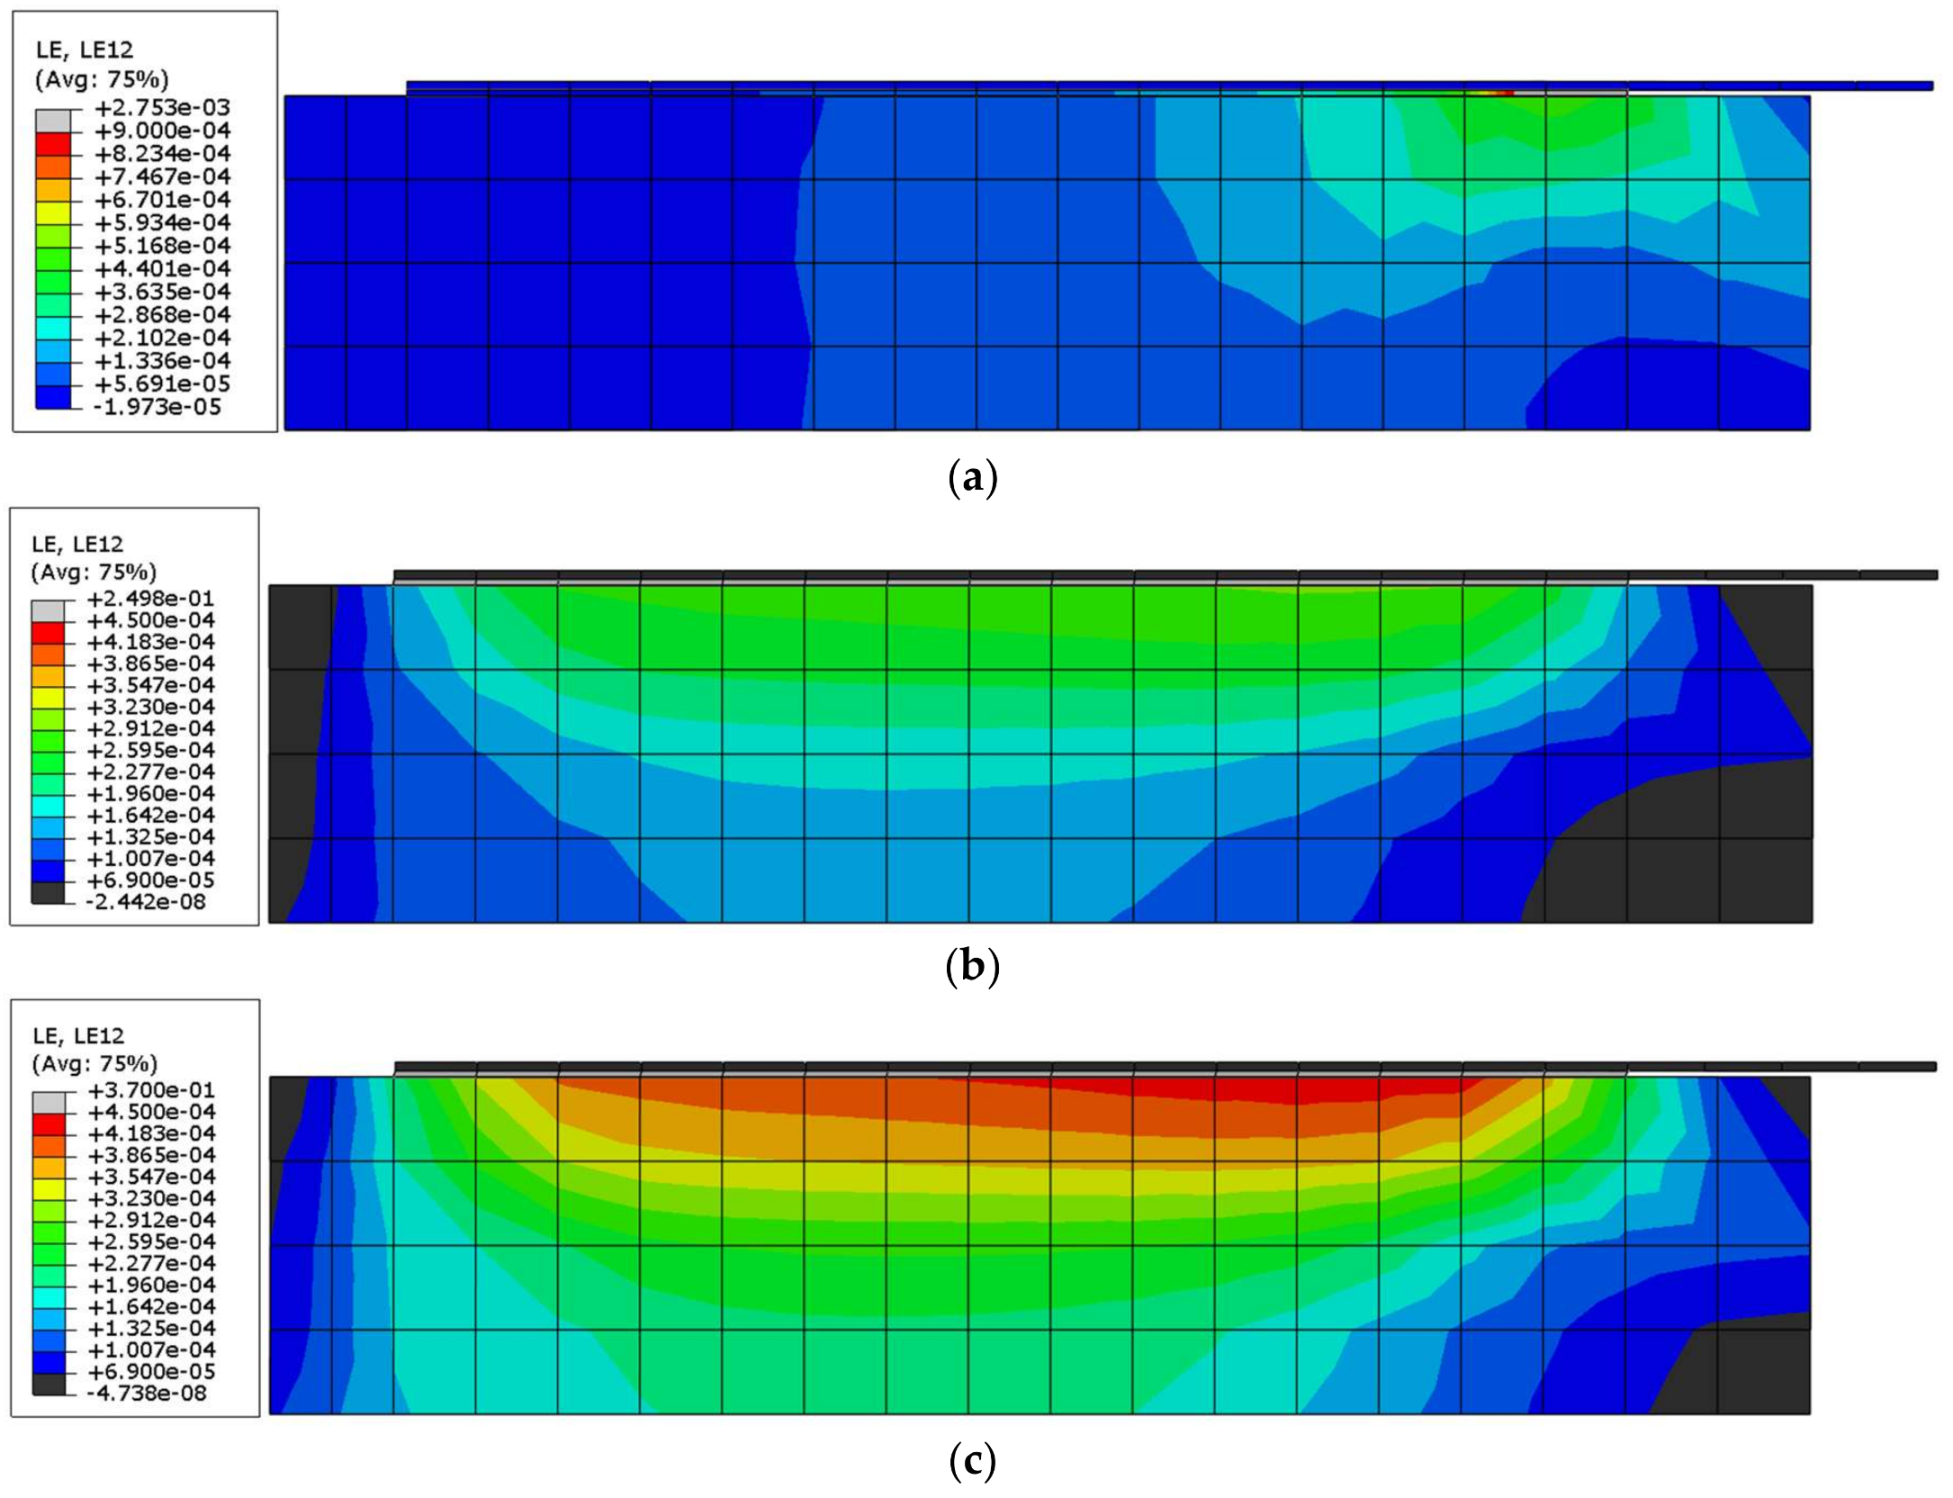
3.4. Numerical Results for Shear Strain Distribution
4. Discussion
4.1. DIC Ability to Analyse Stiff and Flexible Adhesives in Composite Strengthening
4.2. Differences in Work of Brick Specimens Strengthened with Composites Bonded on Stiff and Flexible Adhesives
5. Conclusions
Acknowledgments
Author Contributions
Conflicts of Interest
References
- Parvin, A.; Brighton, D. FRP Composites Strengthening of Concrete Columns under Various Loading Conditions. Polymers 2014, 6, 1040–1056. [Google Scholar] [CrossRef]
- Michels, J.; Martinelli, E.; Czaderski, C.; Motavalli, M. Prestressed CFRP Strips with Gradient Anchorage for Structural Concrete Retrofitting: Experiments and Numerical Modeling. Polymers 2014, 6, 114–131. [Google Scholar] [CrossRef]
- Kotynia, R.; Cholostiakow, S. New Proposal for Flexural Strengthening of Reinforced Concrete Beams Using CFRP T-Shaped Profiles. Polymers 2015, 7, 2461–2477. [Google Scholar] [CrossRef]
- Choi, Y.; Park, H.I.; Kang, G.S.; Cho, C.-G. Strengthening of RC Slabs with Symmetric Openings Using GFRP Composite Beams. Polymers 2013, 5, 1352–1361. [Google Scholar] [CrossRef]
- Lee, S.K.; Lee, Y.B.; Seo, Y.S. A Seismic Strengthening Technique for Reinforced Concrete Columns Using Sprayed FRP. Polymers 2016, 8, 107. [Google Scholar] [CrossRef]
- Valluzzi, M.R.; Oliveira, D.V.; Caratelli, A.; Castori, G.; Corradi, M.; de Felice, G.; Garbin, E.; Garcia, D.; Garmendia, L.; Grande, E.; et al. Round Robin Test for composite-to-brick shear bond characterization. Mater. Struct. 2012, 45, 1761–1791. [Google Scholar] [CrossRef]
- Wu, C.; Feng, P.; Bai, Y.; Lu, Y. Epoxy Enhanced by Recycled Milled Carbon Fibres in Adhesively-Bonded CFRP for Structural Strengthening. Polymers 2014, 6, 72–92. [Google Scholar] [CrossRef]
- Seyhan, C.E.; Goksu, C.; Uzunhasanoglu, A.; Ilki, A. Seismic Behavior of Substandard RC Columns Retrofitted with Embedded Aramid Fiber Reinforced Polymer (AFRP) Reinforcement. Polymers 2015, 7, 2535–2557. [Google Scholar] [CrossRef]
- Caggegi, C.; Carozzi, F.G.; De Santis, S.; Fabbrocino, F.; Focacci, F.; Hojdys, Ł.; Lanoye, E.; Zuccarino, L. Experimental analysis on tensile and bond properties of PBO and aramid fabric reinforced cementitious matrix for strengthening masonry structures. Compos. Part B Eng. 2017, 127, 175–195. [Google Scholar] [CrossRef]
- Carozzi, F.G.; Bellini, A.; D’Antino, T.; de Felice, G.; Focacci, F.; Hojdys, Ł.; Laghi, L.; Lanoye, E.; Micelli, F.; Panizza, M.; Poggi, C. Experimental investigation of tensile and bond properties of Carbon-FRCM composites for strengthening masonry elements. Compos. Part B Eng. 2017, 128, 100–119. [Google Scholar] [CrossRef]
- Leone, M.; Aiello, M.A.; Balsamo, A.; Carozzi, F.G.; Ceroni, F.; Corradi, M.; Gams, M.; Garbin, E.; Gattesco, N.; Krajewski, P.; et al. Glass fabric reinforced cementitious matrix: Tensile properties and bond performance on masonry substrate. Compos. Part B Eng. 2017, 127, 196–214. [Google Scholar] [CrossRef]
- Lignola, G.P.; Caggegi, C.; Ceroni, F.; De Santis, S.; Krajewski, P.; Lourenço, P.B.; Morganti, M.; Papanicolaou, C.; Pellegrino, C.; Prota, A.; et al. Performance assessment of basalt FRCM for retrofit applications on masonry. Compos. Part B Eng. 2017, 128, 1–18. [Google Scholar] [CrossRef]
- De Santis, S.; Ceroni, F.; de Felice, G.; Fagone, M.; Ghiassi, B.; Kwiecień, A.; Lignola, G.P.; Morganti, M.; Santandrea, M.; Valluzzi, M.R.; et al. Round Robin Test on tensile and bond behaviour of Steel Reinforced Grout systems. Compos. Part B Eng. 2017, 127, 100–120. [Google Scholar] [CrossRef]
- Hojdys, Ł.; Krajewski, P. Laboratory tests on masonry vaults with backfill strengthened at the extrados. Key Eng. Mater. 2015, 624, 510–517. [Google Scholar] [CrossRef]
- Ghiassi, B.; Xavier, J.; Oliveira, D.V.; Kwiecien, A.; Lourenço, P.B.; Zajac, B. Evaluation of the bond performance in FRP–brick components re-bonded after initial delamination. Compos. Struct. 2015, 123, 271–281. [Google Scholar] [CrossRef]
- Foraboschi, P.; Vanin, A. New methods for bonding FRP strips onto masonry structures: Experimental results and analytical evaluations. Compos. Mech. Comput. Appl. 2013, 4, 1–23. [Google Scholar] [CrossRef]
- Foraboschi, P. Effectiveness of novel methods to increase the FRP-masonry bond capacity. Compos. Part B Eng. 2016, 107, 214–232. [Google Scholar] [CrossRef]
- Kwiecień, A. Shear bond of composites-to-brick applied with highly deformable, in relation to resin epoxy, interface materials. Mater. Struct. 2014, 47, 2005–2020. [Google Scholar] [CrossRef]
- Tedeschi, C.; Kwiecień, A.; Valluzzi, M.R.; Zając, B.; Garbin, E.; Binda, L. Effect of thermal ageing and salt decay on bond between FRP and masonry. Mater. Struct. 2014, 47, 2051–2065. [Google Scholar] [CrossRef]
- Kwiecień, A.; de Felice, G.; Oliveira, D.V.; Zając, B.; Bellini, A.; De Santis, S.; Ghiassi, B.; Lignola, G.P.; Lourenço, P.B.; Mazzotti, C.; et al. Repair of composite-to-masonry bond using flexible matrix. Mater. Struct. 2016, 49, 2563–2580. [Google Scholar] [CrossRef]
- Kwiecień, A.; Gams, M.; Viskovic, A.; Zając, B. Temporary and removable quick seismic protection of weak masonry structures using highly deformable adhesives. In Structural Analysis of Historical Constructions: Anamnesis, Diagnosis, Therapy, Controls, Proceedings of the 10th International Conference on Structural Analysis of Historical Constructions, SAHC 2016, Leuven, Belgium, 13–15 September 2016; CRC Press: Boca Raton, FL, USA, 2016; pp. 1528–1535. [Google Scholar]
- Garbin, E.; Panizza, M.; Kwiecień, A.; Zając, B.; Nardon, F.; Valluzzi, M.R. Testing of bond solutions for UHTS steel strand composites applied to extruded bricks. In Proceedings of the 16th International Brick and Block Masonry Conference, Padova, Italy, 26–30 June 2016; Claudio, M., da Porto, F., Valluzzi, M.R., Eds.; CRC Press: Boca Raton, FL, USA, 2016; pp. 395–402. [Google Scholar]
- Ceroni, F.; Kwiecień, A.; Mazzotti, C.; Bellini, A.; Garbin, E.; Panizza, M.; Valluzzi, M.R. The role of adhesive stiffness on the FRP-masonry bond behavior: A round robin initiative. In Structural Analysis of Historical Constructions: Anamnesis, Diagnosis, Therapy, Controls, Proceedings of the 10th International Conference on Structural Analysis of Historical Constructions, SAHC 2016, Leuven, Belgium, 13–15 September 2016; CRC Press: Boca Raton, FL, USA, 2016; pp. 1061–1068. [Google Scholar]
- Viskovic, A.; Zuccarino, L.; Kwiecień, A.; Zając, B.; Gams, M. Quick seismic protection of weak masonry infilling in filled framed structures using flexible joints. Key Eng. Mater. 2017, 747, 628–637. [Google Scholar] [CrossRef]
- Derkowski, W.; Kwiecień, A.; Zając, B. CFRP strengthening of bent RC beams using stiff and flexible adhesives. Czas. Tech. 2013, 37–52. [Google Scholar] [CrossRef]
- Cruz, J.; Borojevic, A.; Sena-Cruz, J.; Pereira, E.; Fernandes, P.; Silva, P.; Kwiecień, A. Bond behaviour of NSM CFRP-concrete systems: Adhesive and CFRP cross-section influences. In Proceedings of the Eighth International Conference on Fibre-Reinforced Polymer (FRP) Composites in Civil Engineering (CICE 2016), Hong Kong, China, 14–16 December 2016; Teng, J.G., Ed.; Department of Civil and Environmental Engineering & Research Institute for Sustainable Urban Development, The Hong Kong Polytechnic University: Hong Kong, 2016; pp. 930–935. [Google Scholar]
- Modena, C. Design approaches of investigations for the safety and conservation of historic buildings. In Proceedings of the 4th International Seminar on Structural Analysis of Historical Constructions, Padova, Italy, 10–13 November 2004. [Google Scholar]
- Zając, B.; Kwiecień, A. Thermal stress generated in masonries by stiff and flexible bonding materials. In Proceedings of the 9th International Masonry Conference, Guimarães, Portugal, 7–9 July 2014; ISBN 978-972-8692-85-8. ID_1629. [Google Scholar]
- Jasieńko, J.; Kwiecień, A.; Skłodowski, M. New flexible intervention solutions for protection, strengthening and reconstruction of damaged heritage buildings. In Proceedings of the International Conference on Earthquake Engineering and Post Disaster Reconstruction Planning (ICEE-PDRP 2016), Bhaktapur, Nepal, 24–26 April 2016. [Google Scholar]
- Tekieli, M.; De Santis, S.; de Felice, G.; Kwiecień, A.; Roscini, F. Application of Digital Image Correlation to composite reinforcements testing. Compos. Struct. 2017, 160, 670–688. [Google Scholar] [CrossRef]
- Carloni, C.; Subramaniam, K.V.; Savoia, M.; Mazzotti, C. Experimental determination of FRP—Concrete cohesive interface properties under fatigue loading. Compos. Struct. 2012, 94, 1288–1296. [Google Scholar] [CrossRef]
- Napoli, A.; de Felice, G.; De Santis, S.; Realfonzo, R. Bond behaviour of Steel Reinforced Polymer strengthening systems. Compos. Struct. 2016, 152, 499–515. [Google Scholar] [CrossRef]
- Carloni, C.; Subramaniam, K.V. Investigation of sub-critical fatigue crack growth in FRP/concrete cohesive interface using digital image analysis. Compos. Part B Eng. 2013, 51, 35–43. [Google Scholar] [CrossRef]
- Ghiassi, B.; Xavier, J.; Oliveira, D.V.; Lourenço, P.B. Application of digital image correlation in investigating the bond between FRP and masonry. Compos. Struct. 2013, 106, 340–349. [Google Scholar] [CrossRef]
- Caggegi, C.; Chevalier, L.; Pensée, V.; Cuomo, M. Strain and shear stress fields analysis by means of Digital Image Correlation on CFRP to brick bonded joints fastened by fiber anchors. Constr. Build. Mater. 2016, 106, 78–88. [Google Scholar] [CrossRef]
- Arboleda, D.; Yuan, S.; Giancaspro, J.; Nanni, A. Comparison of strain measurement techniques for the characterization of brittle, cementitious matrix composites. In Proceedings of the 5th International Conference on Structural Engineering, Mechanics and Computation (SEMC), Cape Town, South Africa, 2–4 September 2013; pp. 1567–1572. [Google Scholar]
- Gams, M.; Tomaževič, M.; Kwiecień, A. Strengthening brick masonry by repointing—An experimental study. Key Eng. Mater. 2015, 624, 444–452. [Google Scholar] [CrossRef]
- De Santis, S.; Roscini, F.; de Felice, G. Full-scale tests on masonry vaults strengthened with Steel Reinforced Grout. Compos. Part B Eng. 2018, 141, 20–36. [Google Scholar] [CrossRef]
- De Santis, S.; Carozzi, F.G.; de Felice, G.; Poggi, C. Test methods for Textile Reinforced Mortar systems. Compos. Part B Eng. 2017, 127, 121–132. [Google Scholar] [CrossRef]
- Zdanowicz, Ł.; Kwiecien, A.; Tekieli, M.; Serȩga, S. Interaction of Polymer Flexible Joint with concrete elements in an uniaxial tensile test. In Proceedings of the Fib Symposium, Maastricht, The Netherlands, 12–14 June 2017; pp. 1049–1057. [Google Scholar]
- Technical data sheet FIDSTEEL 3X2-B 12-12-500 HARDWIRETM Unidirectional Ultra-High Tensile Steel Sheet for Structural Strengthening. Available online: http://www.fidiaglobalservice.com/eng/materiali_schede/FIDSTEEL%203X2-B%2012-12-500%20Hardwire.pdf (accessed on 16th February 2018).
- Technical Data Sheet Kerakoll GeoSteel G2000. Available online: http://products.kerakoll.com/gestione/immagini/prodotti/GeoSteel%20G2000%202014%20II%20EN_(en).pdf (accessed on 16 February 2018).
- Technical Data Sheet Sika CarboDur S. Available online: http://gcc.sika.com/dms/getdocument.get/fa84fa91-9630-313c-80b7-784dcfbc84ac/PDS%20Sika%20Carbodur%C2%AE%20S.pdf (accessed on 16 February 2018).
- De Santis, S.; de Felice, G. Steel reinforced grout systems for the strengthening of masonry structures. Compos. Struct. 2015, 134, 533–548. [Google Scholar] [CrossRef]
- Tekieli, M.; Słoński, M. Particle filtering for computer vision-based identification of frame model parameters. Comput. Assist. Methods Eng. Sci. 2014, 21, 39–48. [Google Scholar]
- Tekieli, M.; Słoński, M. Digital image correlation and Bayesian filtering in inverse analysis of structures. In Recent Advances in Civil Engineering: Computational Methods; Cecot, W., Ed.; Wydawnictwo Politechniki Krakowskiej: Kraków, Poland, 2015; pp. 111–124. [Google Scholar]
- Łątka, D.; Tekieli, M. Optical measurements in the field of masonry construction laboratory tests. Interdiscip. Theory Pract. 2016, 10, 162–168. [Google Scholar]
- Matysek, P.; Witkowski, M. A comparative study on the compressive strength of bricks from different historical periods. Int. J. Archit. Herit. 2016, 10, 396–405. [Google Scholar] [CrossRef]
- Foraboschi, P.; Vanin, A. Experimental investigation on bricks from historical Venetian buildings subjected to moisture and salt crystallization. Eng. Fail. Anal. 2014, 45, 185–203. [Google Scholar] [CrossRef]
- Foraboschi, P. Analytical model to predict the lifetime of concrete members externally reinforced with FRP. Theor. Appl. Fract. Mech. 2015, 75, 137–145. [Google Scholar] [CrossRef]
- Foraboschi, P. Predictive multiscale model of delayed debonding for concrete members with adhesively bonded external reinforcement. Compos. Mech. Comput. Appl. 2012, 3, 307–329. [Google Scholar] [CrossRef]


| Material/Mechanical Property | Value |
|---|---|
| Clay Brick 1. | |
| compressive strength | 19.8 N/mm2 |
| flexural strength | 3.66 N/mm2 |
| splitting tensile strength | 2.46 N/mm2 |
| Young’s modulus | 5760 N/mm2 |
| Epoxy adhesive/Sikadur 330/ 2 | |
| tensile strength | 30 N/mm2 |
| Young’s modulus | 4500 N/mm2 |
| strain at peak load | 0.90% |
| Epoxy adhesive/Sikadur 30 Normal/ 2 | |
| tensile strength | 26 N/mm2 |
| Young’s modulus | 11,200 N/mm2 |
| Polyurethane adhesive/PS/ 2 | |
| tensile strength | 2.5 N/mm2 |
| Young’s modulus | 16 N/mm2 |
| strain at peak load | 45% |
| Polyurethane adhesive/PT/ 2 | |
| tensile strength | 20 N/mm2 |
| Young’s modulus | 700 N/mm2 |
| strain at peak load | 10% |
| Carbon textile/FIDCARBON UNI 320 HT240/ 1 | |
| tensile strength | 2735 N/mm2 |
| Young’s modulus | 234,000 N/mm2 |
| nominal thickness | 0.170 mm |
| CFRP plate/Sika CarboDur S1012/ 2 | |
| tensile strength | 2900 N/mm2 |
| Young’s modulus | 165,000 N/mm2 |
| plate thickness | 1.2 mm |
| Steel textile S1/FIDSTEEL 3X2-B 12-12-500/ 1 | |
| tensile strength | 2997 N/mm2 |
| Young’s modulus | 195,000 N/mm2 |
| nominal thickness | 0.231 mm |
| Steel textile S2/Kerakoll GeoSteel G2000/ 3 | |
| tensile strength | 3083 N/mm2 |
| Young’s modulus | 183,000 N/mm2 |
| nominal thickness | 0.254 mm |
| Notation | No. of Specimens | Description of Strengthening System | Test Set-Up |
|---|---|---|---|
| C-E | 5 | carbon fiber textile embedded in epoxy based matrix Sikadur 330 | TS-1 |
| C-PS | 5 | carbon fiber textile embedded in polyurethane PS matrix | TS-1 |
| S1/M-E | 5 | steel fiber textile S1 embedded in epoxy based matrix Sikadur 330—glass mesh side towards the substrate | TS-1 |
| S1/M-PS | 4 | steel fiber textile S1 embedded polyurethane PS matrix—glass mesh side towards the substrate | TS-1 |
| CP-E | 3 | pultruded CFRP laminate bonded using epoxy based adhesive Sikadur 30 | TS-2 |
| CP-PS | 3 | pultruded CFRP laminate bonded using polyurethane PS adhesive | TS-2 |
| CP-PT | 3 | pultruded CFRP laminate bonded using polyurethane PT adhesive | TS-2 |
| S2/S-E | 3 | steel fiber textile S2 embedded in epoxy based matrix Sikadur 30—steel cords side towards the substrate | TS-2 |
| S2/S-PS | 3 | steel fiber textile S2 embedded polyurethane PS matrix—steel cords side towards the substrate | TS-2 |
| S2/S-PT | 3 | steel fiber textile S2 embedded polyurethane PT matrix—steel cords side towards the substrate | TS-2 |
| Type of Composite | Specimen | Failure Mode | Fmax (kN) | Fmax.av (kN) | CoV (%) | σmax (MPa) | η (-) |
|---|---|---|---|---|---|---|---|
| CFRP | C-E-1 | A | 6.32 | ||||
| C-E-2 | A | 7.71 | |||||
| C-E-3 | A | 8.85 | 7.03 | 17.3 | 852 | 0.31 | |
| C-E-4 | A | 6.05 | |||||
| C-E-5 | A | 6.23 | |||||
| CFRPU | C-PS-1 | - 1 | 12.73 | ||||
| C-PS-2 | - 1 | 14.40 | |||||
| C-PS-3 | C | 11.64 | 12.40 | 12.8 | 1503 | 0.55 | |
| C-PS-4 | A | 10.18 | |||||
| C-PS-5 | A | 13.05 | |||||
| SRP | S1/M-E-1 | A | 6.66 | ||||
| S1/M-E-2 | A | 5.76 | |||||
| S1/M-E-3 | A | 6.91 | 6.78 | 9.6 | 597 | 0.20 | |
| S1/M-E-4 | A | 7.53 | |||||
| S1/M-E-5 | A | 7.02 | |||||
| SRPU | S1/M-PS-1 | C | 11.06 | ||||
| S1/M-PS-2 | A | 12.31 | 12.02 | 7.7 | 1059 | 0.35 | |
| S1/M-PS-3 | A | 13.18 | |||||
| S1/M-PS-4 | A | 11.53 | |||||
| CFRP | CP-E-1 | I | 13.69 | ||||
| CP-E-2 | I | 12.64 | 13.51 | 5.9 | 135 | 0.05 | |
| CP-E-3 | I | 14.20 | |||||
| CFRPU | CP-PS-1 | I/IV | 21.44 | ||||
| CP-PS-2 | III/IV | 24.45 | 22.35 | 8.2 | 224 | 0.08 | |
| CP-PS-3 | I | 21.16 | |||||
| CFRPU | CP-PT-1 | I | 17.42 | ||||
| CP-PT-2 | I | 16.62 | 17.48 | 5.1 | 175 | 0.06 | |
| CP-PT-3 | I | 18.39 | |||||
| SRP | S2/S-E-1 | A | 8.83 | ||||
| S2/S-E-2 | A | 8.32 | 8.46 | 3.8 | 655 | 0.21 | |
| S2/S-E-3 | A | 8.23 | |||||
| SRPU | S2/S-PS-1 | C(D) | 15.80 | ||||
| S2/S-PS-2 | A | 15.58 | |||||
| S2/S-PS-3 | C | 16.07 | 15.16 | 6.6 | 1174 | 0.38 | |
| S2/S-PS-4 | C | 14.75 | |||||
| S2/S-PS-5 | C | 13.61 | |||||
| SRPU | S2/S-PT-1 | A | 13.15 | ||||
| S2/S-PT-2 | A | 14.31 | 13.81 | 4.3 | 1070 | 0.35 | |
| S2/S-PT-3 | A | 13.96 |
© 2018 by the authors. Licensee MDPI, Basel, Switzerland. This article is an open access article distributed under the terms and conditions of the Creative Commons Attribution (CC BY) license (http://creativecommons.org/licenses/by/4.0/).
Share and Cite
Kwiecień, A.; Krajewski, P.; Hojdys, Ł.; Tekieli, M.; Słoński, M. Flexible Adhesive in Composite-to-Brick Strengthening—Experimental and Numerical Study. Polymers 2018, 10, 356. https://doi.org/10.3390/polym10040356
Kwiecień A, Krajewski P, Hojdys Ł, Tekieli M, Słoński M. Flexible Adhesive in Composite-to-Brick Strengthening—Experimental and Numerical Study. Polymers. 2018; 10(4):356. https://doi.org/10.3390/polym10040356
Chicago/Turabian StyleKwiecień, Arkadiusz, Piotr Krajewski, Łukasz Hojdys, Marcin Tekieli, and Marek Słoński. 2018. "Flexible Adhesive in Composite-to-Brick Strengthening—Experimental and Numerical Study" Polymers 10, no. 4: 356. https://doi.org/10.3390/polym10040356
APA StyleKwiecień, A., Krajewski, P., Hojdys, Ł., Tekieli, M., & Słoński, M. (2018). Flexible Adhesive in Composite-to-Brick Strengthening—Experimental and Numerical Study. Polymers, 10(4), 356. https://doi.org/10.3390/polym10040356