Strength of PLA Components Fabricated with Fused Deposition Technology Using a Desktop 3D Printer as a Function of Geometrical Parameters of the Process

 ,
,  ,
, 
Abstract
:
1. Introduction
2. Experimental Methods
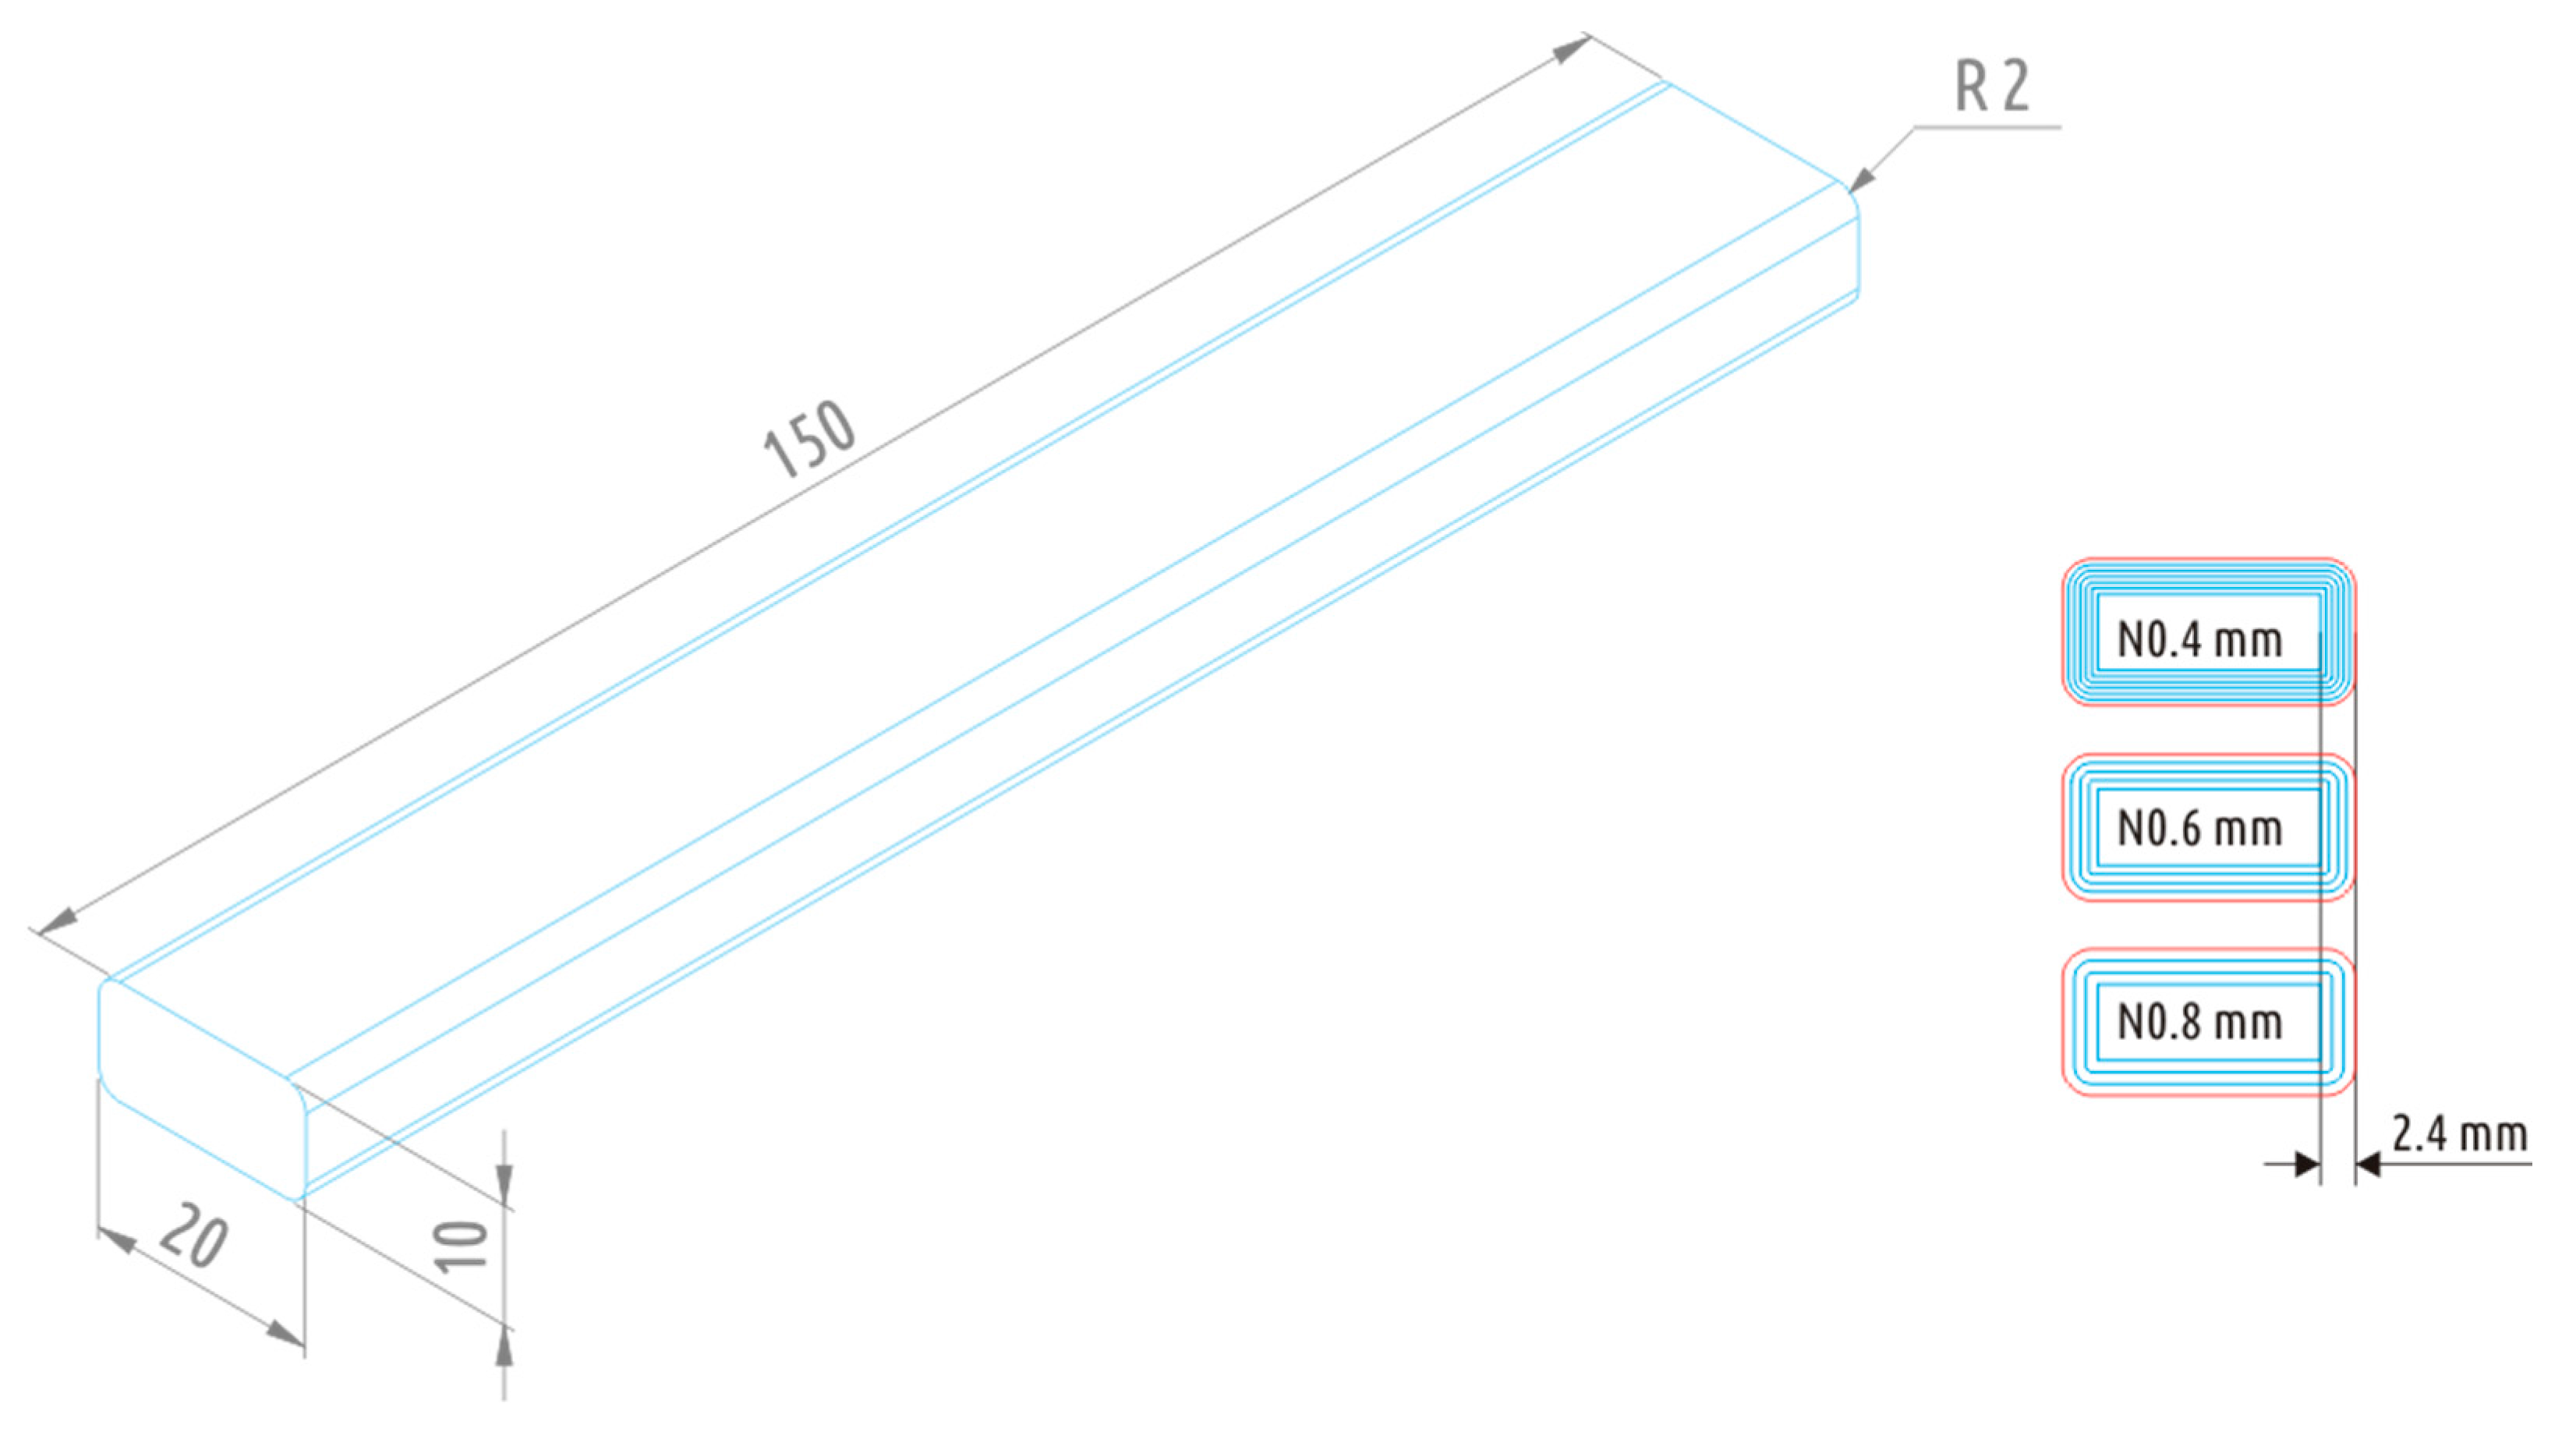
2.1. Samples Fabrication
2.2. Mechanical Strength Examination
3. Results and Discussion
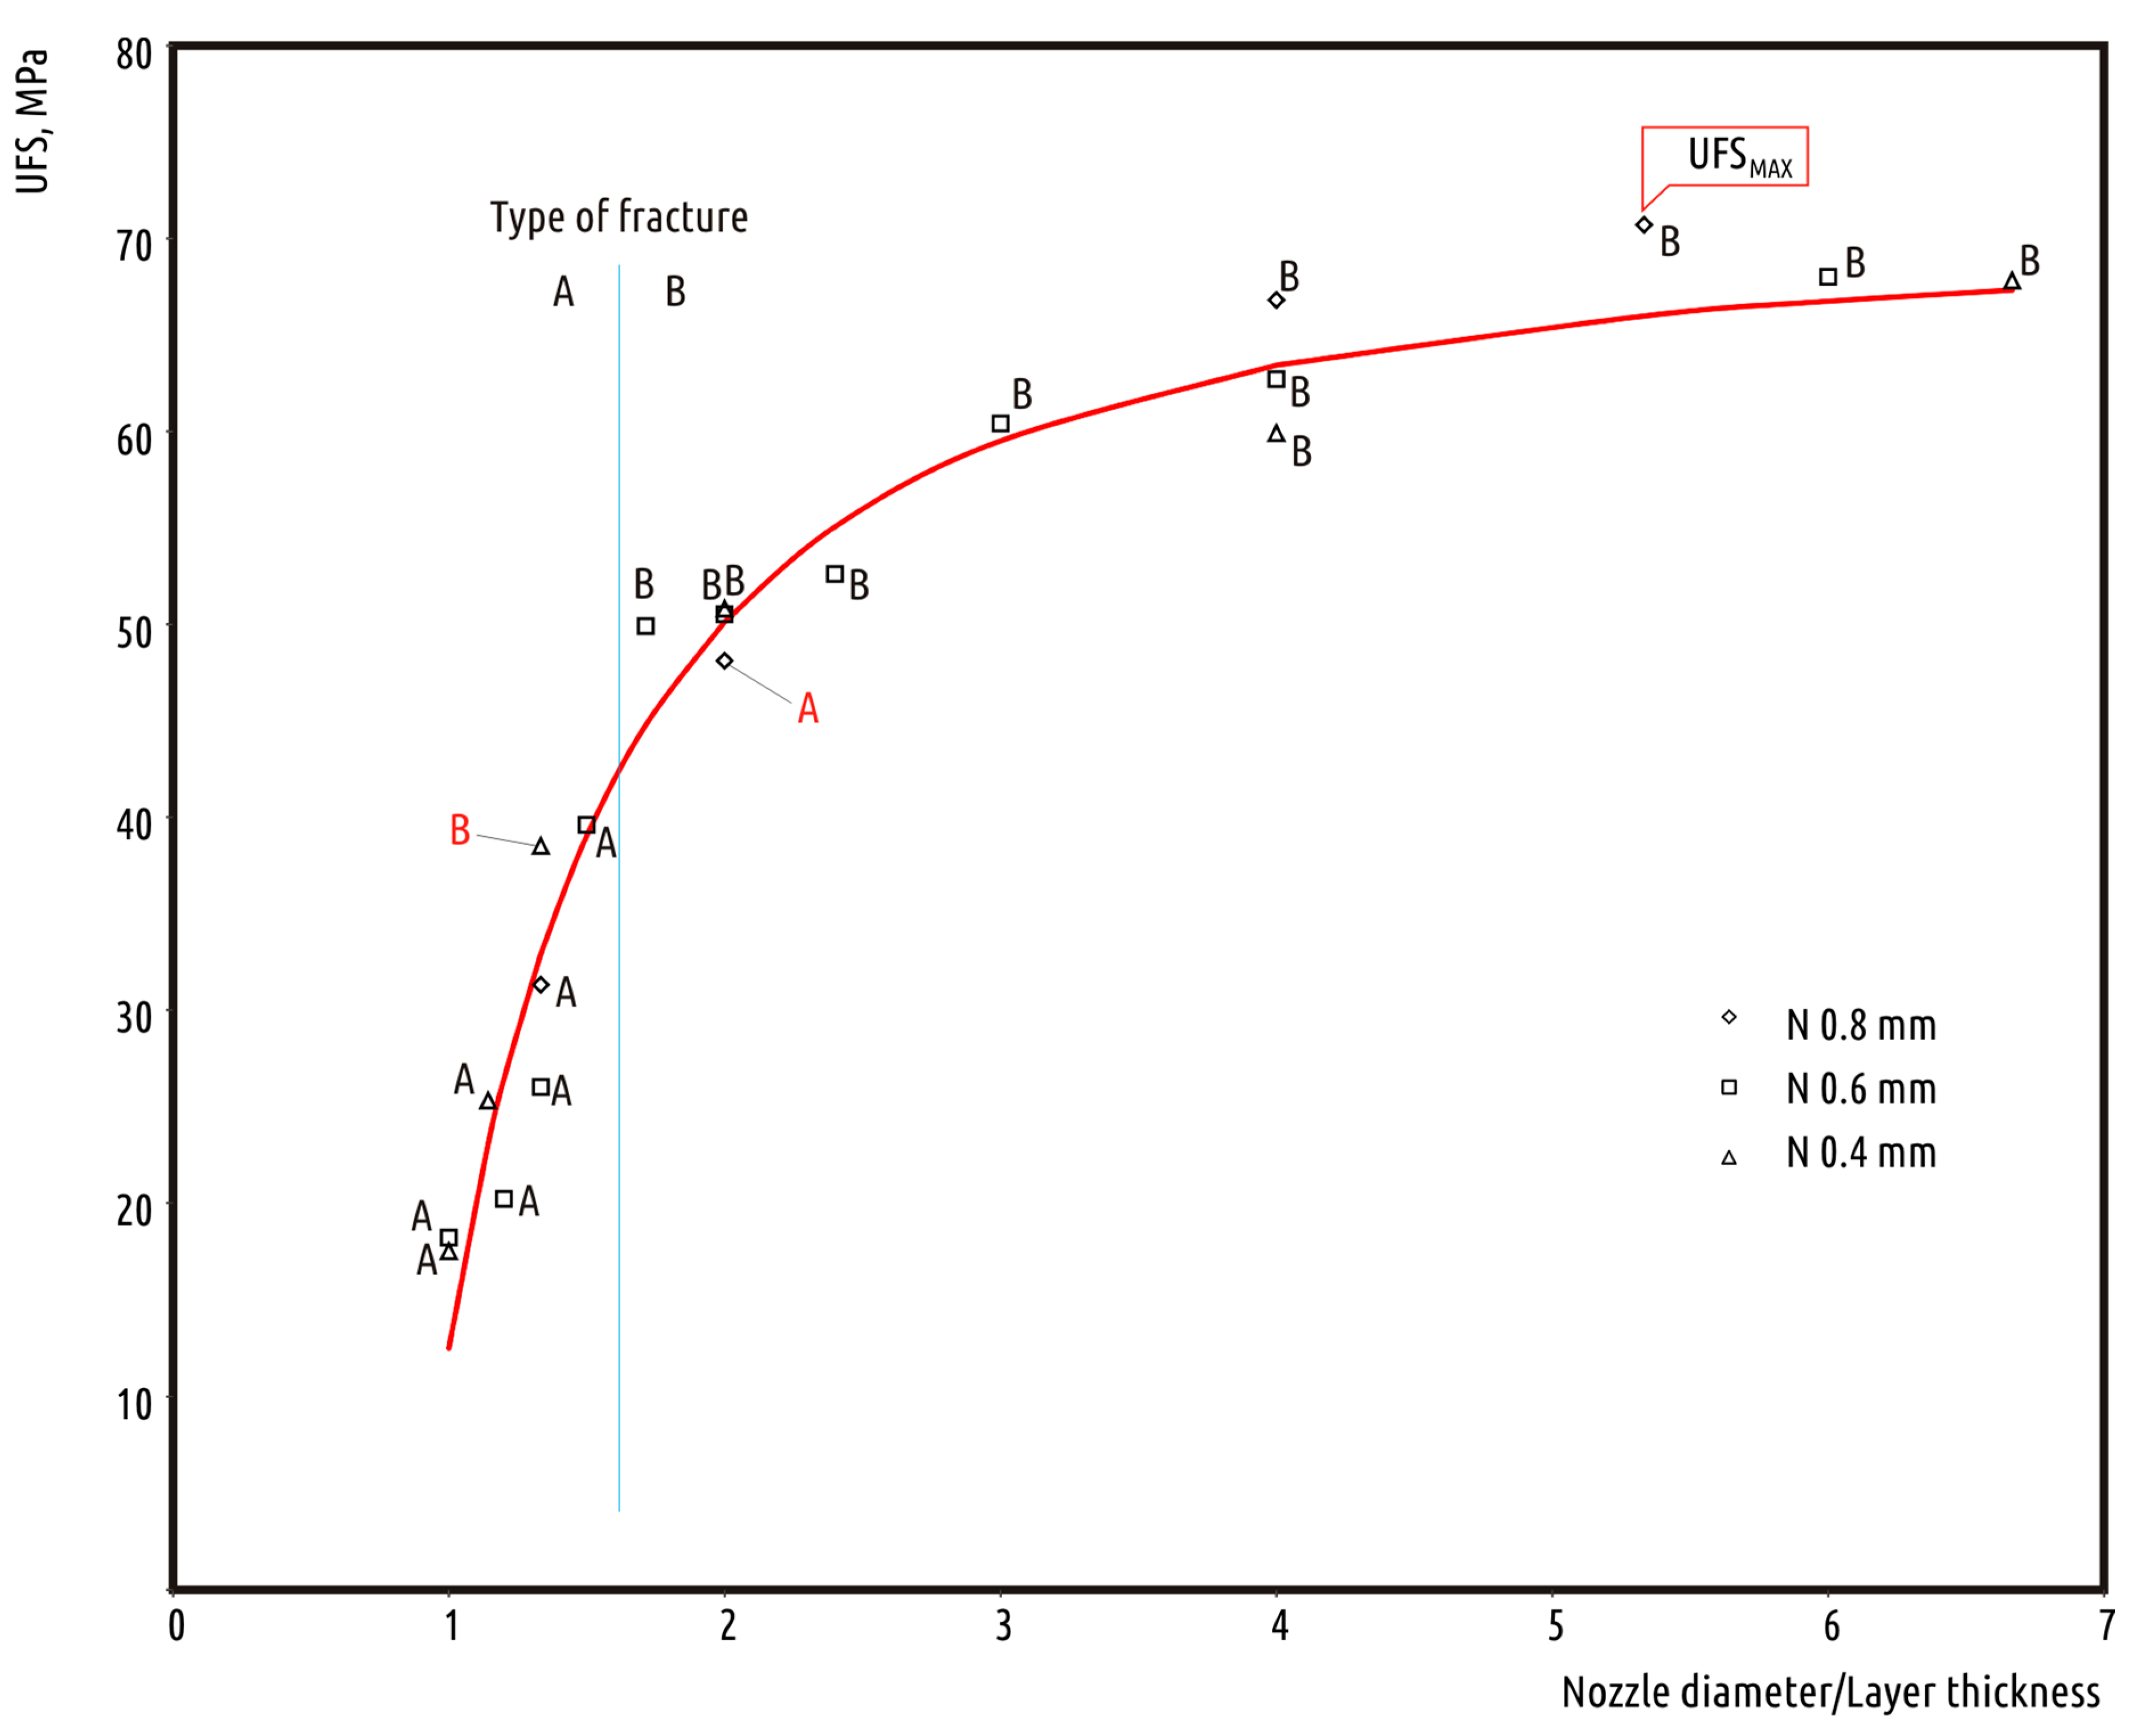
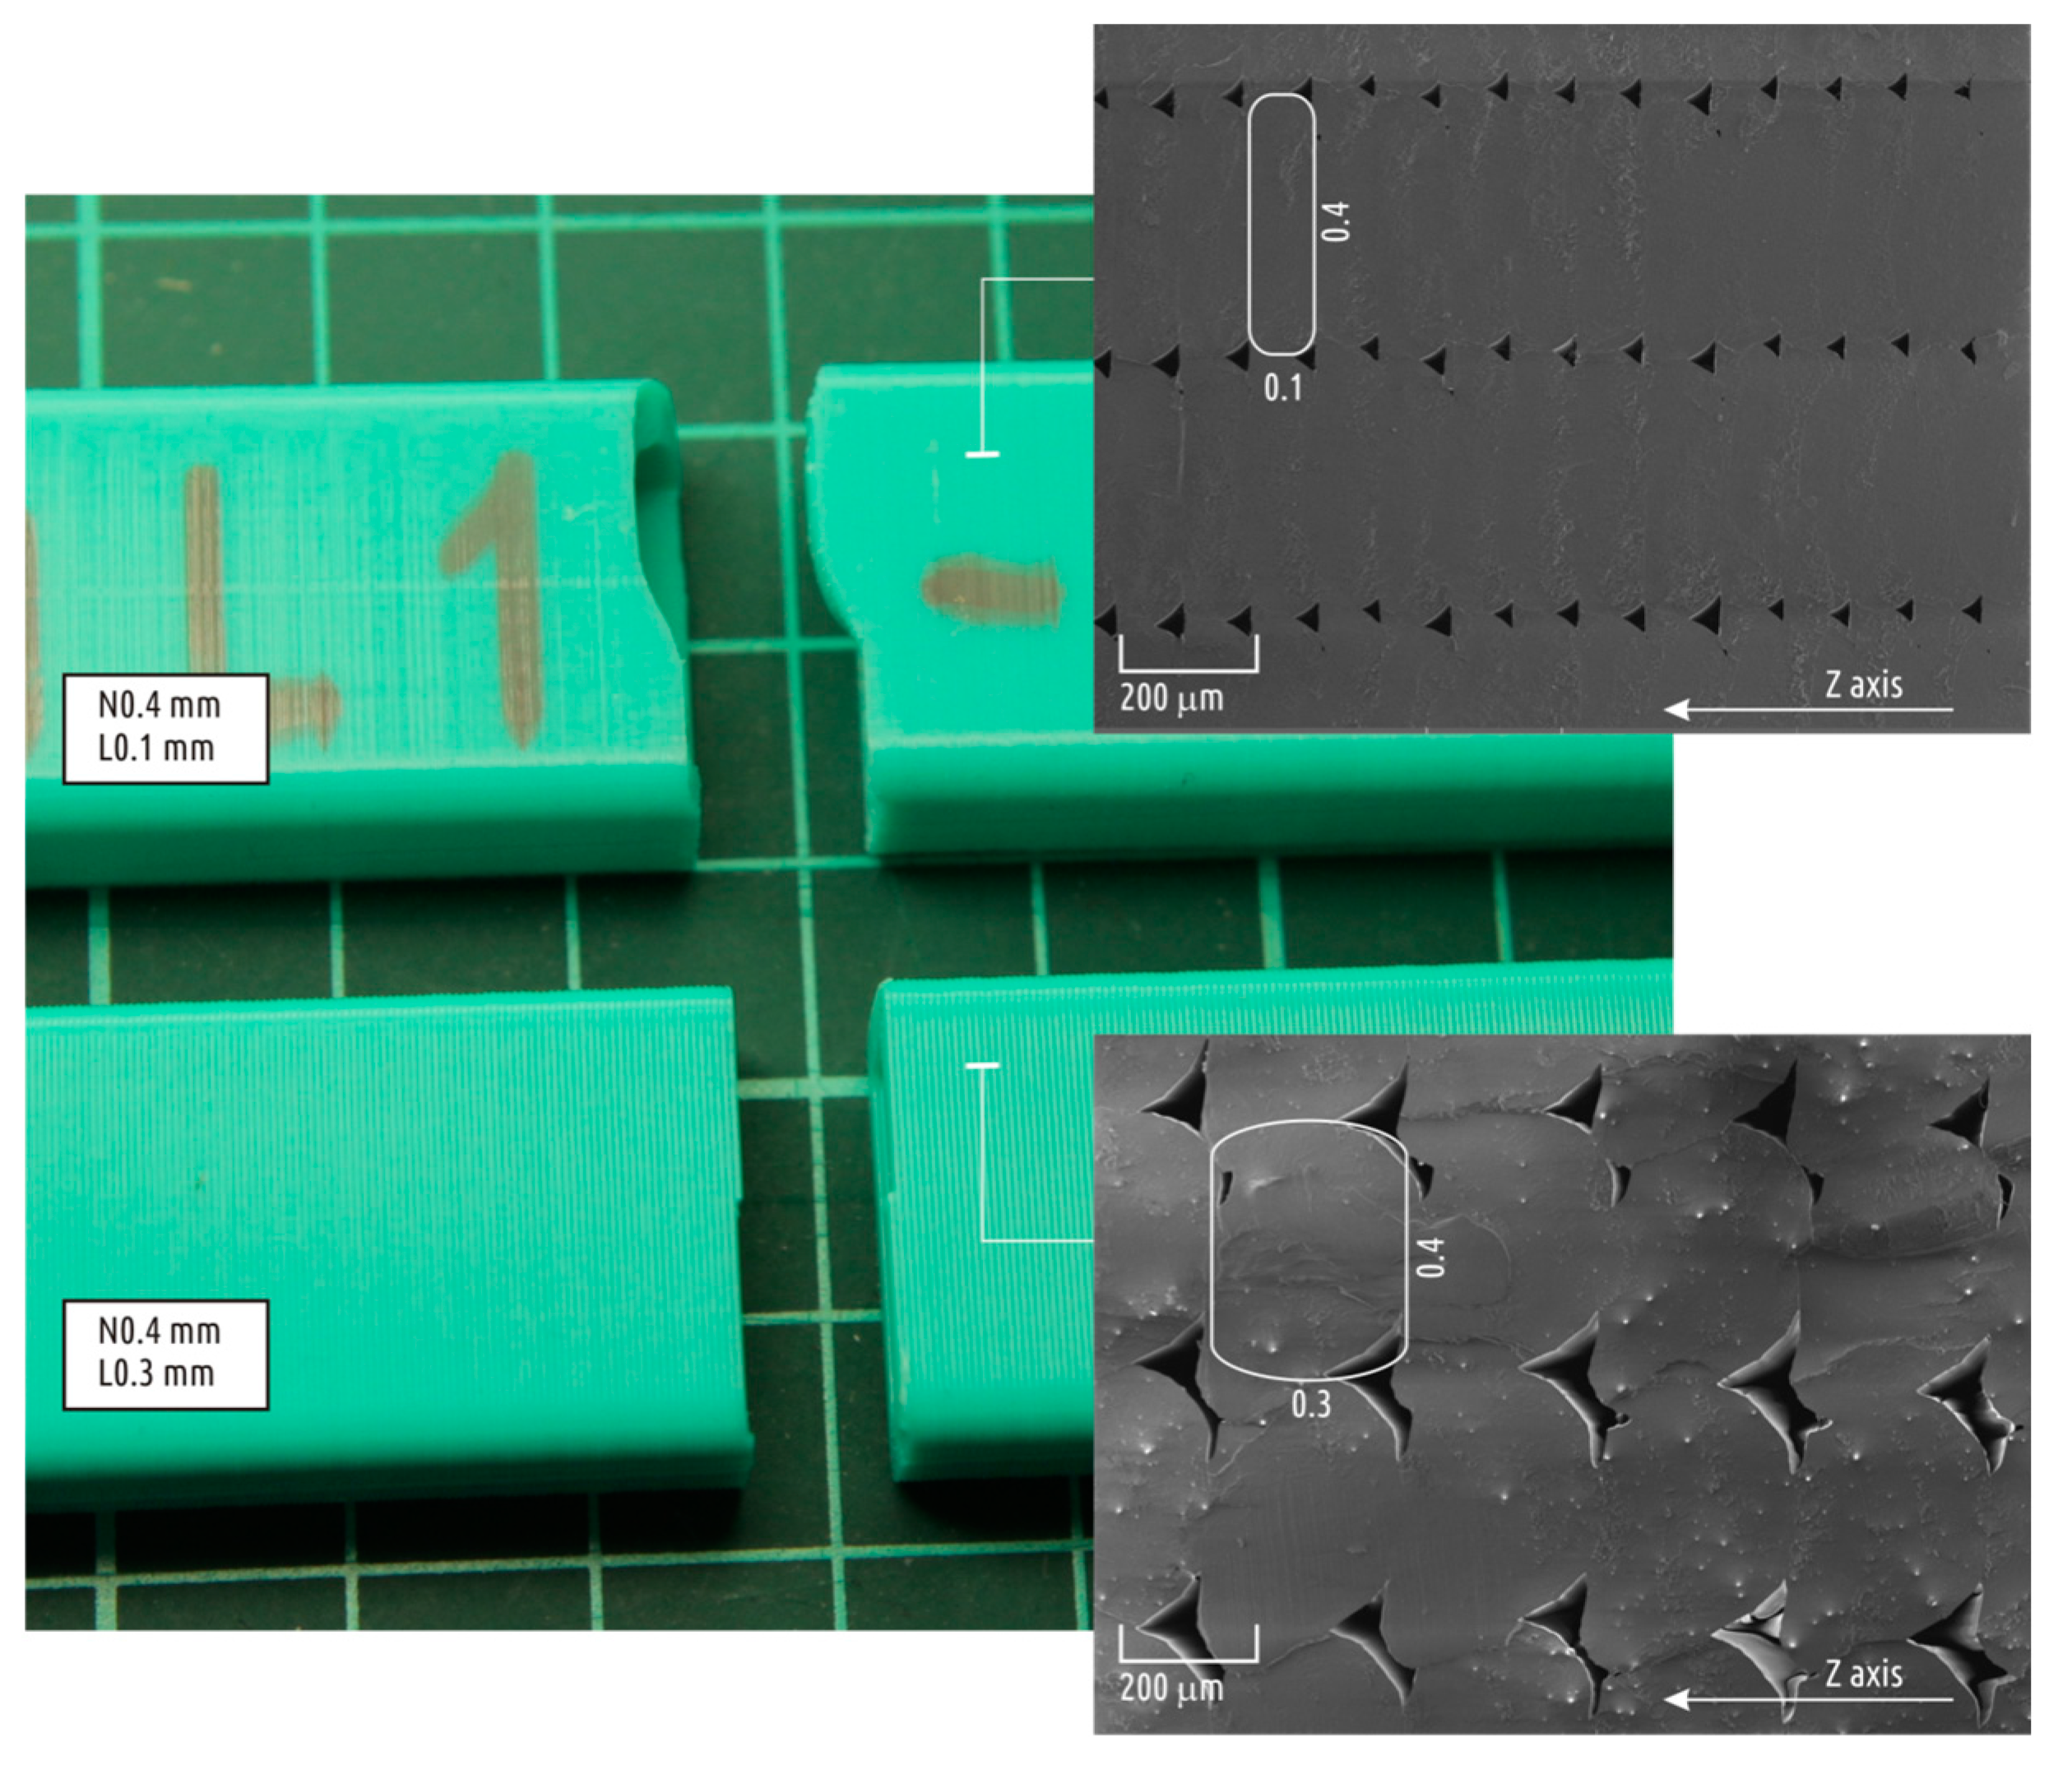
3.1. Influence of Geometrical Parameters
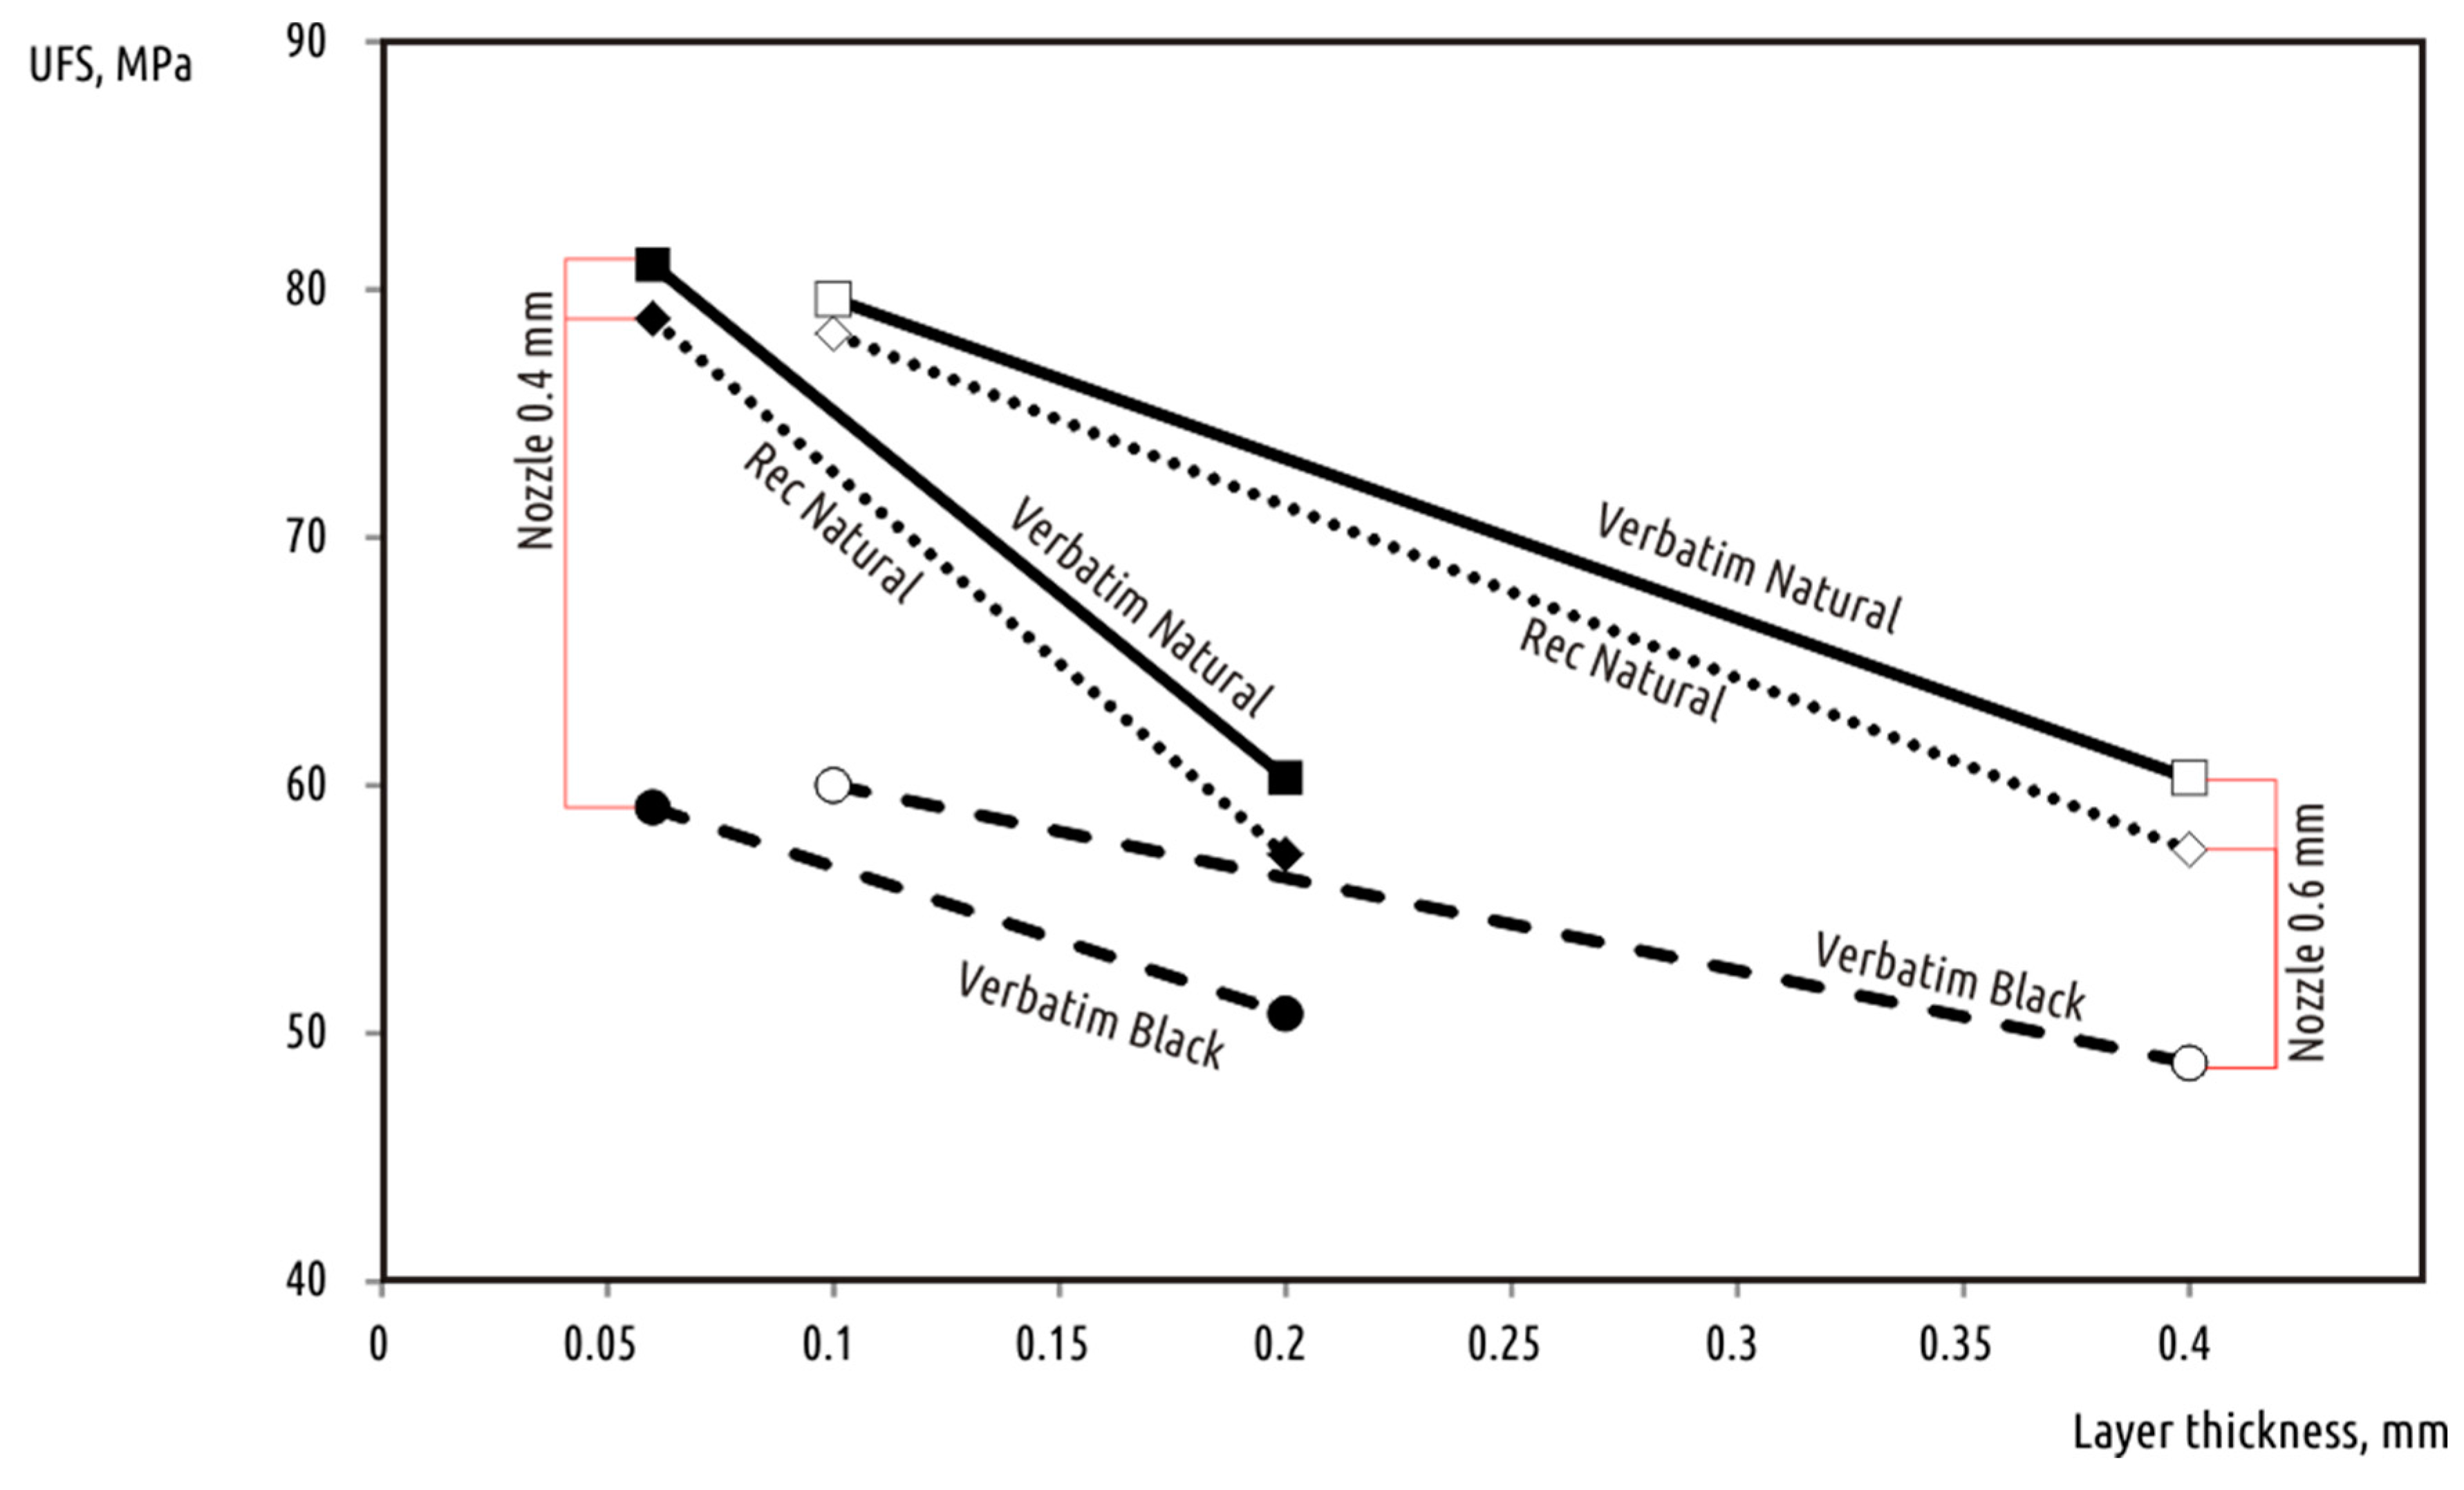
3.2. Influence of Filament Material on Print Strength
4. Conclusions
Acknowledgments
Author Contributions
Conflicts of Interest
References
- Crump, S. Apparatus and method for creating three-dimensional objects. U.S. Patent 5121329, 30 October 1989. [Google Scholar]
- Weinberg, M. Stratasys Sues Afinia: Ramifications for the Desktop 3D Printing Industry. 2013. Available online: http://makezine.com/2013/11/27/stratasys-sues-afinia-ramifications-for-the-desktop-3d-printing-industry/ (accessed on 28 November 2017).
- The RepRap Project. Available online: http://reprap.org/ (accessed on 24 February 2018).
- Jones, R.; Haufe, P.; Sells, E.; Iravani, P.; Olliver, V.; Palmer, C.; Bowyer, A. RepRap—The replicating rapid prototyper. Robotica 2011, 29, 177–191. [Google Scholar] [CrossRef]
- Tymrak, B.M.; Kreiger, M.; Pearce, J.M. Mechanical properties of components fabricated with open-source 3-D printers under realistic environmental conditions. Mater. Des. 2014, 58, 242–246. [Google Scholar] [CrossRef]
- Cody, W. Come and Take It: The Gun Printer’s Guide to Thinking Free; Gallery Books: New York, NY, USA, 2016. [Google Scholar]
- The E-Nable Project. Available online: http://enablingthefuture.org/ (accessed on 5 March 2018).
- Stephens, B.; Azimi, P.; Orch, Z.E.; Ramos, T. Ultrafine particle emissions from desktop 3D printers. Atmos. Environ. 2013, 79, 334–339. [Google Scholar] [CrossRef]
- Tanikella, N.G.; Wittbrodt, B.; Pearce, J.M. Tensile strength of commercial polymer materials for fused filament fabrication 3d printing. Addit. Manuf. 2017, 15, 40–47. [Google Scholar] [CrossRef]
- Chacón, J.M.; Caminero, M.A.; García-Plaza, E.; Núñez, P.J. Additive manufacturing of PLA structures using fused deposition modelling: Effect of process parameters on mechanical properties and their optimal selection. Mater. Des. 2017, 124, 143–157. [Google Scholar] [CrossRef]
- Sood, A.K.; Ohdar, R.K.; Mahapatra, S.S. Parametric appraisal of mechanical property of fused deposition modelling processed parts. Mater. Des. 2010, 31, 287–295. [Google Scholar] [CrossRef]
- Kuehnert, I. Weld—Lines in Injection Molded Parts; SPE Antec: Indianapolis, IN, USA, 2016. [Google Scholar]
- ASTM Standard D638 ASTM D638-14. Standard Test Method for Tensile Properties of Plastics; ASTM International: West Conshohocken, PA, USA, 2014. [Google Scholar]
- Sun, Q.; Rizvi, G.M.; Bellehumeur, C.T.; Gu, C.T. Effect of processing conditions on the bonding quality of FDM polymer filaments. Rapid Prototyp. J. 2008, 14, 72–80. [Google Scholar] [CrossRef]
- ASTM Standard D 1184-98. Standard Test Method for Flexural Strength of Adhesive Bonded Laminated Assemblies; ASTM International: West Conshohocken, PA, USA, 2012. [Google Scholar]
- Sie, G. The Olsson Block—A Community Invention by Anders Olsson. 2015. Available online: https://ultimaker.com/en/stories/17982-the-olsson-block-a-community-invention-by-anders-olsson (accessed on 26 November 2017).
- PLA (General Purpose) GRANTA. CES EDUPACK. 2016. Available online: http://www.grantadesign.com/education/edupack/ (accessed on 28 December 2017).
- Abbotta, A.C.; Tandona, G.P.; Bradforda, R.L.; Koernerb, H.; Baurb, J.W. Process-structure-property effects on ABS bond strength in fused filament fabrication. Addit. Manuf. 2017, 19, 29–38. [Google Scholar] [CrossRef]
- Wittbrodt, B.; Pearce, J.M. The Effects of PLA Color on Material Properties of 3-D Printed Components. Addit. Manuf. 2015, 8, 110–116. [Google Scholar] [CrossRef]


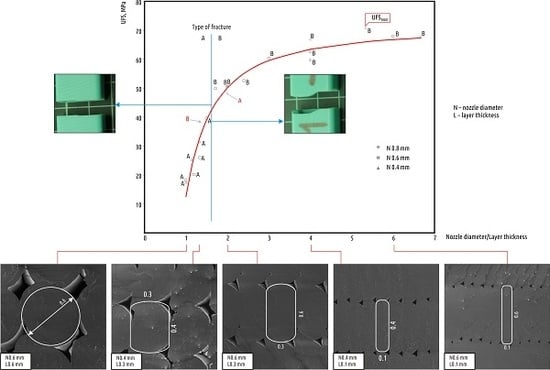
| Code | Nozzle Diameter, mm | Layer Thickness, mm | Volumetric Printing Speed, mm3/s | Fracture Force 1, N | Ultimate Fracture Strength, MPa | Type of Fracture 2 |
|---|---|---|---|---|---|---|
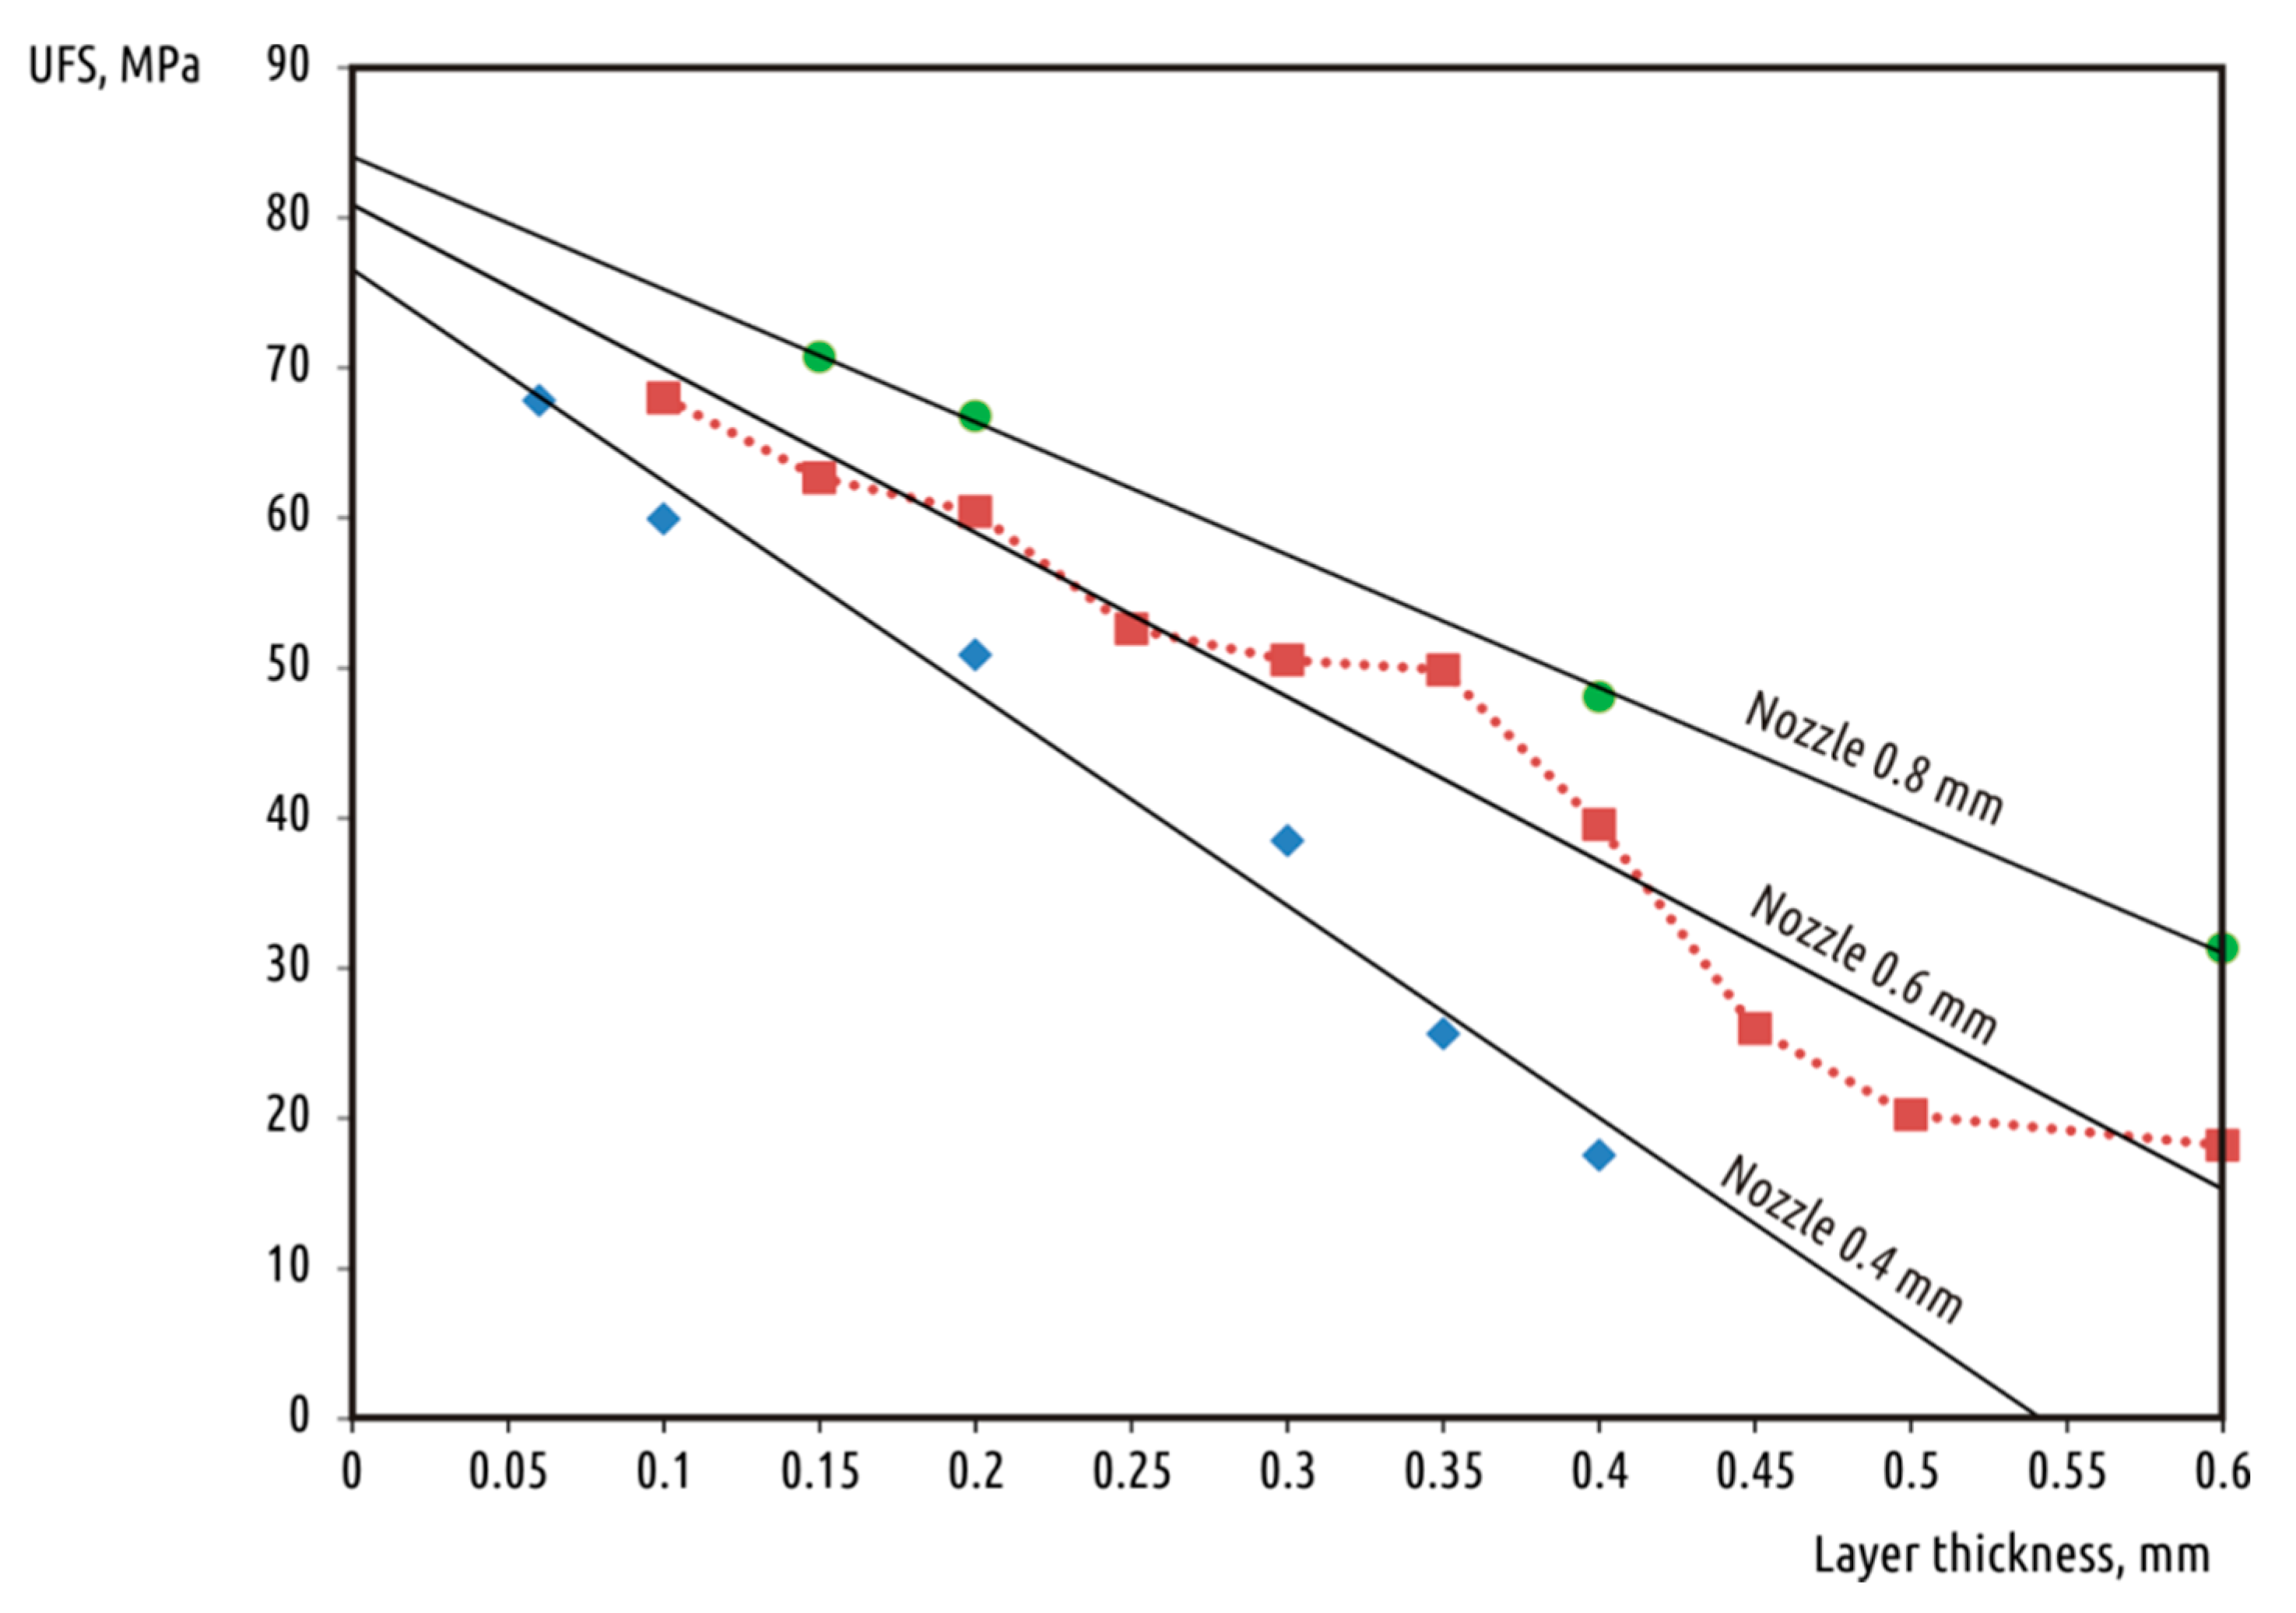
| N8L15 | 0.8 | 0.15 | 3 | 802 (27) | 70.7 | B |
| N8L2 | 0.8 | 0.2 | 4 | 757 (35) | 66.8 | B |
| N8L4 | 0.8 | 0.4 | 8 | 545 (72) | 48.1 | A |
| N8L6 | 0.8 | 0.6 | 12 | 355 (27) | 31.3 | A |
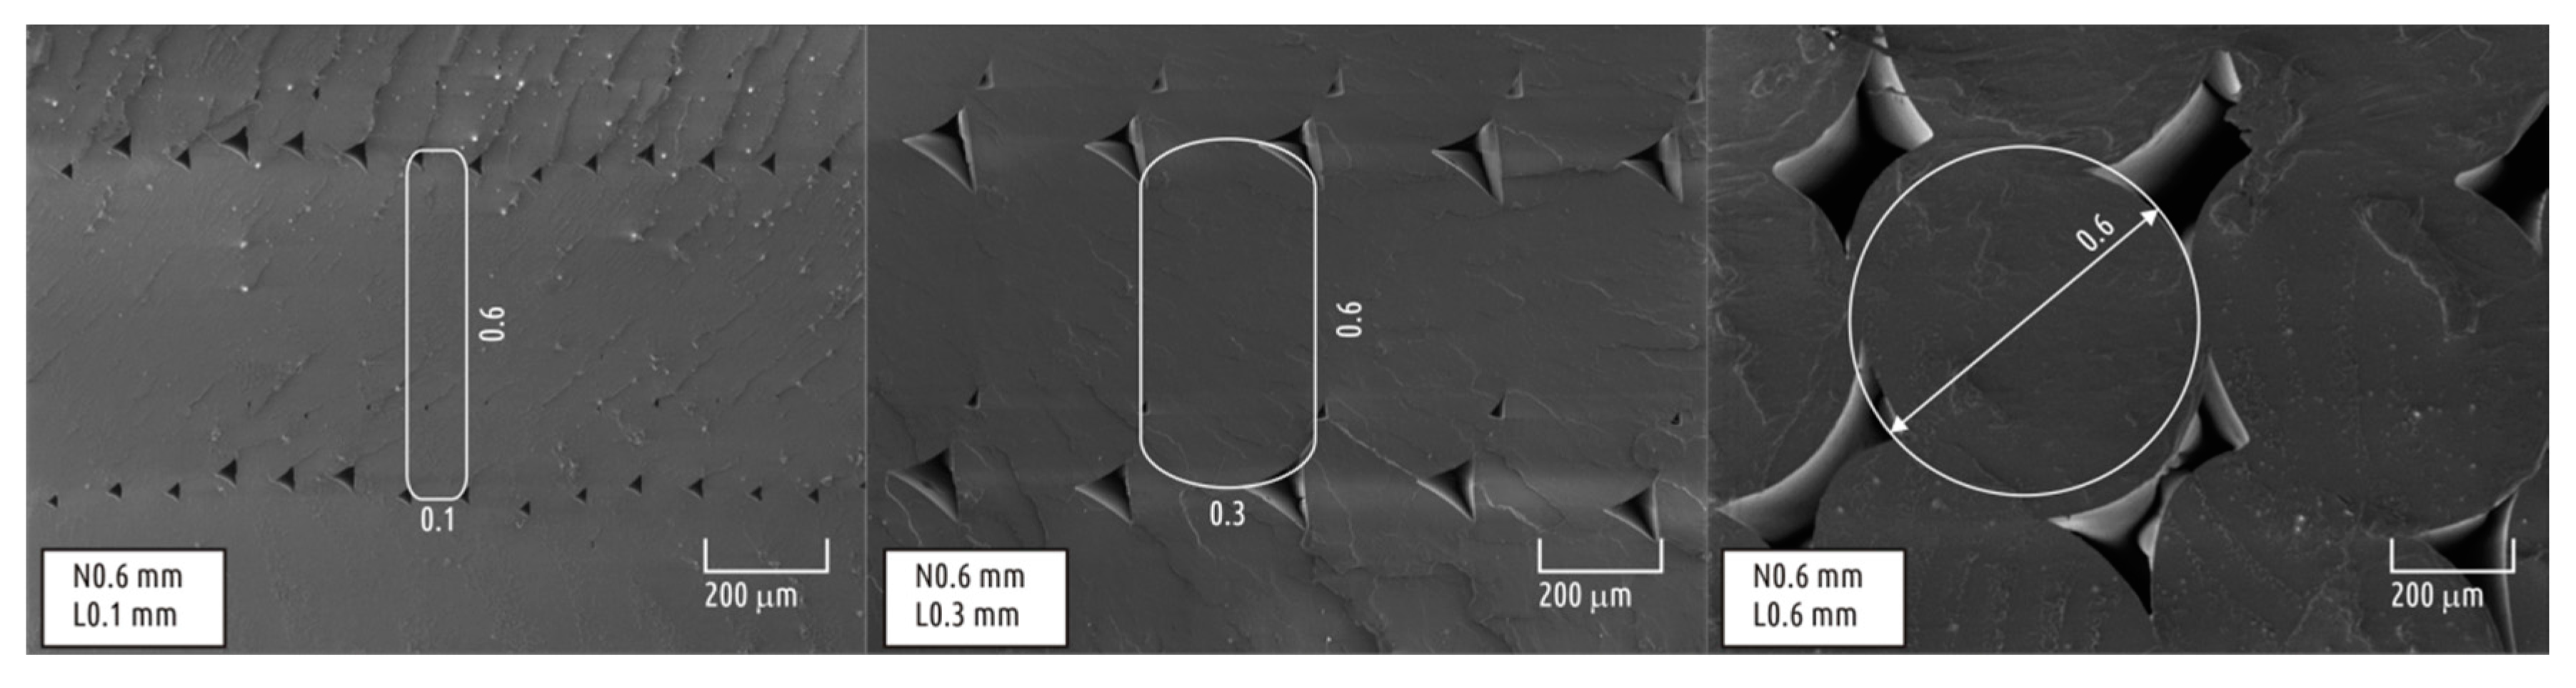
| N6L1 | 0.6 | 0.1 | 1.5 | 771 (17) | 68.0 | B |
| N6L15 | 0.6 | 0.15 | 2.2 | 710 (49) | 62.7 | B |
| N6L2 | 0.6 | 0.2 | 3 | 685 (9) | 60.4 | B |
| N6L25 | 0.6 | 0.25 | 3.8 | 596 (30) | 52.6 | B |
| N6L3 | 0.6 | 0.3 | 4.5 | 573 (51) | 50.5 | B |
| N6L35 | 0.6 | 0.35 | 5.2 | 565 (34) | 49.9 | B |
| N6L4 | 0.6 | 0.4 | 6 | 448 (13) | 39.6 | A |
| N6L45 | 0.6 | 0.45 | 6.8 | 294 (4) | 26.0 | A |
| N6L5 | 0.6 | 0.5 | 7.5 | 229 (21) | 20.2 | A |
| N6L6 | 0.6 | 0.6 | 9 | 207 (12) | 18.2 | A |
| N4L06 | 0.4 | 0.06 | 0.6 | 768 (7) | 67.8 | B |
| N4L1 | 0.4 | 0.1 | 1 | 679 (33) | 59.9 | B |
| N4L2 | 0.4 | 0.2 | 2 | 576 (44) | 50.8 | B |
| N4L3 | 0.4 | 0.3 | 3 | 436 (59) | 38.5 | B |
| N4L35 | 0.4 | 0.35 | 3.5 | 290 (18) | 25.6 | A |
| N4L4 | 0.4 | 0.4 | 4 | 198 (24) | 17.5 | A |
| Vendor | Color | Nozzle Diameter, mm | Layer Thickness, mm | Fracture Force 1, N | Ultimate Fracture Strength, MPa |
|---|---|---|---|---|---|
| REC | Natural | 0.6 | 0.1 | 886 (19) | 78.2 |
| REC | Natural | 0.6 | 0.4 | 651 (6) | 57.4 |
| Verbatim | Natural | 0.6 | 0.1 | 902 (38) | 79.6 |
| Verbatim | Natural | 0.6 | 0.4 | 683 (29) | 60.3 |
| Verbatim | Black | 0.6 | 0.1 | 680 (38) | 60.0 |
| Verbatim | Black | 0.6 | 0.4 | 553 (44) | 48.8 |
| REC | Natural | 0.4 | 0.06 | 893 (20) | 78.8 |
| REC | Natural | 0.4 | 0.2 | 648 (40) | 57.2 |
| Verbatim | Natural | 0.4 | 0.06 | 918 (37) | 81.0 |
| Verbatim | Natural | 0.4 | 0.2 | 684 (16) | 60.3 |
| Verbatim | Black | 0.4 | 0.06 | 670 (38) | 59.1 |
| Verbatim | Black | 0.4 | 0.2 | 576 (61) | 50.8 |
© 2018 by the authors. Licensee MDPI, Basel, Switzerland. This article is an open access article distributed under the terms and conditions of the Creative Commons Attribution (CC BY) license (http://creativecommons.org/licenses/by/4.0/).
Share and Cite
Kuznetsov, V.E.; Solonin, A.N.; Urzhumtsev, O.D.; Schilling, R.; Tavitov, A.G. Strength of PLA Components Fabricated with Fused Deposition Technology Using a Desktop 3D Printer as a Function of Geometrical Parameters of the Process. Polymers 2018, 10, 313. https://doi.org/10.3390/polym10030313
Kuznetsov VE, Solonin AN, Urzhumtsev OD, Schilling R, Tavitov AG. Strength of PLA Components Fabricated with Fused Deposition Technology Using a Desktop 3D Printer as a Function of Geometrical Parameters of the Process. Polymers. 2018; 10(3):313. https://doi.org/10.3390/polym10030313
Chicago/Turabian StyleKuznetsov, Vladimir E., Alexey N. Solonin, Oleg D. Urzhumtsev, Richard Schilling, and Azamat G. Tavitov. 2018. "Strength of PLA Components Fabricated with Fused Deposition Technology Using a Desktop 3D Printer as a Function of Geometrical Parameters of the Process" Polymers 10, no. 3: 313. https://doi.org/10.3390/polym10030313
APA StyleKuznetsov, V. E., Solonin, A. N., Urzhumtsev, O. D., Schilling, R., & Tavitov, A. G. (2018). Strength of PLA Components Fabricated with Fused Deposition Technology Using a Desktop 3D Printer as a Function of Geometrical Parameters of the Process. Polymers, 10(3), 313. https://doi.org/10.3390/polym10030313