Preparation of PVDF/PAR Composites with Piezoelectric Properties by Post-Treatment


Abstract
:1. Introduction
2. Materials and Methods
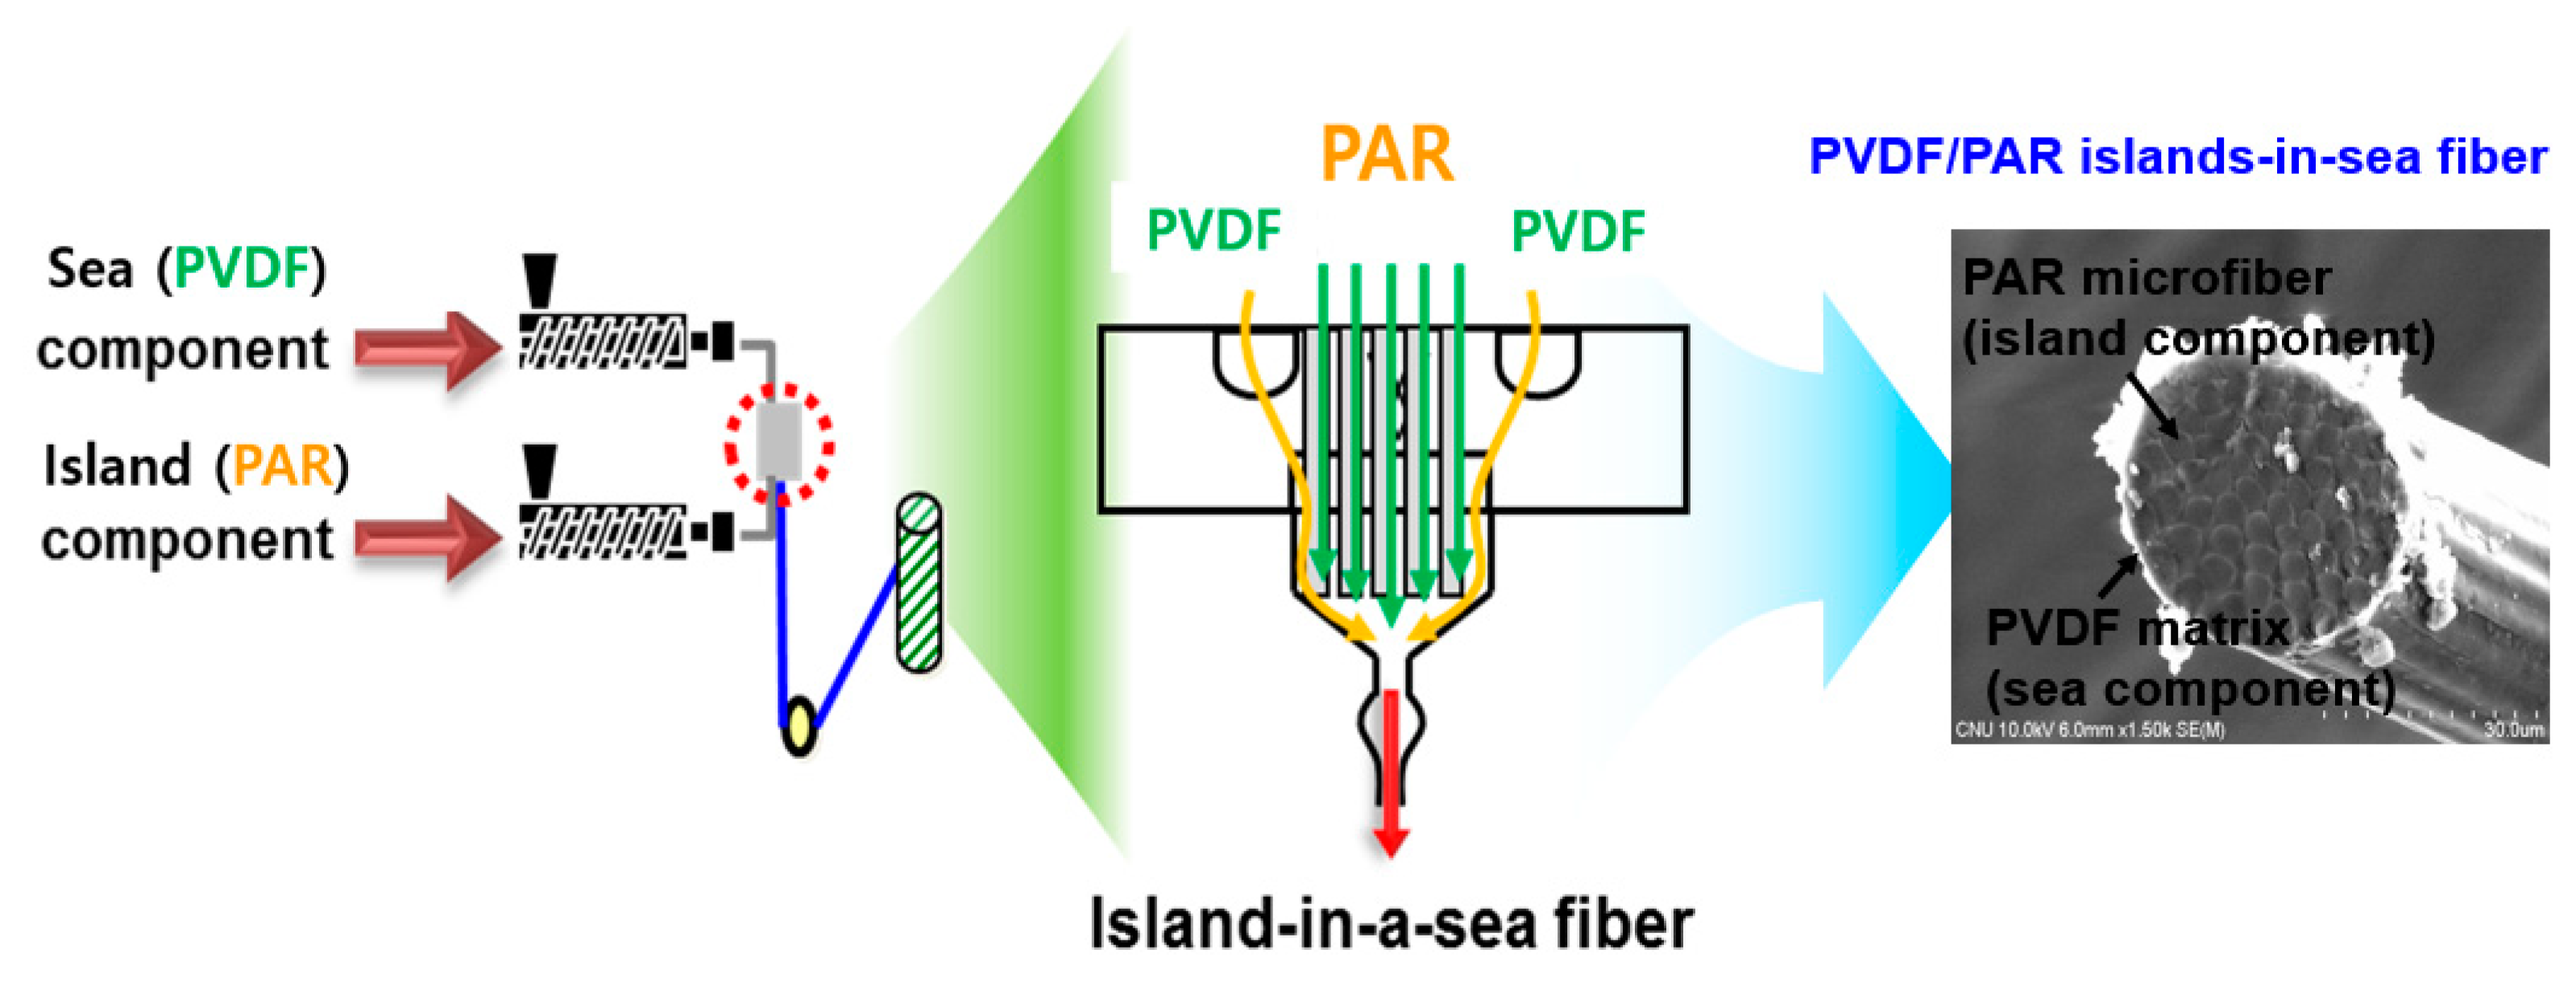
2.1. Melt Spinning of Island-In-A-Sea Fiber
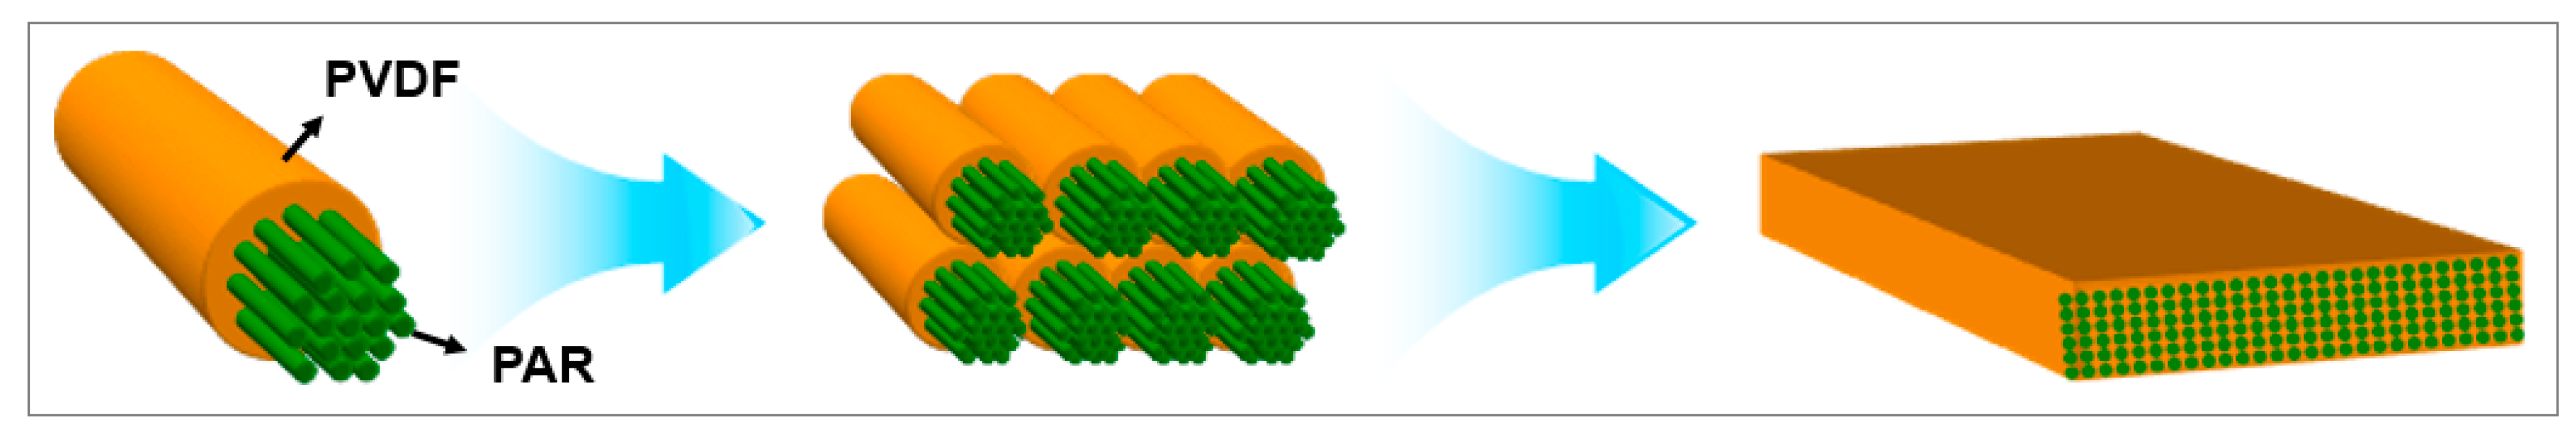
2.2. Preparation of PVDF/PAR Composites
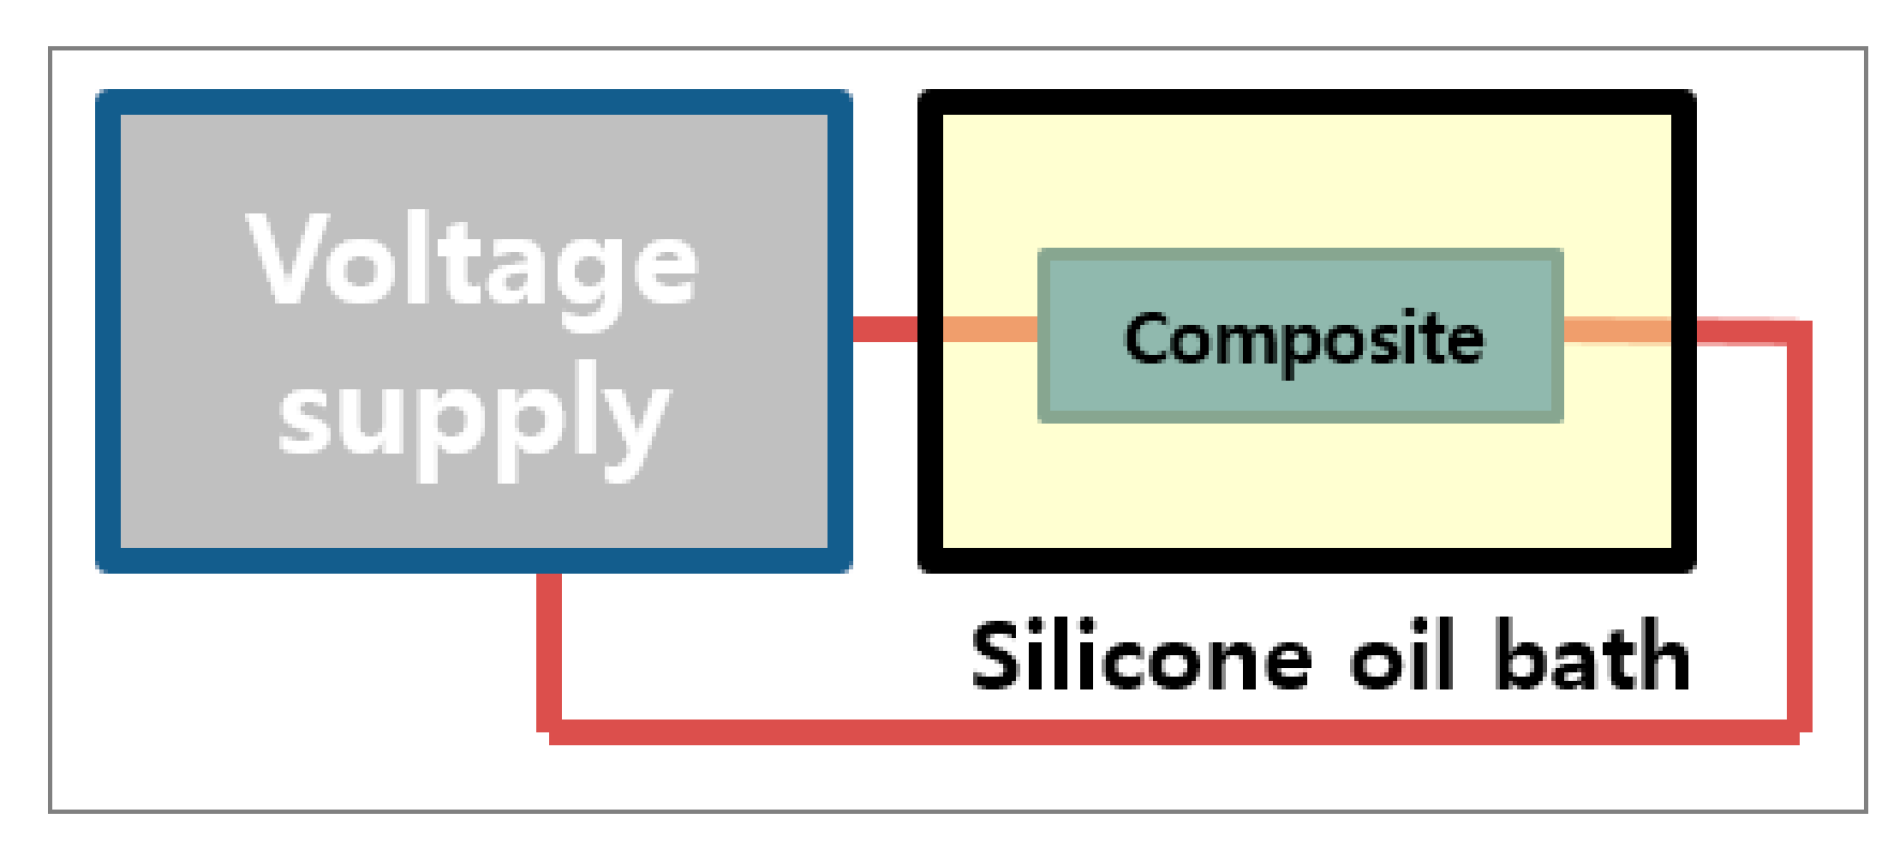
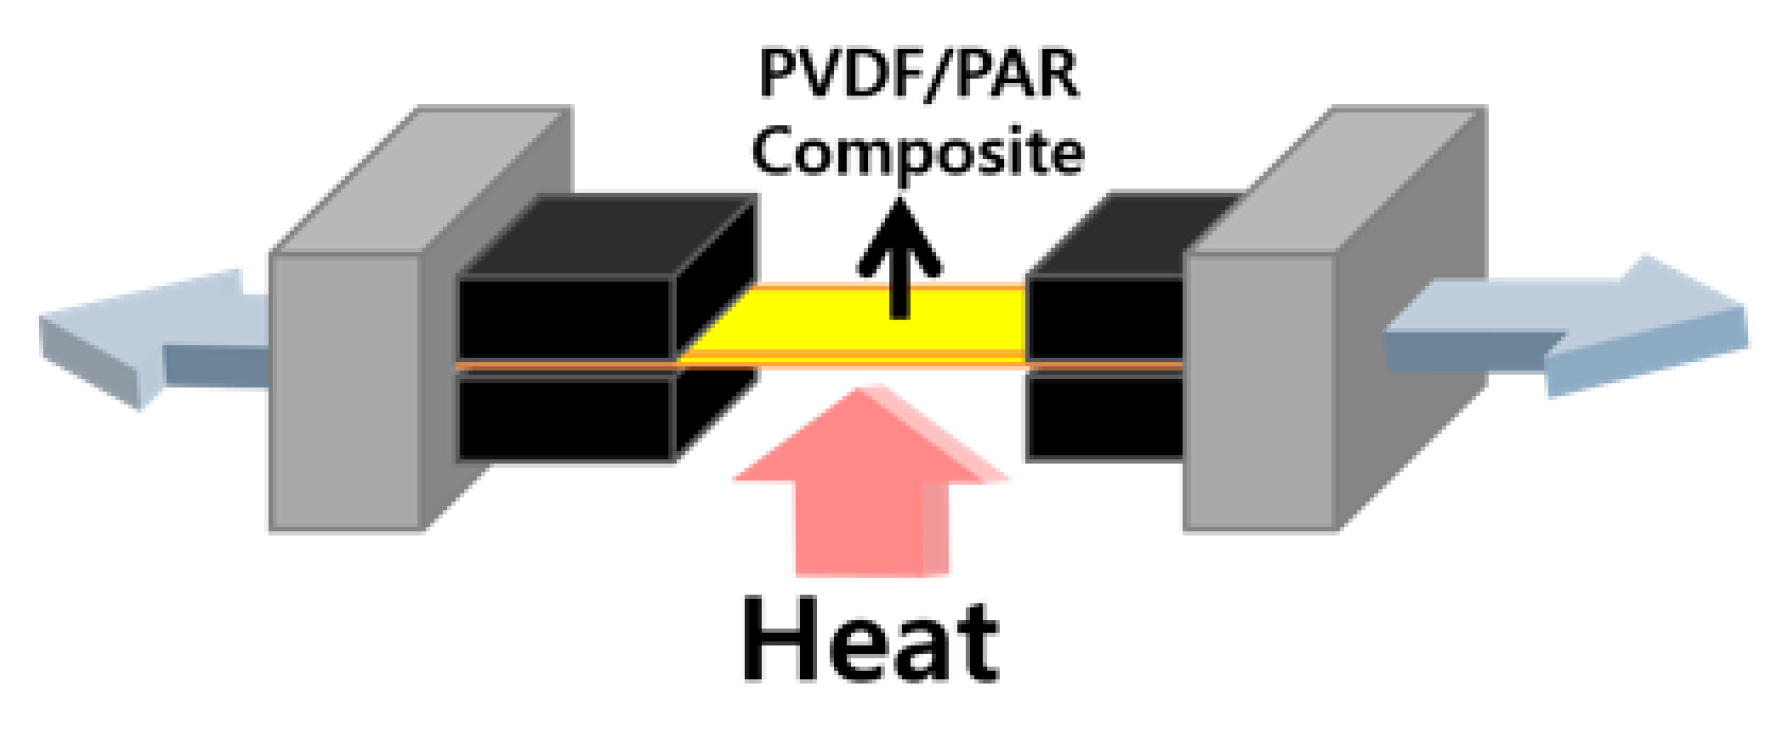
2.3. Post-Treatment
2.4. Characterization
3. Results
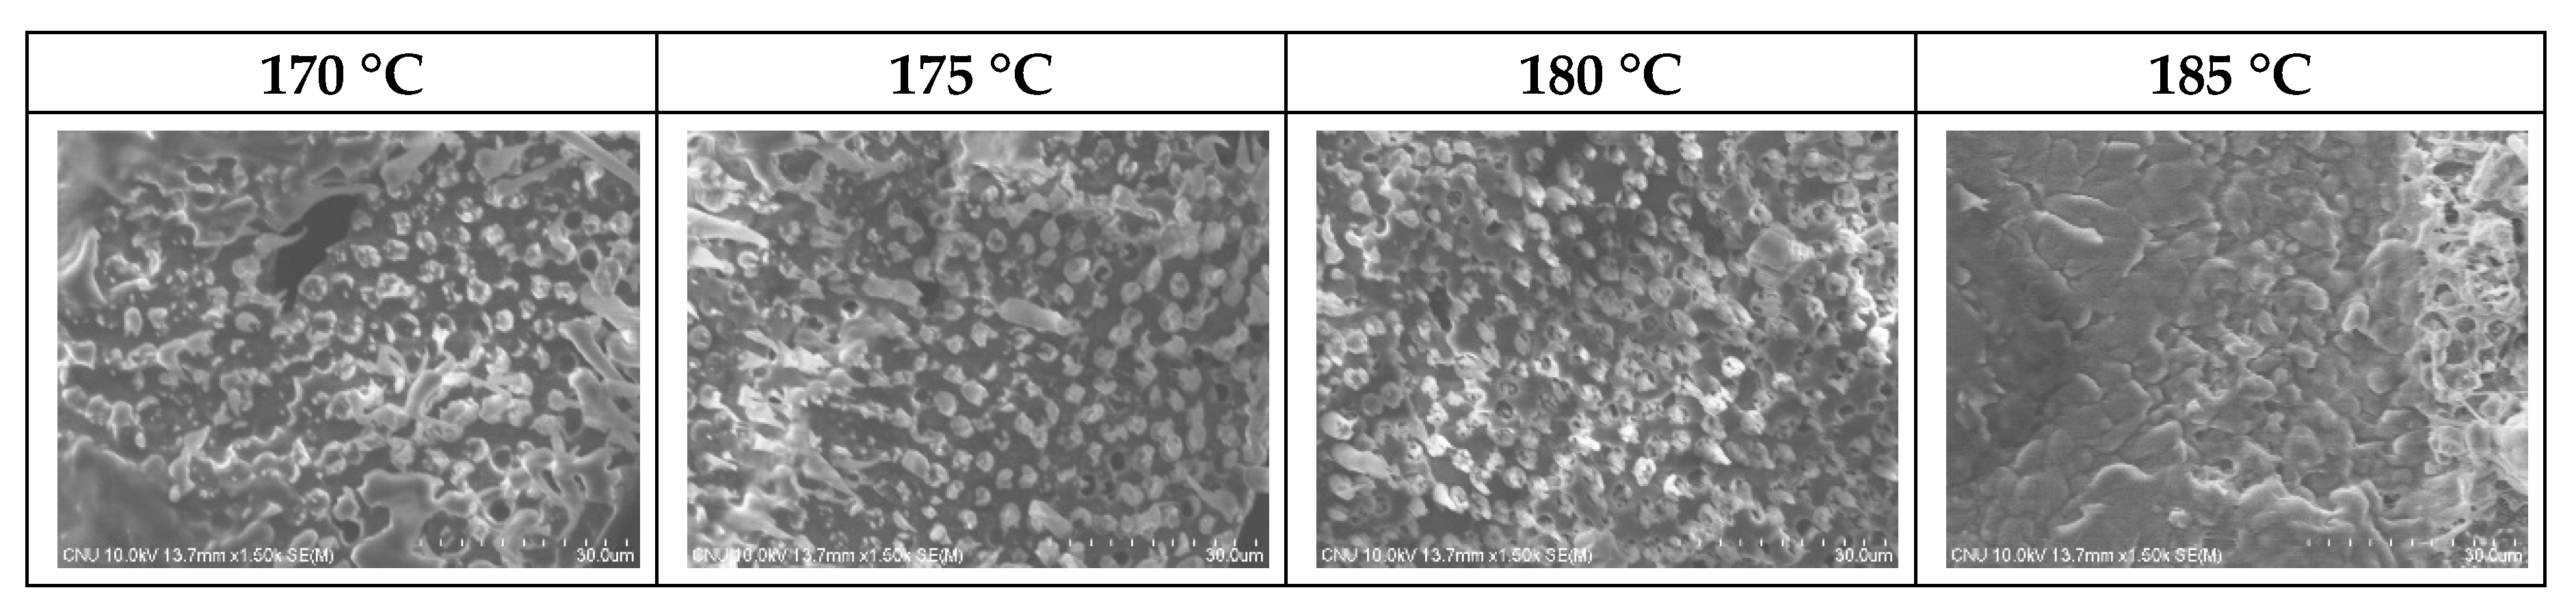
3.1. Morphologies
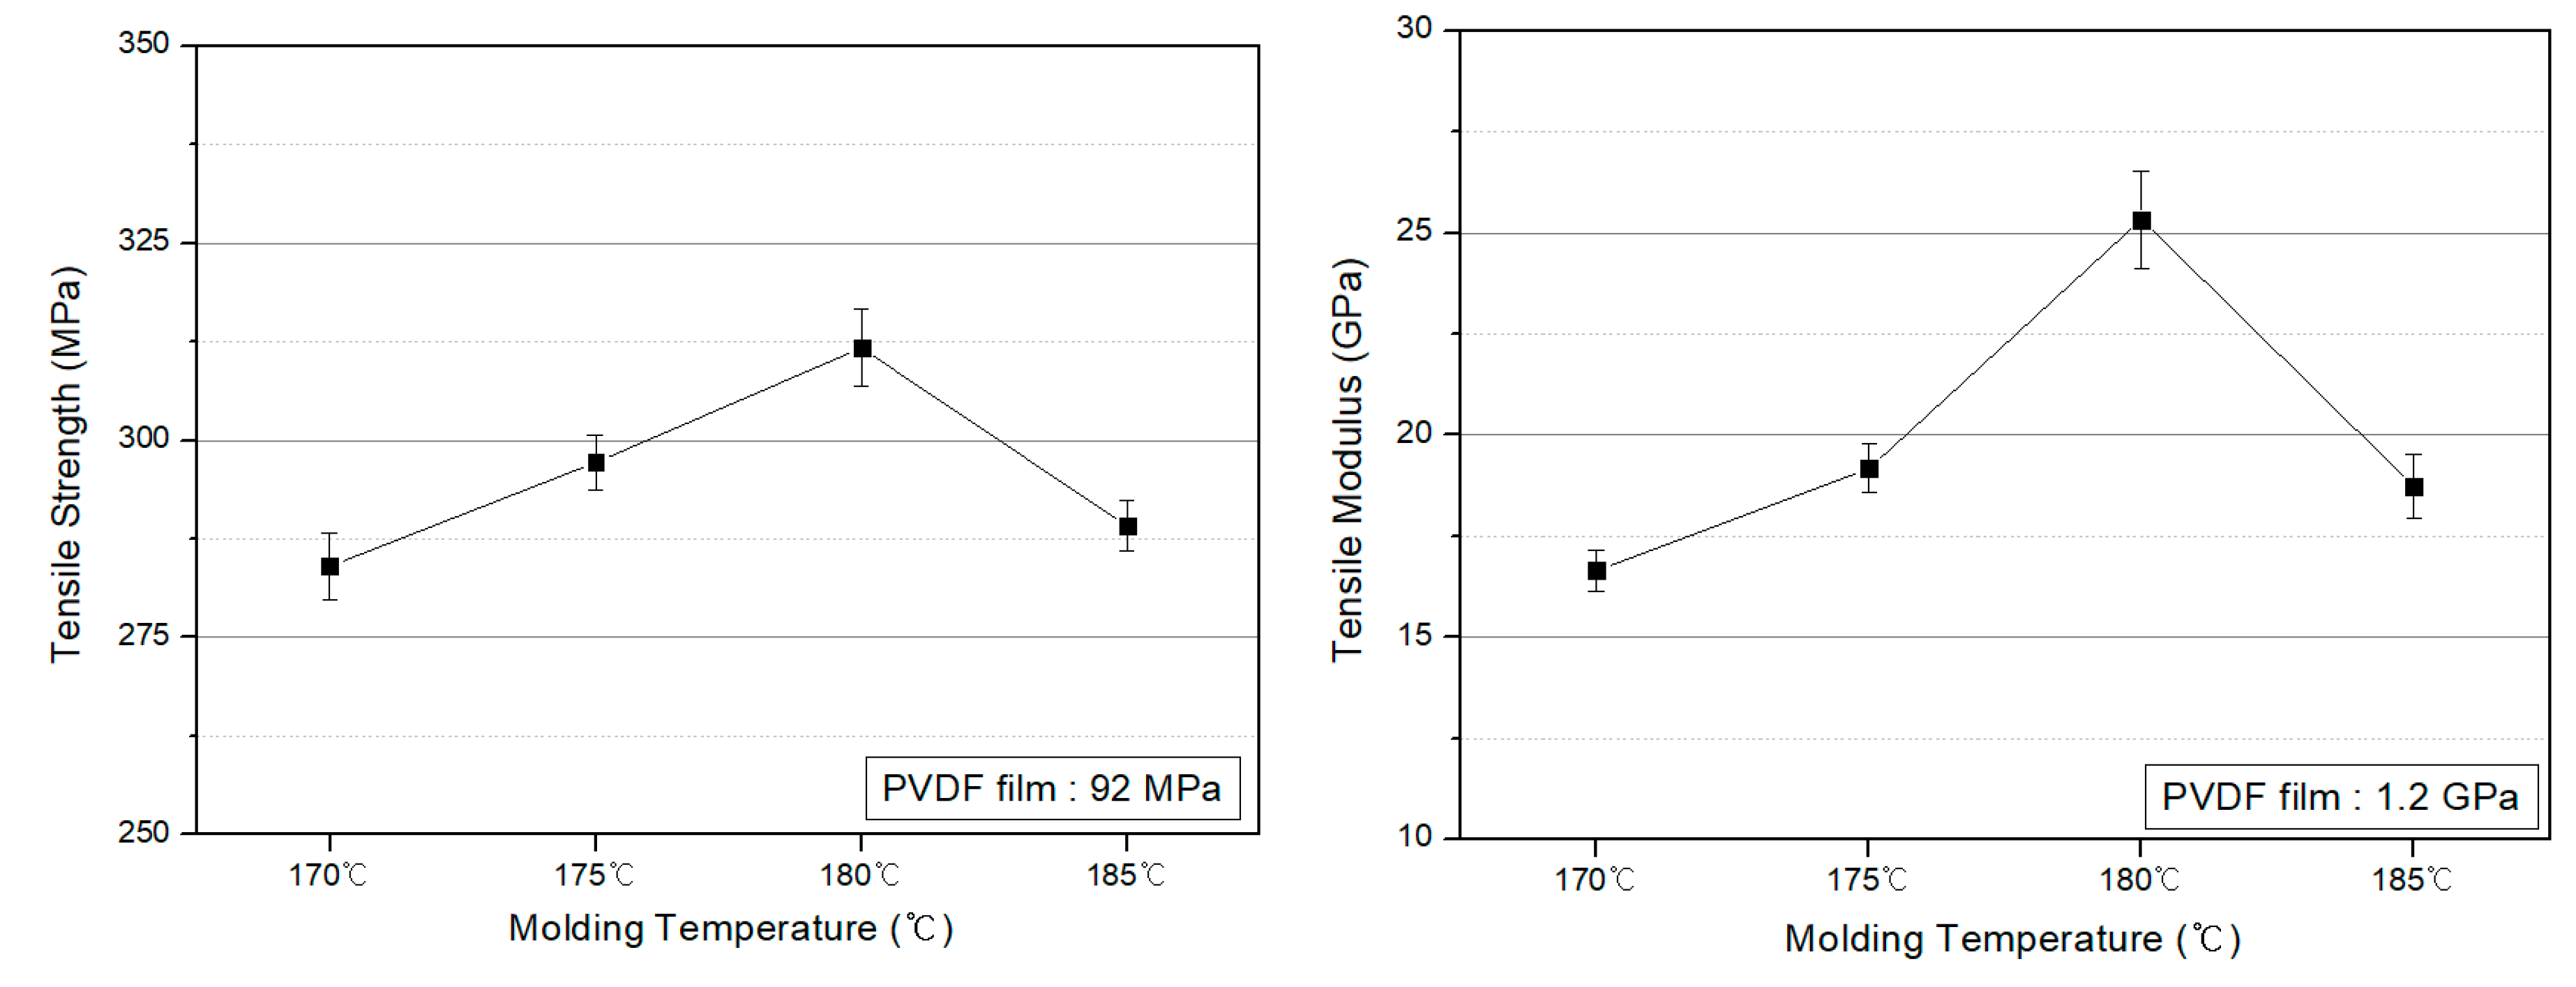
3.2. Tensile Properties
3.3. Crystal Structures and Properties
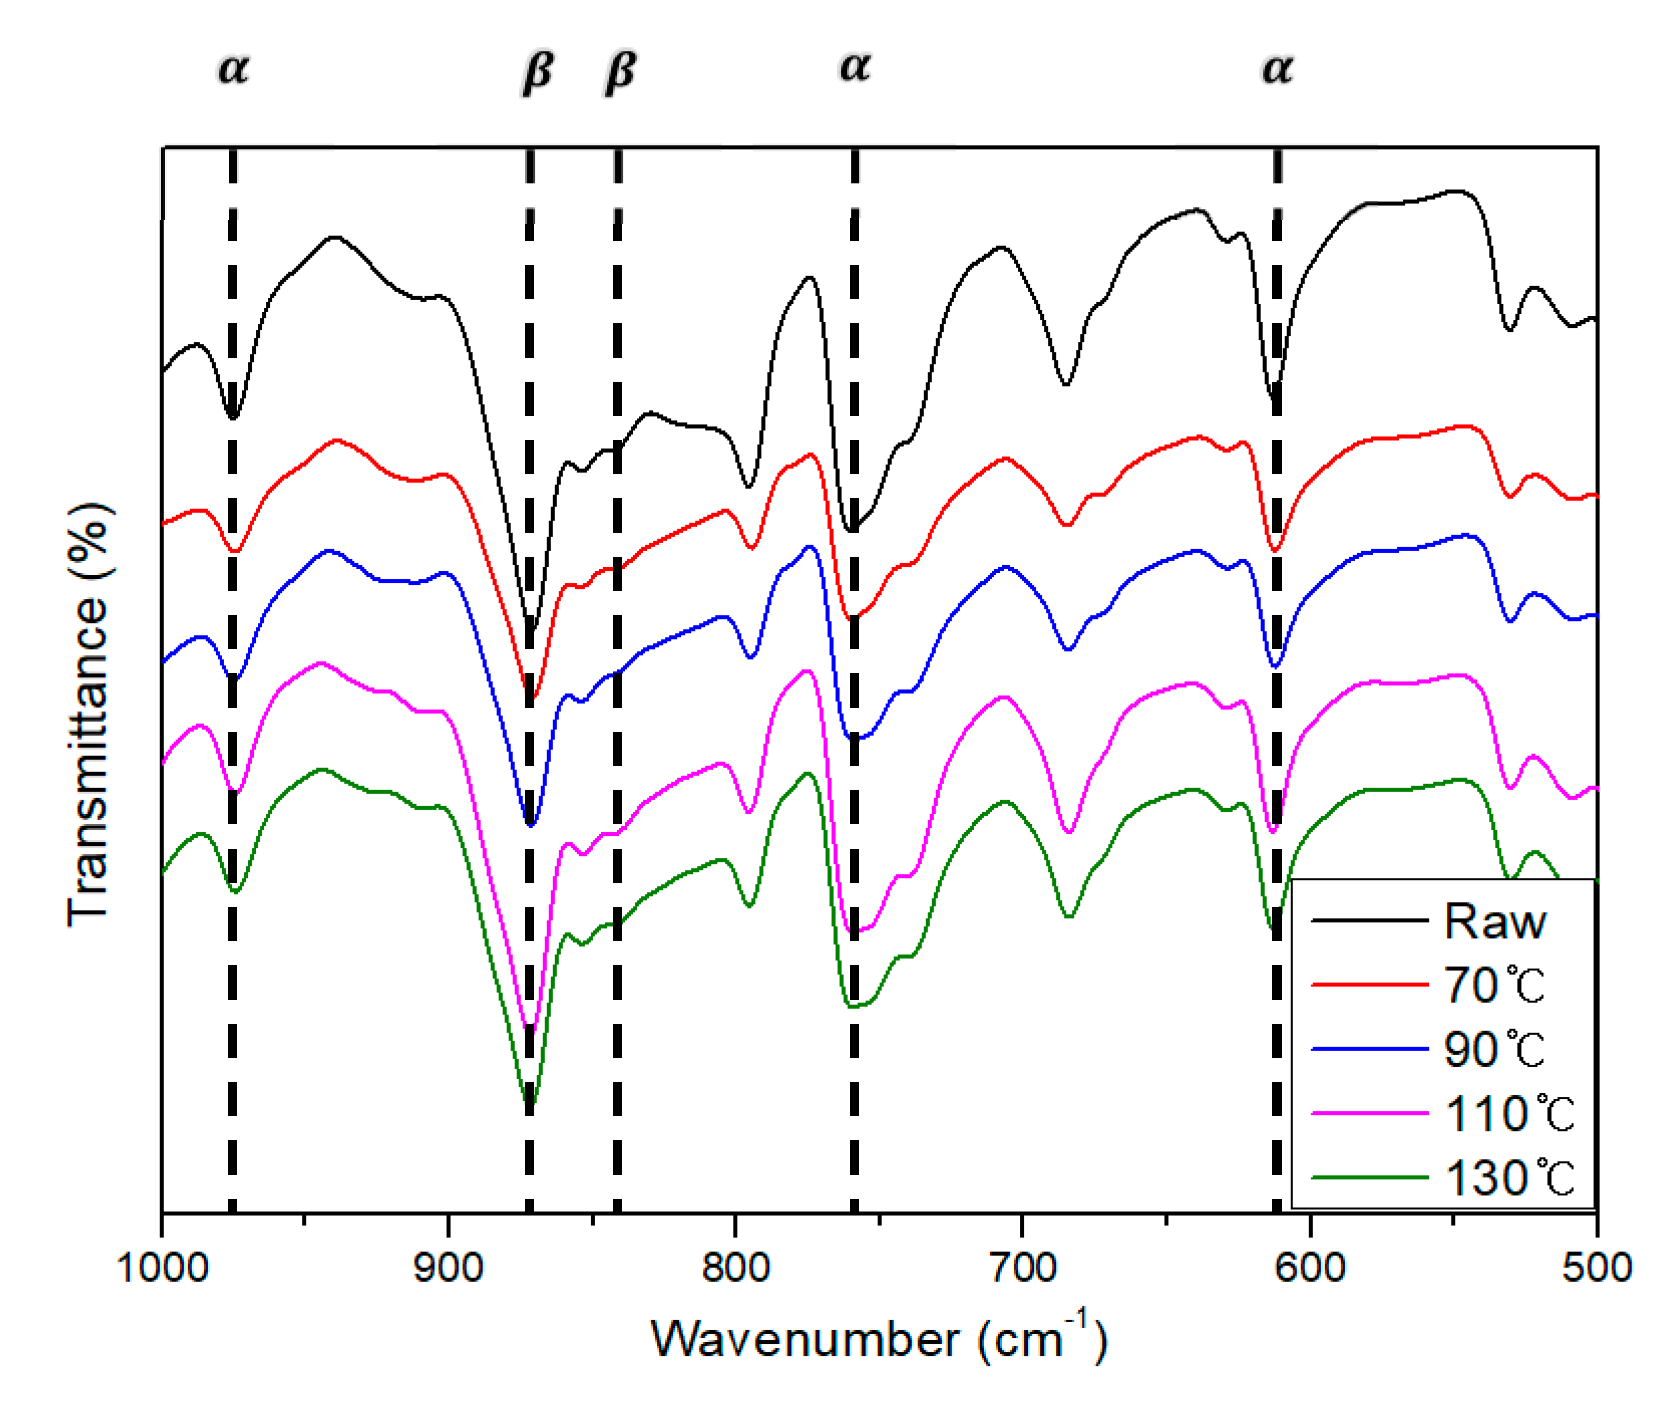
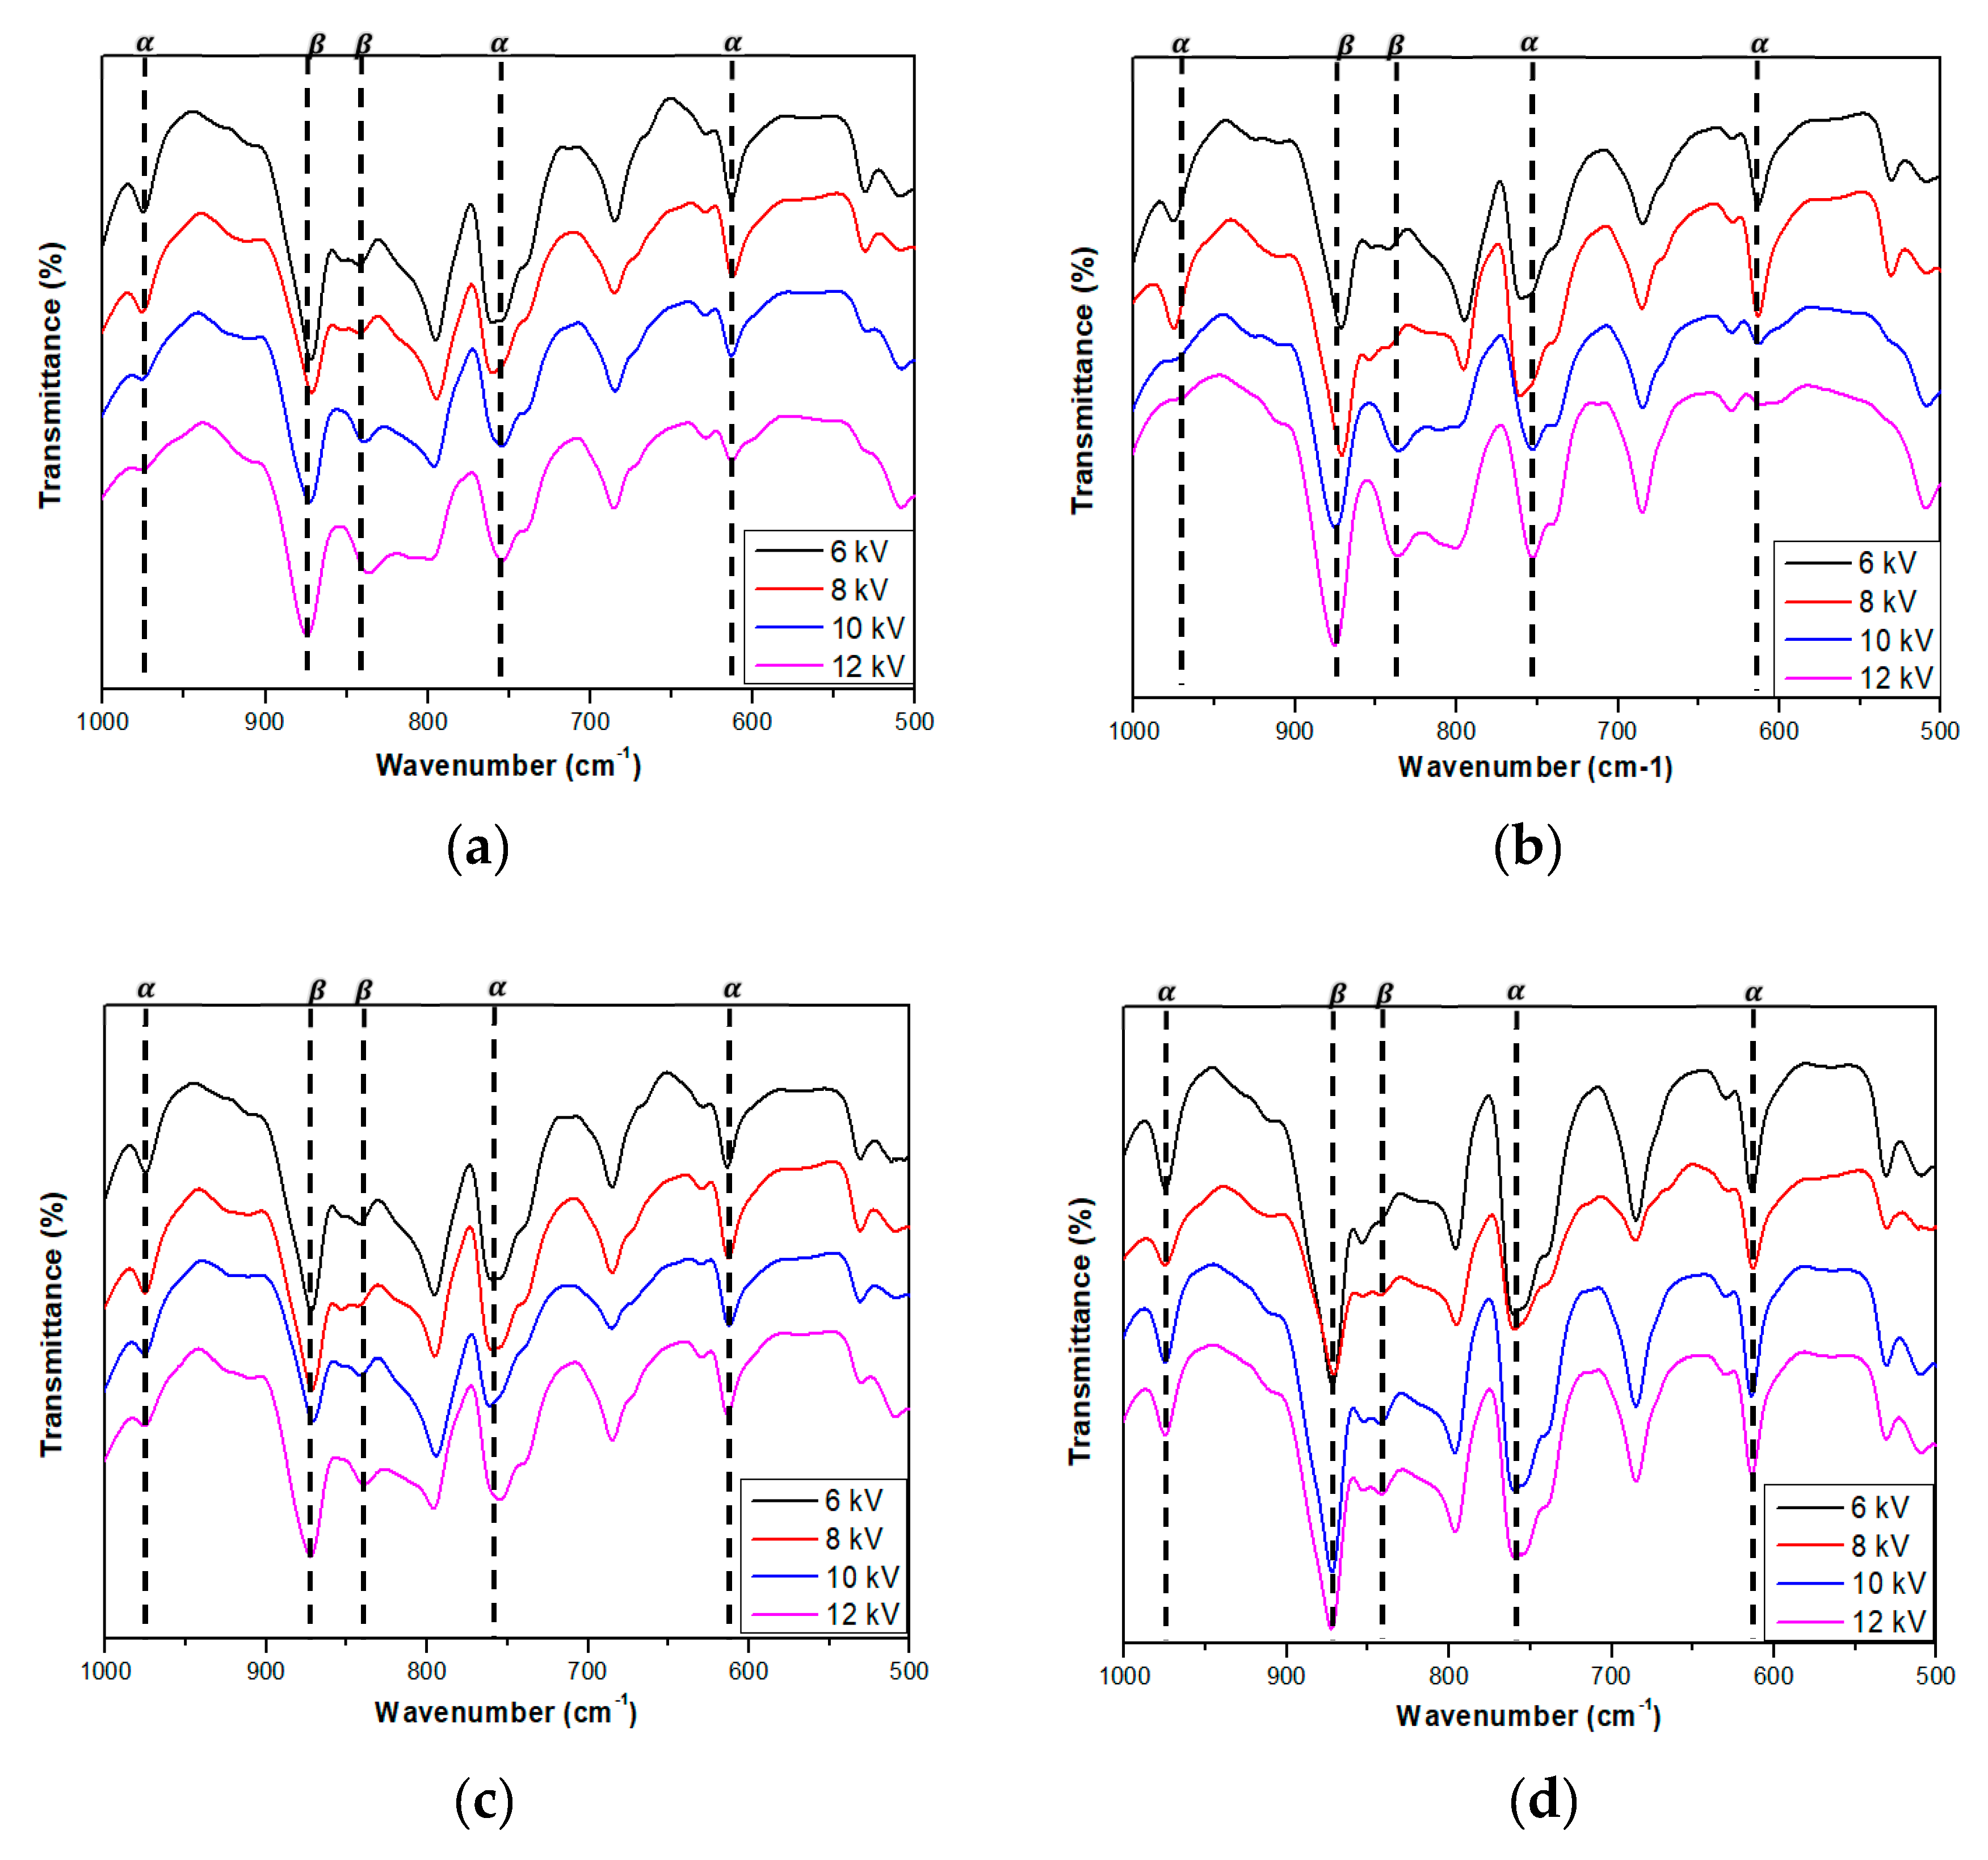
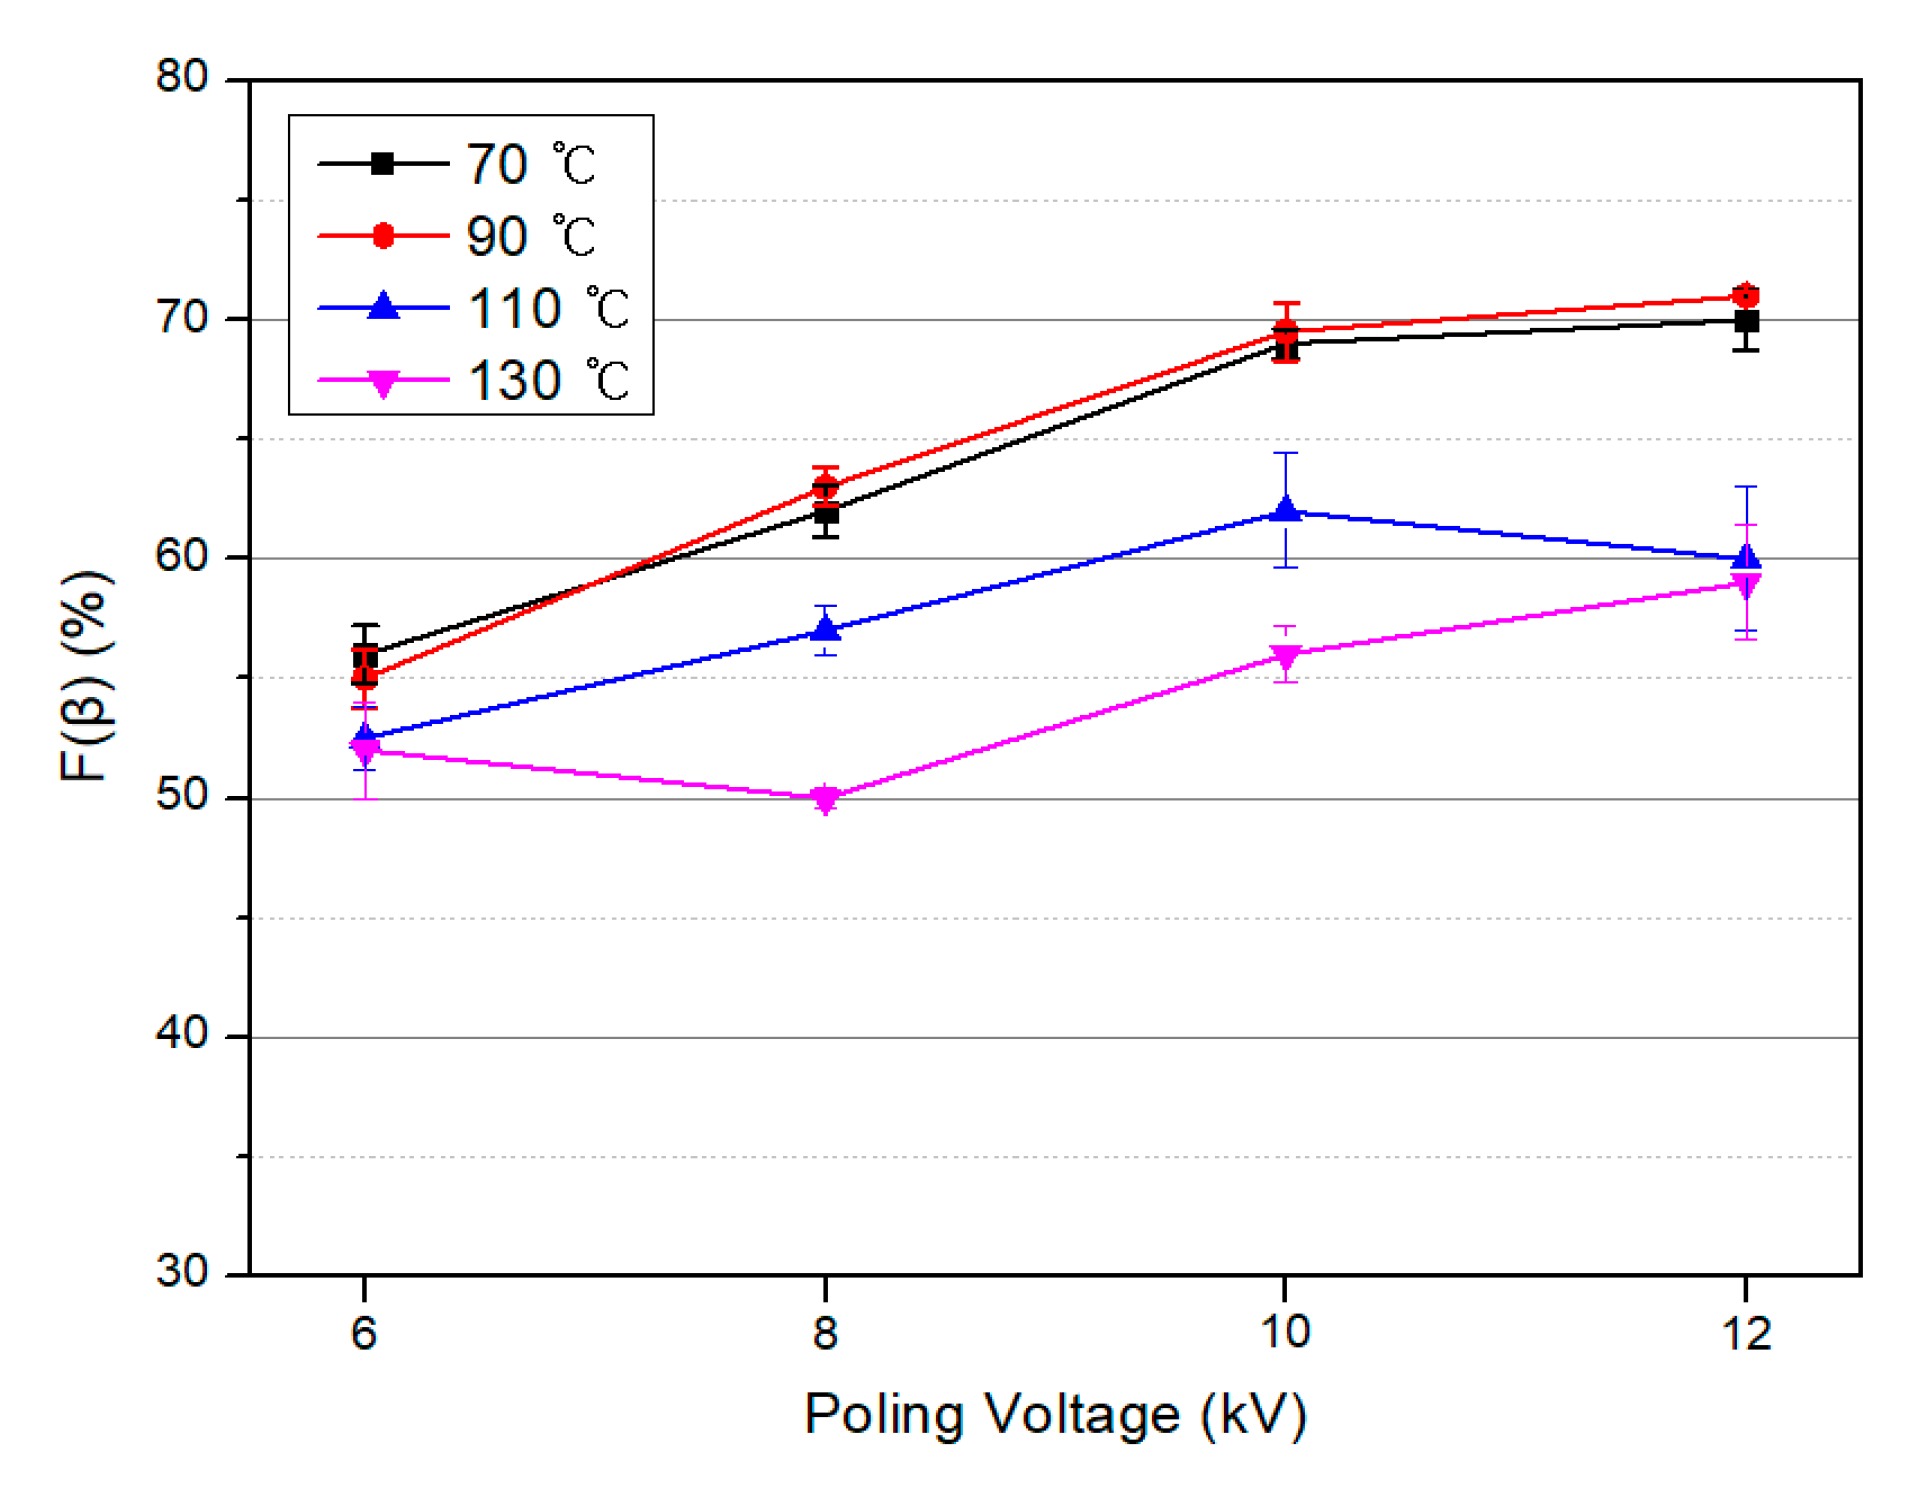
3.3.1. FT-IR Analysis
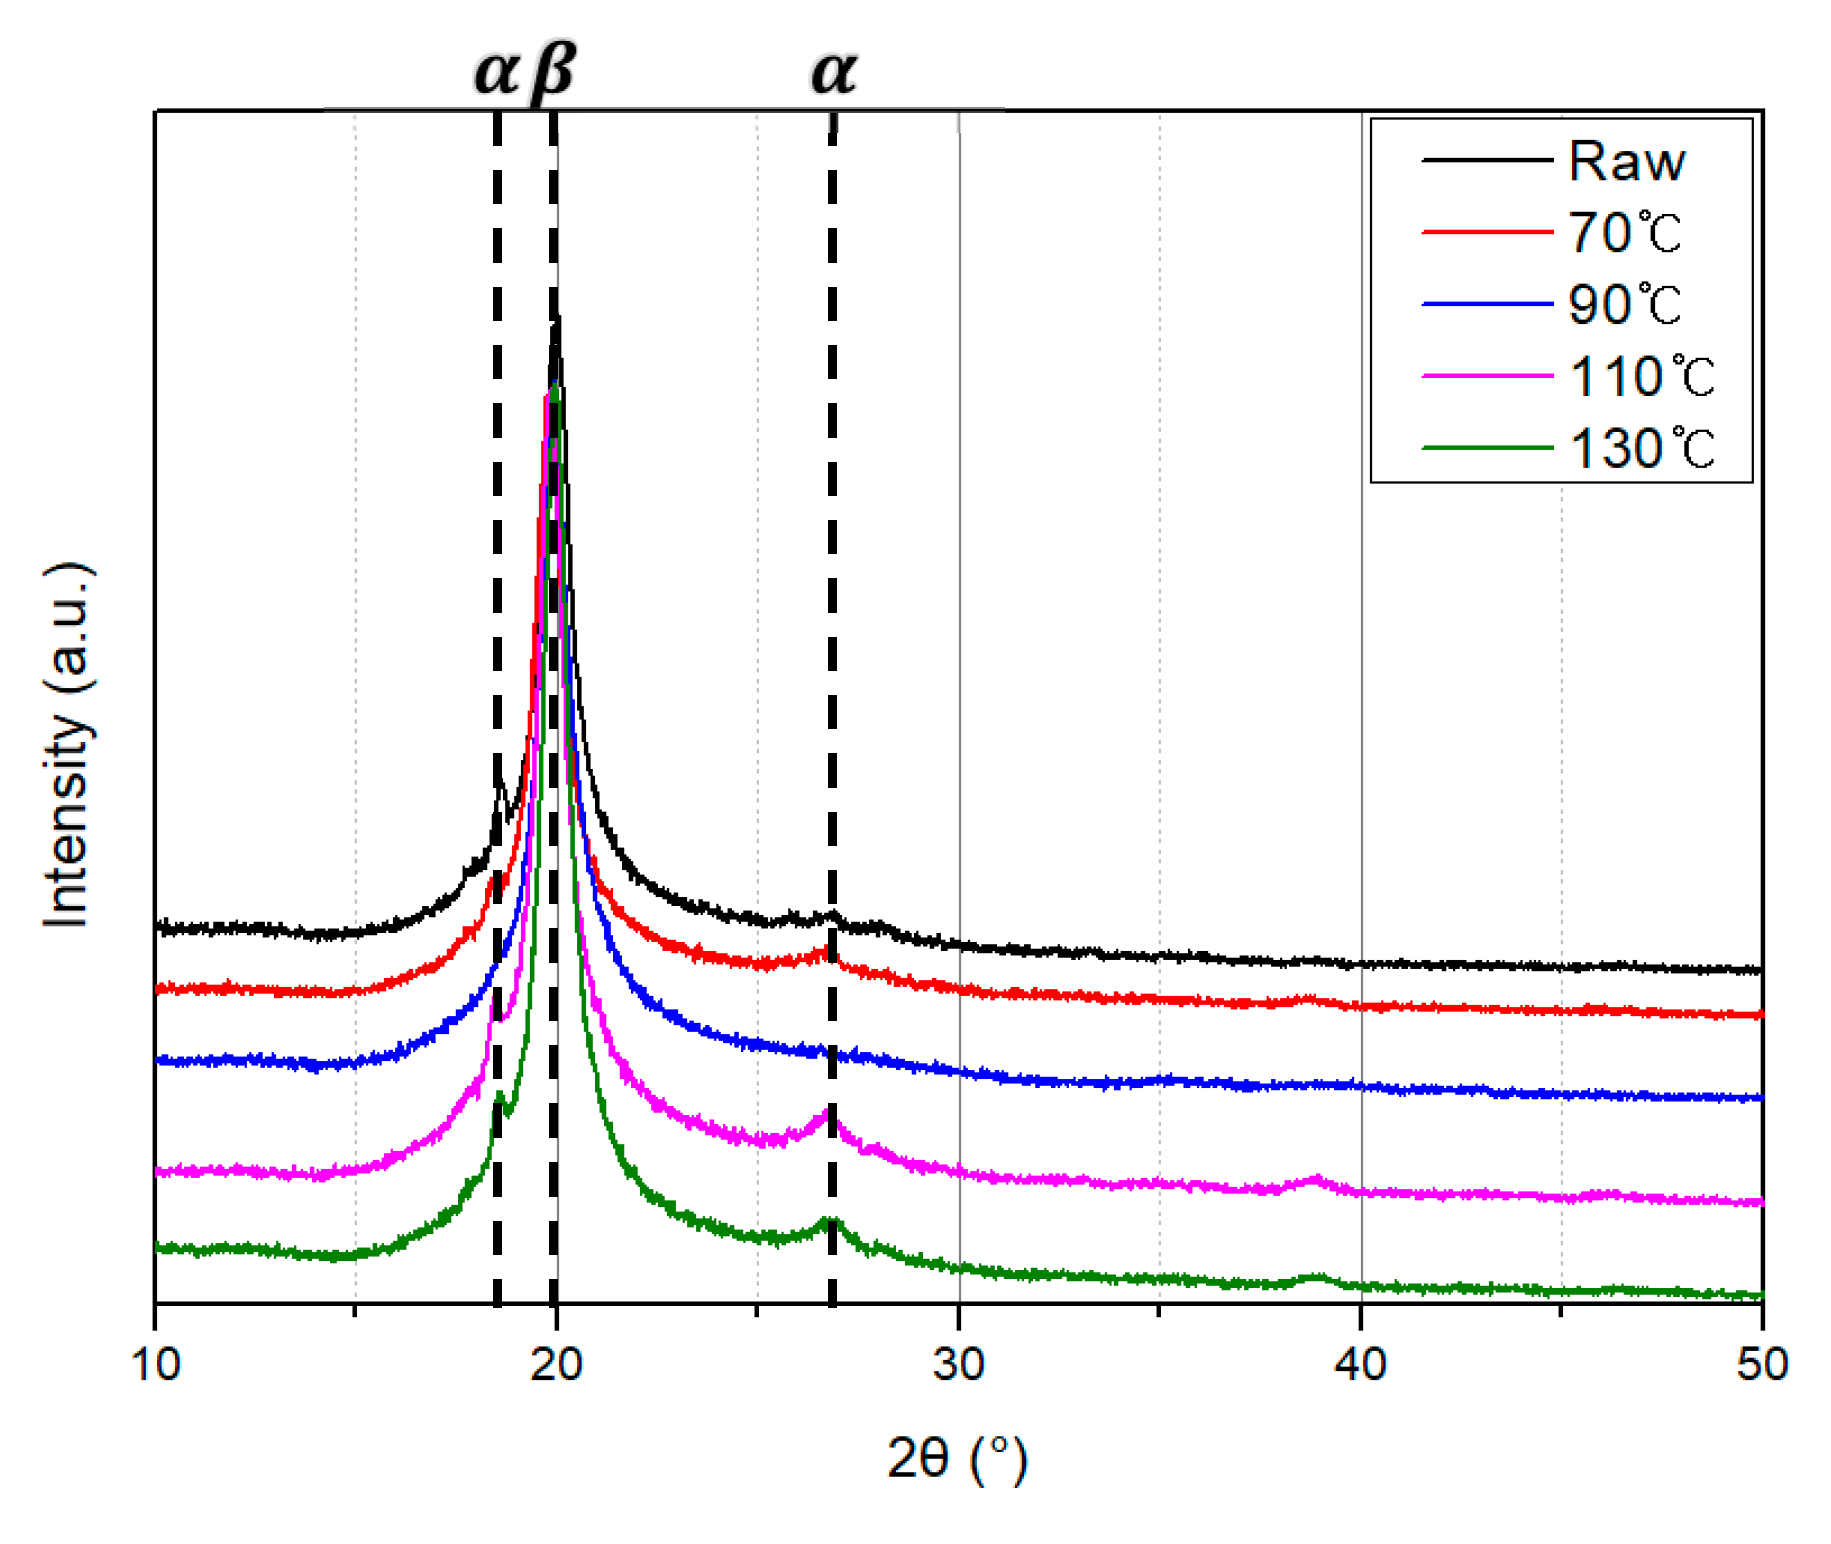
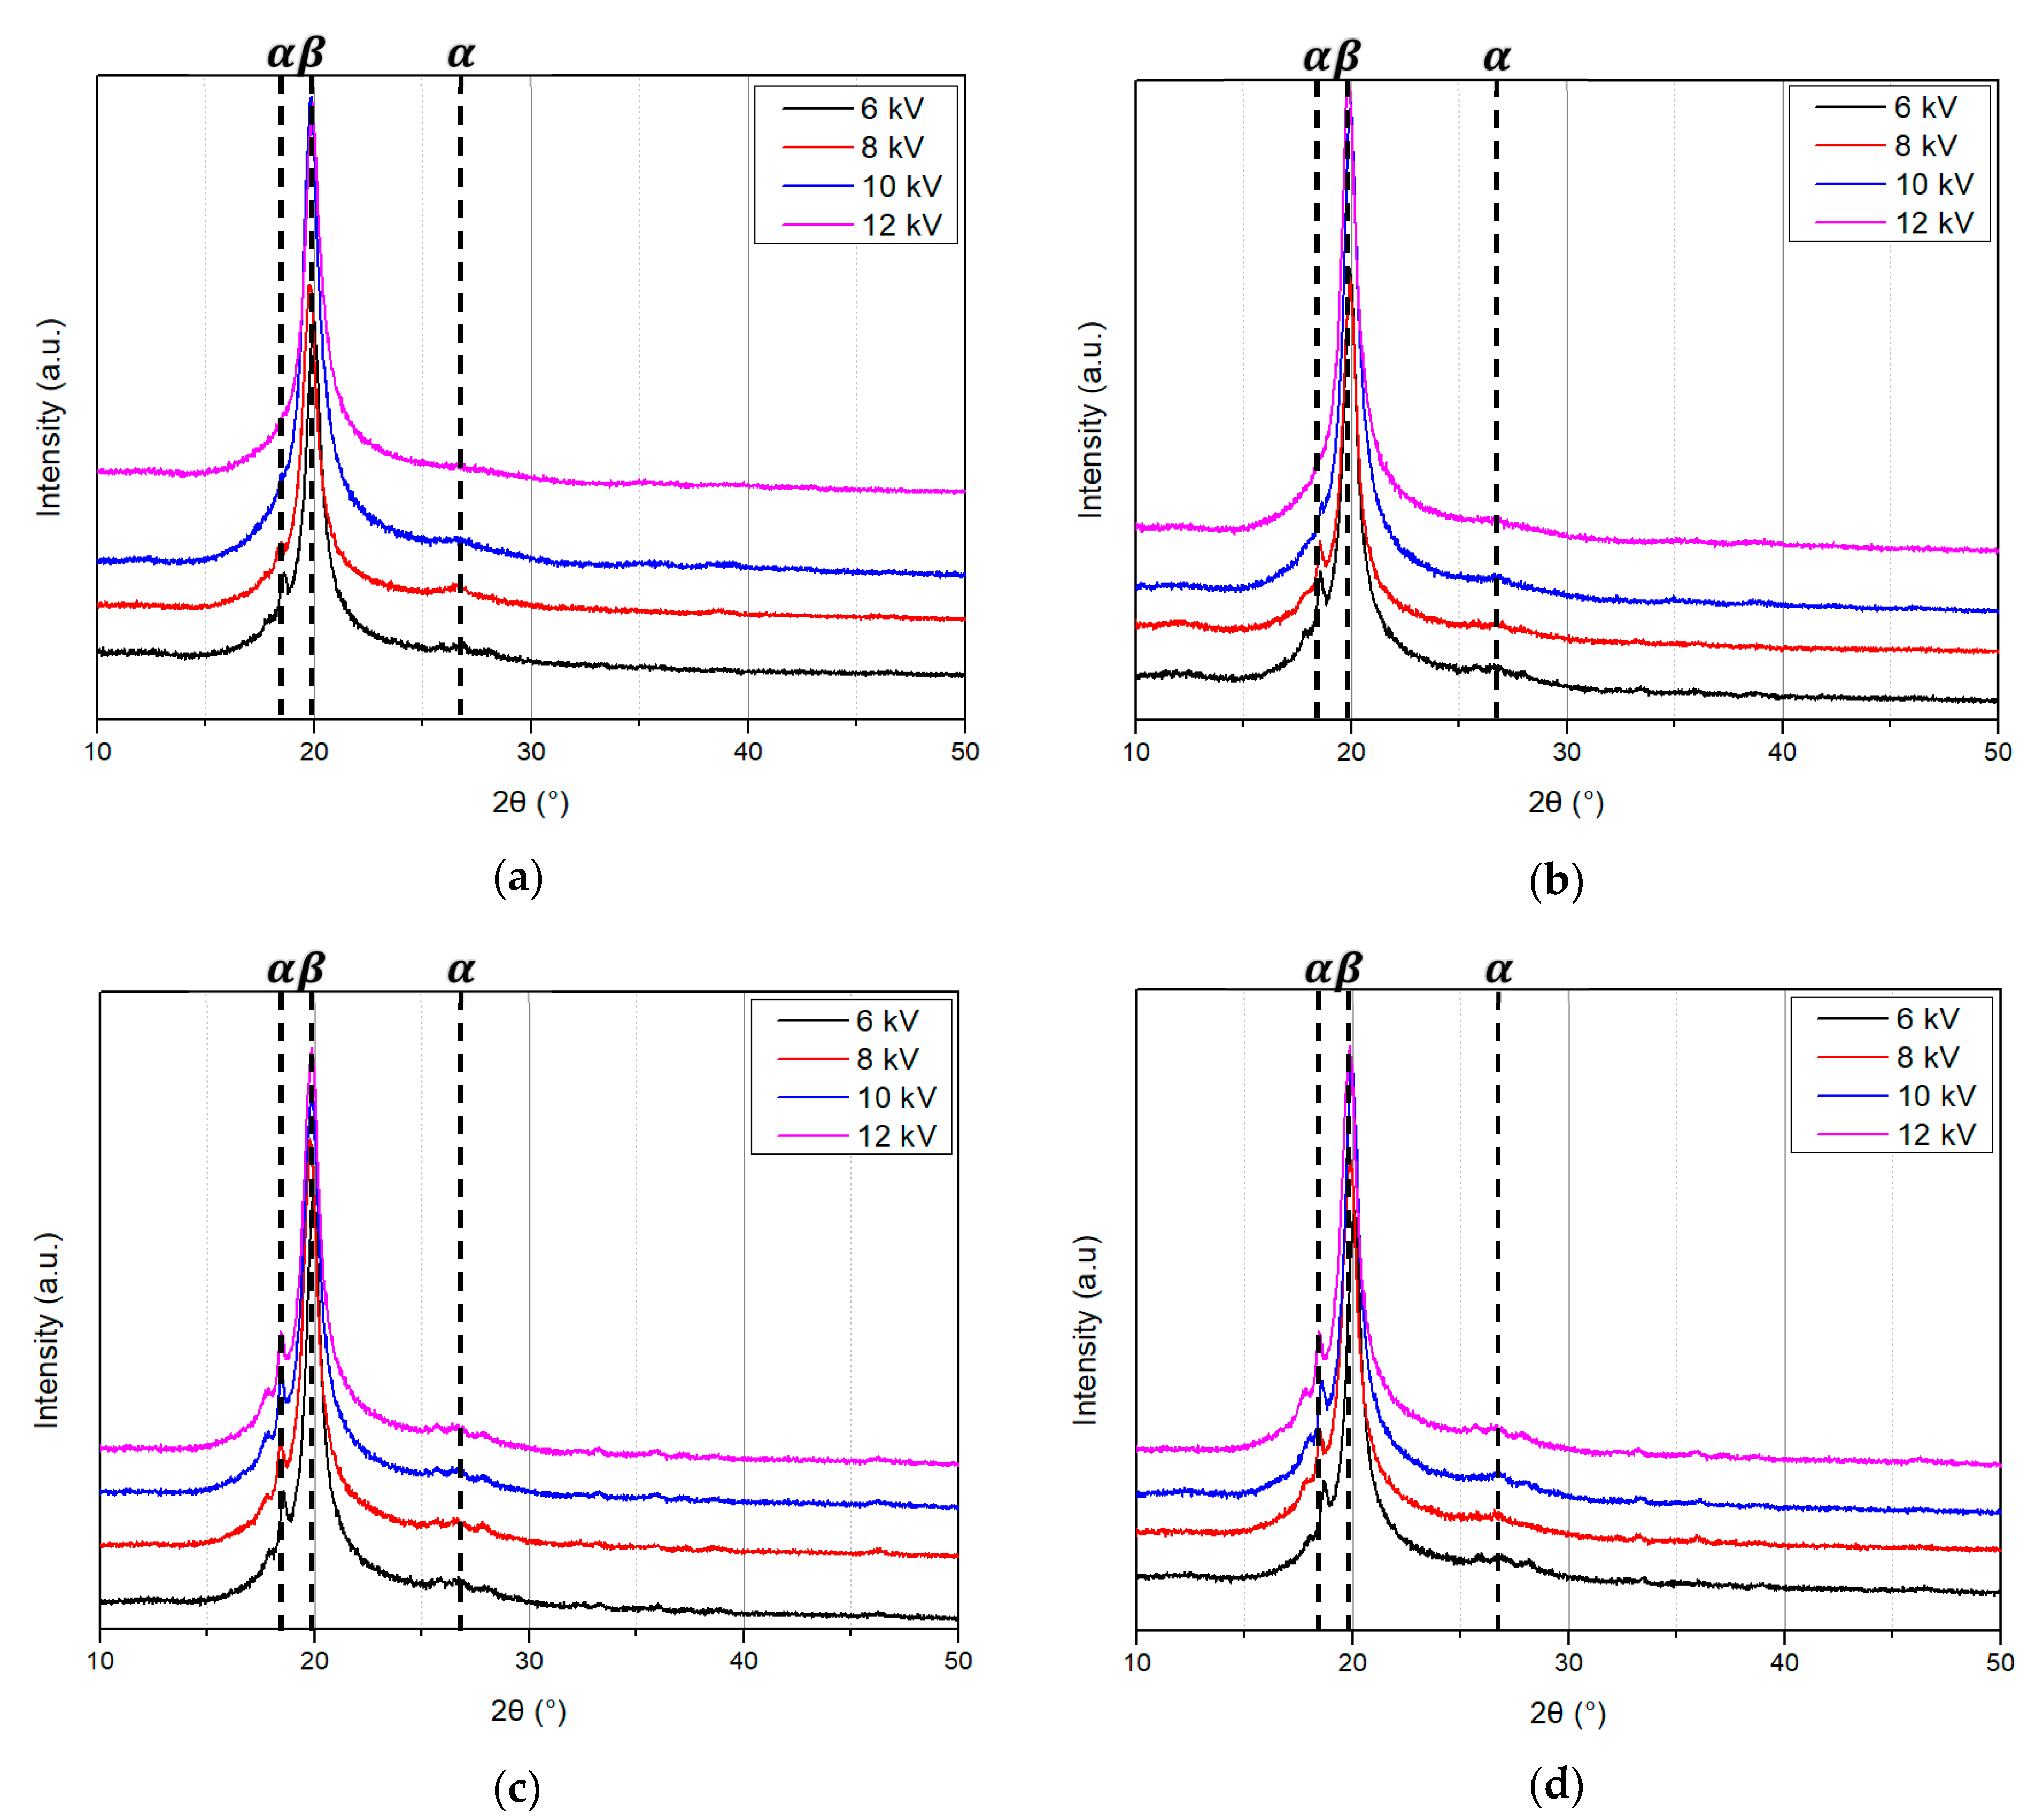
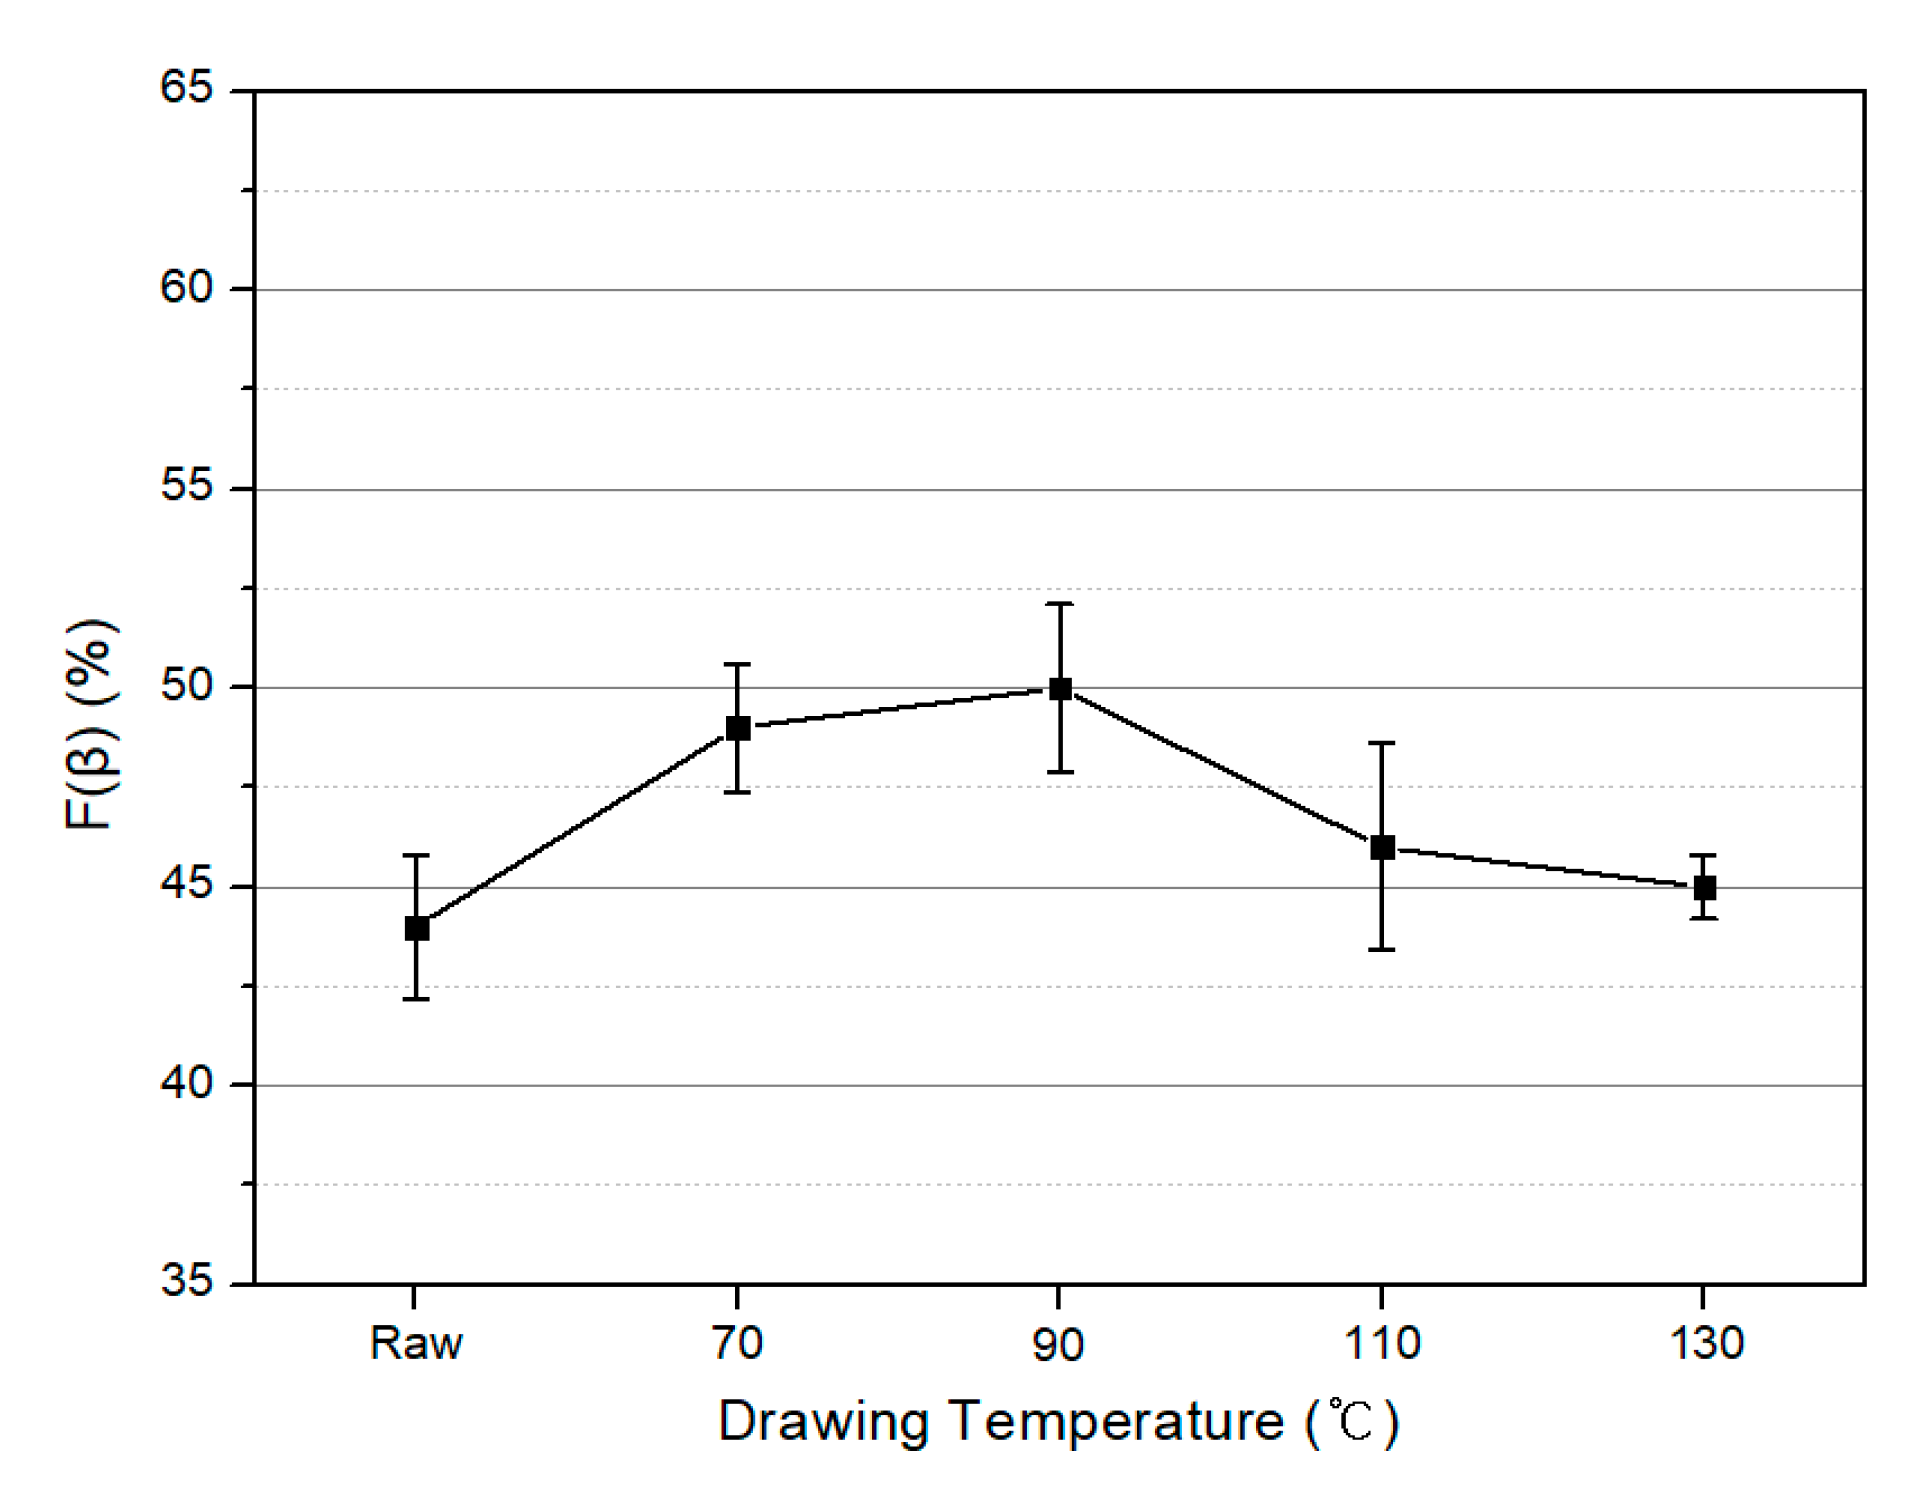
3.3.2. X-ray Diffraction (XRD) Analysis
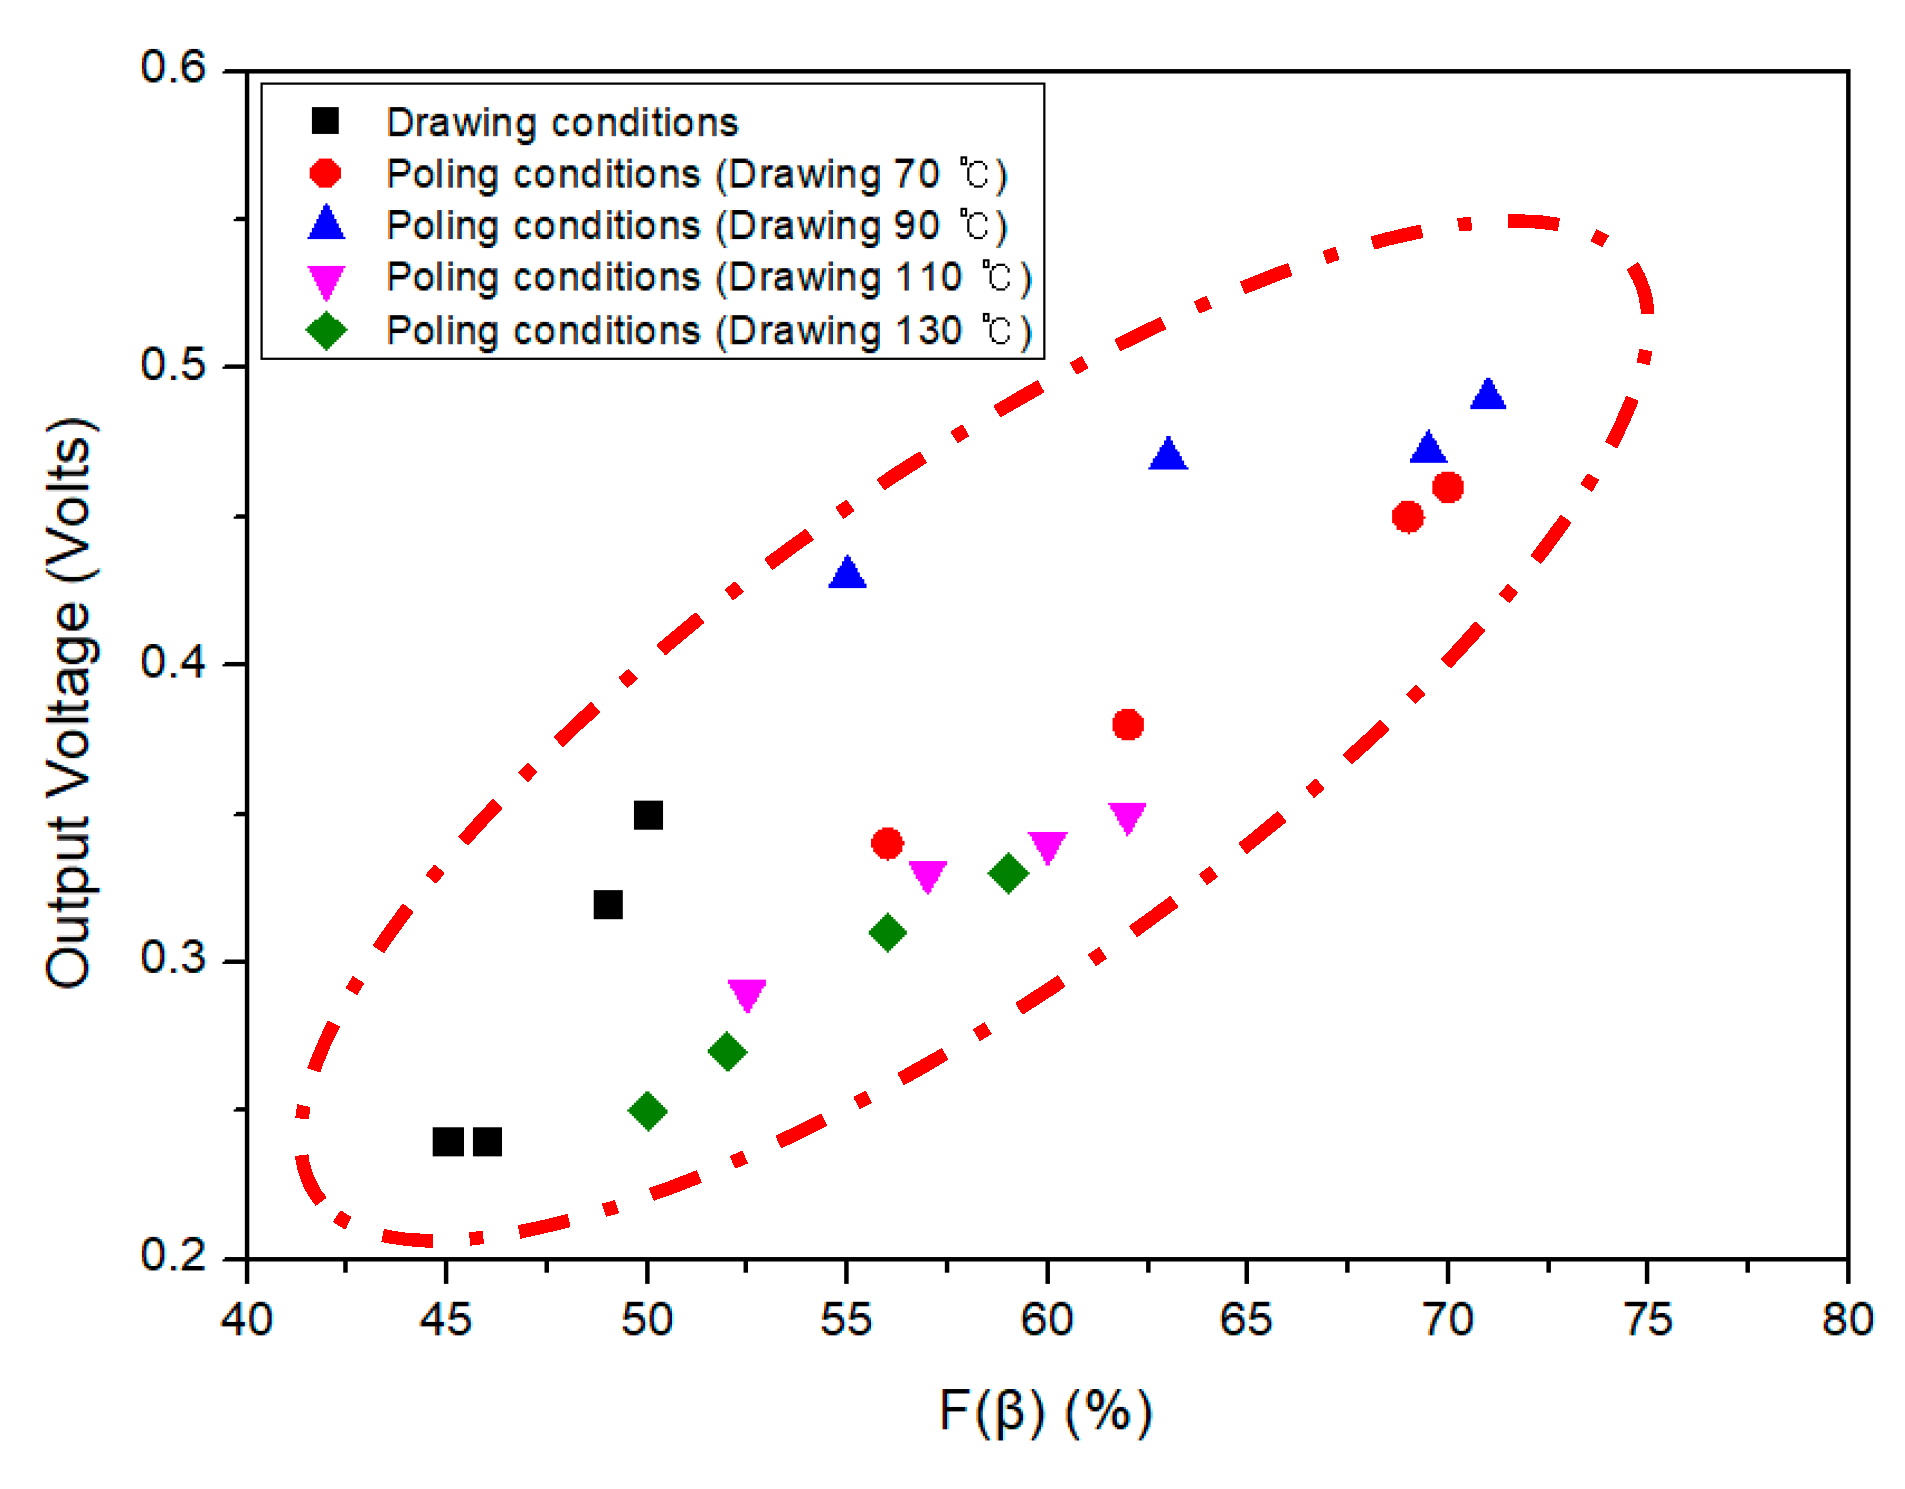
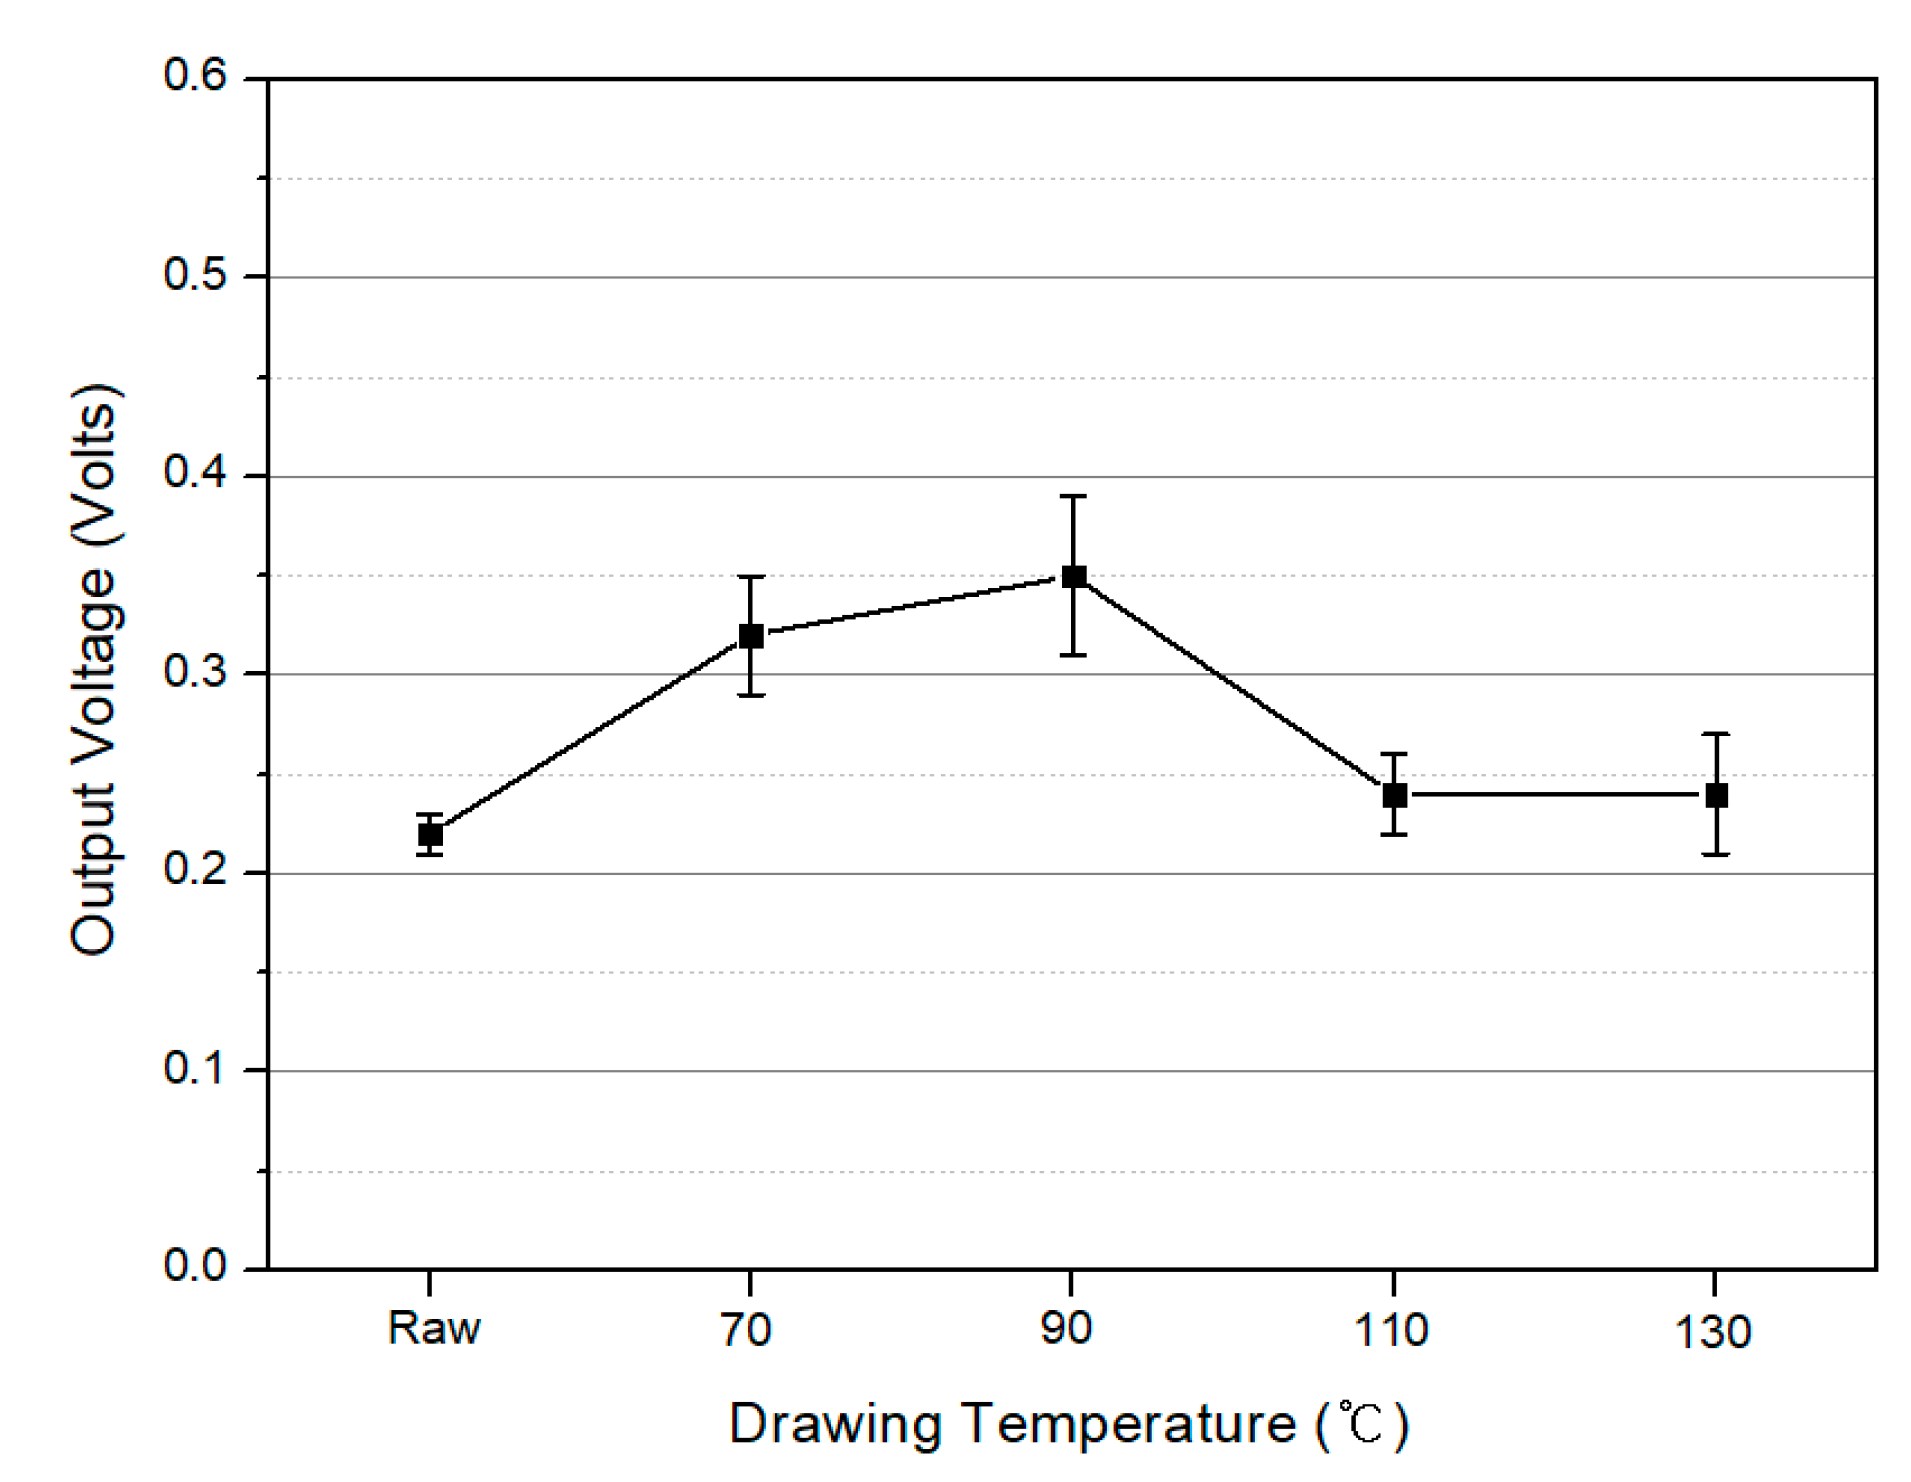
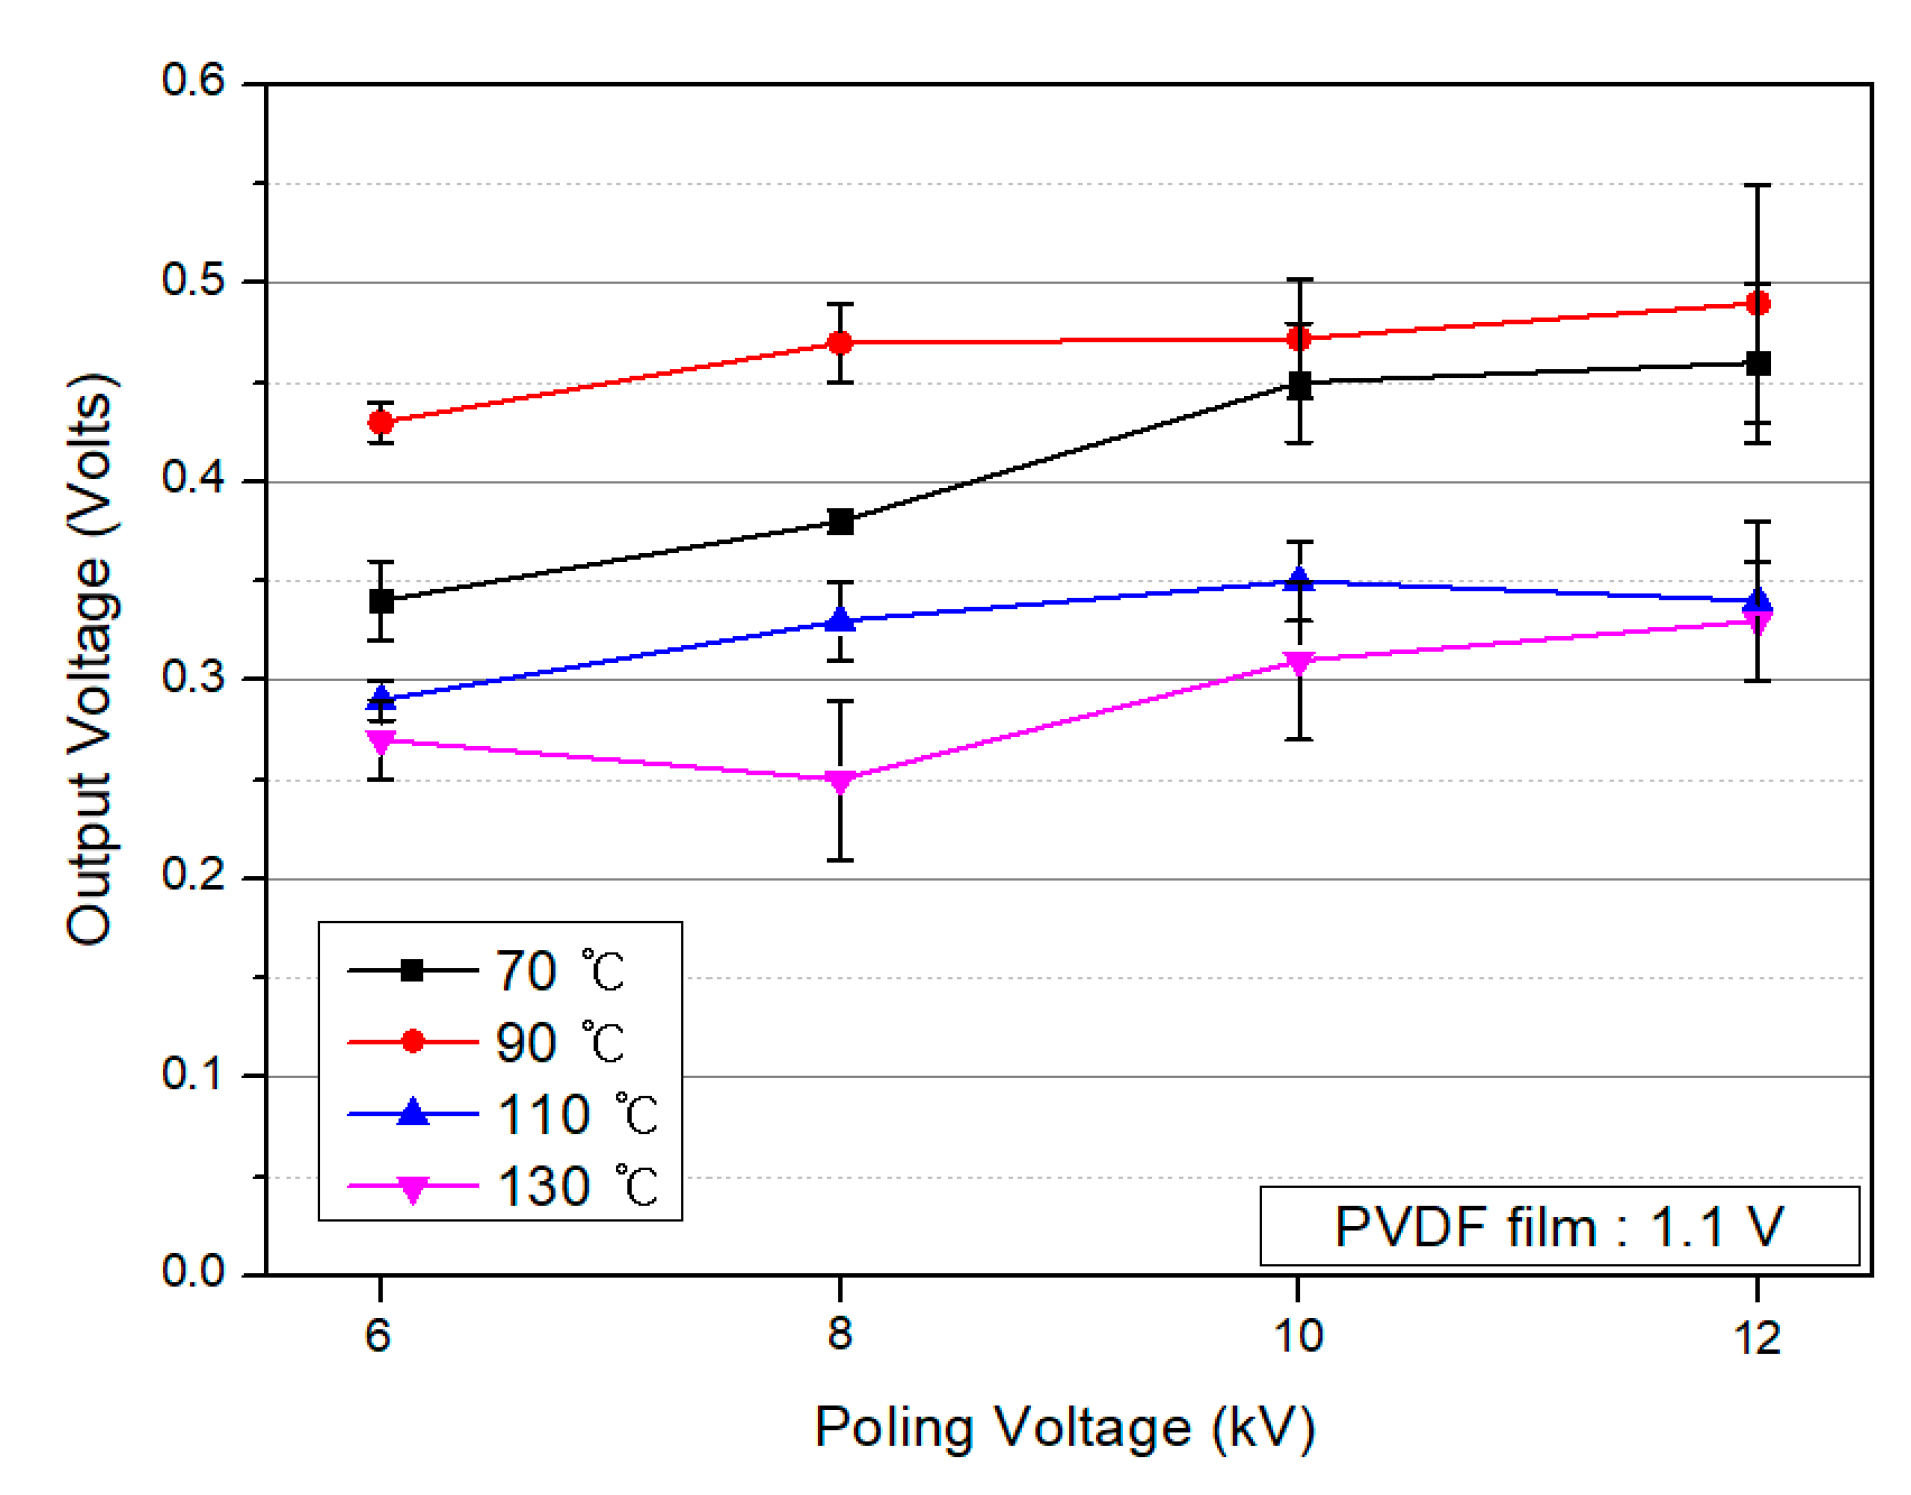
3.4. Piezoelectric Properties
4. Conclusions
Author Contributions
Acknowledgments
Conflicts of Interest
References
- Kawai, H. The piezoelectricity of poly(vinylidene fluoride). Jpn. J. Appl. Phys. 1969, 8, 975. [Google Scholar] [CrossRef]
- Broahurst, M.G.; Davis, G.T.; McKinney, J.E.; Collins, R.E. Piezoelectricity and pyroelectricity in poly (vinylidene fluoride)—A model. J. Appl. Phys. 1978, 49, 4992. [Google Scholar] [CrossRef]
- Tashiro, K. Crystal structure and phase transition of PVDF and related copolymers. Plast. Eng.-N. Y. 1995, 28, 63. [Google Scholar]
- Kamiya, T. Calculation of crystal structures, dielectric constants and piezoelectric properties of wurtzite-type crystals using ab-initio periodic Hartree-Fock method. Jpn. J. Appl. Phys. 1996, 35, 4421. [Google Scholar] [CrossRef]
- Nakagawa, K.; Ishida, Y. Piezoelectricity and pyroelectricity in poly(vinylidene fluoride)-a model. J. Appl. Phys. 1978, 49, 1976–2153. [Google Scholar]
- Choi, S.W.; Kim, J.R.; Ahn, Y.R.; Jo, S.M.; Cairns, E.J. Characterization of electrospun PVDF fiber based polymer electrolytes. Chem. Mater. 2007, 19, 104–115. [Google Scholar] [CrossRef]
- Gregorio, R. Determination of the α, β, and γ crystalline phases of poly (vinylidene fluoride) films prepared at different conditions. J. Appl. Polym. Sci. 2006, 100, 3272–3279. [Google Scholar] [CrossRef]
- Shirinov, A.V.; Schomburg, W.K. Pressure sensor form a PVDF film. Sens. Actuators 2008, 142, 48–55. [Google Scholar] [CrossRef]
- Mohammadi, B.; Yousefi, A.A.; Bellah, S.M. Effect of tensile strain rate and elongation on crystalline structure and piezoelectric properties of PVDF thin films. Polym. Test. 2007, 26, 42–50. [Google Scholar] [CrossRef]
- Lan, W.; Zhi-Min, D. Carbon nanotube composites with high dielectric constant at low percolation threshold. Appl. Phys. Lett. 2005, 87, 042903. [Google Scholar]
- Menczel, J.D.; Collins, G.L.; Saw, S.K. Thermal analysis of Vectran fibers and films. J. Therm. Anal. 1998, 49, 201–208. [Google Scholar] [CrossRef]
- Sun, L.M.; Sakoda, T.; Ueta, S.; Koga, K.; Takayanagi, M. Additive effects on thermotropic liquid crystal polymer alloys III. Effect of third component of thermotropic liquid crystal polymer on mechanical properties of blends of ekonol and polyarylate. J. Polym. 1994, 26, 961–966. [Google Scholar] [CrossRef]
- Ju, M.; Chen, M.; Chang, F. Morphologies and mechanical properties of polyarylate/liquid crystalline polymer blends compatibilized by a multifunctional epoxy resin. Macromol. Chem. Phys. 2000, 201, 2298–2308. [Google Scholar] [CrossRef]
- kodokian, G.K.A.; Kinloch, A.J. Surface pretreatment and adhesion of thermoplastic fibre-composites. J. Mater. Sci. Lett. 1988, 7, 625–627. [Google Scholar] [CrossRef]
- Farley, G.L.; Jones, R.M. Crushing characteristics of continuous fiber-reinforced composite tubes. J. Mater. Sci. Lett. 1992, 26, 37–50. [Google Scholar] [CrossRef]
- Blanco, I.; Bottino, F.A. Synthesis, thermal behavior, and kinetics of degradation of alkyl hepta cyclopentyl polyhedral oligomeric silsesquioxanes/polysterene nanocomposites. J. Thermoplast. Compos. Mater. 2018, 31, 913–924. [Google Scholar] [CrossRef]
- Ye, Y.; Jiang, Y.; Wu, Z.; Zeng, H.; Yang, Y.; Li, W. Characterization and Ferroelectric Properties of Electric Poled PVDF Films. Int. Symp. Eletrets 2005, ISE-12, 132–135. [Google Scholar]
- Wang, Y.; Cakmak, M.; White, J.L. Structure Development in Melt Spinning Poly (Vinylidene Fluoride) Fiber and Tapes. J. Appl. Polym. Sci. 1985, 30, 2615. [Google Scholar] [CrossRef]
- Salmi, A.; Yousefi, A.A. FT-IR studies of β-phase crystal formation in stretched PVDF films. Polym. Test. 2003, 22, 699. [Google Scholar]
- Cardoso, V.F.; Minas, G.; Lanceros-Méndez, S. Multilayer spin-coating deposition of poly(vinylidene fluoride) films for controlling thickness and piezoelectric response. Sens. Actuators A Phys. 2013, 192, 76–80. [Google Scholar] [CrossRef]
- Ribeiro, C.; Correia, D.M.; Ribeiro, S.; Sencadas, V.; Botelho, G.; Lanceros-Méndez, S. Piezoelectric poly (vinylidene fluoride) microstructure and poling state in active tissue engineering. Eng. Life Sci. 2015, 15, 351–356. [Google Scholar] [CrossRef]


| Spinning Conditions | |
|---|---|
| Sea component | PVDF (Poly(vinylidene fluoride)) |
| Island component | PAR (Polyarylate) |
| Sea/island ratio | 50:50 wt % |
| Winding speed | 650 m/min |
© 2018 by the authors. Licensee MDPI, Basel, Switzerland. This article is an open access article distributed under the terms and conditions of the Creative Commons Attribution (CC BY) license (http://creativecommons.org/licenses/by/4.0/).
Share and Cite
Oh, W.J.; Lim, H.S.; Won, J.S.; Lee, S.G. Preparation of PVDF/PAR Composites with Piezoelectric Properties by Post-Treatment. Polymers 2018, 10, 1333. https://doi.org/10.3390/polym10121333
Oh WJ, Lim HS, Won JS, Lee SG. Preparation of PVDF/PAR Composites with Piezoelectric Properties by Post-Treatment. Polymers. 2018; 10(12):1333. https://doi.org/10.3390/polym10121333
Chicago/Turabian StyleOh, Woo Jin, Hyeon Soo Lim, Jong Sung Won, and Seung Goo Lee. 2018. "Preparation of PVDF/PAR Composites with Piezoelectric Properties by Post-Treatment" Polymers 10, no. 12: 1333. https://doi.org/10.3390/polym10121333
APA StyleOh, W. J., Lim, H. S., Won, J. S., & Lee, S. G. (2018). Preparation of PVDF/PAR Composites with Piezoelectric Properties by Post-Treatment. Polymers, 10(12), 1333. https://doi.org/10.3390/polym10121333