Influence of Processing Parameters on Tensile Properties of SLS Polymer Product


Abstract
1. Introduction
- ED
- energy density, J/mm2
- P
- laser power, W
- v
- laser beam speed, mm/s
- h
- scan spacing, hatch distance, mm
- d
- laser beam diameter, mm
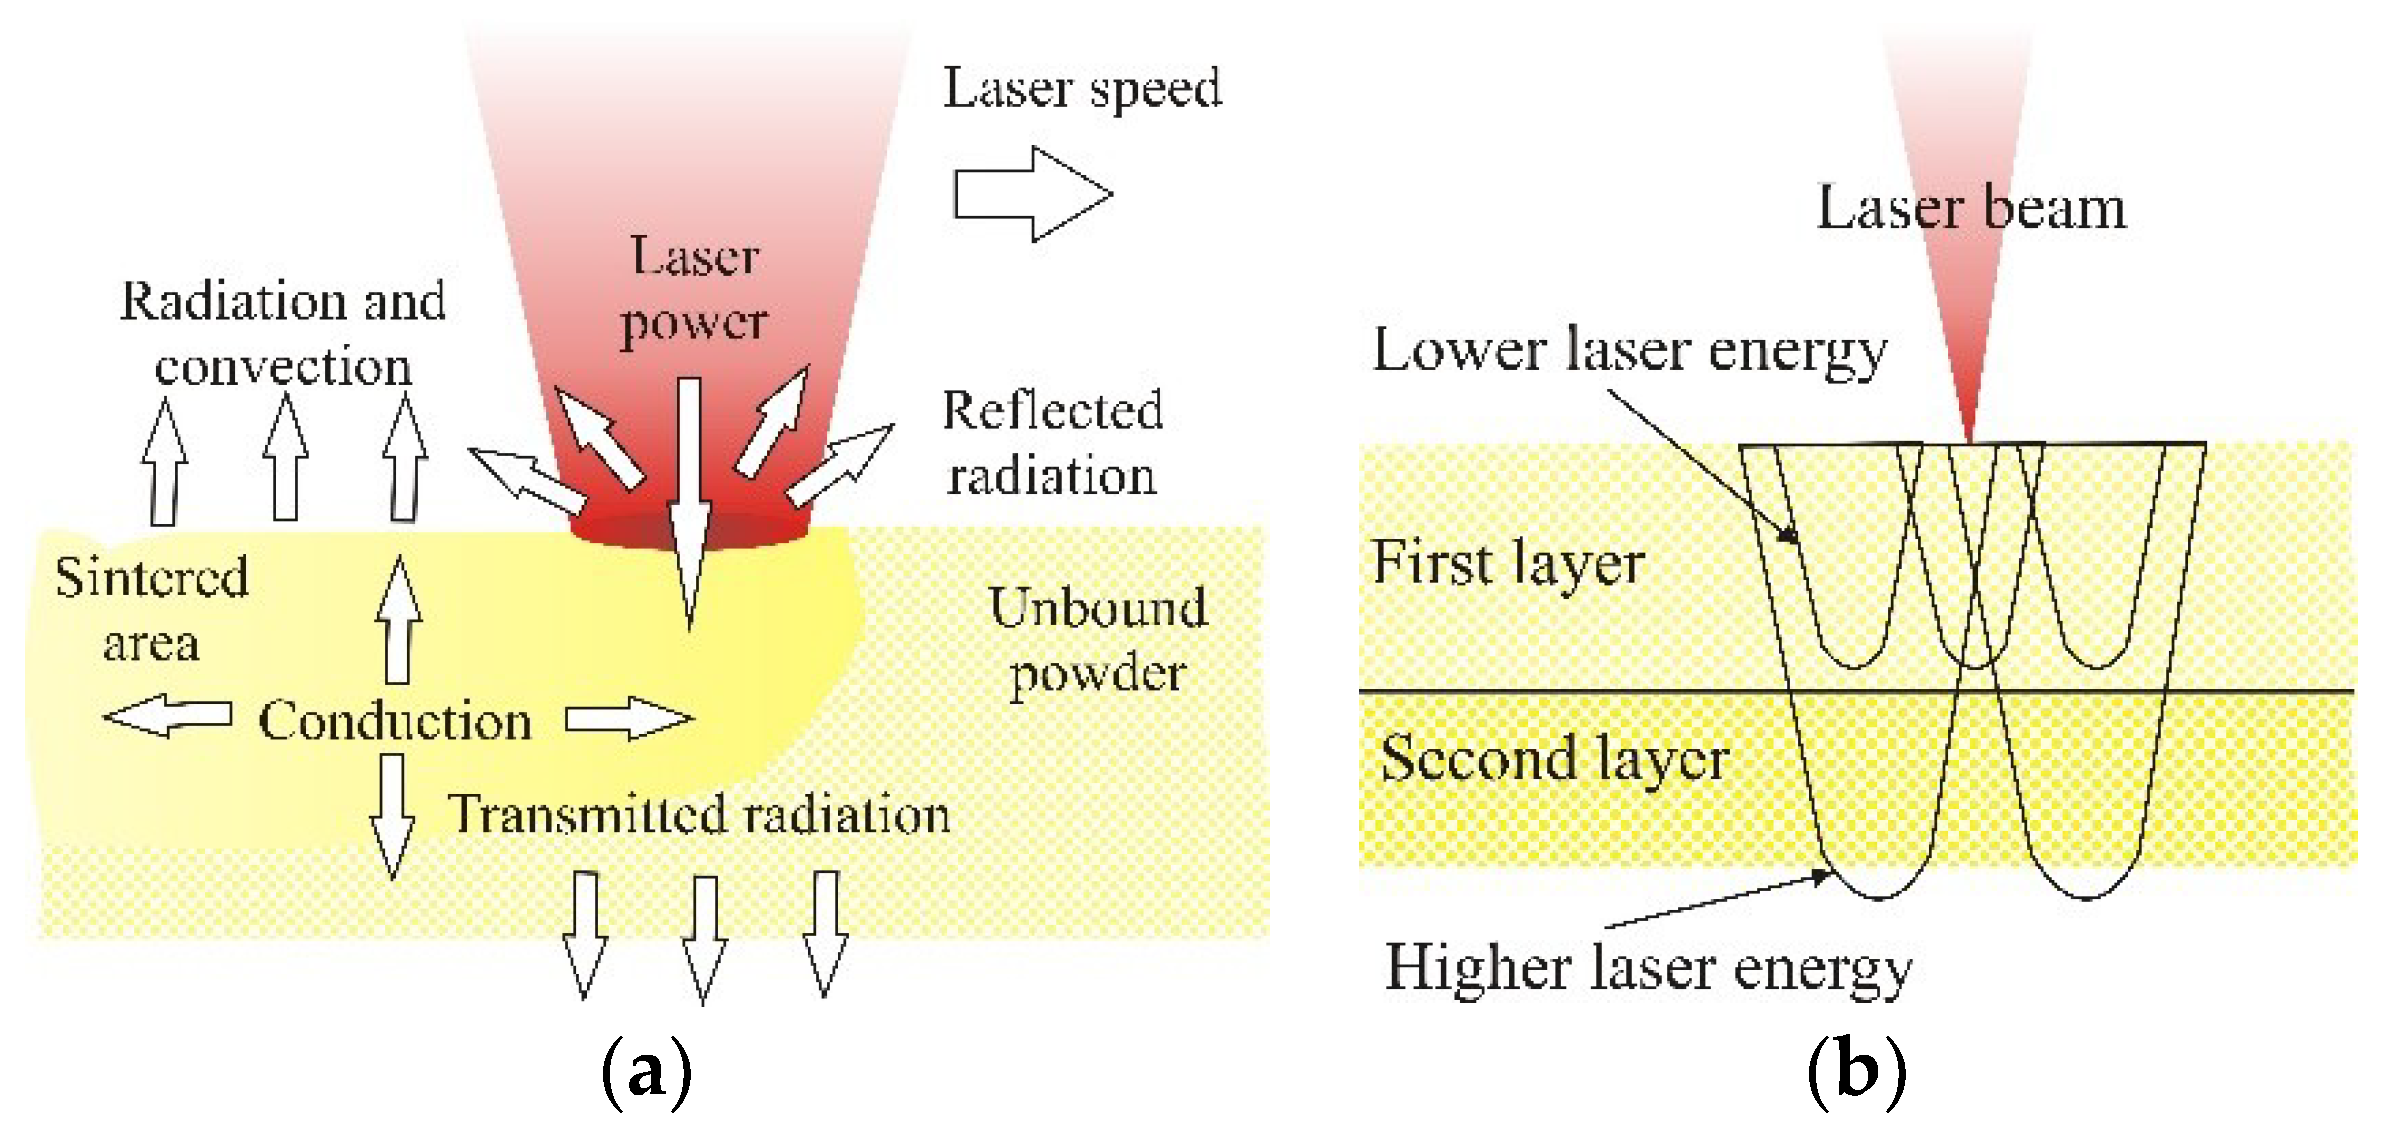
2. SLS
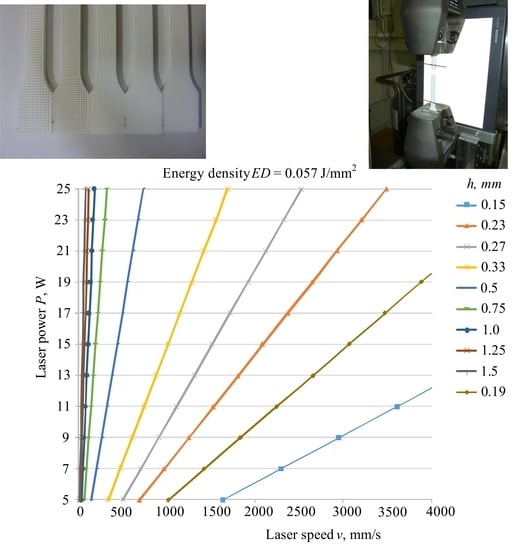
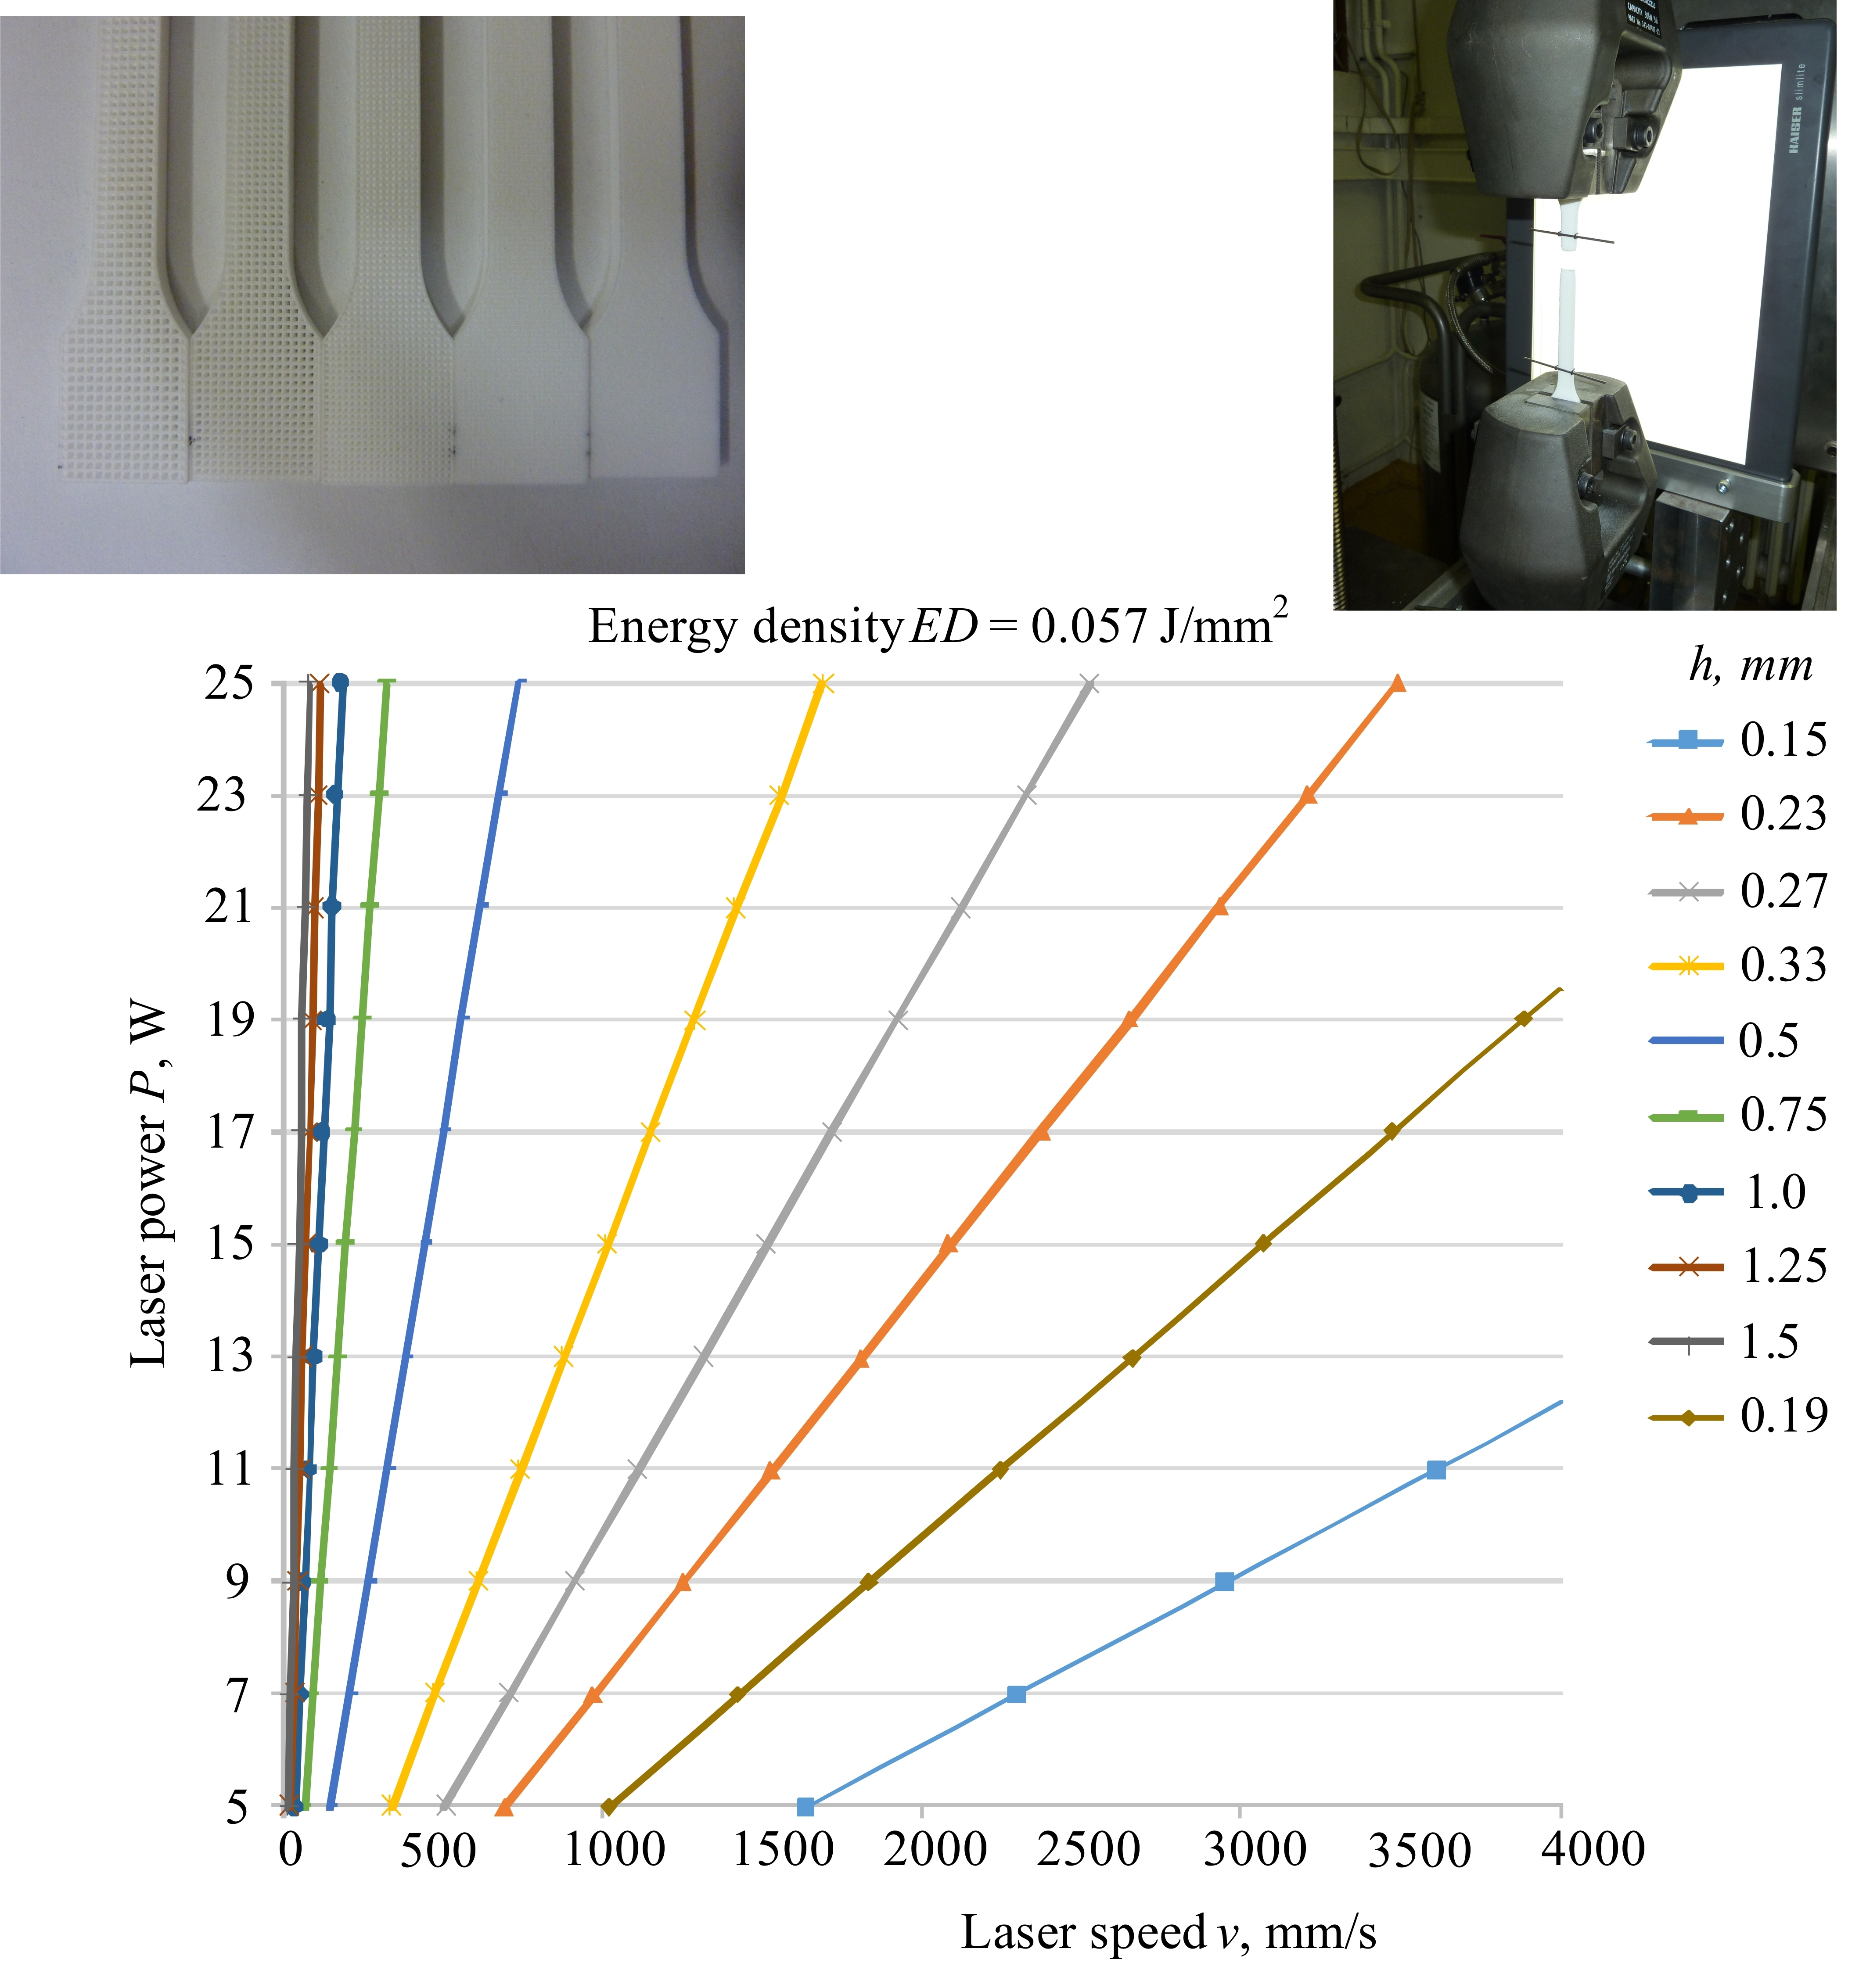
3. New Equation for Determining Energy Density in SLS
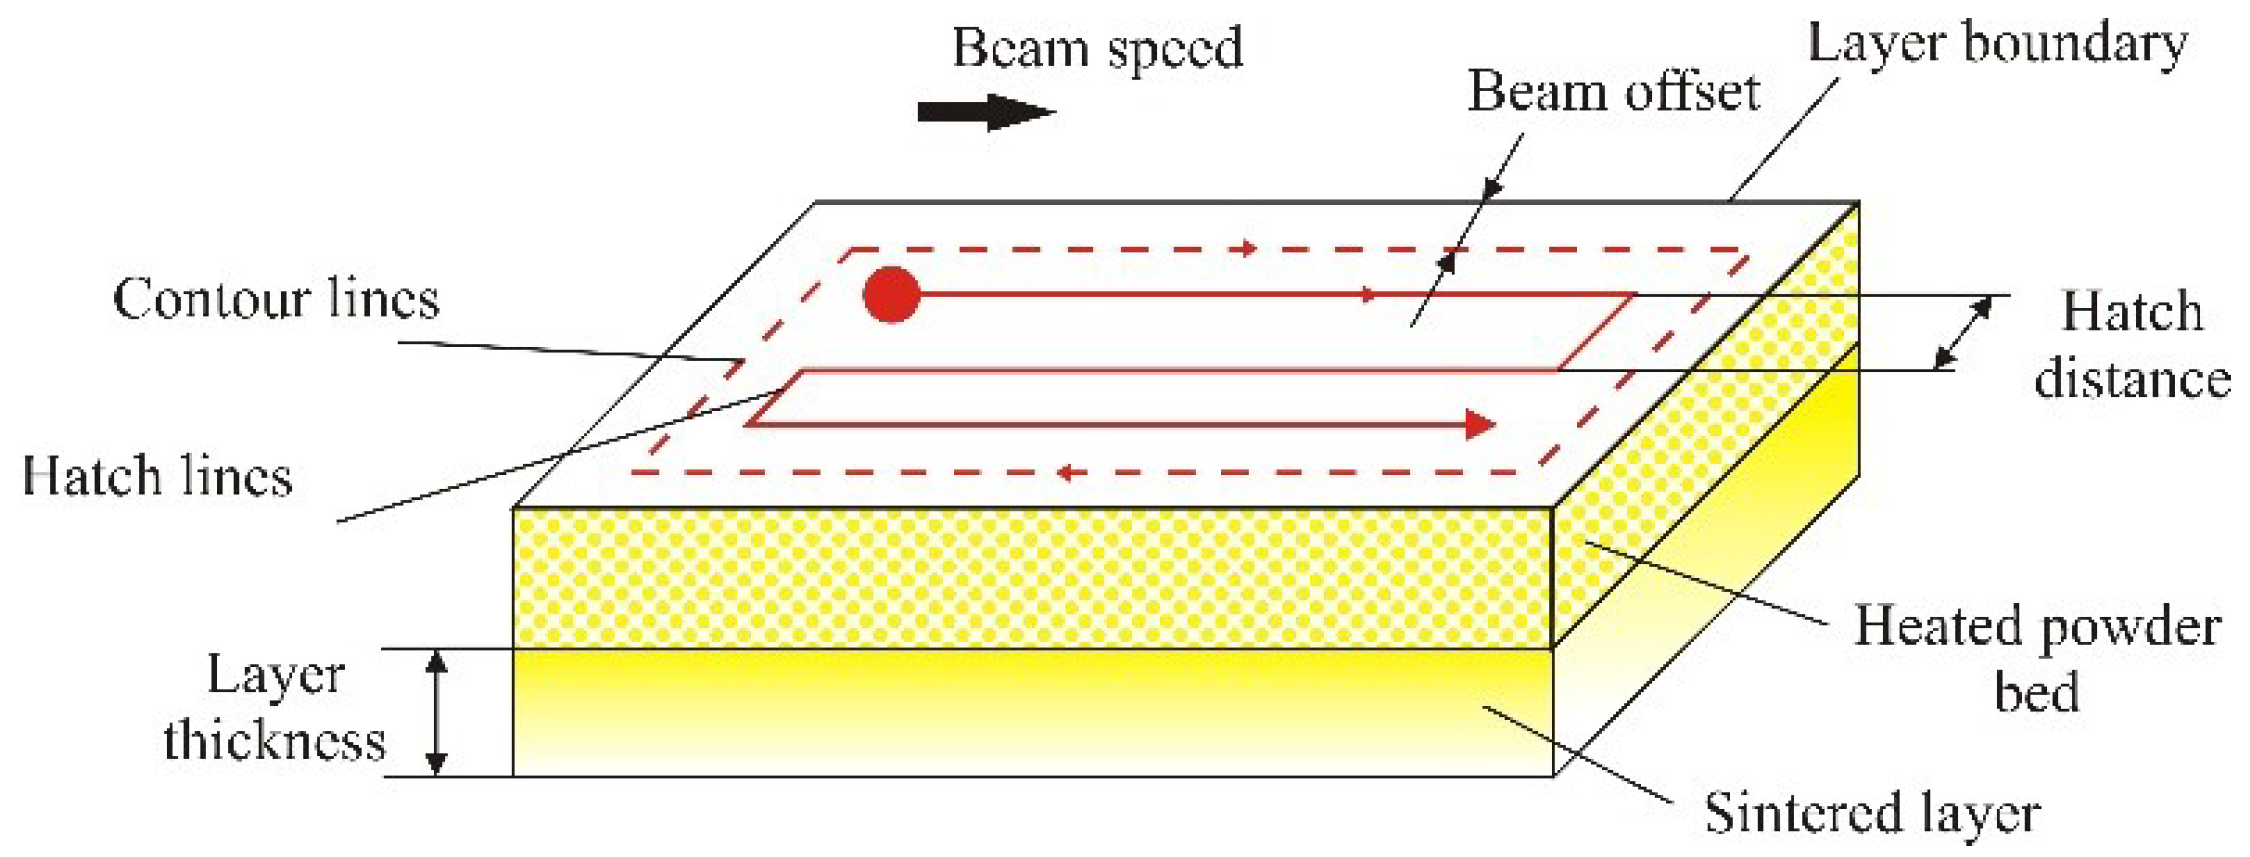
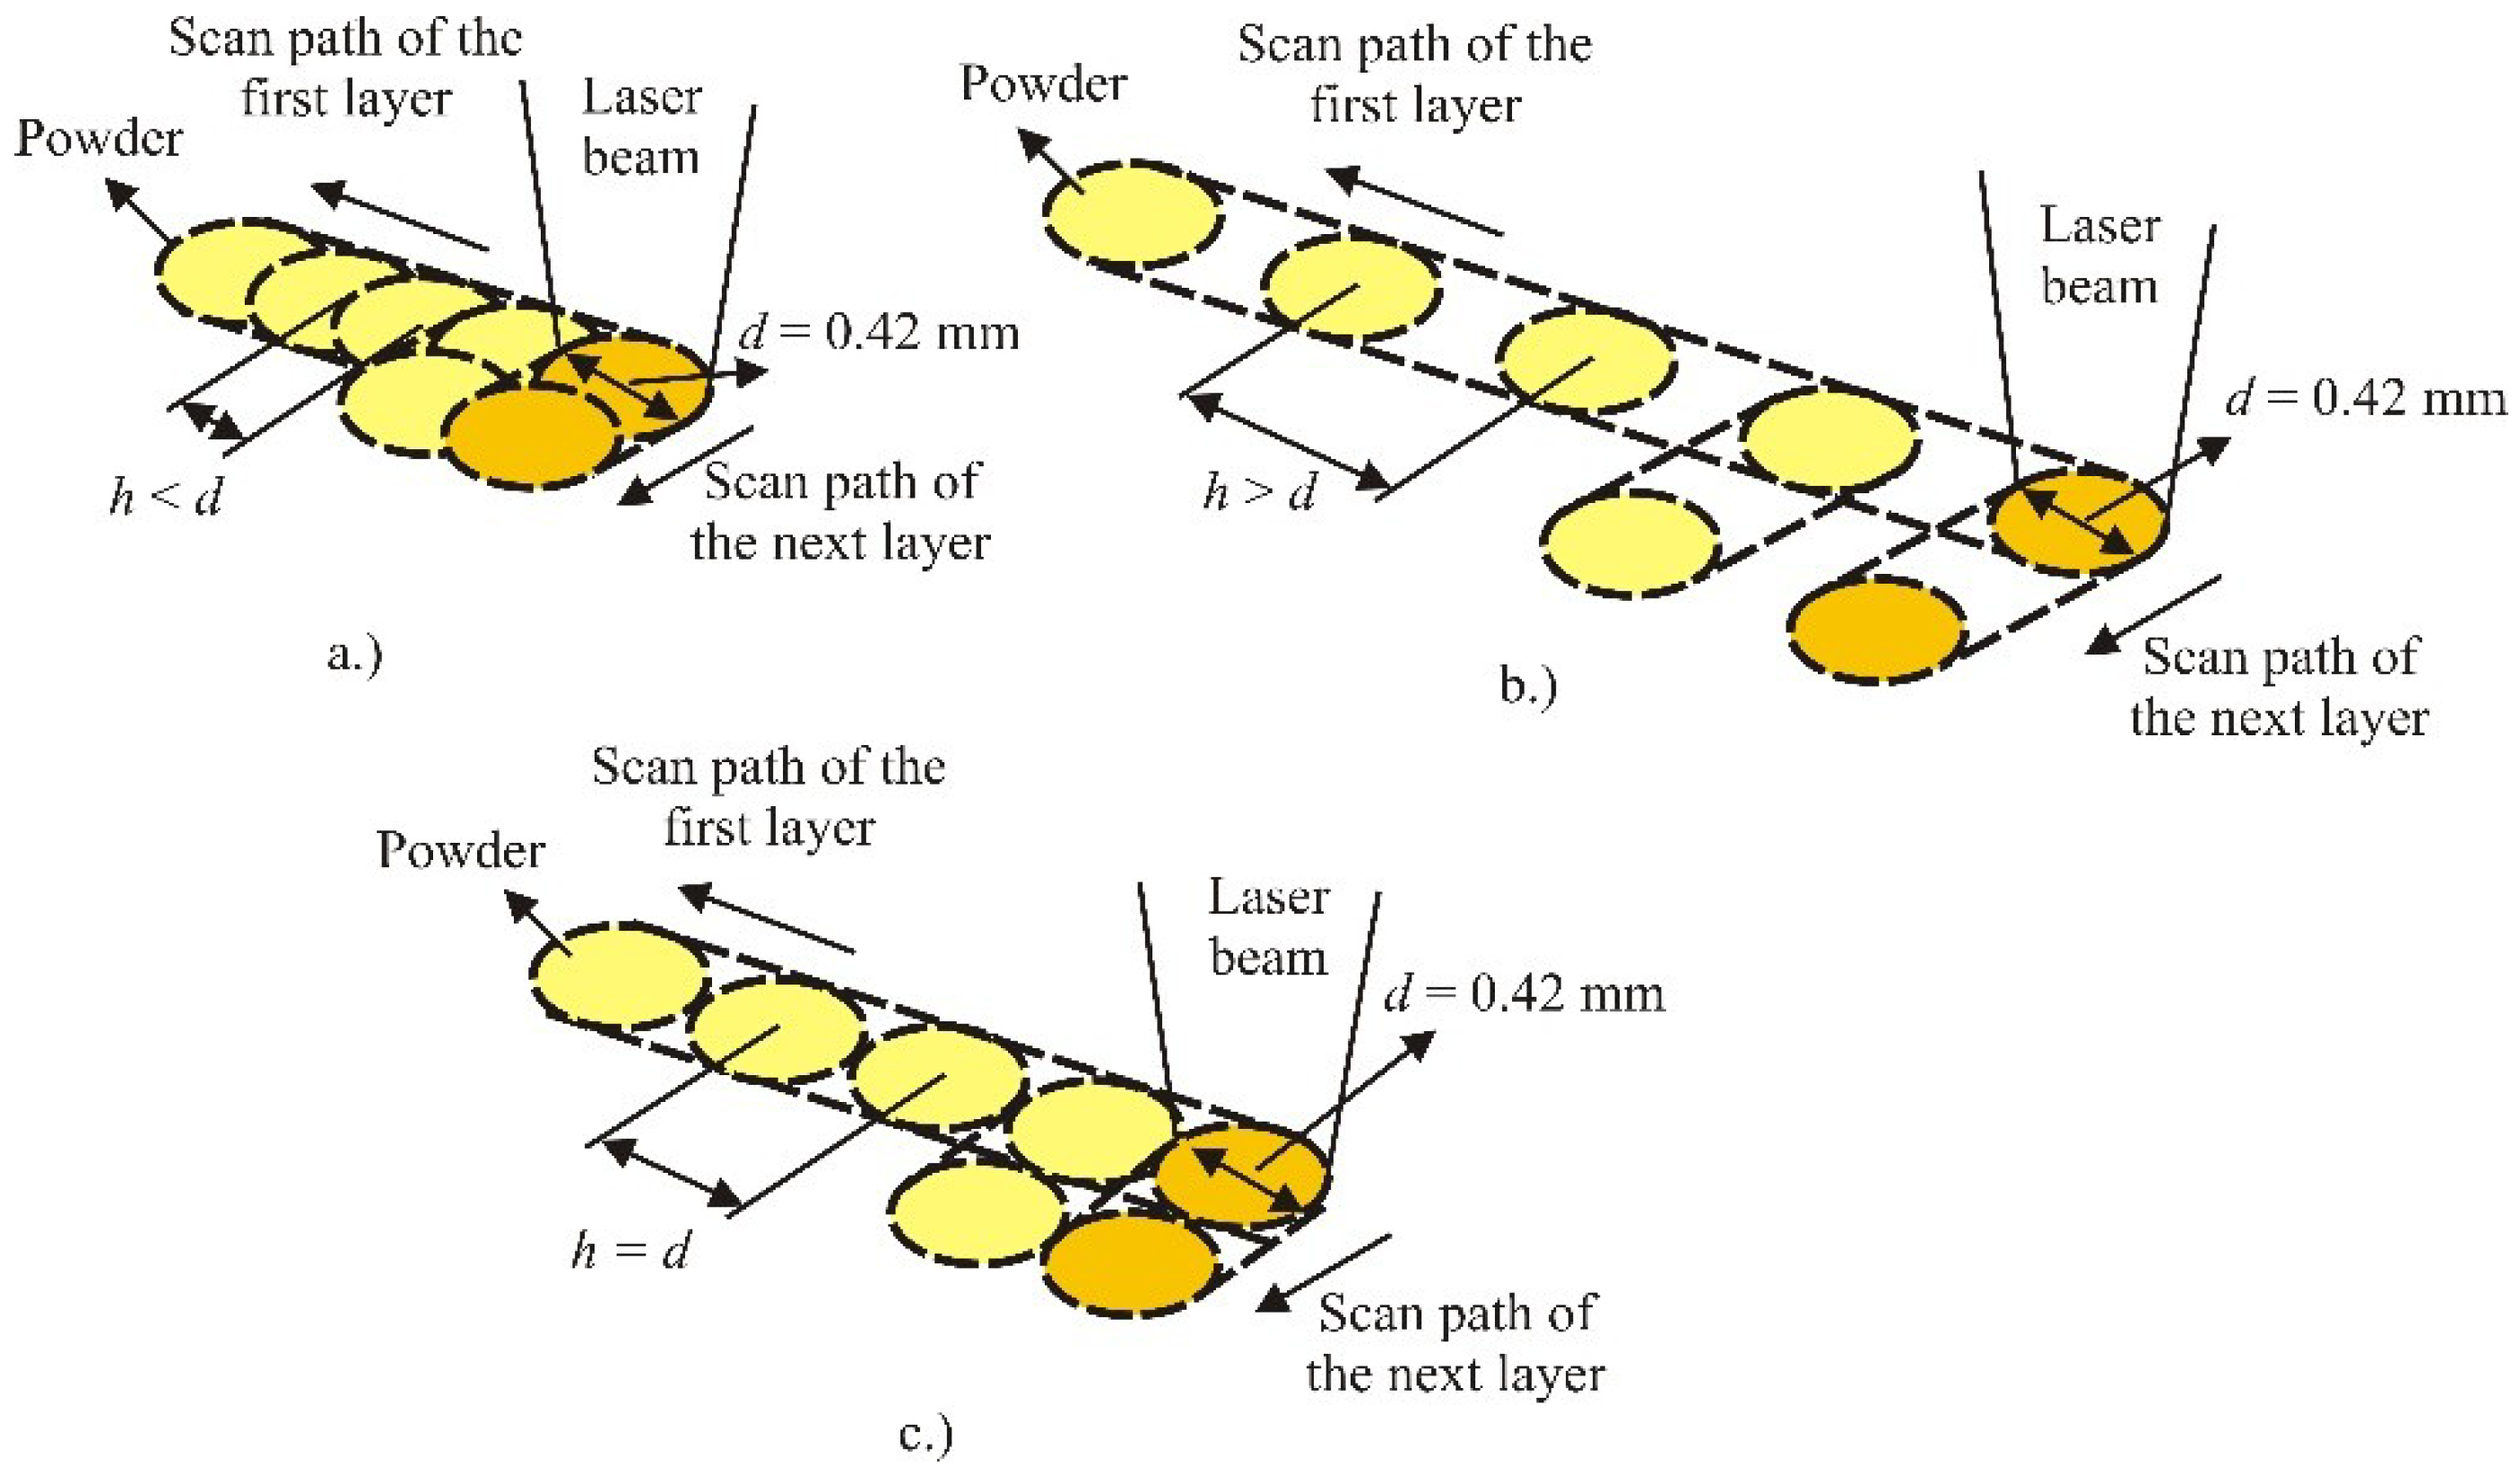
3.1. The Laser Parameters in SLS
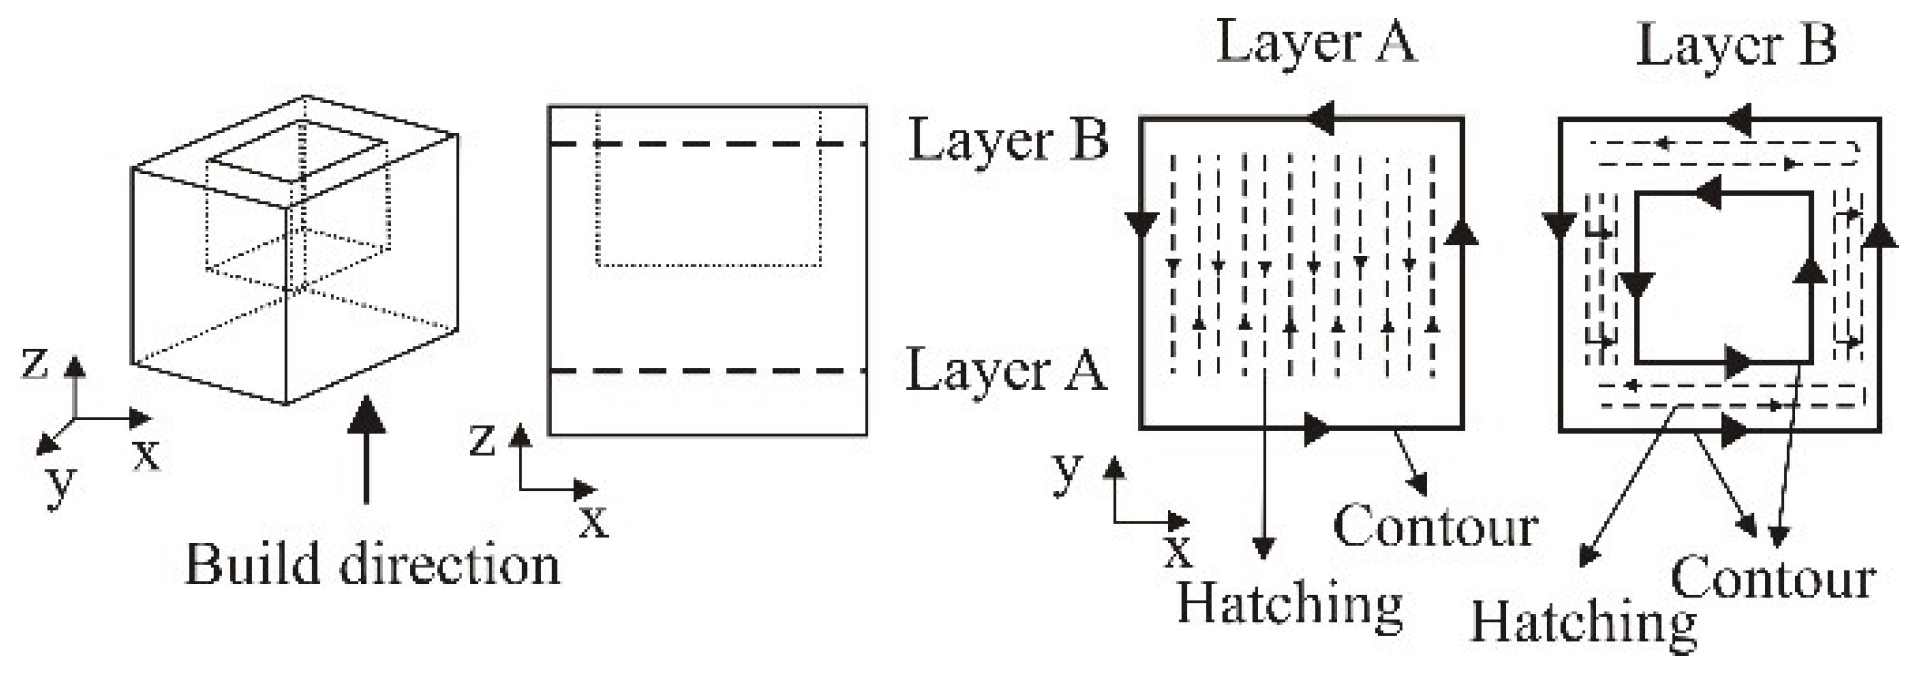
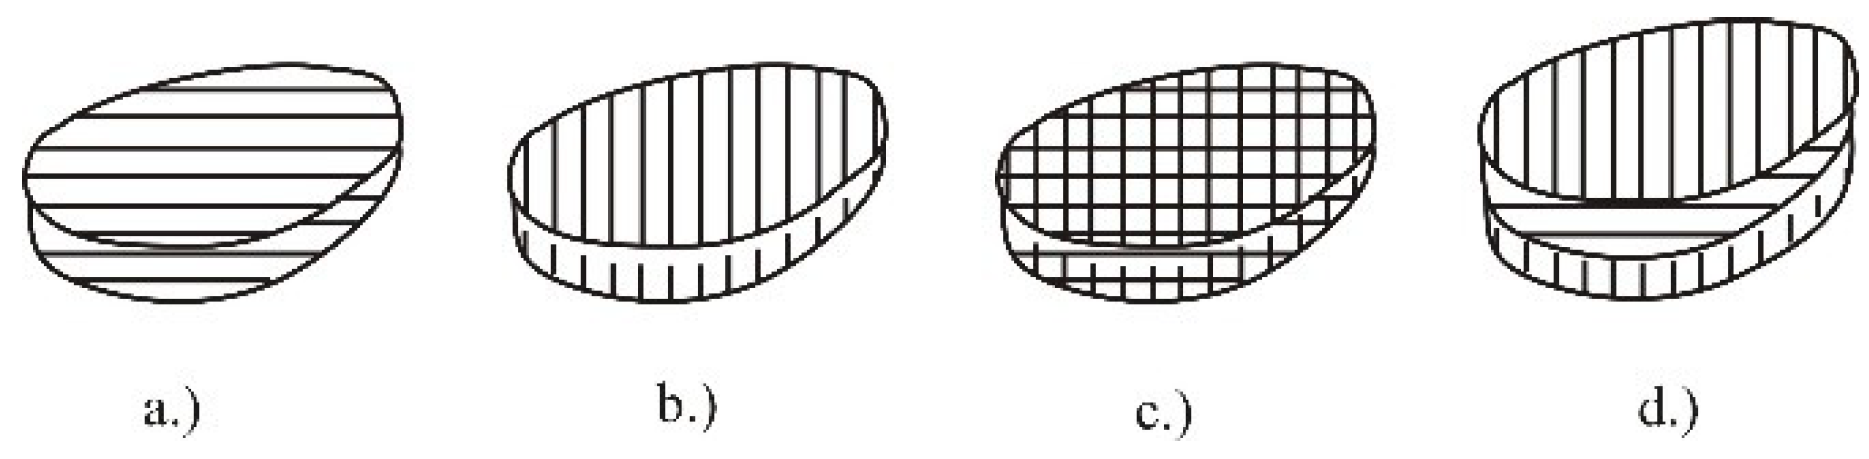
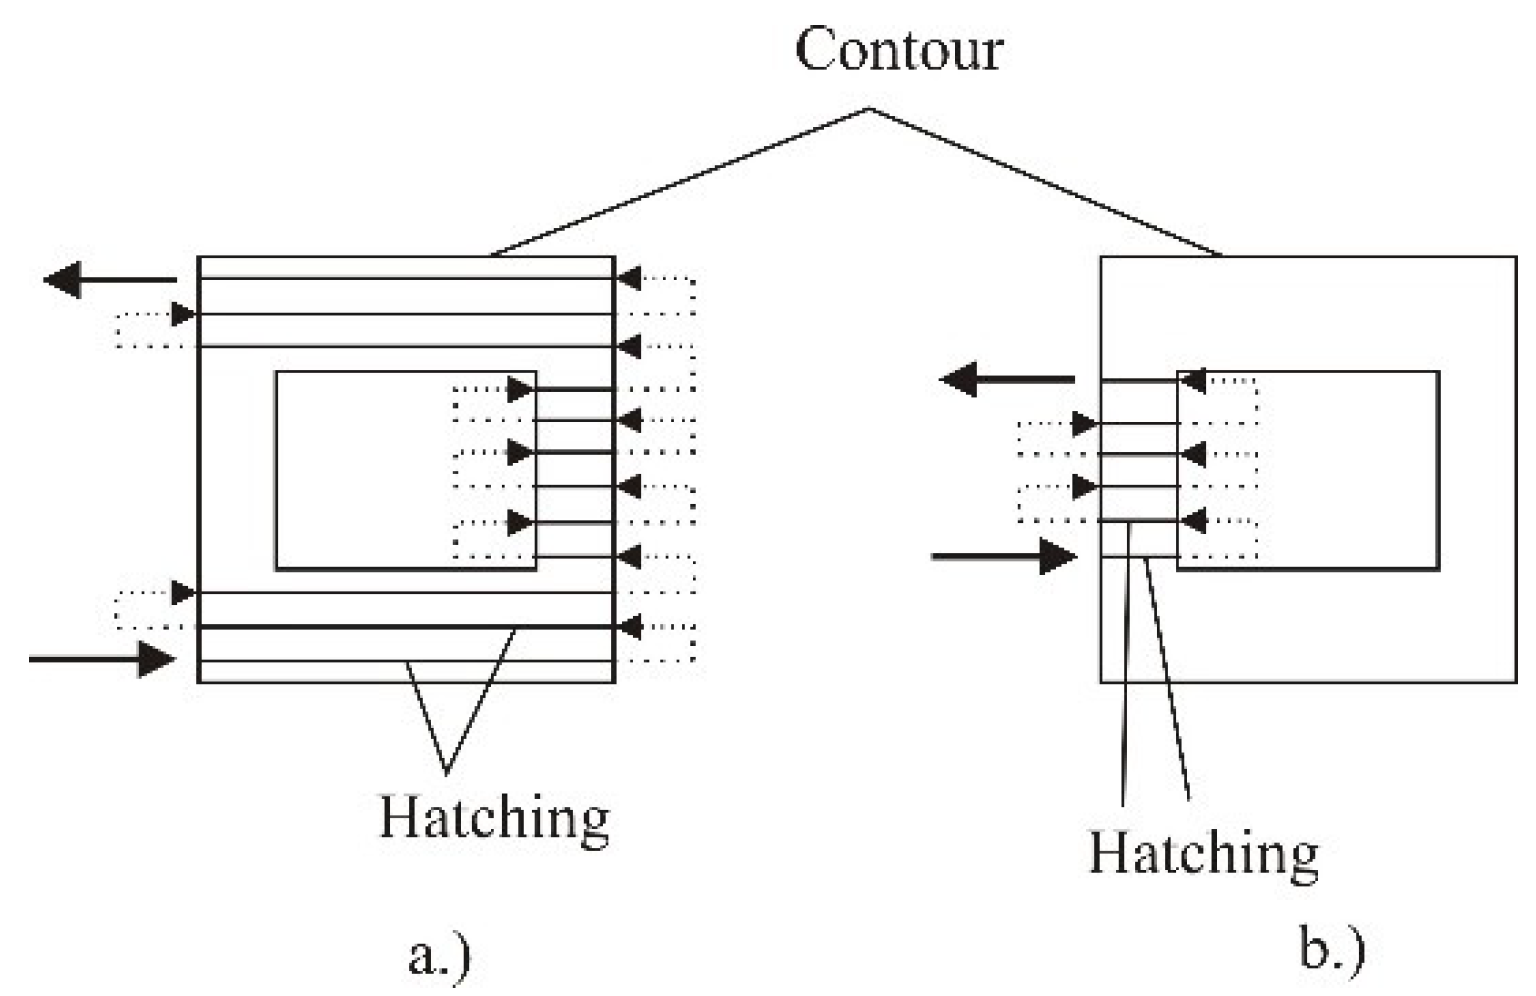
3.2. Strategy of Manufacturing Products in SLS
4. Experimental Part
- -
- average grain size 60 µm
- -
- bulk density 0.435–0.445 g/cm3
- -
- density of laser sintered part 0.9–0.95 g/cm3
5. Discussion of the Results
- ED
- energy density, J/mm2
- P
- laser power, W
- t
- time, s
- h
- scan spacing, hatch distance, mm
- ds
- path of the laser, mm
- dv
- laser beam speed, mm/s
6. Conclusions
Author Contributions
Funding
Acknowledgments
Conflicts of Interest
References
- Bourell, D.L. Sintering in Laser Sintering. J. Miner. Met. Mater. Soc. JOM 2016, 68, 885–889. [Google Scholar] [CrossRef]
- Valentan, B.; Brajlih, T.; Drstvenšek, I.; Balič, J. Development of a Part-Complexity Evaluation Model for Application in Additive Fabrication Technologies. Stroj. Vestnik J. Mech. Eng. 2011, 10, 709–718. [Google Scholar] [CrossRef]
- Pilipović, A.; Raos, P.; Šercer, M. Experimental analysis of properties of materials for rapid prototyping. Int. J. Adv. Manuf. Technol. 2009, 40, 105–115. [Google Scholar] [CrossRef]
- Salmoria, G.V.; Klauss, P.; Modolon Zepon, K.; Kanis, L.A. The effects of laser energy density and particle size in the selective laser sintering of polycaprolactone/progesterone specimens: Morphology and drug release. Int. J. Adv. Manuf. Technol. 2013, 66, 1113–1118. [Google Scholar] [CrossRef]
- Singh, S.; Sachdeva, A.; Sharma, V.S. Optimization of selective laser sintering process parameters to achieve the maximum density and hardness in polyamide parts. Prog. Addit. Manuf. 2017, 2, 19–30. [Google Scholar] [CrossRef]
- Singh, S.; Sharma, V.S.; Sachdeva, A. Application of response surface methodology to analyze the effect of selective laser sintering parameters on dimensional accuracy. Prog. Addit. Manuf. 2018. [Google Scholar] [CrossRef]
- Leite, J.L.; Salmoria, G.V.; Paggi, R.A.; Ahrens, C.H.; Pouzada, A.S. Microstructural characterization and mechanical properties of functionally graded PA12/HDPE parts by selective laser sintering. Int. J. Adv. Manuf. Technol. 2012, 59, 583–591. [Google Scholar] [CrossRef]
- Kwon, D.; Park, E.; Ha, S.; Kim, N. Effect of Humidity Changes on Dimensional Stability of 3D Printed Parts by Selective Laser Sintering. Int. J. Precis. Eng. Manuf. 2017, 18, 1275–1280. [Google Scholar] [CrossRef]
- Zhou, W.; Wang, X.; Hu, J.; Zhu, X. Melting process and mechanics on laser sintering of single layer polyamide 6 powder. Int. J. Adv. Manuf. Technol. 2013, 69, 901–908. [Google Scholar] [CrossRef]
- Raghunath, N.; Pandey, P.M. Improving accuracy through shrinkage modelling by using Taguchi method in selective laser sintering. Int. J. Mach. Tools Manuf. 2007, 47, 985–995. [Google Scholar] [CrossRef]
- Caulfield, B.; McHugh, P.E.; Lohfeld, S. Dependence of mechanical properties of polyamide components on build parameters in the SLS process. J. Mater. Process. Technol. 2007, 182, 477–488. [Google Scholar] [CrossRef]
- Pilipović, A.; Valentan, B.; Brajlih, T.; Haramina, T.; Balič, J.; Kodvanj, J.; Šercer, M.; Drstvenšek, I. Influence of laser sintering parameters on mechanical properties of polymer products. In Proceedings of the 3nd International Conference on Additive Technologies: iCAT 2010 DAAAM International, Nova Gorica, Slovenia, 22–24 September 2010. [Google Scholar]
- İlkgün, Ö. Effects of Production Parameters on Porosity and Hole Properties in Laser Sintering Rapid Prototyping Process. Master’s Thesis, The Graduate School of Natural and Applied Sciences of Middle East Technical University, Çankaya, Ankara, Turkey, 2005. [Google Scholar]
- Schmidt, M.; Pohle, D.; Rechtenwald, T. Selective Laser Sintering of PEEK. Ann. CIRP 2007, 56, 205–208. [Google Scholar] [CrossRef]
- Yan, C.; Shi, Y.; Yang, J.; Liu, J. Preparation and selective laser sintering of nylon-12 coated metal powders and post processing. J. Mater. Process. Technol. 2009, 209, 5785–5792. [Google Scholar] [CrossRef]
- Pilipović, A. Analysis of Properties of Material for Rapid Prototyping, Diploma Work; Faculty of Mechanical Engineering and Naval Architecture: Zagreb, Croatia, 2006. [Google Scholar]
- Sharma, V.S.; Singh, S.; Sachdeva, A.; Kumar, P. Influence of sintering parameters on dynamic mechanical properties of selective laser sintered parts. Int. J. Mater. Form. 2015, 8, 157–166. [Google Scholar] [CrossRef]
- Hettesheimer, T.; Hirzel, S.; Roß, H.B. Energy savings through additive manufacturing: An analysis of selective laser sintering for automotive and aircraft components. Energy Effic. 2018, 11, 1227–1245. [Google Scholar] [CrossRef]
- Franco, A.; Lanzetta, M.; Romoli, L. Experimental analysis of selective laser sintering of polyamide powders: An energy perspective. J. Clean. Prod. 2010, 18, 1722–1730. [Google Scholar] [CrossRef]
- Pilipović, A.; Drstvenšek, I.; Šercer, M. Mathematical Model for the Selection of Processing Parameters in Selective Laser Sintering of Polymer Products. Adv. Mech. Eng. 2014, 1–9. [Google Scholar] [CrossRef]
- Drstvenšek, I.; Ihan Hren, N.; Strojnik, T.; Brajlih, T.; Valentan, B.; Pogačar, V.; Županšić Hartner, T. Applications of Rapid Prototyping in Cranio-Maxilofacial Surgery Procedures. Int. J. Boil. Biomed. Eng. 2008, 2, 29–38. [Google Scholar]
- Senthilkumaran, K.; Pandey, P.M.; Rao, P.V.M. Influence of building strategies on the accuracy of parts in selective laser sintering. Mater. Des. 2009, 30, 2946–2954. [Google Scholar] [CrossRef]
- Dingal, S.; Pradhan, T.R.; Sarin Sundar, J.K.; Roy Choudhury, A.; Roy, S.K. The application of Taguchi’s method in the experimental investigation of the laser sintering process. Int. J. Adv. Manuf. Technol. 2008, 38, 904–914. [Google Scholar] [CrossRef]
- Kulkarni, P.; Marsan, A.; Dutta, D. A review of process planning techniques in layered manufacturing. Rapid Prototyp. J. 2000, 6, 18–35. [Google Scholar] [CrossRef]
- Stamp, R.; Fox, P.; O’Neill, W.; Jones, E.; Sutcliffe, C. The development of a scanning strategy for the manufacture of porous biomaterials by selective laser melting. J. Mater. Sci. Mater. Med. 2009, 20, 1839–1848. [Google Scholar] [CrossRef] [PubMed]
- Petros, M.; Torabi, P.; Khoshnevis, B. The influence of build strategies in selective inhibition sintering (SIS). Int. J. Adv. Manuf. Technol. 2016, 84, 969–979. [Google Scholar] [CrossRef]
- Jain, P.K.; Pandey, P.M.; Rao, P.V.M. Tailoring Material Properties in Layered Manufacturing. In Proceedings of the World Congress on Engineering 2010 Vol III, WCE 2010, London, UK, 30 June–2 July 2010. [Google Scholar]
- EOS GmbH Date Sheet. Available online: www.eos.info (accessed on 25 September 2018).
- Aldahsh, S.A. Dependence o0f SLS parameters on thermal properties of composite material of cement with polyamide 12. J. Appl. Mech. Eng. 2013, 2, 1–7. [Google Scholar]


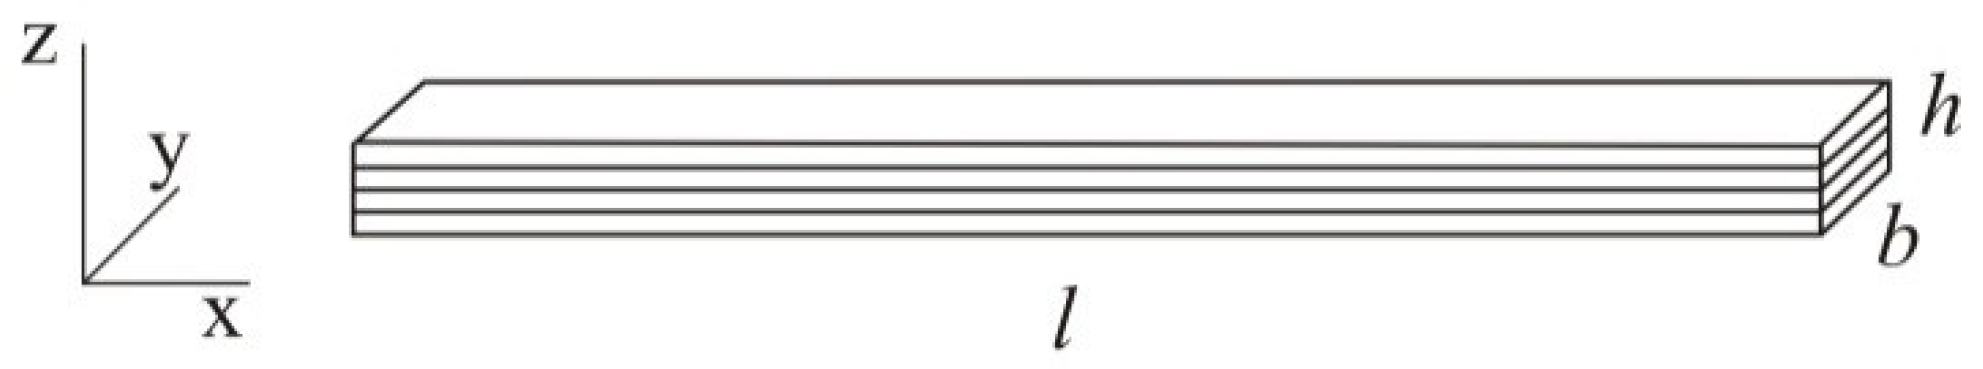
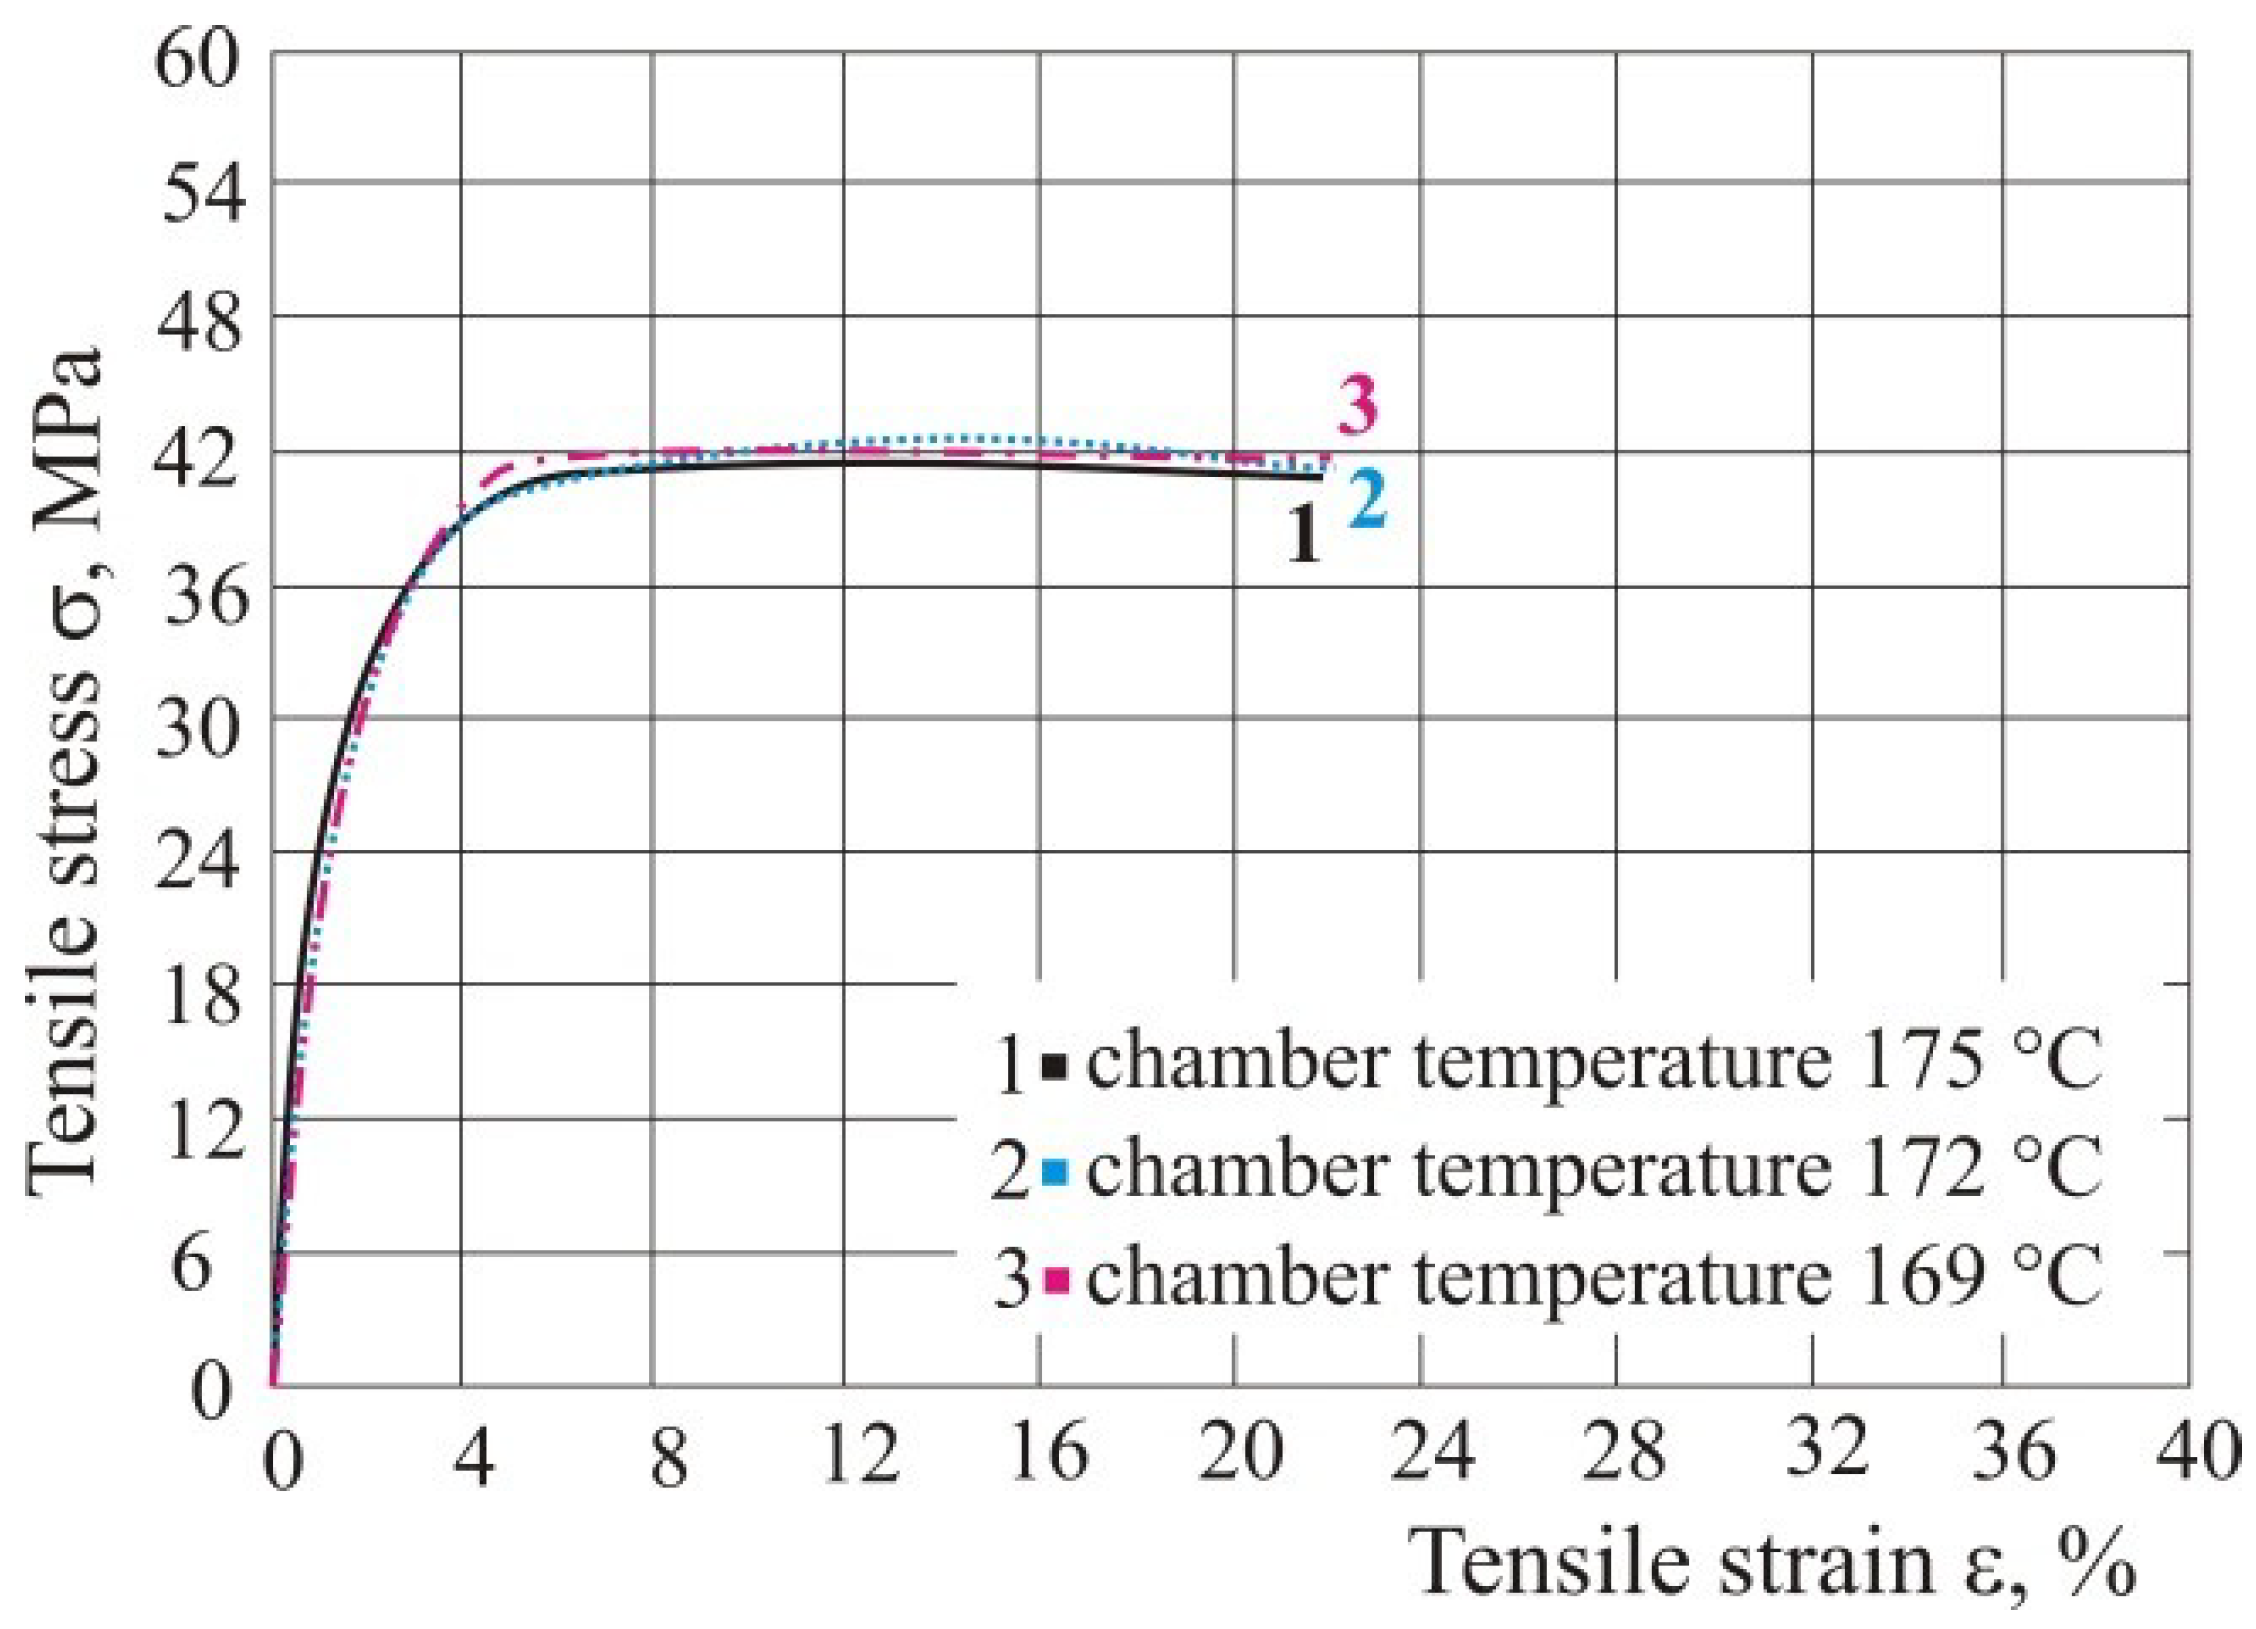
| No. | h, mm | b, mm | A0, mm2 | Fm, N | Rm, MPa | εp, % | Rp, MPa | E, GPa |
|---|---|---|---|---|---|---|---|---|
| 175 °C | ||||||||
| 1 | 4.09 | 5.01 | 20.49 | 842.0 | 41.09 | 22.2 | 40.54 | 2.048 |
| 2 | 4.07 | 4.98 | 20.27 | 870.1 | 42.93 | 21.5 | 42.04 | 2.244 |
| 3 | 4.18 | 4.99 | 20.86 | 849.8 | 40.74 | 22.7 | 39.83 | 1.971 |
| 4.11 | 4.99 | 20.54 | 853.97 | 41.59 | 22.13 | 40.80 | 2.088 | |
| S | 0.059 | 0.015 | 0.298 | 14.506 | 1.176 | 0.603 | 1.128 | 0.141 |
| 172 °C | ||||||||
| 1 | 4.03 | 5.10 | 20.55 | 873.7 | 42.09 | 22.8 | 41.55 | 2.053 |
| 2 | 4.10 | 5.06 | 20.75 | 880.4 | 42.44 | 22.7 | 41.35 | 2.012 |
| 3 | 4.06 | 5.09 | 20.67 | 868.0 | 42.00 | 22.9 | 40.48 | 2.034 |
| 4.06 | 5.08 | 20.65 | 874.03 | 42.18 | 22.80 | 41.13 | 2.033 | |
| S | 0.035 | 0.021 | 0.097 | 6.207 | 0.232 | 0.100 | 0.569 | 0.021 |
| 169 °C | ||||||||
| 1 | 3.93 | 4.98 | 19.57 | 832.0 | 42.51 | 22.3 | 41.94 | 2.275 |
| 2 | 4.00 | 5.03 | 20.12 | 868.0 | 43.14 | 21.8 | 41.24 | 2.507 |
| 3 | 4.00 | 5.00 | 20.00 | 864.7 | 43.23 | 22.4 | 42.28 | 2.226 |
| 3.98 | 5.00 | 19.90 | 854.9 | 42.96 | 22.17 | 41.82 | 2.336 | |
| S | 0.040 | 0.025 | 0.288 | 19.901 | 0.392 | 0.321 | 0.530 | 0.150 |
| No. | P, W | v, mm/s | h, mm | x | ED, J/mm2 |
|---|---|---|---|---|---|
| 1 | 15 | 2000 | 0.25 | 1.68 | 0.05 |
| 2 | 25 | 3333 | 0.25 | 1.68 | 0.05 |
| 3 | 7.5 | 1000 | 0.25 | 1.68 | 0.05 |
| 4 | 22.5 | 3000 | 0.25 | 1.68 | 0.05 |
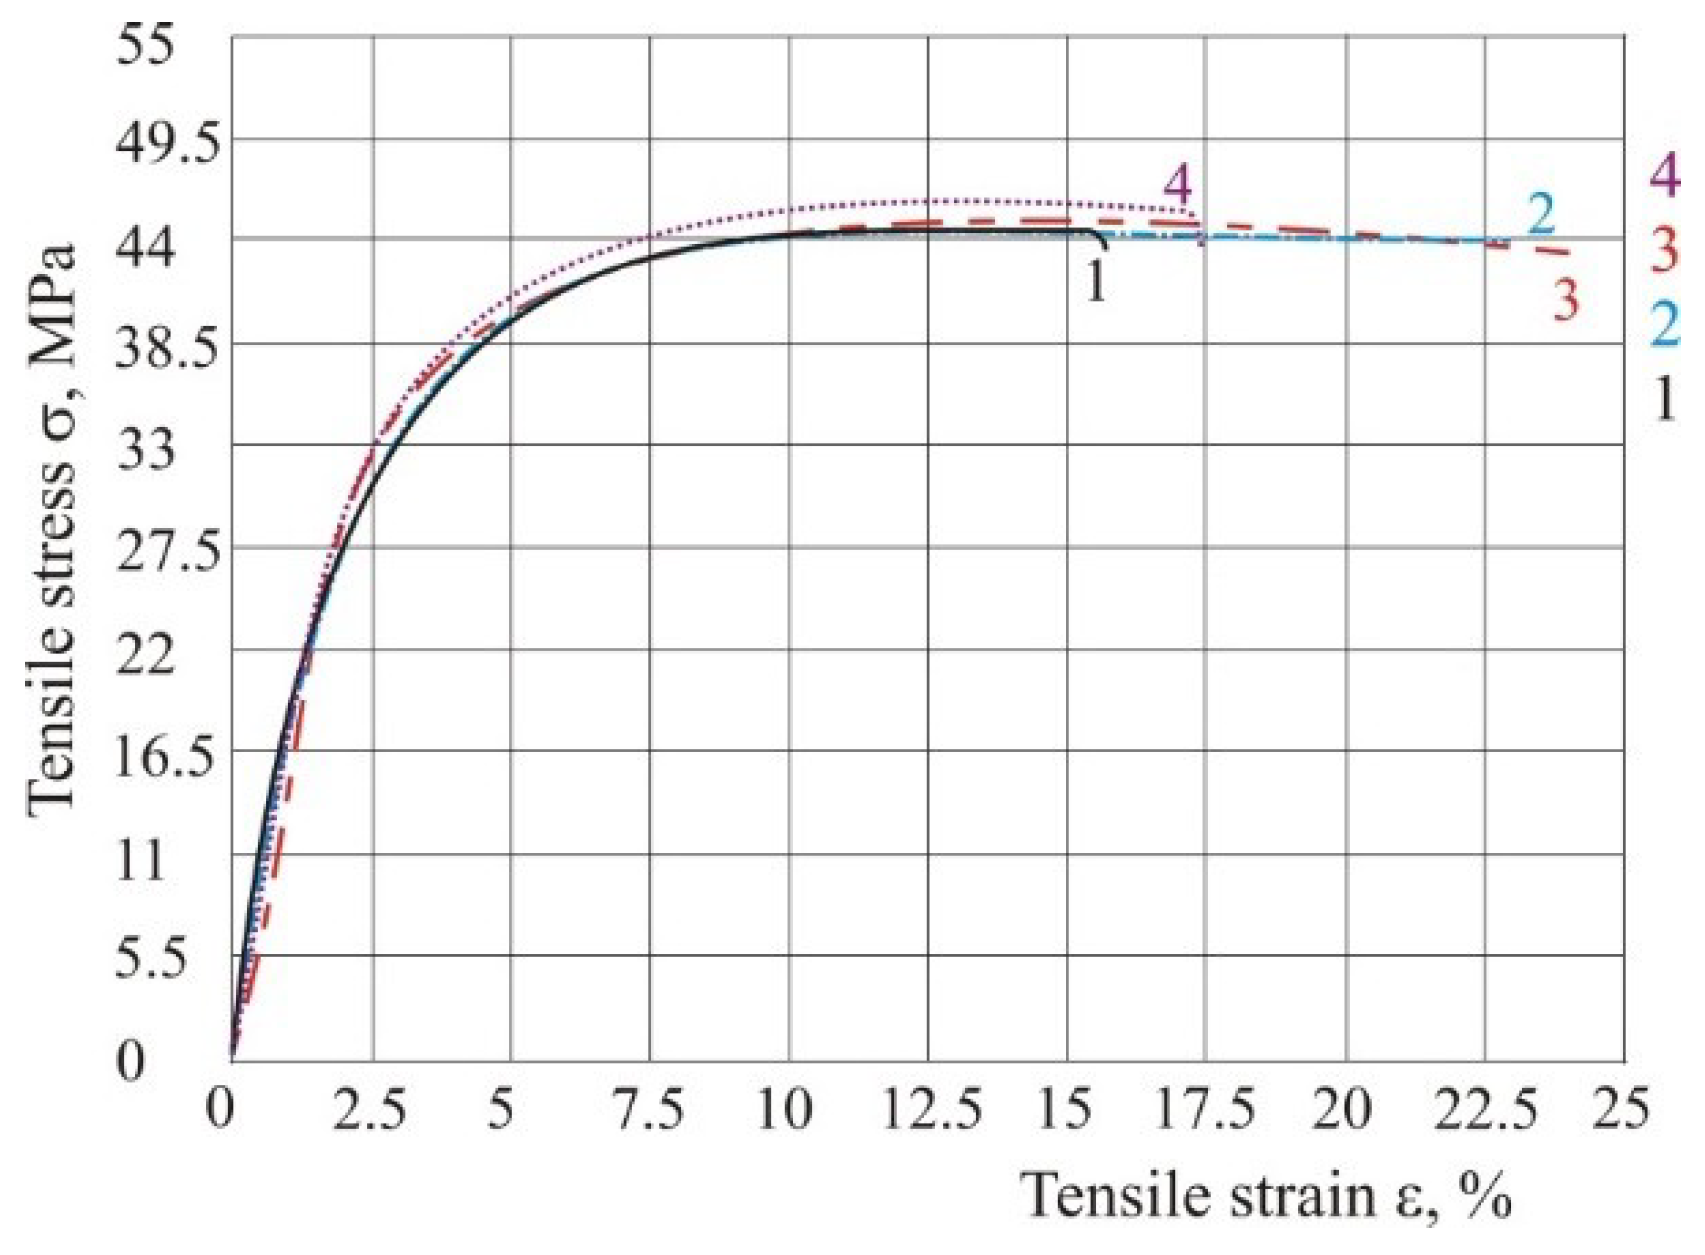
| No. | h, mm | b, mm | A0, mm2 | Fm, N | Rm, MPa | εp, % | Rp, MPa | E, GPa |
|---|---|---|---|---|---|---|---|---|
| 1_1 | 3.95 | 10.22 | 40.37 | 1817.0 | 45.01 | 15.04 | 42.32 | 1.601 |
| 1_2 | 3.95 | 10.26 | 40.53 | 1833.8 | 45.25 | 15.83 | 42.6 | 1.654 |
| 1_3 | 3.92 | 10.3 | 40.27 | 1835.5 | 45.46 | 16.5 | 42.7 | 1.647 |
| 3.94 | 10.26 | 40.39 | 1828.8 | 45.24 | 15.79 | 42.54 | 1.634 | |
| S | 0.017 | 0.040 | 0.128 | 10.247 | 0.225 | 0.731 | 0.197 | 0.029 |
| 2_1 | 3.96 | 10.2 | 40.39 | 1842.7 | 45.62 | 23.01 | 42.95 | 1.725 |
| 2_2 | 3.94 | 10.15 | 39.99 | 1819.6 | 45.5 | 23.35 | 43.17 | 1.751 |
| 2_3 | 3.96 | 10.25 | 40.79 | 1858.6 | 45.56 | 23.42 | 42.94 | 1.726 |
| 3.96 | 10.2 | 40.39 | 1840.3 | 45.56 | 23.26 | 43.02 | 1.734 | |
| S | 0.012 | 0.050 | 0.398 | 19.627 | 0.060 | 0.219 | 0.130 | 0.015 |
| 3_1 | 3.9 | 10.2 | 39.78 | 1817.5 | 45.69 | 24.3 | 43.02 | 1.641 |
| 3_2 | 3.92 | 10.16 | 39.83 | 1815.3 | 45.58 | 24 | 42.75 | 1.612 |
| 3_3 | 3.88 | 10.18 | 39.49 | 1806.7 | 45.74 | 24.48 | 43.17 | 1.616 |
| 3.9 | 10.18 | 39.7 | 1813.2 | 45.67 | 24.26 | 42.98 | 1.623 | |
| S | 0.020 | 0.020 | 0.181 | 5.714 | 0.082 | 0.242 | 0.213 | 0.016 |
| 4_1 | 3.9 | 10.22 | 39.86 | 1853.4 | 46.5 | 17.02 | 42.23 | 1.652 |
| 4_2 | 3.9 | 10.2 | 39.78 | 1846.6 | 46.42 | 16.78 | 42.65 | 1.629 |
| 4_3 | 3.96 | 10.3 | 40.48 | 1878.2 | 46.4 | 16.87 | 42.62 | 1.645 |
| 3.92 | 10.24 | 40.04 | 1859.4 | 46.44 | 16.89 | 42.5 | 1.642 | |
| S | 0.035 | 0.053 | 0.385 | 16.647 | 0.053 | 0.121 | 0.234 | 0.012 |
| No. | P, W | v, mm/s | h, mm | x | ED, J/mm2 |
|---|---|---|---|---|---|
| 1 | 7 | 3000 | 0.25 | 1.68 | 0.016 |
| 2 | 10.5 | 3000 | 0.25 | 1.68 | 0.024 |
| 3 | 14 | 3000 | 0.25 | 1.68 | 0.031 |
| 4 | 18 | 3000 | 0.25 | 1.68 | 0.040 |
| 5 | 21 | 3000 | 0.25 | 1.68 | 0.047 |
| 6 | 22 | 3000 | 0.25 | 1.68 | 0.049 |
| 7 | 22.5 | 3000 | 0.25 | 1.68 | 0.050 |
| 8 | 25 | 3000 | 0.25 | 1.68 | 0.056 |
| 9 | 22 | 1000 | 0.25 | 1.68 | 0.148 |
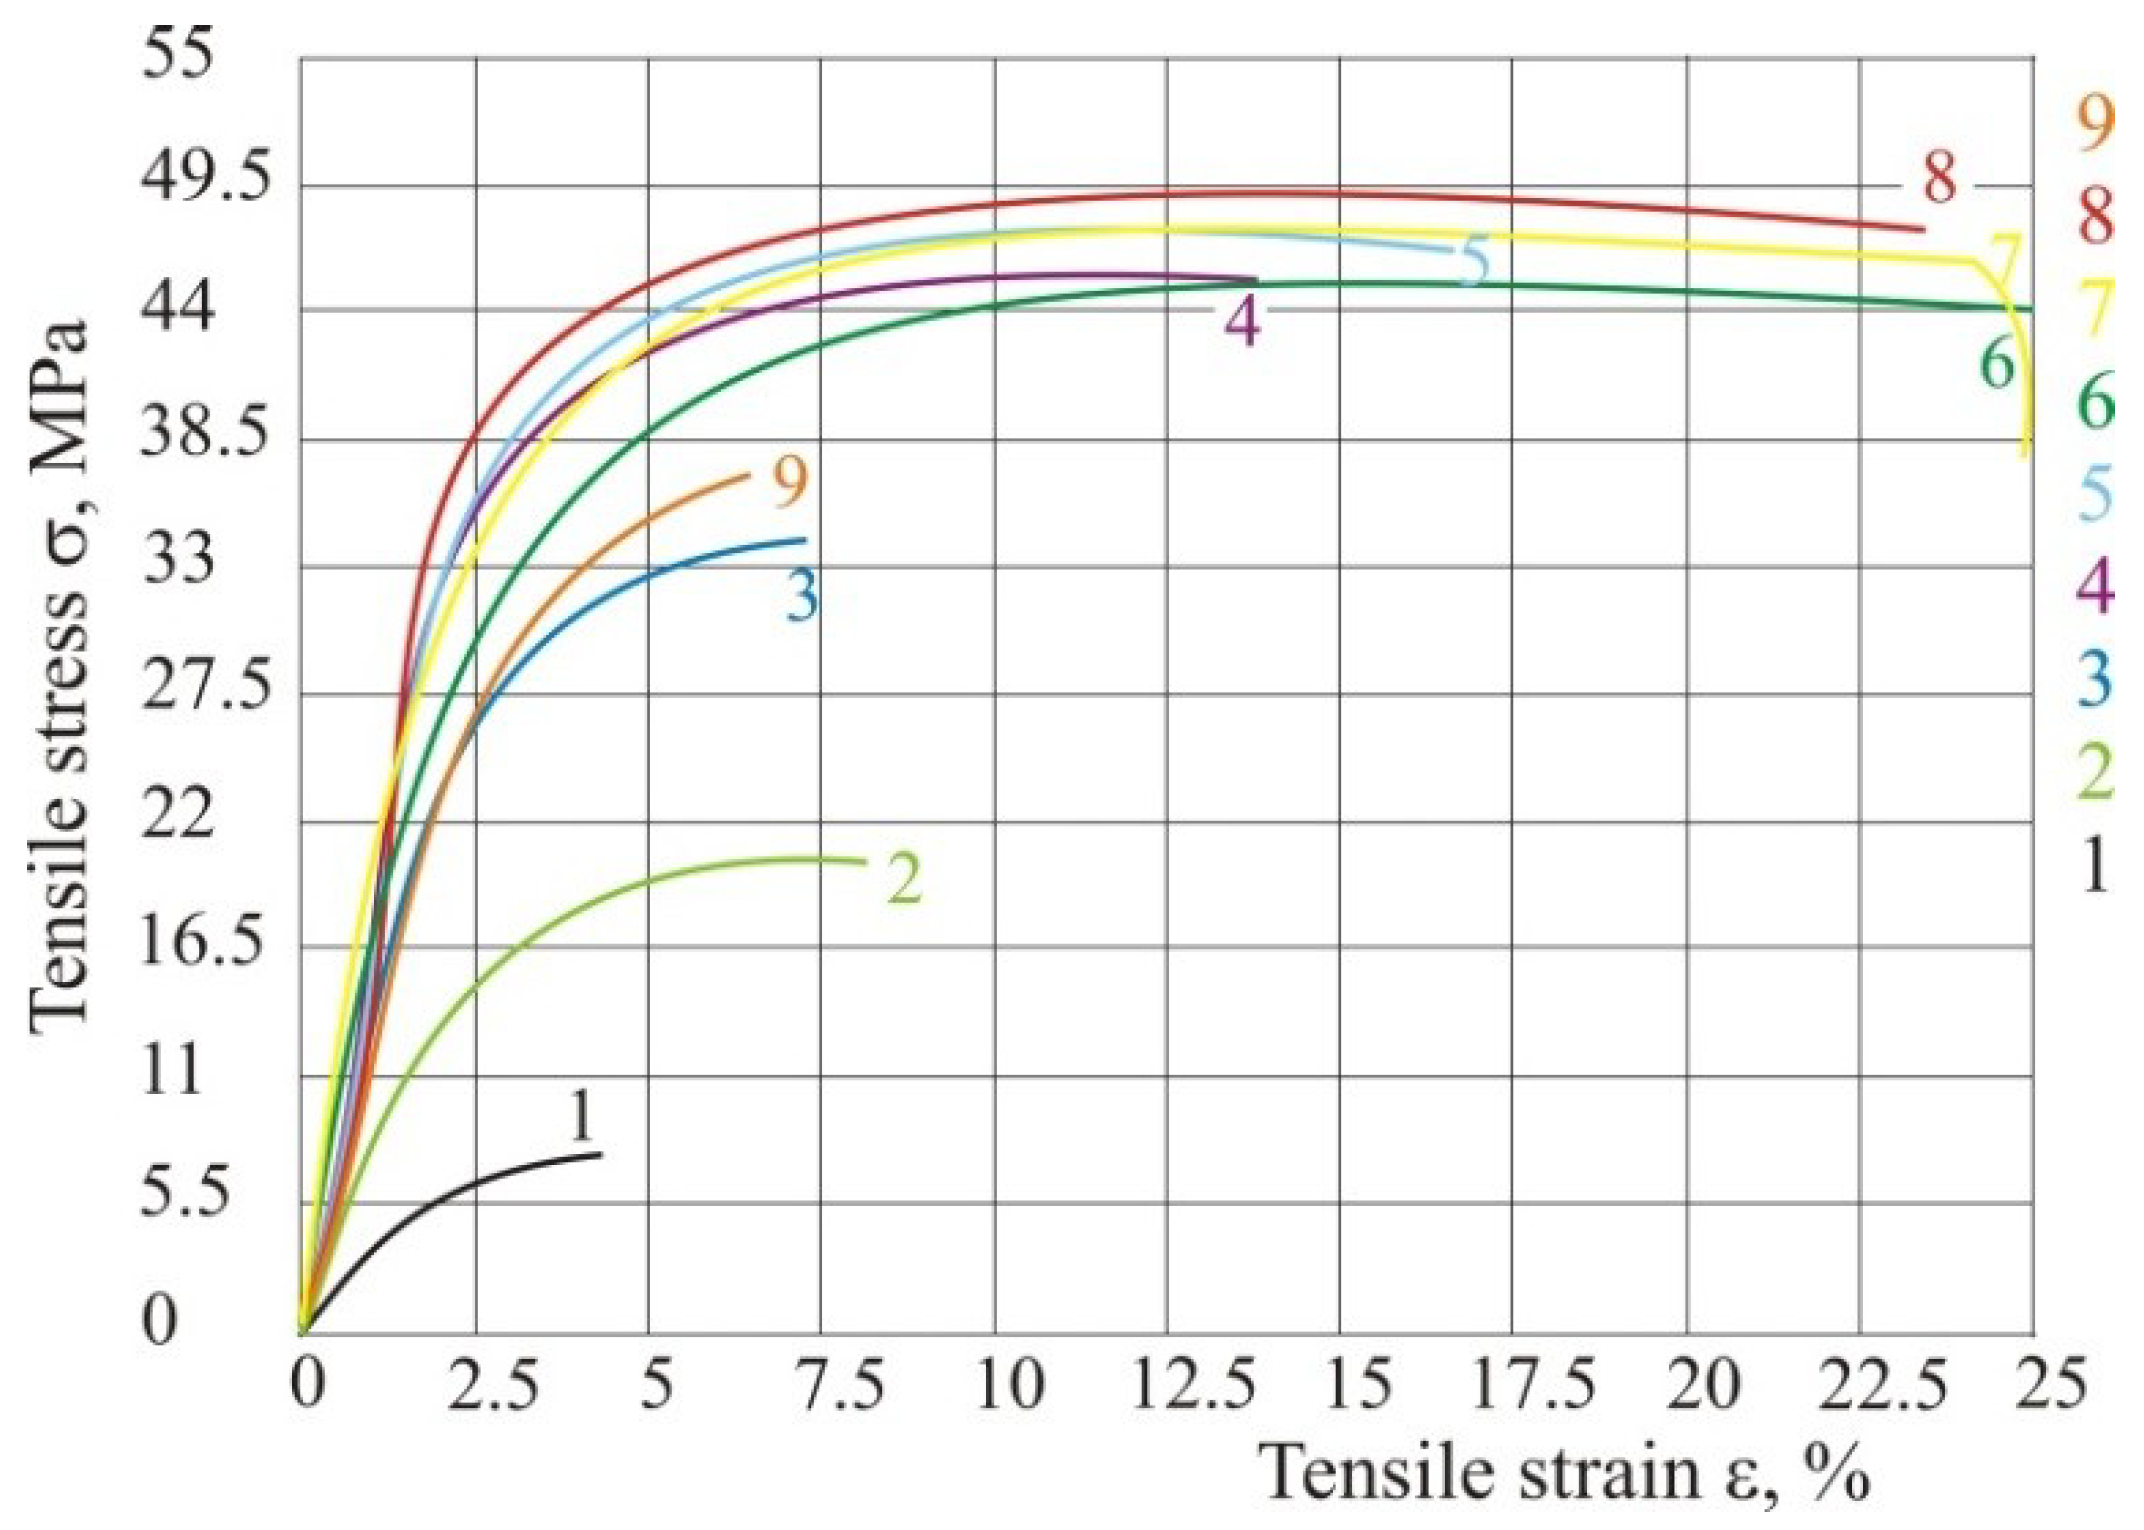
| No. | h, mm | b, mm | A0, mm2 | Fm, N | Rm, MPa | εp, % | Rp, MPa | E, GPa |
|---|---|---|---|---|---|---|---|---|
| 1_1 | 3.94 | 10.44 | 41.13 | 309.3 | 7.52 | 4.01 | 7.5 | 0.387 |
| 1_2 | 3.96 | 10.5 | 41.58 | 322.7 | 7.76 | 4.42 | 7.72 | 0.395 |
| 1_3 | 3.95 | 10.5 | 41.49 | 316.0 | 7.61 | 4.47 | 7.61 | 0.394 |
| 3.95 | 10.48 | 41.4 | 316.0 | 7.63 | 4.3 | 7.61 | 0.392 | |
| S | 0.010 | 0.035 | 0.235 | 6.668 | 0.121 | 0.252 | 0.110 | 0.004 |
| 2_1 | 3.92 | 10.1 | 39.59 | 805.7 | 20.35 | 8.5 | 20.32 | 0.953 |
| 2_2 | 3.92 | 10.2 | 39.98 | 824.5 | 20.62 | 8.62 | 20.6 | 0.938 |
| 2_3 | 3.95 | 10.12 | 39.97 | 819.3 | 20.50 | 8.56 | 20.37 | 0.944 |
| 3.93 | 10.14 | 39.85 | 816.5 | 20.49 | 8.56 | 20.43 | 0.945 | |
| S | 0.017 | 0.053 | 0.223 | 9.702 | 0.135 | 0.060 | 0.149 | 0.008 |
| 3_1 | 3.9 | 10.1 | 39.39 | 1340.0 | 34.02 | 7.24 | 34.0 | 1.321 |
| 3_2 | 3.9 | 10.06 | 39.23 | 1347.7 | 34.35 | 7.41 | 34.29 | 1.342 |
| 3_3 | 3.96 | 10.08 | 39.91 | 1374.6 | 34.44 | 7.31 | 34.34 | 1.336 |
| 3.92 | 10.08 | 39.51 | 1354.1 | 34.27 | 7.32 | 34.21 | 1.333 | |
| S | 0.035 | 0.020 | 0.352 | 18.130 | 0.221 | 0.085 | 0.184 | 0.011 |
| 4_1 | 3.94 | 10.14 | 39.95 | 1817.8 | 45.5 | 13.86 | 45.5 | 2.077 |
| 4_2 | 3.92 | 10.1 | 39.59 | 1806.6 | 45.63 | 13.24 | 45.58 | 2.025 |
| 4_3 | 3.93 | 10.03 | 39.41 | 1797.8 | 45.61 | 14.24 | 45.21 | 1.967 |
| 3.93 | 10.09 | 39.65 | 1807.4 | 45.58 | 13.78 | 45.43 | 2.023 | |
| S | 0.010 | 0.056 | 0.277 | 10.014 | 0.070 | 0.505 | 0.195 | 0.055 |
| 5_1 | 4.0 | 10.2 | 40.80 | 1927.8 | 47.25 | 16.68 | 47.2 | 1.811 |
| 5_2 | 3.98 | 10.2 | 40.60 | 1928.3 | 47.5 | 16.52 | 47.5 | 1.869 |
| 5_3 | 3.99 | 10.05 | 40.10 | 1906.3 | 47.54 | 16.96 | 44.5 | 1.825 |
| 3.99 | 10.15 | 40.5 | 1920.8 | 47.43 | 16.72 | 46.4 | 1.835 | |
| S | 0.010 | 0.087 | 0.358 | 12.569 | 0.157 | 0.223 | 1.652 | 0.030 |
| 6_1 | 3.98 | 10.2 | 40.60 | 1821.9 | 44.88 | 25.4 | 42.8 | 1.689 |
| 6_2 | 4.02 | 10.2 | 41.00 | 1855.4 | 45.25 | 25.5 | 44.23 | 1.715 |
| 6_3 | 4.0 | 10.26 | 41.04 | 1846.2 | 44.99 | 25.96 | 40.83 | 1.717 |
| 4.0 | 10.22 | 40.88 | 1841.2 | 45.04 | 25.62 | 42.62 | 1.707 | |
| S | 0.020 | 0.035 | 0.247 | 17.297 | 0.190 | 0.299 | 1.707 | 0.016 |
| 7_1 | 3.92 | 10.2 | 39.98 | 1848.9 | 46.24 | 24.01 | 39.68 | 1.748 |
| 7_2 | 3.9 | 10.2 | 39.78 | 1856.9 | 46.68 | 23.1 | 38.25 | 1.7 |
| 7_3 | 3.88 | 10.2 | 39.58 | 1848.4 | 46.7 | 25.22 | 33.1 | 1.808 |
| 3.9 | 10.2 | 39.78 | 1851.4 | 46.54 | 24.11 | 37.01 | 1.752 | |
| S | 0.020 | 0.000 | 0.204 | 4.795 | 0.260 | 1.065 | 3.461 | 0.054 |
| 8_1 | 4.0 | 10.16 | 40.64 | 1977.9 | 48.67 | 23.5 | 45.97 | 1.858 |
| 8_2 | 4.0 | 10.2 | 40.80 | 2009.4 | 49.25 | 23.58 | 46.56 | 1.888 |
| 8_3 | 4.0 | 10.18 | 40.72 | 1998.6 | 49.08 | 24.41 | 46.34 | 1.84 |
| 4.0 | 10.18 | 40.72 | 1995.3 | 49.0 | 23.83 | 46.29 | 1.862 | |
| S | 0.000 | 0.020 | 0.080 | 15.976 | 0.298 | 0.504 | 0.298 | 0.024 |
| 9_1 | 5.68 | 11.78 | 66.91 | 2401.4 | 35.89 | 6.5 | 35.89 | 1.211 |
| 9_2 | 5.7 | 11.5 | 65.55 | 2357.8 | 35.97 | 6.21 | 35.92 | 1.294 |
| 9_3 | 5.33 | 11.49 | 61.22 | 2232.3 | 36.44 | 6.94 | 36.34 | 1.35 |
| 5.57 | 11.59 | 64.56 | 2330.5 | 36.1 | 6.55 | 36.05 | 1.285 | |
| S | 0.208 | 0.165 | 2.972 | 87.831 | 0.297 | 0.368 | 0.252 | 0.070 |
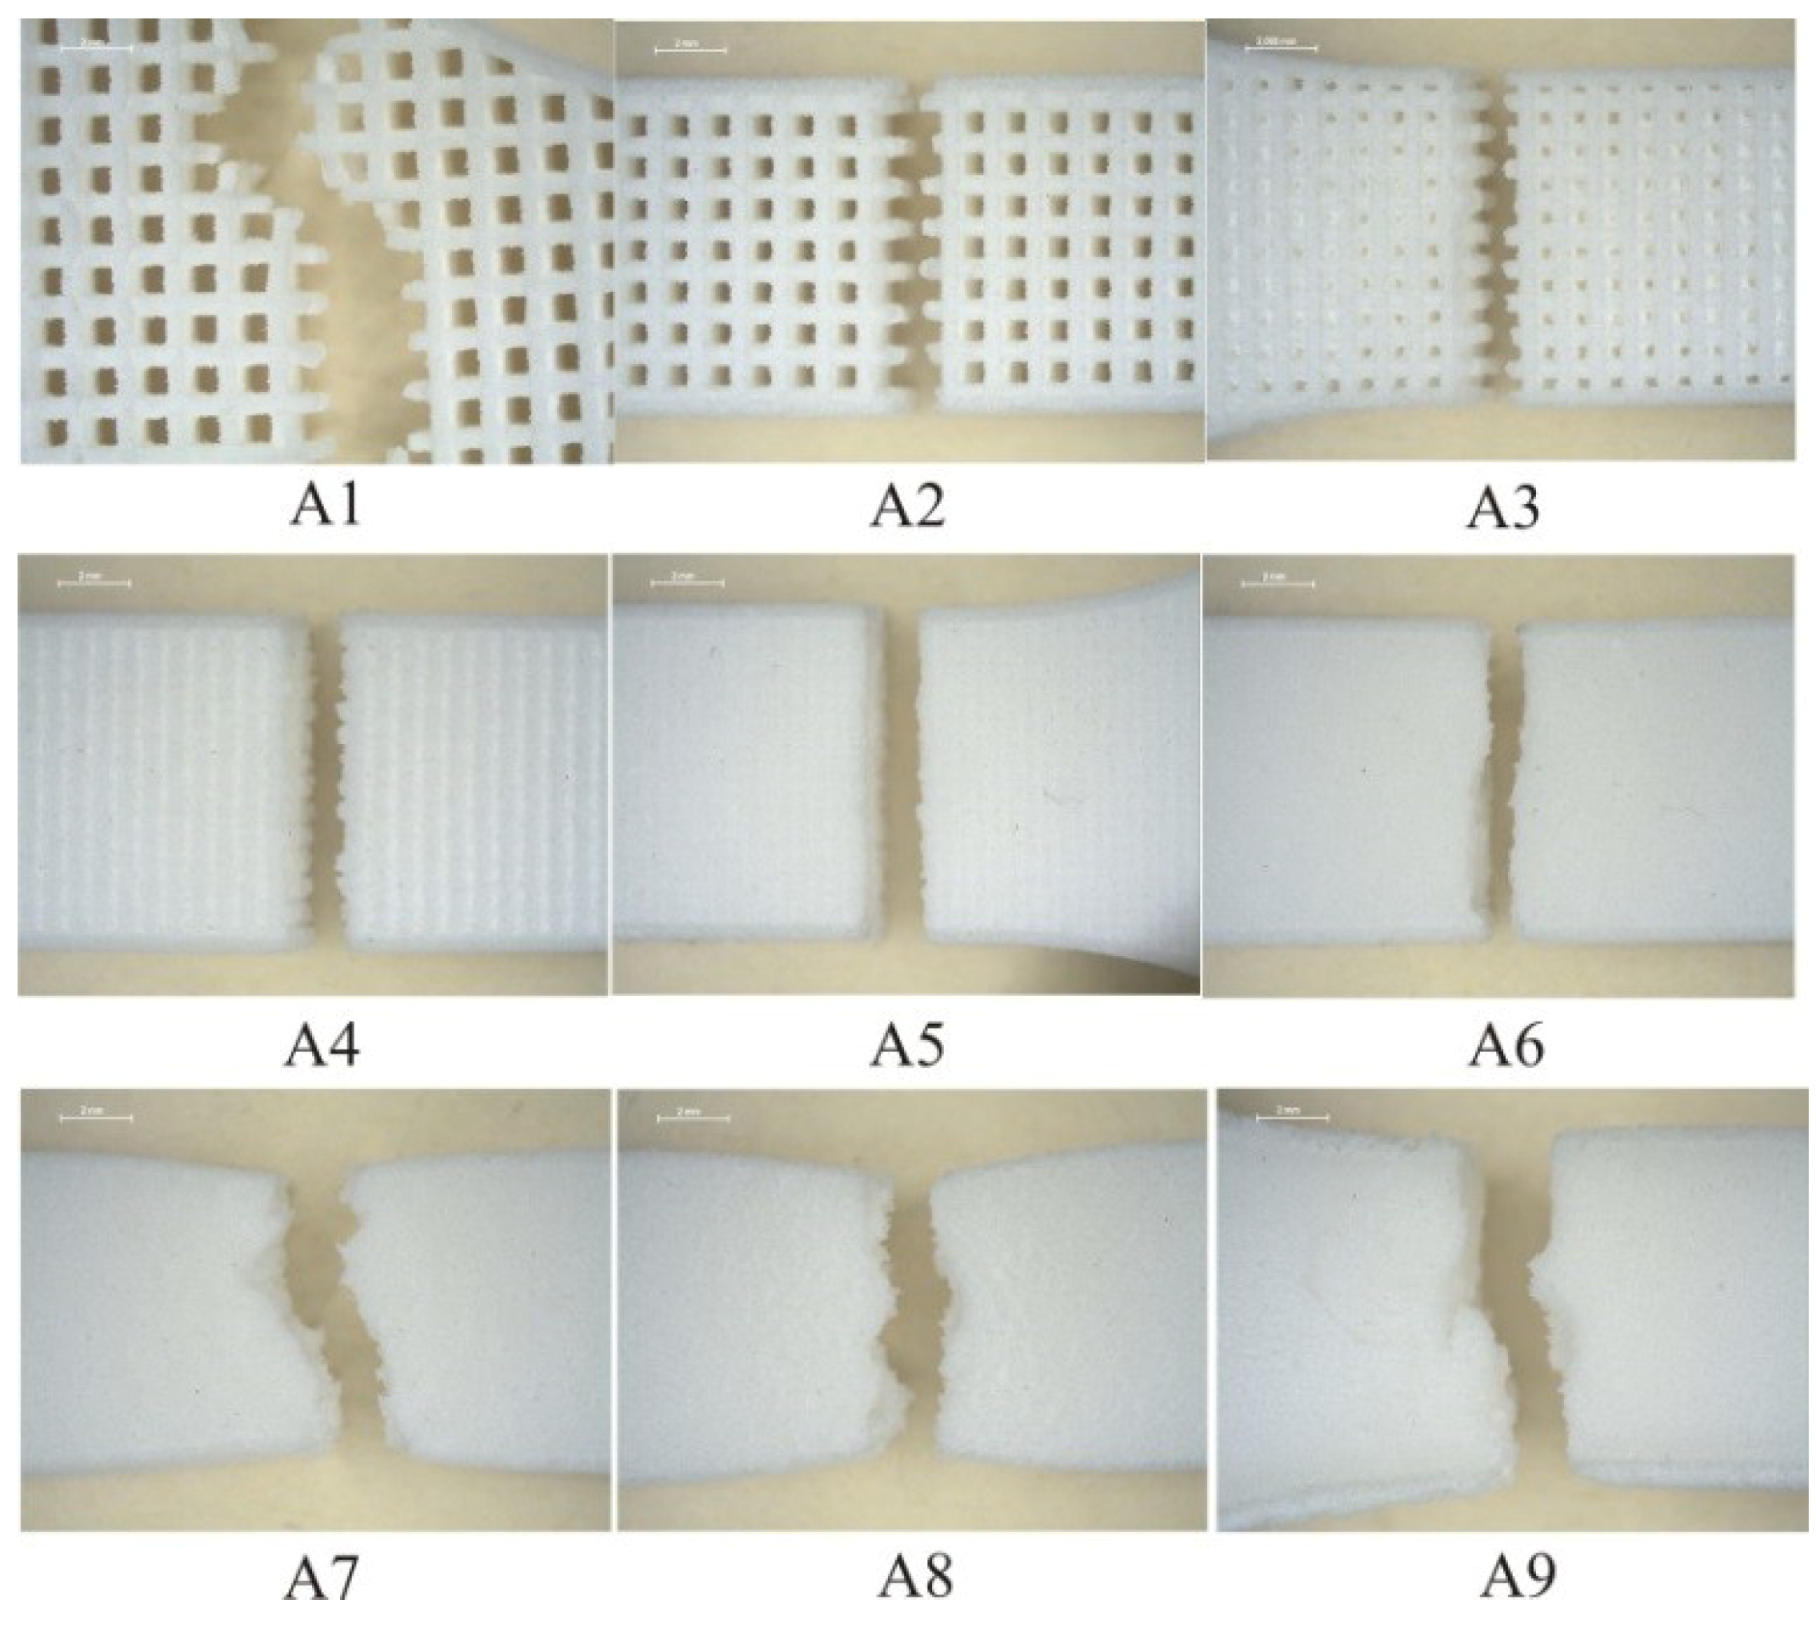
| No. | P, W | v, mm/s | h, mm | x | ED, J/mm2 |
|---|---|---|---|---|---|
| A1 | 21 | 2500 | 1.50 | 0.28 | 0.0016 |
| A2 | 21 | 2500 | 1.25 | 0.34 | 0.0023 |
| A3 | 21 | 2500 | 1.00 | 0.42 | 0.0035 |
| A4 | 21 | 2500 | 0.75 | 0.56 | 0.0063 |
| A5 | 21 | 2500 | 0.50 | 0.84 | 0.0141 |
| A6 | 21 | 2500 | 0.33 | 1.27 | 0.0324 |
| A7 | 21 | 2500 | 0.27 | 1.56 | 0.0484 |
| A8 | 21 | 2500 | 0.23 | 1.83 | 0.0667 |
| A9 | 21 | 2500 | 0.15 | 2.80 | 0.1568 |
| No. | h, mm | b, mm | A0, mm2 | Fm, N | Rm, MPa | εp, % | Rp, MPa | E, GPa |
|---|---|---|---|---|---|---|---|---|
| A1_1 | 4.15 | 9.92 | 41.17 | 90.6 | 2.2 | 1.47 | 1.87 | - |
| A1_2 | 4.18 | 9.94 | 41.55 | 101.0 | 2.43 | 1.65 | 1.35 | - |
| A1_3 | 4.18 | 9.9 | 41.39 | 85.1 | 2.06 | 1.68 | 1.43 | - |
| 4.17 | 9.92 | 41.37 | 92.2 | 2.23 | 1.6 | 1.55 | - | |
| S | 0.017 | 0.020 | 0.192 | 8.074 | 0.187 | 0.114 | 0.280 | - |
| A2_1 | 4.2 | 9.9 | 41.58 | 124.3 | 2.99 | 3.41 | 2.98 | - |
| A2_2 | 4.24 | 9.86 | 41.81 | 131.3 | 3.14 | 3.6 | 3.14 | - |
| A2_3 | 4.22 | 9.88 | 41.68 | 129.0 | 3.11 | 3.73 | 2.94 | - |
| 4.22 | 9.88 | 41.69 | 128.2 | 3.08 | 3.58 | 3.02 | - | |
| S | 0.020 | 0.020 | 0.113 | 3.543 | 0.079 | 0.161 | 0.106 | - |
| A3_1 | 4.2 | 9.9 | 41.58 | 141.8 | 3.41 | 4.52 | 3.25 | - |
| A3_2 | 4.26 | 9.86 | 42.00 | 147.9 | 3.52 | 4.68 | 3.48 | - |
| A3_3 | 4.44 | 9.85 | 43.74 | 155.9 | 3.57 | 4.75 | 3.44 | - |
| 4.3 | 9.87 | 42.44 | 148.5 | 3.5 | 4.65 | 3.39 | - | |
| S | 0.125 | 0.026 | 1.143 | 7.058 | 0.082 | 0.118 | 0.123 | - |
| A4_1 | 4.32 | 9.86 | 42.60 | 215.1 | 5.05 | 5.29 | 2.04 | 0.315 |
| A4_2 | 4.36 | 9.88 | 43.08 | 223.6 | 5.19 | 5.3 | 1.84 | 0.298 |
| A4_3 | 4.4 | 9.72 | 42.79 | 222.5 | 5.21 | 5.79 | 1.49 | 0.308 |
| 4.36 | 9.82 | 42.82 | 220.4 | 5.15 | 5.46 | 1.79 | 0.307 | |
| S | 0.040 | 0.087 | 0.242 | 4.615 | 0.087 | 0.286 | 0.278 | 0.009 |
| A5_1 | 4.06 | 9.9 | 40.19 | 744.0 | 18.51 | 5.88 | 18.42 | 0.8 |
| A5_2 | 4.08 | 9.86 | 40.23 | 754.3 | 18.75 | 5.96 | 18.69 | 0.837 |
| A5_3 | 4.07 | 9.79 | 39.85 | 748.4 | 18.78 | 5.92 | 18.66 | 0.838 |
| 4.07 | 9.85 | 40.09 | 748.9 | 18.68 | 5.92 | 18.59 | 0.825 | |
| S | 0.010 | 0.056 | 0.211 | 5.166 | 0.148 | 0.040 | 0.148 | 0.022 |
| A6_1 | 4.1 | 9.9 | 40.59 | 1744.6 | 42.98 | 18.25 | 41.01 | 1.511 |
| A6_2 | 4.06 | 9.92 | 40.28 | 1747.9 | 43.4 | 18.52 | 40.63 | 1.426 |
| A6_3 | 4.08 | 9.91 | 40.42 | 1735.6 | 42.92 | 18.31 | 40.67 | 1.518 |
| 4.08 | 9.91 | 40.43 | 1742.7 | 43.1 | 18.36 | 40.77 | 1.485 | |
| S | 0.020 | 0.010 | 0.157 | 6.379 | 0.262 | 0.142 | 0.209 | 0.051 |
| A7_1 | 4.2 | 10.0 | 42.00 | 1912.7 | 45.54 | 22.8 | 36.85 | 1.6 |
| A7_2 | 4.16 | 10.02 | 41.68 | 1918.7 | 46.03 | 23.02 | 36.98 | 1.587 |
| A7_3 | 4.03 | 9.98 | 40.22 | 1849.4 | 45.98 | 22.61 | 36.09 | 1.598 |
| 4.13 | 10.0 | 41.3 | 1893.6 | 45.85 | 22.81 | 36.64 | 1.595 | |
| S | 0.089 | 0.020 | 0.951 | 38.359 | 0.270 | 0.205 | 0.481 | 0.007 |
| A8_1 | 4.2 | 10.1 | 42.42 | 1950.9 | 45.99 | 21.5 | 37.85 | 1.798 |
| A8_2 | 4.2 | 10.12 | 42.50 | 1930.1 | 45.41 | 21.36 | 37.2 | 1.821 |
| A8_3 | 4.23 | 10.17 | 43.03 | 1948.0 | 45.28 | 21.52 | 37.03 | 1.784 |
| 4.21 | 10.13 | 42.65 | 1943.0 | 45.56 | 21.46 | 37.36 | 1.801 | |
| S | 0.017 | 0.036 | 0.328 | 11.260 | 0.378 | 0.087 | 0.433 | 0.019 |
| A9_1 | 4.9 | 10.9 | 53.41 | 1669.1 | 31.25 | 14.77 | 30.1 | 1.099 |
| A9_2 | 4.92 | 10.92 | 53.73 | 1656.4 | 30.83 | 14.25 | 29.82 | 1.115 |
| A9_3 | 4.94 | 10.88 | 53.75 | 1663.6 | 30.95 | 15.56 | 29.84 | 1.038 |
| 4.92 | 10.9 | 53.63 | 1663.0 | 31.01 | 14.86 | 29.92 | 1.084 | |
| S | 0.020 | 0.020 | 0.191 | 6.357 | 0.216 | 0.660 | 0.156 | 0.041 |
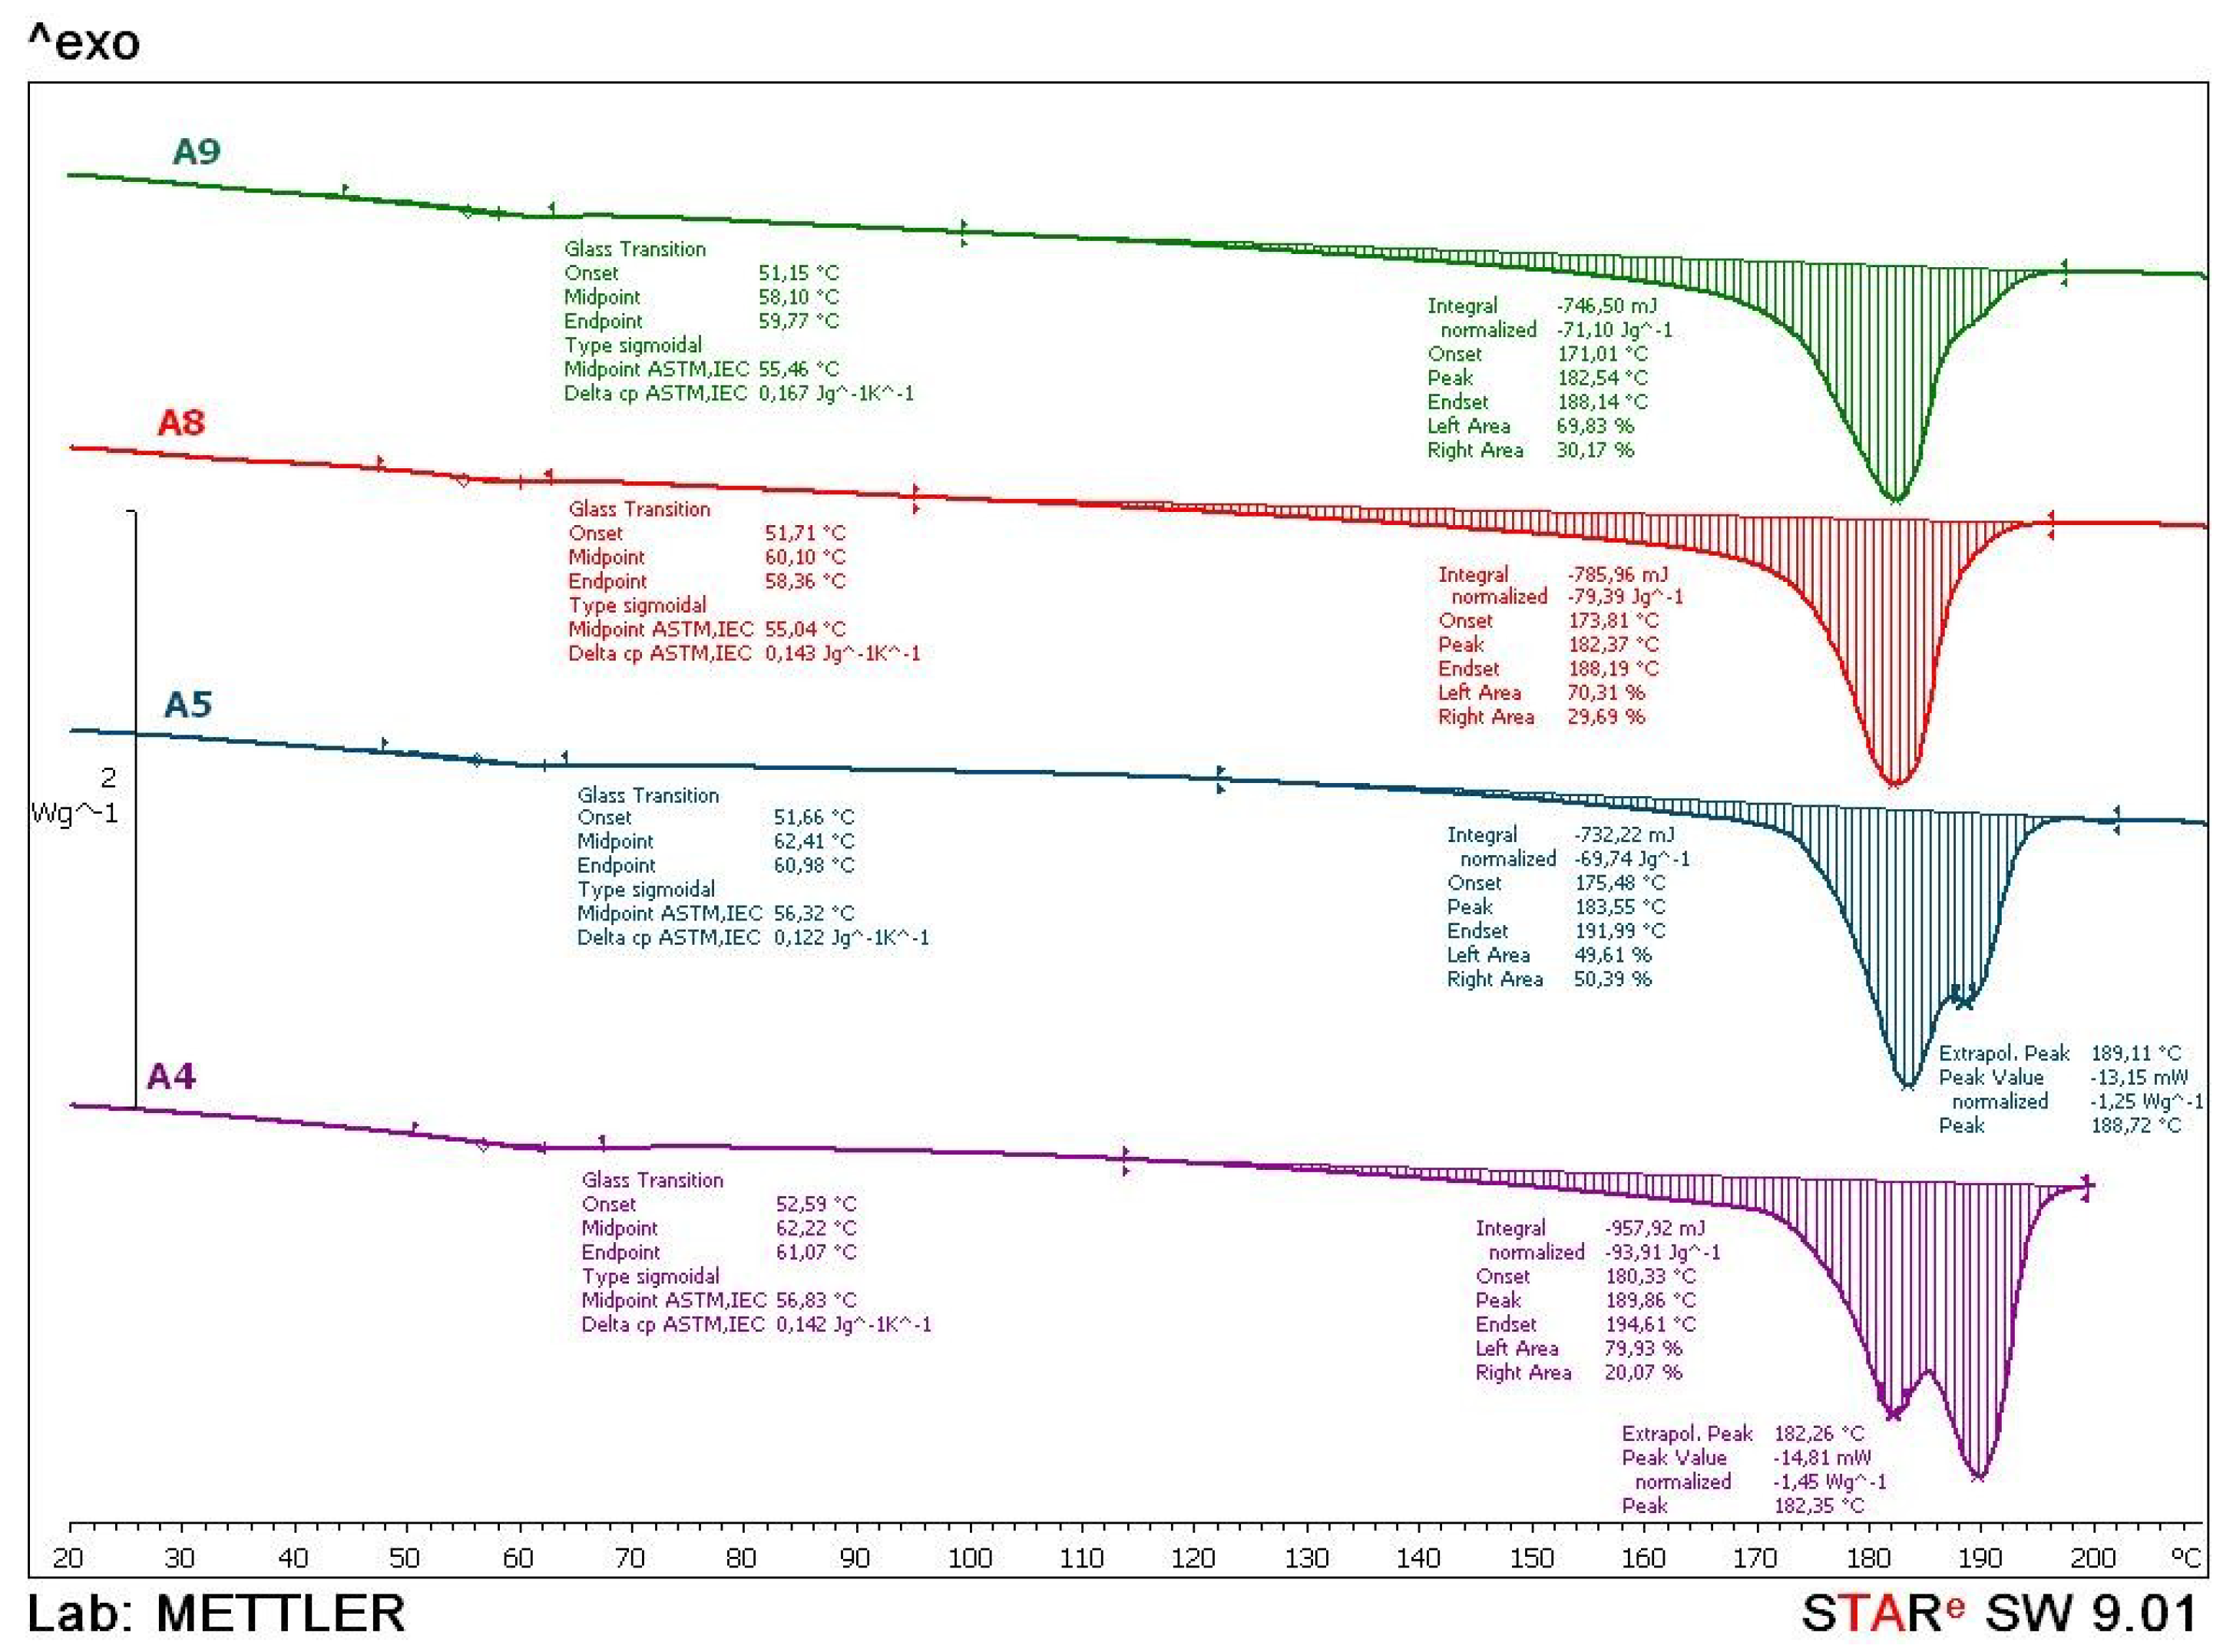
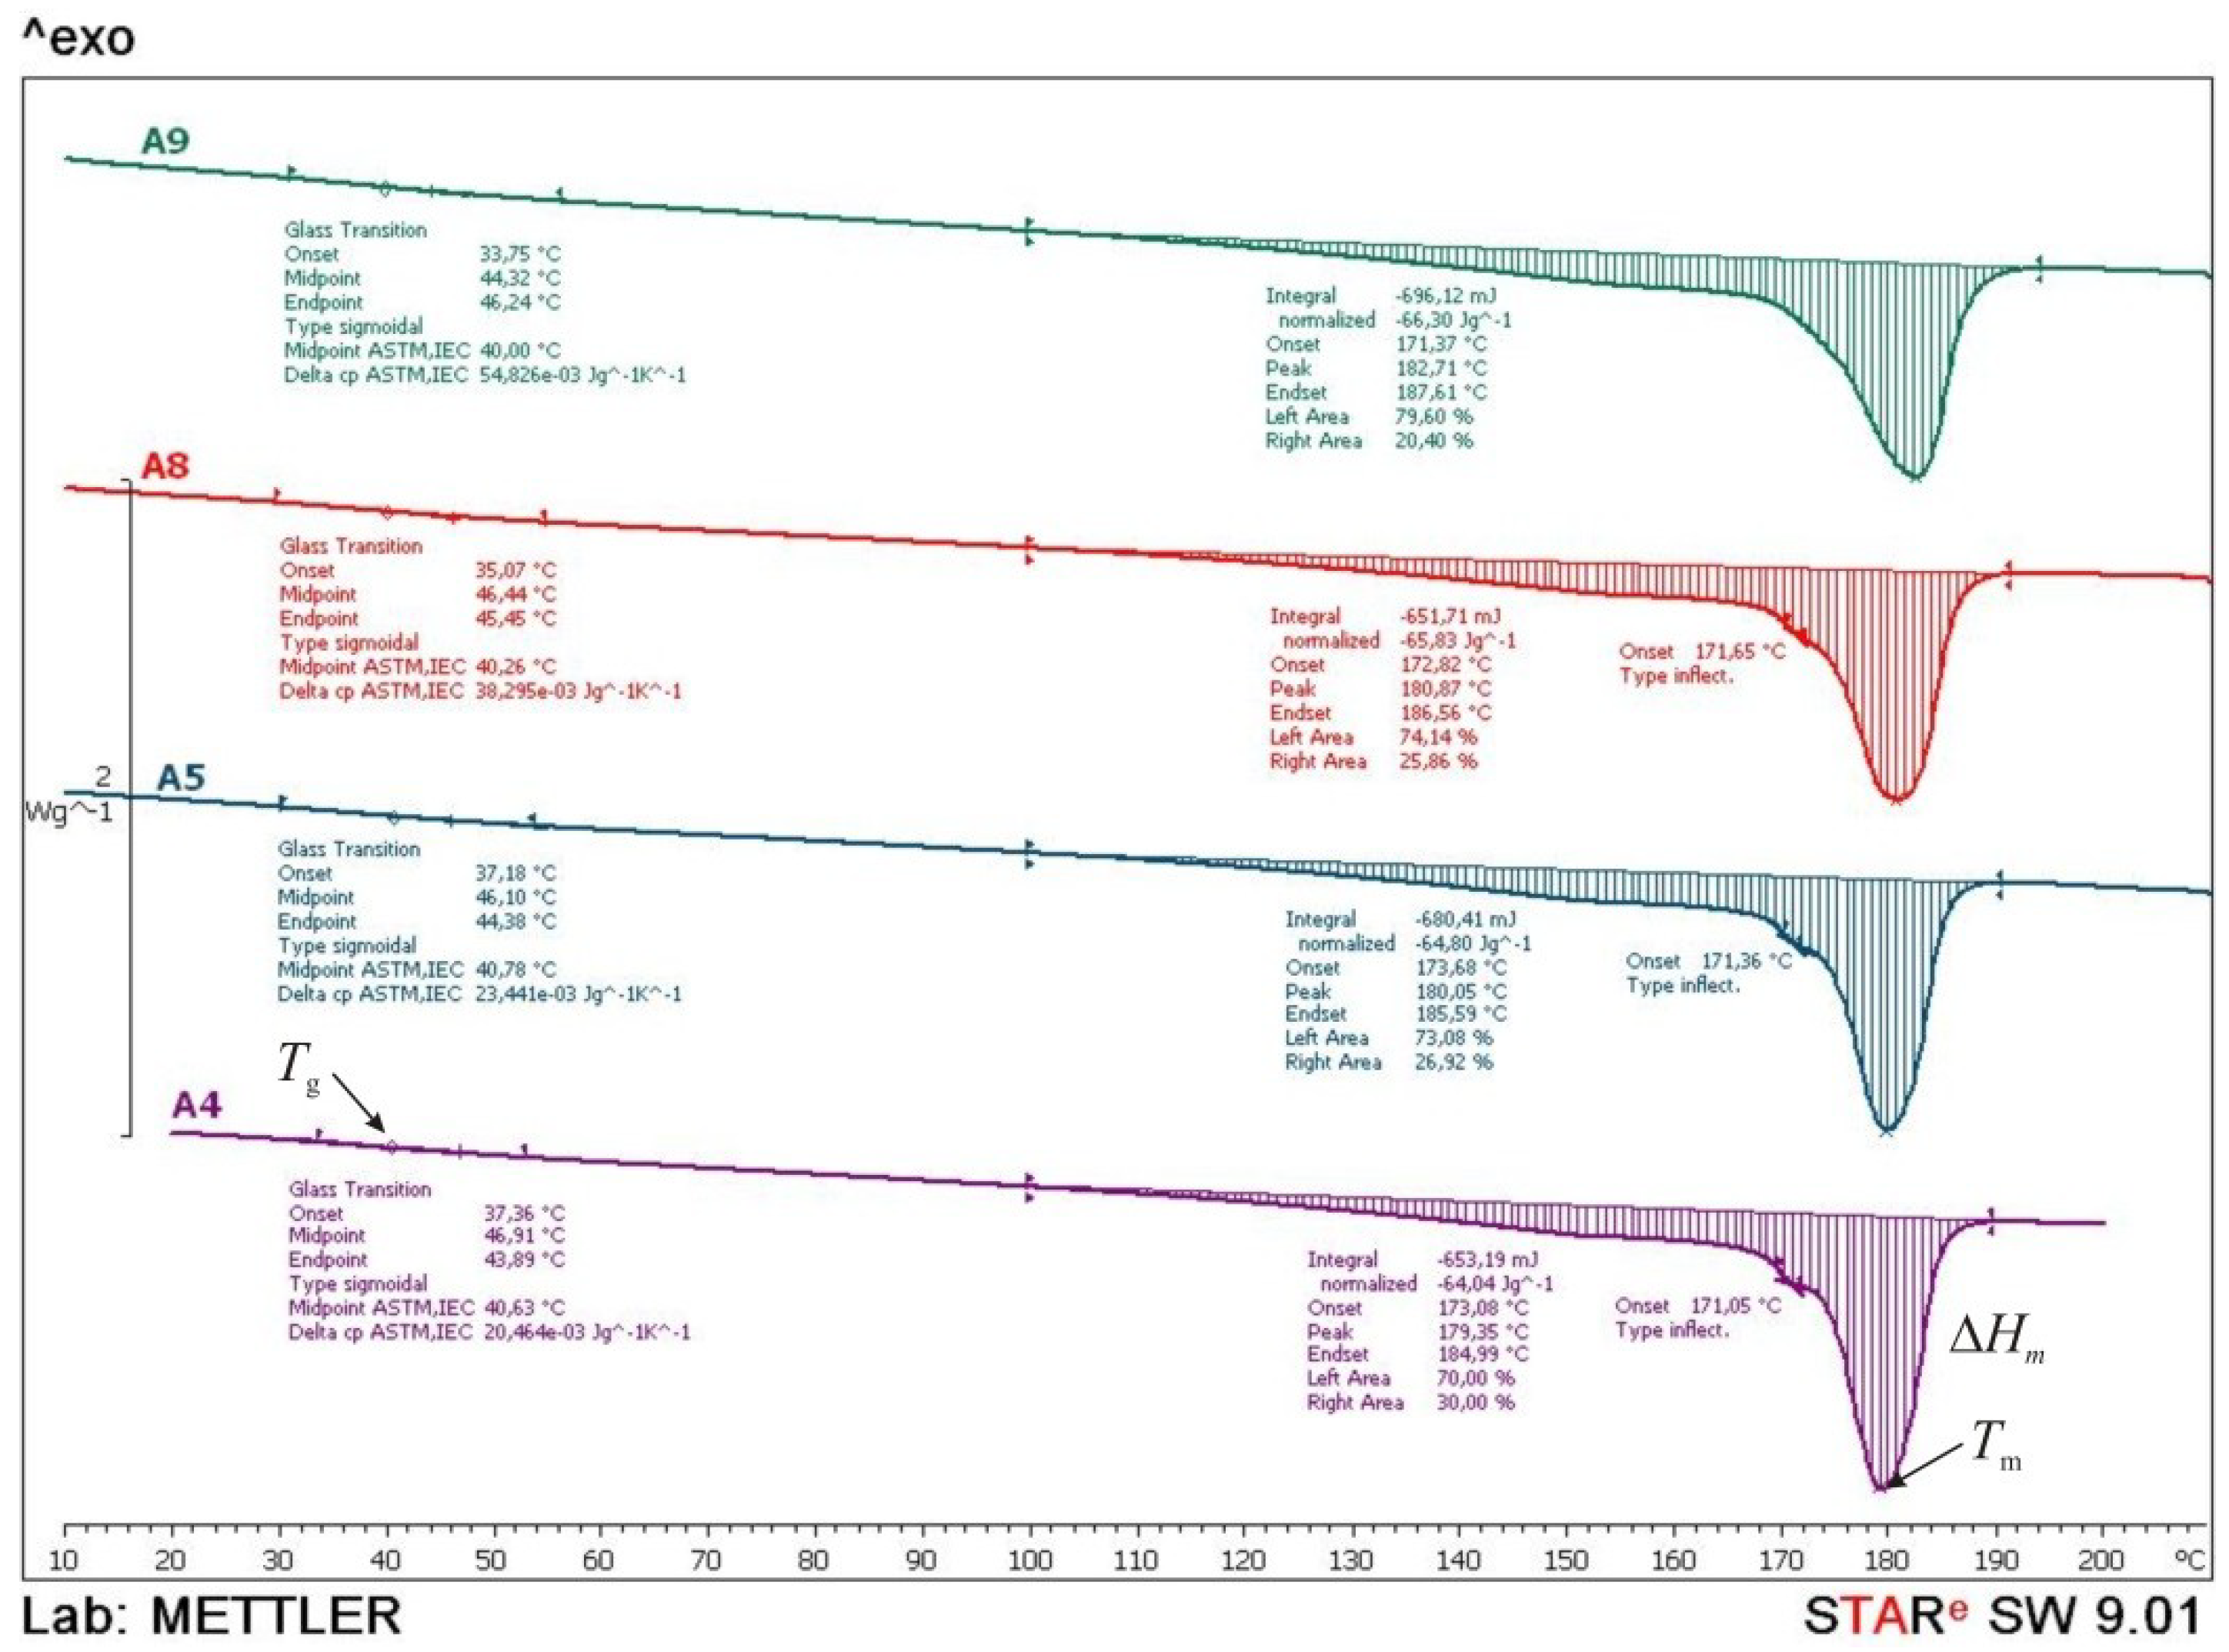
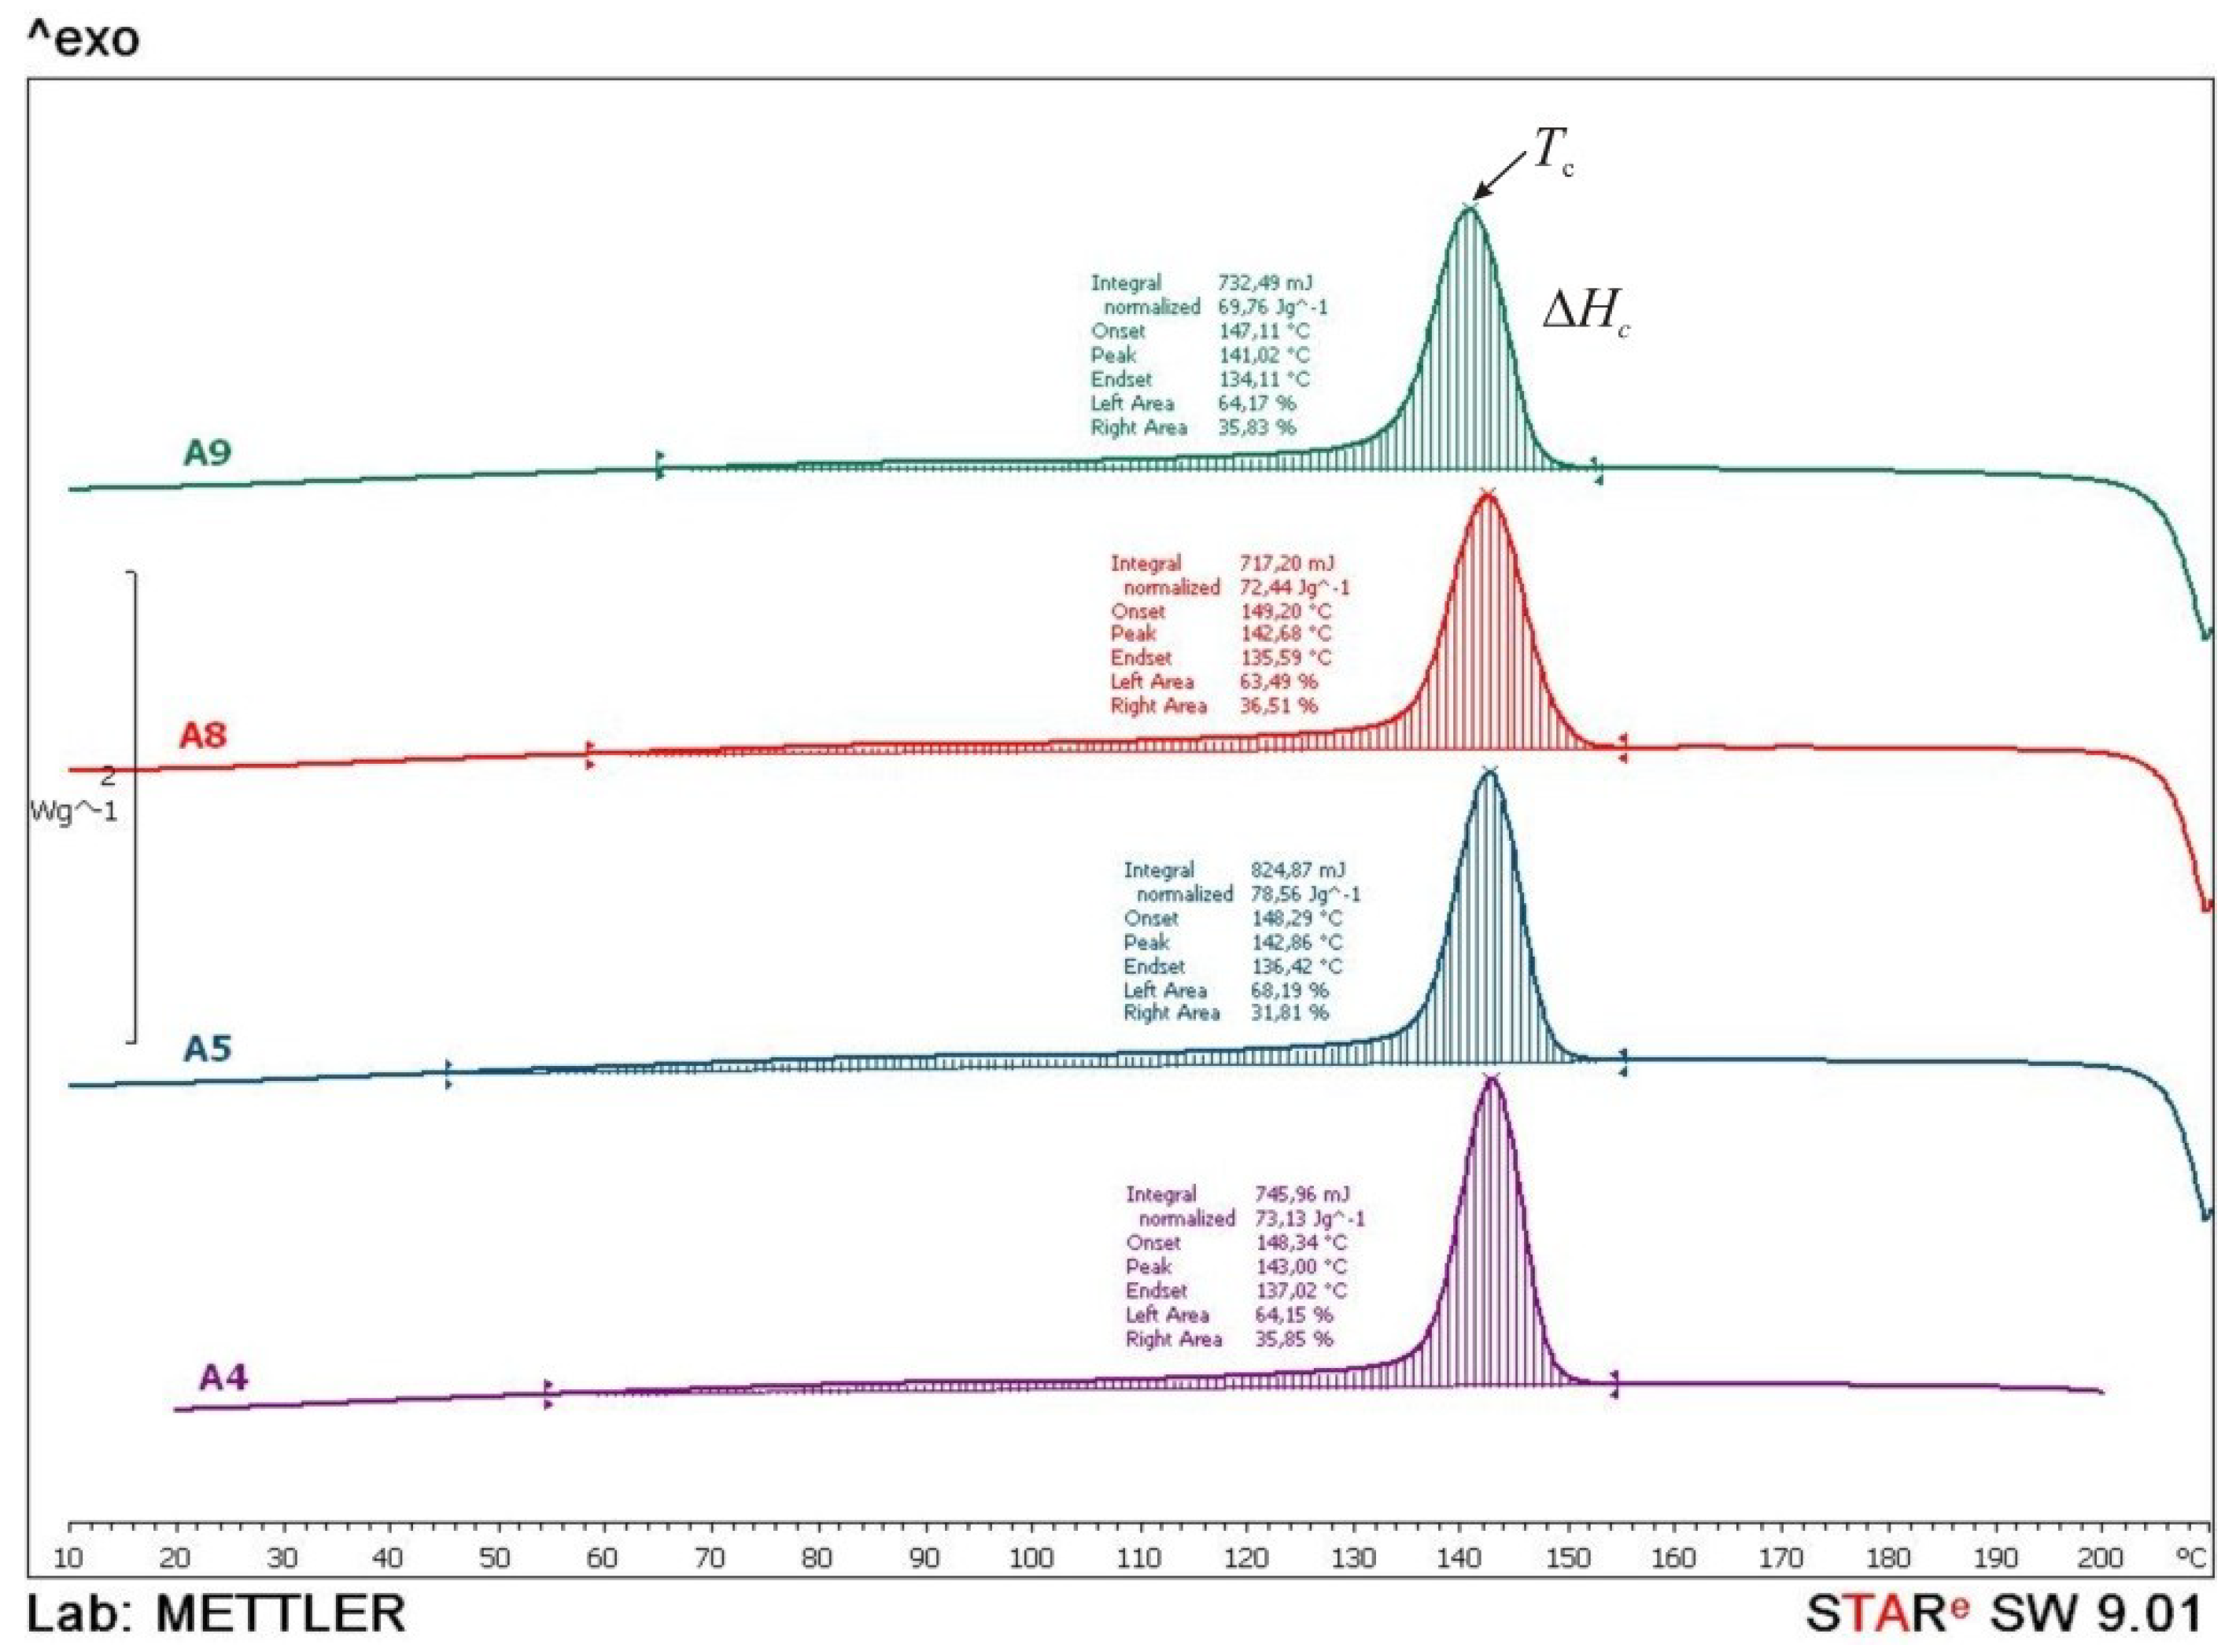
| No. | 1. Heating Cycle (Figure 14) | 2. Heating Cycle (Figure 15) | Cooling Cycle (Figure 16) | |||||
|---|---|---|---|---|---|---|---|---|
| Tg (°C) | Tm (°C) | ΔHm (J/g) | Tg (°C) | Tm (°C) | ΔHm (J/g) | Tc (°C) | ΔHc (J/g) | |
| A4 | 56.8 | 182.4 189.9 | 93.9 | 40.6 | 179.4 171.1 | 64.0 | 143.0 | 73.1 |
| A5 | 56.3 | 183.6 188.7 | 69.7 | 40.8 | 180.1 171.4 | 64.8 | 142.9 | 78.6 |
| A8 | 55.0 | 182.4 | 79.4 | 40.3 | 180.9 171.7 | 65.8 | 142.7 | 72.4 |
| A9 | 55.5 | 182.5 | 71.1 | 40.0 | 182.7 171.0 | 66.3 | 141.0 | 69.8 |
© 2018 by the authors. Licensee MDPI, Basel, Switzerland. This article is an open access article distributed under the terms and conditions of the Creative Commons Attribution (CC BY) license (http://creativecommons.org/licenses/by/4.0/).
Share and Cite
Pilipović, A.; Brajlih, T.; Drstvenšek, I. Influence of Processing Parameters on Tensile Properties of SLS Polymer Product. Polymers 2018, 10, 1208. https://doi.org/10.3390/polym10111208
Pilipović A, Brajlih T, Drstvenšek I. Influence of Processing Parameters on Tensile Properties of SLS Polymer Product. Polymers. 2018; 10(11):1208. https://doi.org/10.3390/polym10111208
Chicago/Turabian StylePilipović, Ana, Tomaž Brajlih, and Igor Drstvenšek. 2018. "Influence of Processing Parameters on Tensile Properties of SLS Polymer Product" Polymers 10, no. 11: 1208. https://doi.org/10.3390/polym10111208
APA StylePilipović, A., Brajlih, T., & Drstvenšek, I. (2018). Influence of Processing Parameters on Tensile Properties of SLS Polymer Product. Polymers, 10(11), 1208. https://doi.org/10.3390/polym10111208