Review

Ferroelectric Liquid Crystals: Physics and Applications

1
School of Instrumentation and Optoelectronic Engineering, Beihang University, Beijing 100191, China
2
National Laboratory of Solid State Microstructures, Nanjing University, Nanjing 210093, China
3
School of Physics and Optoelectronic Engineering, Foshan University, Foshan, Guangdong 528325, China
4
State Key Laboratory on Advanced Displays and Optoelectronics Technologies, HKUST, Hong Kong
5
M. V. Lomonosov Moscow State University, 119991 Moscow, Russia
6
National Research Nuclear University MEPhI (Moscow Engineering Physics Institute), 115409 Moscow, Russia
*
Author to whom correspondence should be addressed.
Crystals 2019, 9(9), 470; https://doi.org/10.3390/cryst9090470
Submission received: 23 July 2019 / Revised: 21 August 2019 / Accepted: 6 September 2019 / Published: 9 September 2019
(This article belongs to the Special Issue Liquid Crystal Optics and Physics: Recent Advances and Prospects)

Abstract

:
Electrooptic modes with fast response and high contrast ratio are highly desirable in modern photonics and displays. Ferroelectric liquid crystals (FLCs) are especially promising for fulfilling these demands by employing photoalignment technology in FLC cells. Three electrooptic modes including surface stabilized FLC (SSFLC), deformed helix ferroelectric (DHF) mode, and electrically suppressed helix (ESH) mode are reviewed with the corresponding electrooptic effects like bi- and multi-stable switching, continuous modulation of grayscale or phase, and high contrast switching. The general operation principles FLC electrooptic modes are described, and then the characteristics of each modes for potential applications are summarized. With the advantages of controllable anchoring energy, the photoalignment provides FLC samples with uniform alignment and high contrast ratio. The fast FLCs with a high resolution and high contrast can be used in the next generation display including field sequential color FLC microdisplays, as well as switchable 2D/3D televisions.

1. Introduction

High speed, low power consumption, high resolution and high contrast ratio are in high demand for next generation displays [1,2,3,4] and modern photonic devices [5,6,7]. However, in terms of response time, liquid crystals (LCs) still have huge space to be improved compared with the competing technologies, such as micro-electro-mechanical system (MEMS) [8] or micro-LED [9]. A fast response time is needed in order to reduce motion blur, achieve field sequential color (FSC), and improve the low-temperature operation. The target response time for FSC displays should be less than 1 ms (240 Hz frame frequency) to provide a high resolution, low power consumption and extended color gamut liquid crystal display (LCD) [3]. Also, versatile photonic devices, in which the 2π modulation is of crucial importance such as liquid crystal lenses [10], tunable focusers [11], and wave front correctors [12] requires fast response with thick LC layers. Therefore, many efforts are in progress to improve the response time of various LC electrooptic modes, e.g., polymer-stabilized blue phase mode [13,14,15], flexoelectric optical effect [4,16,17]. However, display devices using the blue phase LC have yet to be commercialized due to limitations such as low transmittance, a narrow operating temperature range, and a high driving voltage of over 50 V for example. Flexoelectric effect in short pitch cholesteric LCs demonstrates fast response of 200 μs, but confronts limits of complicated fabrication procedure. Ferroelectric liquid crystals (FLCs), also known as chiral smectic C or smectic C* phase, with their fast speed and low power consumption represent the most promising candidate.
There are several basic arrangements of FLC directors resulting in a variety of electrooptical effects. One of the well-known arrangements is in surface stabilized geometry proposed by Clark and Lagerwall in 1980 [18,19]. Although subsequent papers contribute to different aspects of Clark-Lagerwall effect, such as the character of defects and disclination lines, etc., its applications are hindered by the crucial dependence of surface treatment [20]. This problem can be effectively solved by a photoalignment technology and achieve high-quality of FLC alignment on sufficiently large surface area [21]. The asymmetric boundary conditions, in which only one substrate is covered by aligning layer, are preferable for achievement of high uniformity of FLC layer. Moreover, the photo-aligning layer with optimal thickness of around 3–5 nm provides both the highest multiplex operation steadiness and the best contrast ratio of FLC cells [22,23].
In this paper, we review the recent advances in FLC electrooptic modes and their applications. Three electrooptic modes including surface stabilized FLC (SSFLC), deformed helix ferroelectric (DHF) mode, and electrically suppressed helix (ESH) mode are reviewed with the corresponding electrooptic effects like bi- and multistable switching, continuous modulation of grayscale or phase, and high contrast switching. For each of these FLC modes, we first describe the general operation principles, and then compare their pros and cons for different aspects of applications.

2. Operation Principle of Electrooptic Modes in FLCs

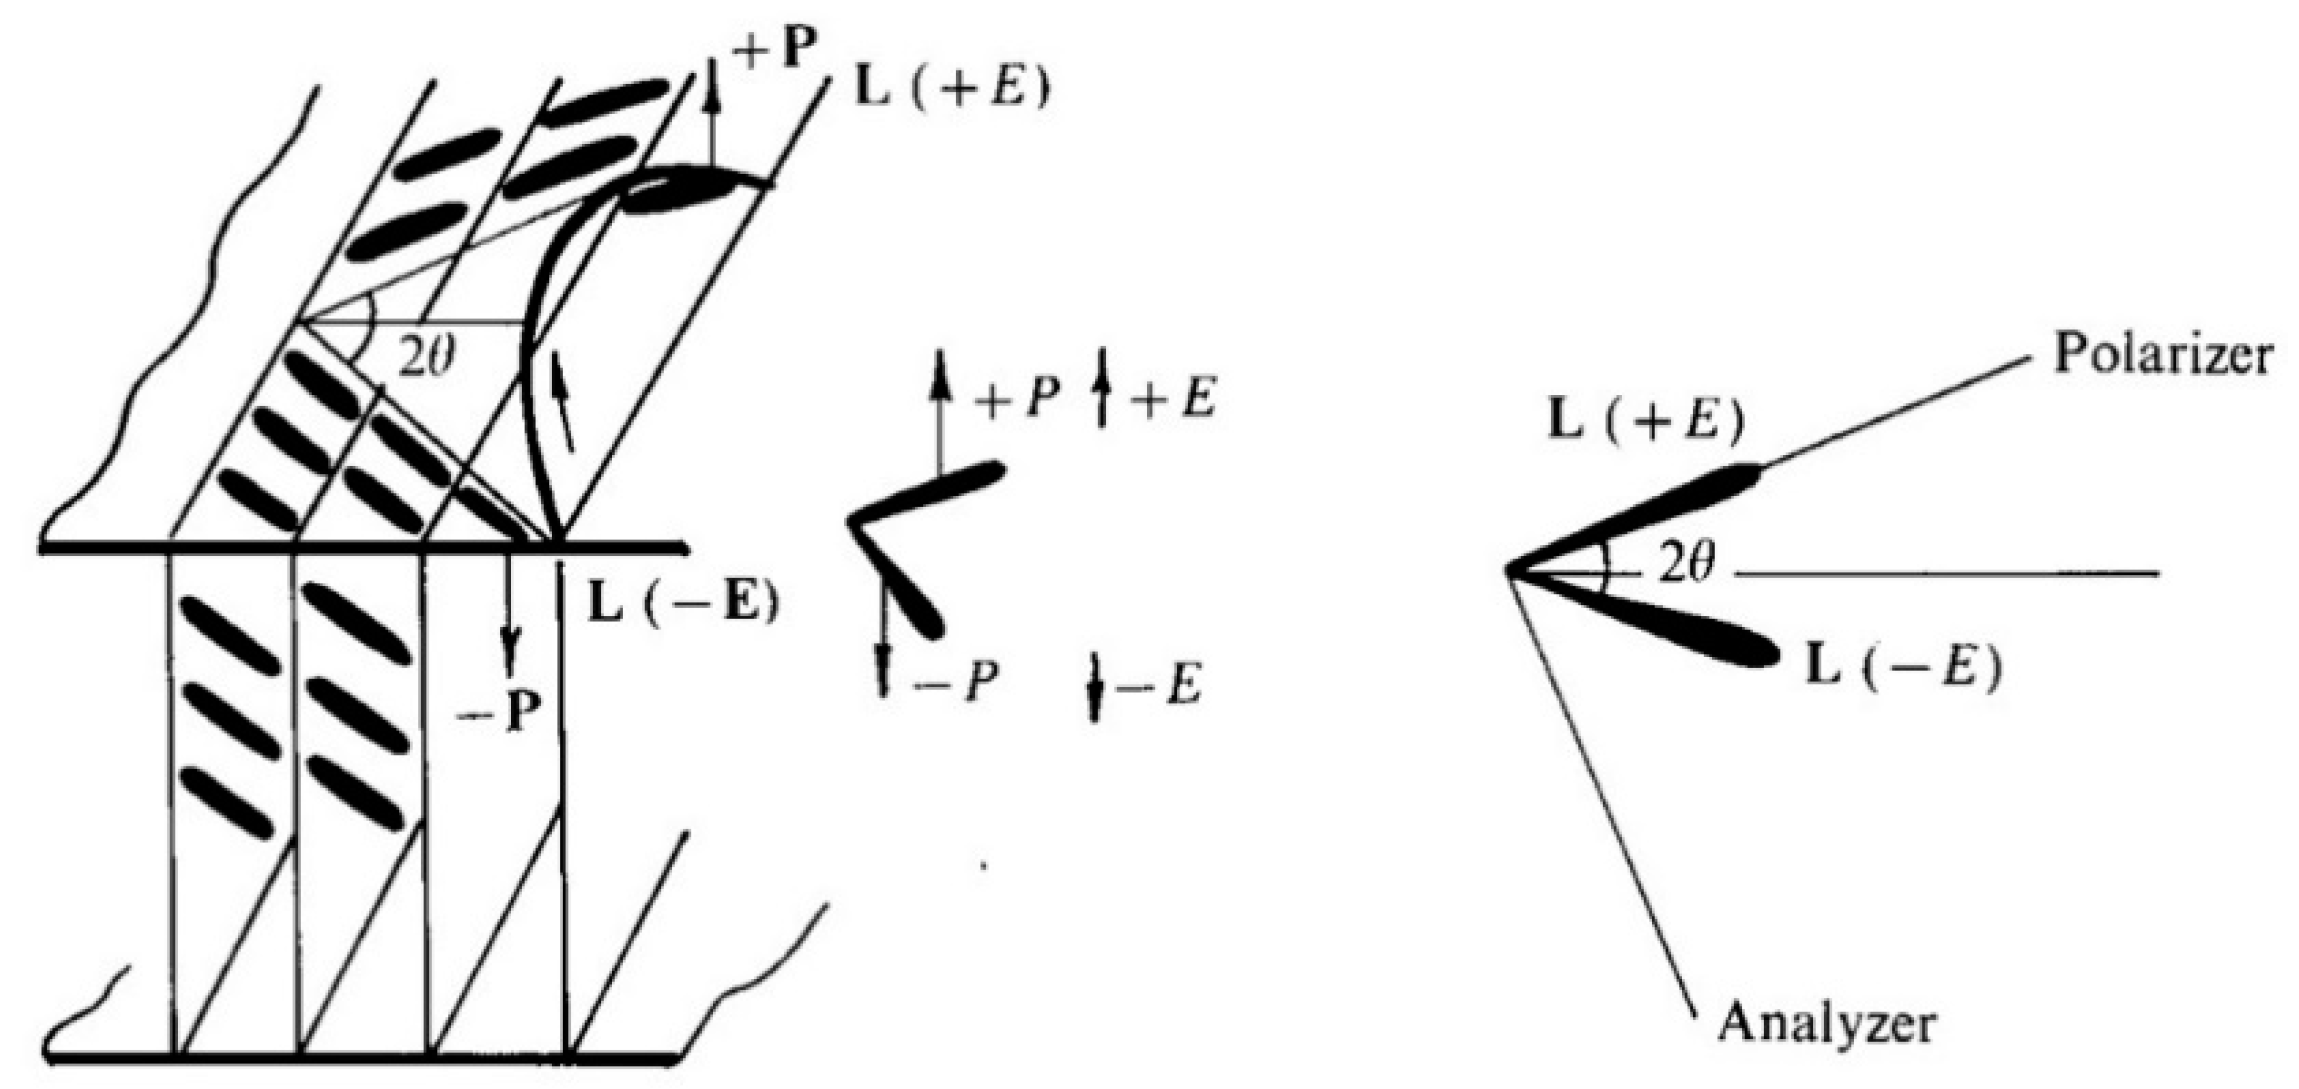
2.1. Surface Stabilized FLC (SSFLC) Mode

The surface stabilized geometry proposed by Clark and Lagerwall [18], as shown in Figure 1, is characterized by the electrooptical phenomena that director reorientation from one bistable state to the other when an external electric field changes its sign. In this geometry, the FLC smectic layers are arranged perpendicular to the substrates and the helical structure are totally unwound by substrate surface and strong anchoring. The uniaxial phase plates are formed with two possible final director orientations corresponding to the polarities of the electric field E. The electric torque due to the interaction between spontaneous polarization PS and electric field E switches one final director orientation to the other. One necessary condition for the existence of SSFLC is d << P0, where d is the FLC layer thickness and P0 is the helical pitch, and we come to the situation that the helix is totally unwound by the surfaces.
In SSFLC regime, the switching time shows τγϕ, where γϕ is FLC rotational viscosity, PS is the FLC spontaneous polarization, and E is applied electric field (Figure 1) [18,19]. Comparing the rise time τr and decay time τd in nematics (N) and ferroelectric liquid crystals (FLC):
τ r ( N ) 4 π γ 1 / Δ ε E 2 ,
τ d ( N ) d 2 γ 1 / K π 2 ,
τ r ( F L C ) = τ d ( F L C ) γ φ / P S E ,
where K is the elastic constant of nematics, γ1 is the rotational viscosity of nematics, d is the layer thickness, PS is spontaneous polarization, and E is electric field. From Equation (1) to (3), we can draw the conclusion that the response time of SSFLC under electrical driving shows at least two orders faster than that of nematic LCs. Moreover, the decay time of nematics τd(N), as described by Equation (2), sets the main limit, since it cannot be optimized by electric field E.
In SSFLC regime, when the FLC cell is placed between crossed polarizers with one of the final director orientations parallel to the polarizer as shown in Figure 1, the maximum modulation of transmittance is achieved and described as:
I = sin 2 ( 4 θ ) sin 2 ( Δ Φ / 2 ) ,
where ΔΦ = Δnd2π/λ is the phase retardation caused by the optical anisotropy Δn = n|| − n of FLC, and θ is the tilt angle of smectic layer. From Equation (4), it is indicated that the transmittance gets to the maximum value when θ = π/8 (22.5°) and Δnd/λ = 1/2 are simultaneously satisfied. For Δn = 0.125 and λ = 0.5 μm, it gives d ≈ 2 μm. The small deviation of the thickness, for instance Δd = λ/8Δn, leads to considerable fluctuation of the electrooptical response (Figure 2) [20]. The criteria for a display device require d = 2 ± 0.2 μm.
The issues of SSFLC include severe restrictions to the optimal layer thickness, complicated surface treatment for defect-free samples, and no grey scale. The last issue is one of the most crucial factors in display applications [18,19,20]. The incapability of generating grayscale by using voltage amplitude hinders Clark-Lagerwall effect from applied in displays devices, leading the possibility for grayscale goes to the pulse width modulation.

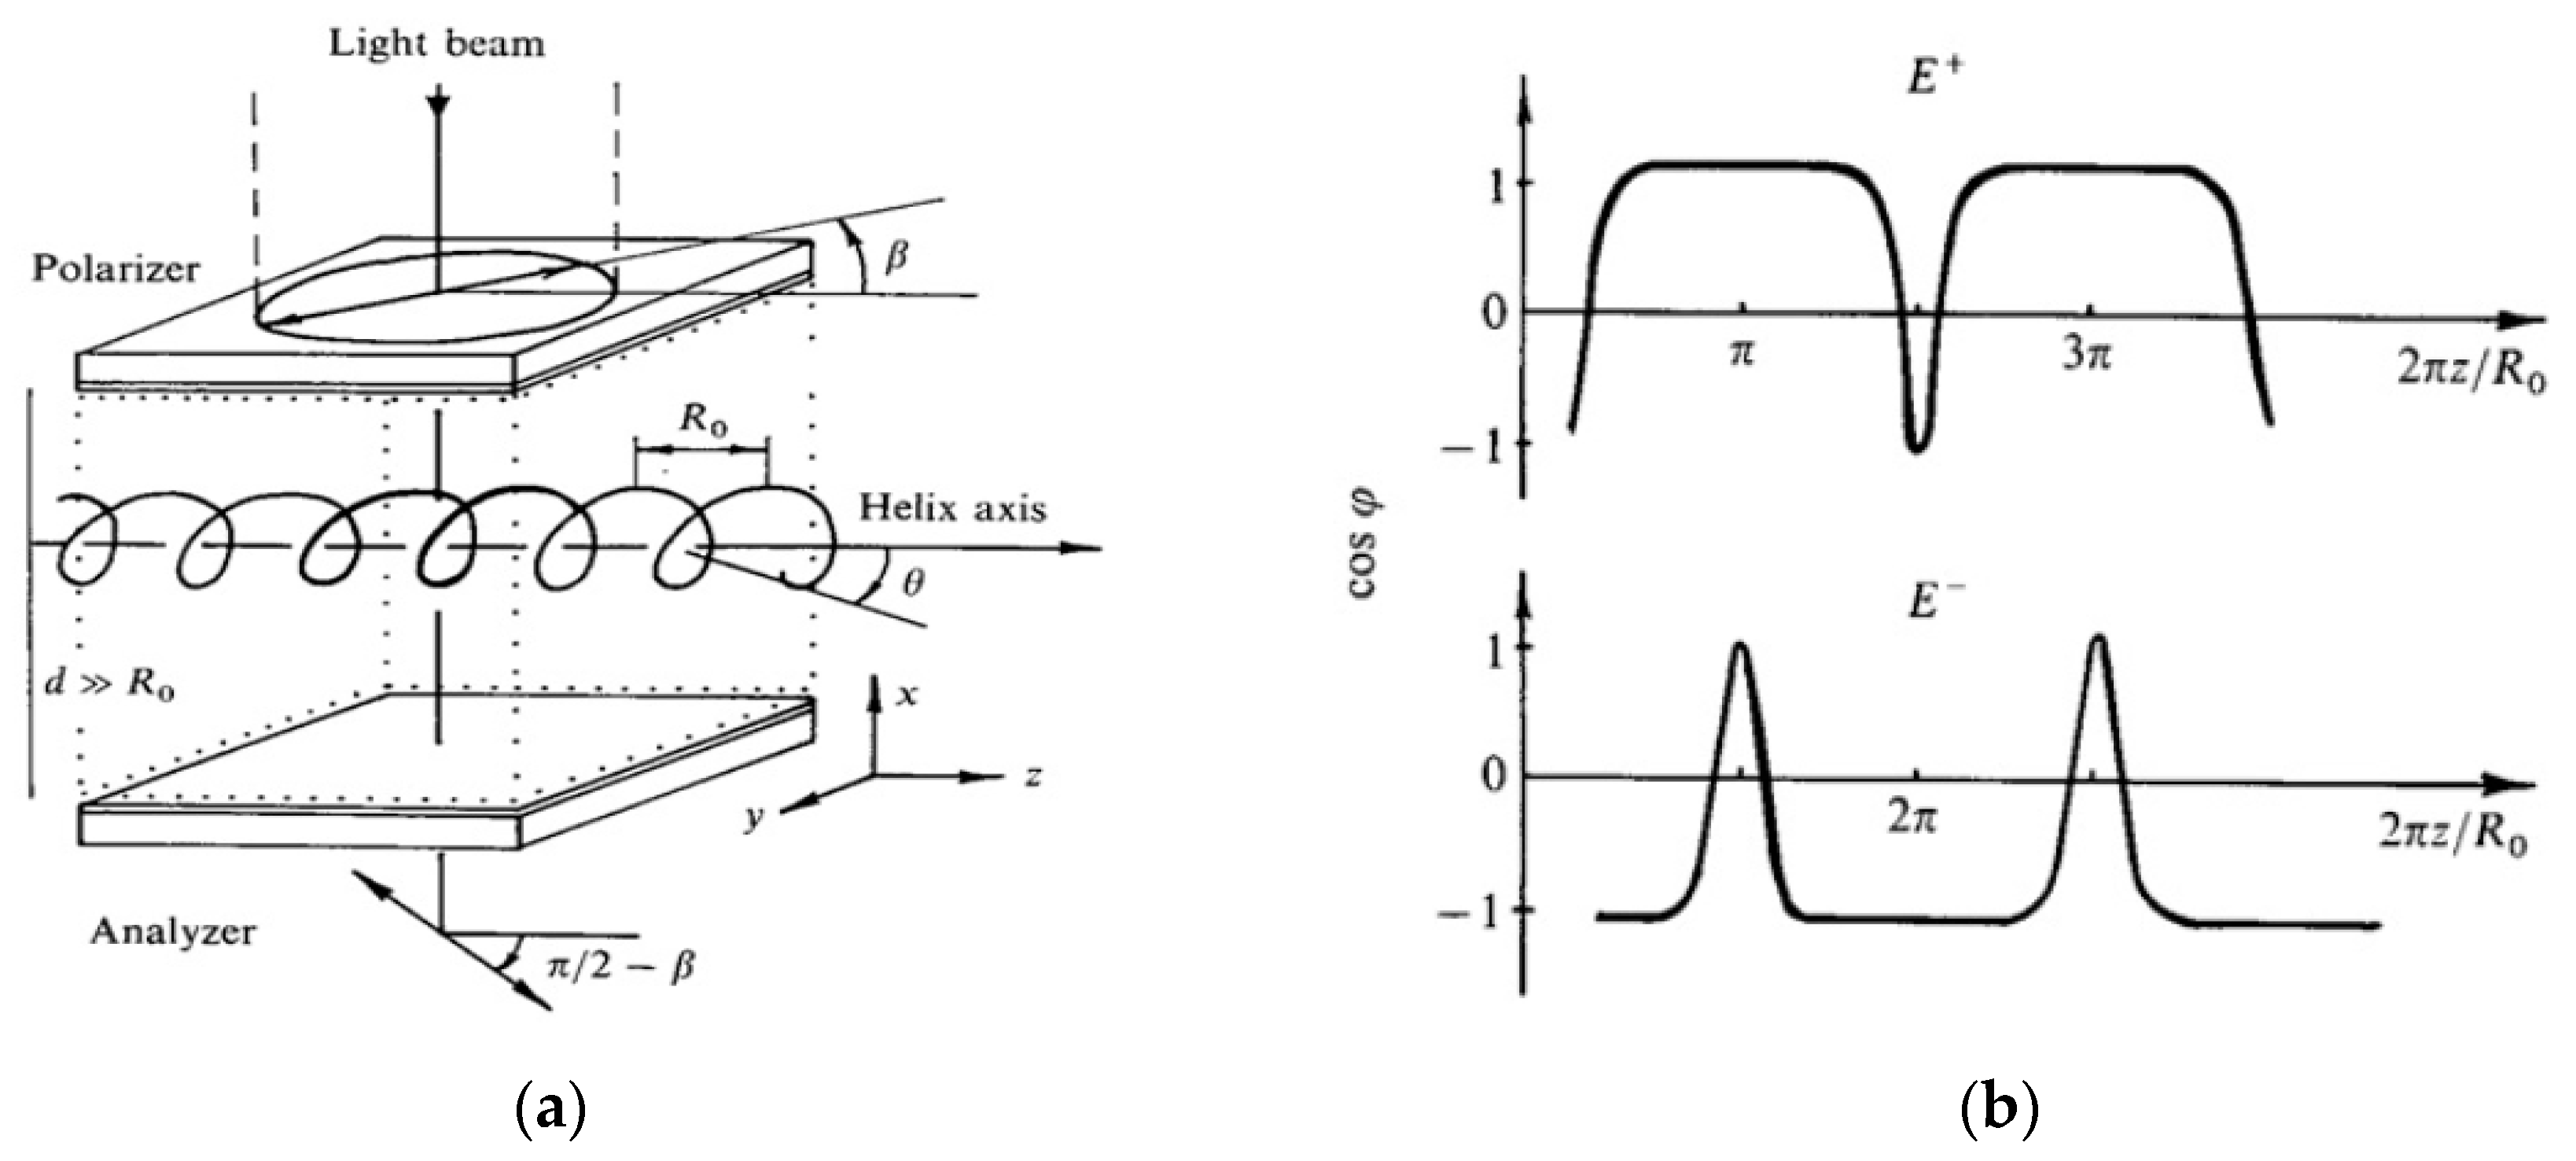
2.2. Deformed Helix Ferroelectric (DHF) Mode

The schematics of DHF electrooptic mode is described in Figure 3a. One necessary condition for the existence of DHF is that the layer thickness is much higher than the value of the helix pitch d >> P0 [20]. For planar aligned geometry with smectic layers perpendicular to the substrates, the FLC helical structure becomes deformed by applied electric field. Thus, the corresponding director distribution oscillates symmetrically in ± E electric fields [20]. These oscillations result in a variation of the effective refractive index and electrically controlled birefringence.
When the light beam with the aperture a >> P0 propagates through DHF sample placed between crossed polarizers, the alignment orientation is set with an angle β deviating from the polarizer. The director distribution is described using azimuthal angle φ, which varies along the coordinate z parallel to the helical axis, as shown in Figure 3b. The effect takes place up to the fields of FLC helix unwinding [20]:
E U = π 2 16 K 22 q 0 2 P S ,
where K22 is FLC twist elastic constant, q0 = 2π/P0 is the helix wave vector, and PS is the spontaneous polarization.
The characteristic response time τ of the effect in small fields E/EU << 1 are independent of the FLC polarization Ps and the field E, and defined only by the rotational viscosity γϕ, and the helix pitch P0:
τ = γ φ K 22 q 0 2 ,
The dependence Equation (6) is valid only in DHF regime where E << EU. If E is close to the unwinding field EU, the FLC helix becomes strongly deformed with the helical pitch P sharply increases P >> P0, and response time τEδ, where 0 < δ < 1 [24,25]. Consequently, the time of the helix relaxation τd to the initial state also rises. It is reported that memorable state is observed for E comparable with Eu, and the electrooptic switching shows pronounced hysteresis when E approaches Eu [26].
In the cases that the helix in FLC samples are slightly deformed by electric field (E << EU), it exhibits symmetric electrooptic switching, as shown in Figure 4. The ferroelectric LC cells with the response time less than one millisecond in a broad temperature range from 20 to 80 °C were reported [27].
The transmission of DHF sample between crossed polarizers depends on the phase retardation as well as the optical axis deflection:
I = sin 2 ( π Δ n ( z ) d λ ) sin 2 ( 2 ( β α ( z ) ) ) ,
where α represents the deflection of helical axis, defined as the angle between the projection of the optical axis and z-axis on the yz-plane:
α = arctan ( tan θ cos φ ( z ) ) .
The effective birefringence is Δn(z) = neff(z) − n, where the effective refractive index:
n e f f = n n / [ n 2 + ( n 2 n 2 ) sin 2 θ sin 2 φ ] 1 / 2
Diffraction of light due to the helical structure is avoided, because the helical pitch is minimized P0 ∝ 0.1–0.3 μm < λ = 0.5 μm for visible range.
In the case of small angles |θ| << 1, the transmission in Equation (7) can be expanded in θ series:
I ( sin 2 2 β 2 θ sin 4 β cos φ + 4 θ 2 cos 4 β cos 2 φ ) sin 2 π Δ n d / λ ,
As shown in [29] for the small values of the applied field cosϕE/EU and changes its sign for the field reversal E ⇒ −E (Figure 3). Thus, according to Equation (10) for sin4β = 0 we have a quadratic grey scale:
Δ I θ 2 cos 2 φ θ 2 E 2 / E U 2 ,
To obtain a linear relationship of gray level and θ, as illustrated by Equation (10), the quadratic component is excluded by setting cos4β = 0.
Δ I θ cos φ θ E / E U ,
If driven by a harmonic signal E(t) = E0coswt, the transmittance shows double frequency properties as illustrated by Equation (11), which is so called modulation regime. The quadratic (Equation (11)) and linear (Equation (12)) response were verified experimentally [26,30]. The fast-electro-optical response of DHF is characterized with a V-shaped switching processing with natural and continuous greyscale [31]. FLC mixtures should be synthesized with short helix pitch (P0 < 0.3 μm) and large tilt angle (θ > 30°) for obtaining DHF effect [31,32]. The critical voltage to unwind FLC helix was approximate 2–3 V. Pseudo-bistable switching can also be observed using short-pitch FLC mixtures. The property of V-shape switching provides high possibility of DHF to be applied for next generation active-matrix based FSC display [32].

2.3. Electrically Suppressed Helix (ESH) Mode

The new proposed electrooptic mode called electrically suppressed helix (ESH) mode [28,33] exhibits attractive properties including fast electrooptic response and high contrast ratio, which makes it promising candidate for display and photonics applications. Before the FLC helix is completely unwind by electric field, FLC cells works in DHF regime at V ≤ VC = 0.4 V. After the FLC helix completely suppressed by electric field at V ≥ 1 V, as shown in Figure 5 right part, ESH arises with switching time inversely proportional to voltage amplitude as shown in Figure 6. This electro-optical behavior of switching time is similar to that of SSFLC in Clark-Lagerwall effect, but they are distinguished by the mechanism of helix unwinding.
Between SSFLC and ESH modes there is only a formal difference in initial conditions (the helix is suppressed by surfaces in SSFLC, but this does not happen with ESH), as the dynamics are identical. The presence of helix without applied voltage is the cause of the unique high alignment quality in ESH mode as shown in the textures in Figure 5. The contrast ratio in ESH mode is more than 12000:1 at frequency up to 1 kHz at ±1.5 V and up to 2 kHz at ± 3 V.
The criteria for achieving the high-quality alignment is to satisfy the condition that the helix elastic energy is comparable but obligatory not less than the anchoring energy normalized to dFLC:
K q 0 2 2 W Q 0 d F L C ,
here W Q 0 is the anchoring energy coefficient, which is measured to be W Q 0 = 4 × 10⁻⁴ J/m2 for the sample illustrated in Figure 5 and Figure 6.
The uniform orientation of FLC director is obtained when V > VC, where VC is the critical voltage for helix unwinding. In addition, the ESH cells exhibits good shock stability, as evaluated using contrast ratio measured after removing the mechanical pressure. The contrast can be restored within 10 second after removal of mechanical pressure (Figure 7).

3. Electrooptic Effects of FLC Modes and Their Applications

3.1. Bi- and Multi-Stable Switching

The bistable switching in SSFLC geometry can be achieved with electric field above the threshold value EthWd/K1/2, where K is an average elastic constant and Wd is a dispersion anchoring energy [20]. Thus, with increasing anchoring we need to increase the switching amplitude of the electric field. As the energy of switching electric torque is proportional to the product of PSE, the bistability threshold is inversely proportional to the value of the FLC spontaneous polarization PS.
A SSFLC structure exhibiting bistability realizes grayscale only by time- or space- averaging instead of amplitude controlled intrinsic grayscale [18,19,20]. However, when the spontaneous polarization Ps of FLC is sufficiently high, then the multistable states can be obtained based on the ferroelectric domains, then consequently the inherent physical grayscale is achieved in passively addressed FLC samples [29]. In bookshelf configuration (Figure 1) with helix totally unwound, a variable optical grayscale can be observed due to the ferroelectric domain density, as shown in Figure 8 [34]. When a helix-free FLC sample composing ferroelectric domains is driven by voltage pulses, the width of the voltages pulse is critical in the sense of generating memorable domain density, as textures shown in Figure 8, with the condition that the width of the voltage pulse is shorter than total switching time. Observed under crossed polarizers, the quasi-periodical structure, which is memorized and remains even the voltage switched off or short-circuited, contains bright and dark smectic layers corresponding to ferroelectric domains completely switched or staying at the intial state. The boundaries between ferroelectric domains follow the smectic layer planes, which verifies that only two possible orientations of FLC directors exist in bookshelf configuration. The spatially averaged transmittance provides continuous grayscale with the condition that the light beam is much wider than the size of ferroelectric domains which is always satisfied. Since the density of the switched domains is determined by the energy of the driving pulse, which is proportional to the product of voltage amplitude and pulse width, the variation of spatially averaged transmittance can be controlled by both the amplitude and the width. The multistable electro-optical mode possessing any intermediate transmittance between maximum and minimum is achieved based on FLC cell (Figure 8).
To obtain the multistable electro-optical response, the following conditions should be satisfied: Firstly, sufficiently high spontaneous polarization FLC mixtures, e.g., Ps > 50 nC/cm2; Second, the two orientation states are separated by a relatively low energy boundaries, which is normally satisfied for anti-ferroelectrics [18,19,20]. For proper design the cell configuration and driving scheme, both V-shaped and S-shaped electro-optic response with multistability can be realized, as shown in Figure 9a,b [34,35].
The reverse bistable effect is observed in FLC devices [35], as shown in Figure 10. Figure 10a,b shown the electro-optical responses of traditional bistable and reverse bistable effect. The reverse bistable effect exhibits two stable states and is switched between two states by the falling edge of the driving pulses. The anchoring strength and dielectric property of the alignment layer is critical for the existence of the reverse bistable effect [35]. Potential applications of reverse bistable effect includes new design of energy-saving devices, such as e-paper, etc. Additionally, the clear distinction of traditional and reverse bistability facilitates the elimination of incomplete refreshing or negative images in bistable displays.
It is validated experimentally that the depolarization field is responsible for the reverse bistability [35]. Considering the FLC cell with symmetric boundary condition, by applying the driving voltage of V0, the magnitude of the actual electric field applied on the FLC layer is:
E F L C = ε V 0 2 ( P S / ε 0 ) d 2 ε d + ε d = V 0 d 1 2 P S d / V 0 ε ε 0 1 + 2 ε d / ε d ,
where d is the FLC layer thickness, ε is the FLC’s dielectric permittivity, PS is the spontaneous polarization of FLC material, and d’ and ε’ are the thickness and the dielectric permittivity of alignment layers.
The depolarization field is:
E F L C D = 2 ( P S / ε ) d 2 ε d + ε d ,
Since the spontaneous polarization PS as well as the dielectric parameters ε and ε’ are frequency-dependent, as illustrated in Figure 10c, the reverse bistability has been observed only at low-frequency driving voltage condition.

3.2. V-Shape Electrooptic Response

The DHF samples exhibit symmetrical response to voltage polarities, as shown in Figure 11a,b with the configuration that helical axis parallel to polarizer β = 0° [31]. The transmittance of DHF sample between crossed polarizers reaches maximum value when α(z) = 45° and Δn(z)d = λ/2 are satisfied simultaneously as illustrated by Equation (7). In the case of β = 0, the optimal tilt angle θ of FLC should be 45° in terms of getting maximum transmission.
Let us point to certain advantages of the DHF electrooptical effect for applications as compared with SSFLC mode.
1. Fast switching time under low driving voltage. The electrically controlled transmittance is based on small distortion of molecular distribution in helical structure near equilibrium. As a result, real-time response achieved by Clark-Lagerwall effect has negligible time delay.
2. High tolerance of surface treatment and inhomogeneous cell gap. Strong anchoring and defect-free alignment is critical for SSFLC, whereas for DHF the alignment provides orientation of helical axis.
3. Continuous grayscale controlled by voltage amplitude. The DHF effect operates with the amplitude-dependent grayscale (both linear and quadratic), which provides the possibility of implementation of various of photonic and display devices. Moreover, in E ≈ EU regime, long-term optical memory states are possible.
The V-shape response under high frequency driving also shows a high contrast of bright and dark state, as shown in Figure 11. Two unique properties of DHF preferable of active-matrix displays are as follows [36,37]: Firstly, symmetrical performance to voltage polarities, which is similar to nematic cells, operates in the speed of two orders faster than nematics, i.e. τon ~ 80 μs and τoff ~ 60 μs; secondly the response exhibiting V-shaped performance under rectangular voltage waveform, as shown in Figure 11, is suitable for FSC display devices. The continuously modulated grayscale for RGB colors independently can be achieved as shown in Figure 11.
In particular, the unique electro-optical characteristics of fast switching V-shape occurs with designed cell configuration and driving waveform. Compared with other known V-shaped FLC modes, DHF operates in a broad frequency range up to several kilohertz instead of a specific frequency. The independency switching on frequency allows V-shape DHF operates under a high frequency for FSC displays, which is a practical method to reduce color breakup effect.
One unique property of DHF mode is the independence of the response time on applied voltage at V < VC. Another characteristic feature of DHF mode is frequency dependence of the electro-optical response time, which is observed experimentally, as shown in Figure 12. We have found that the switching time of DHF decreases with higher frequency of the applied voltage [38].
The DHF FSC display cell with red, green and blue LEDs forming sequential fields to generate full color has been elaborated [38]. An FSC display does not need color filters and has the advantages of increased light transmission and higher spatial resolution. The target response time for an FSC display should be less than 1 ms (240 Hz frame frequency). The RGB LEDs backlight with around 200 μs duration of each color were synchronized to the driving voltage pulses with the DHF cell. In this regime, the transmission is continuously tunable independently for each color using the amplitude modulation of voltage signals, as show in Figure 13.

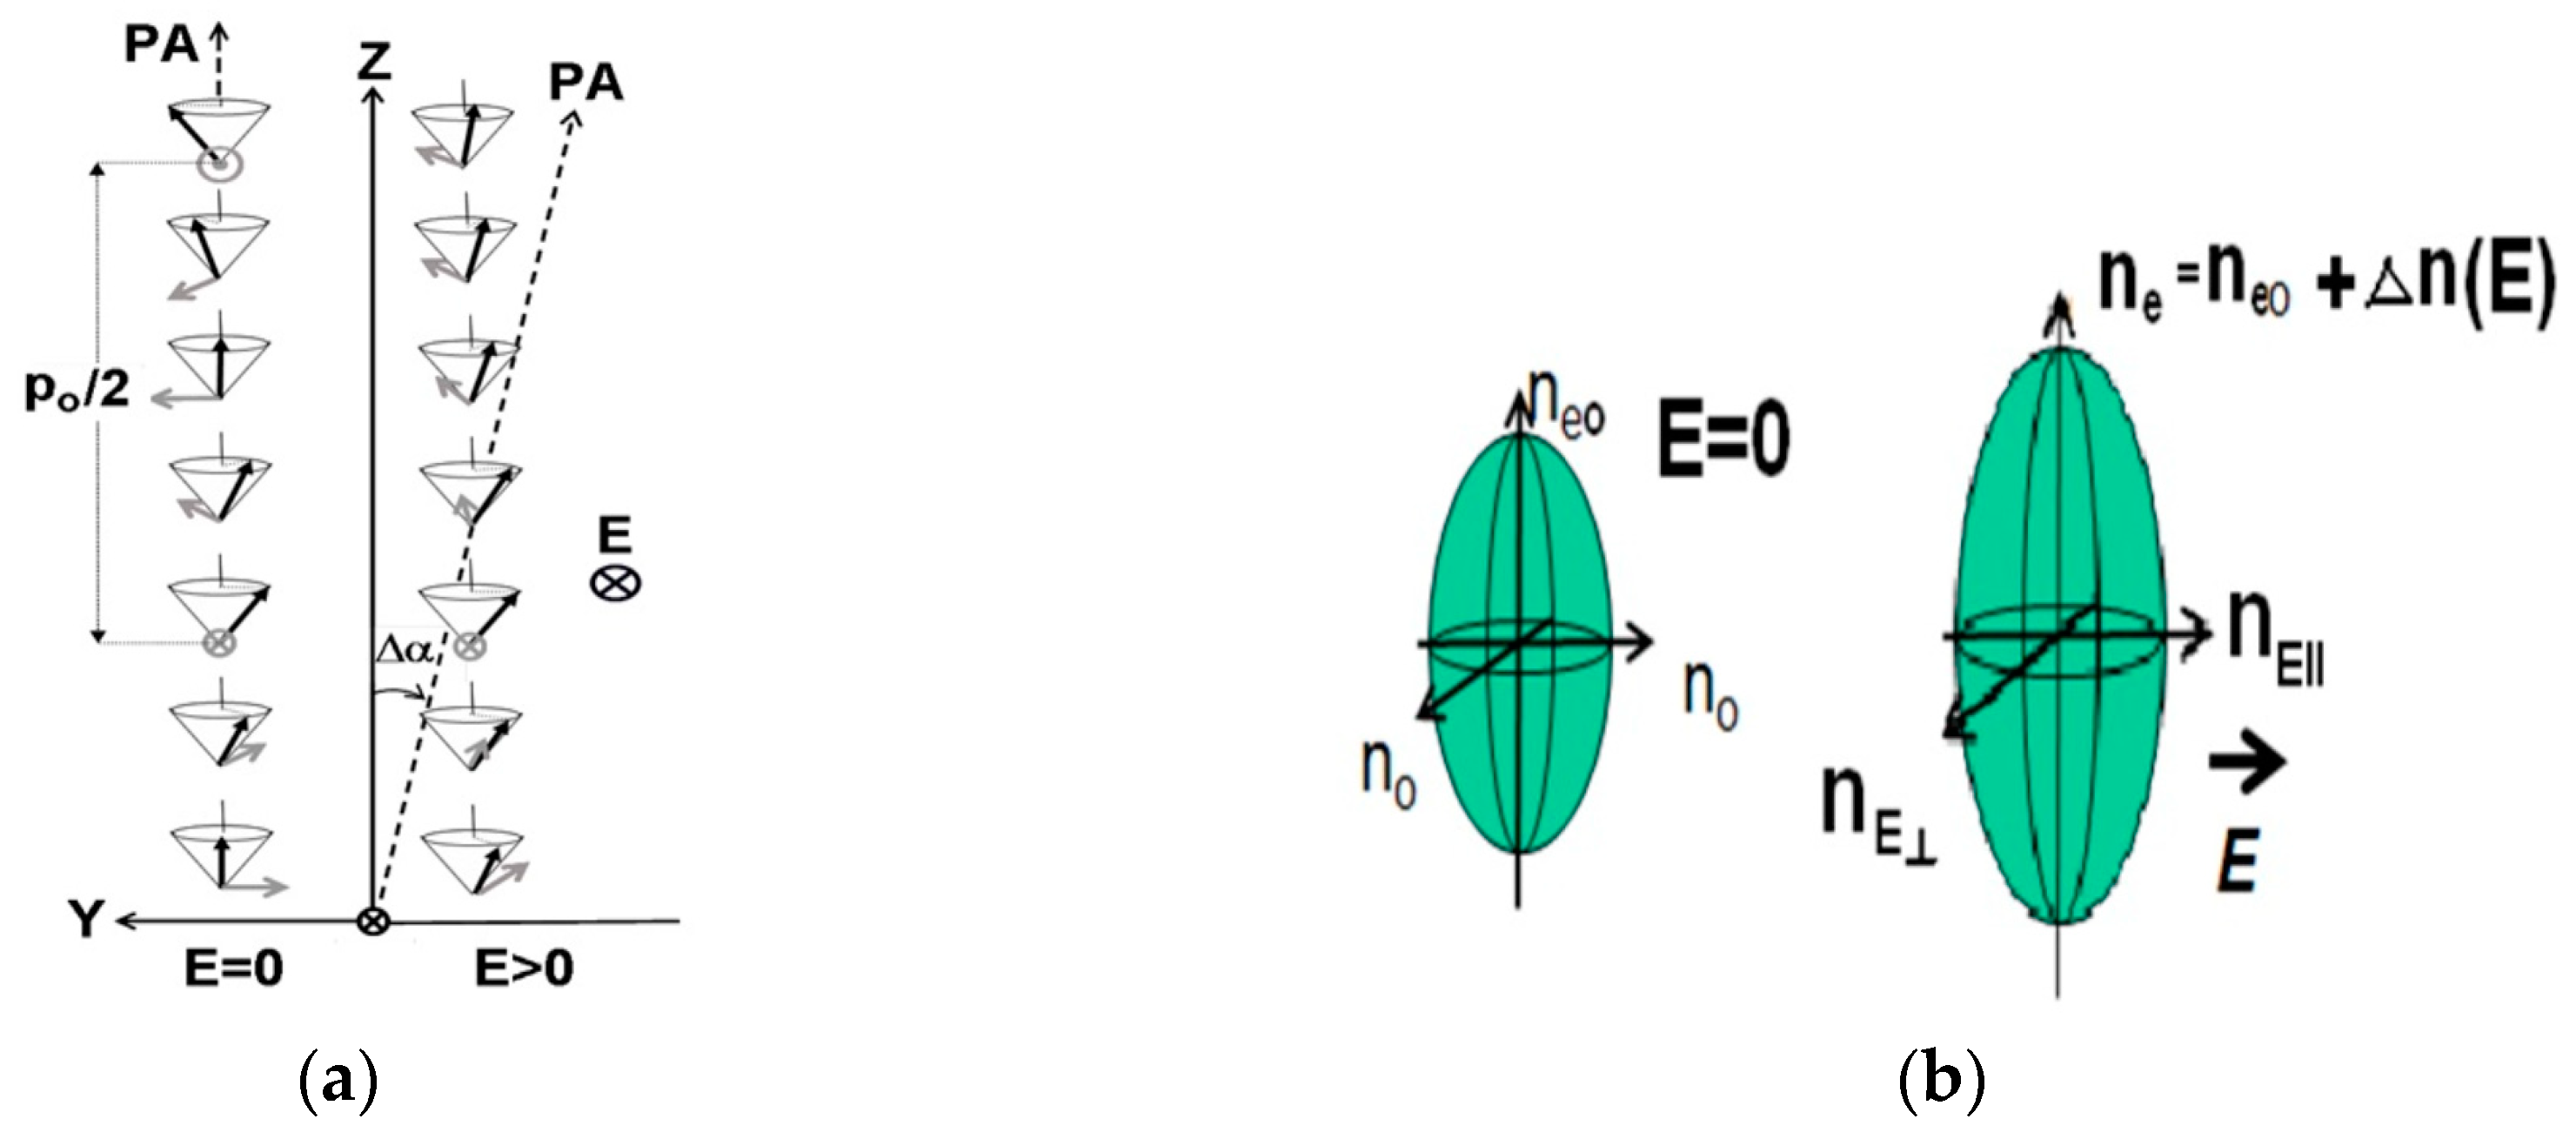
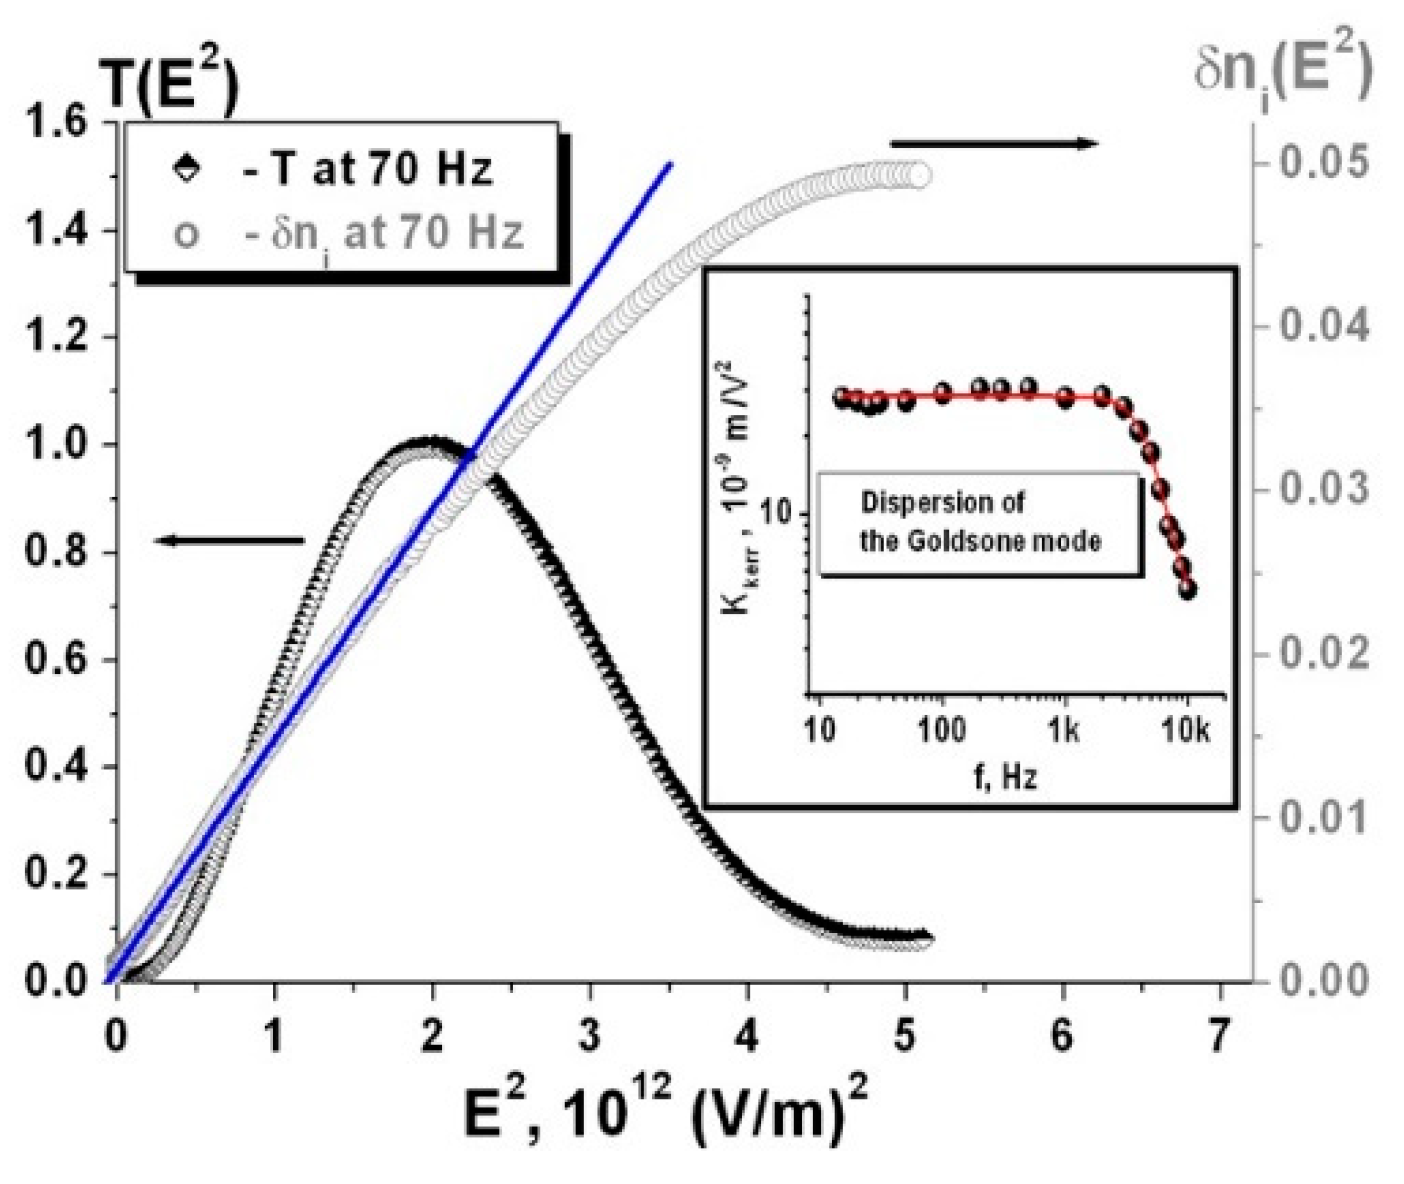
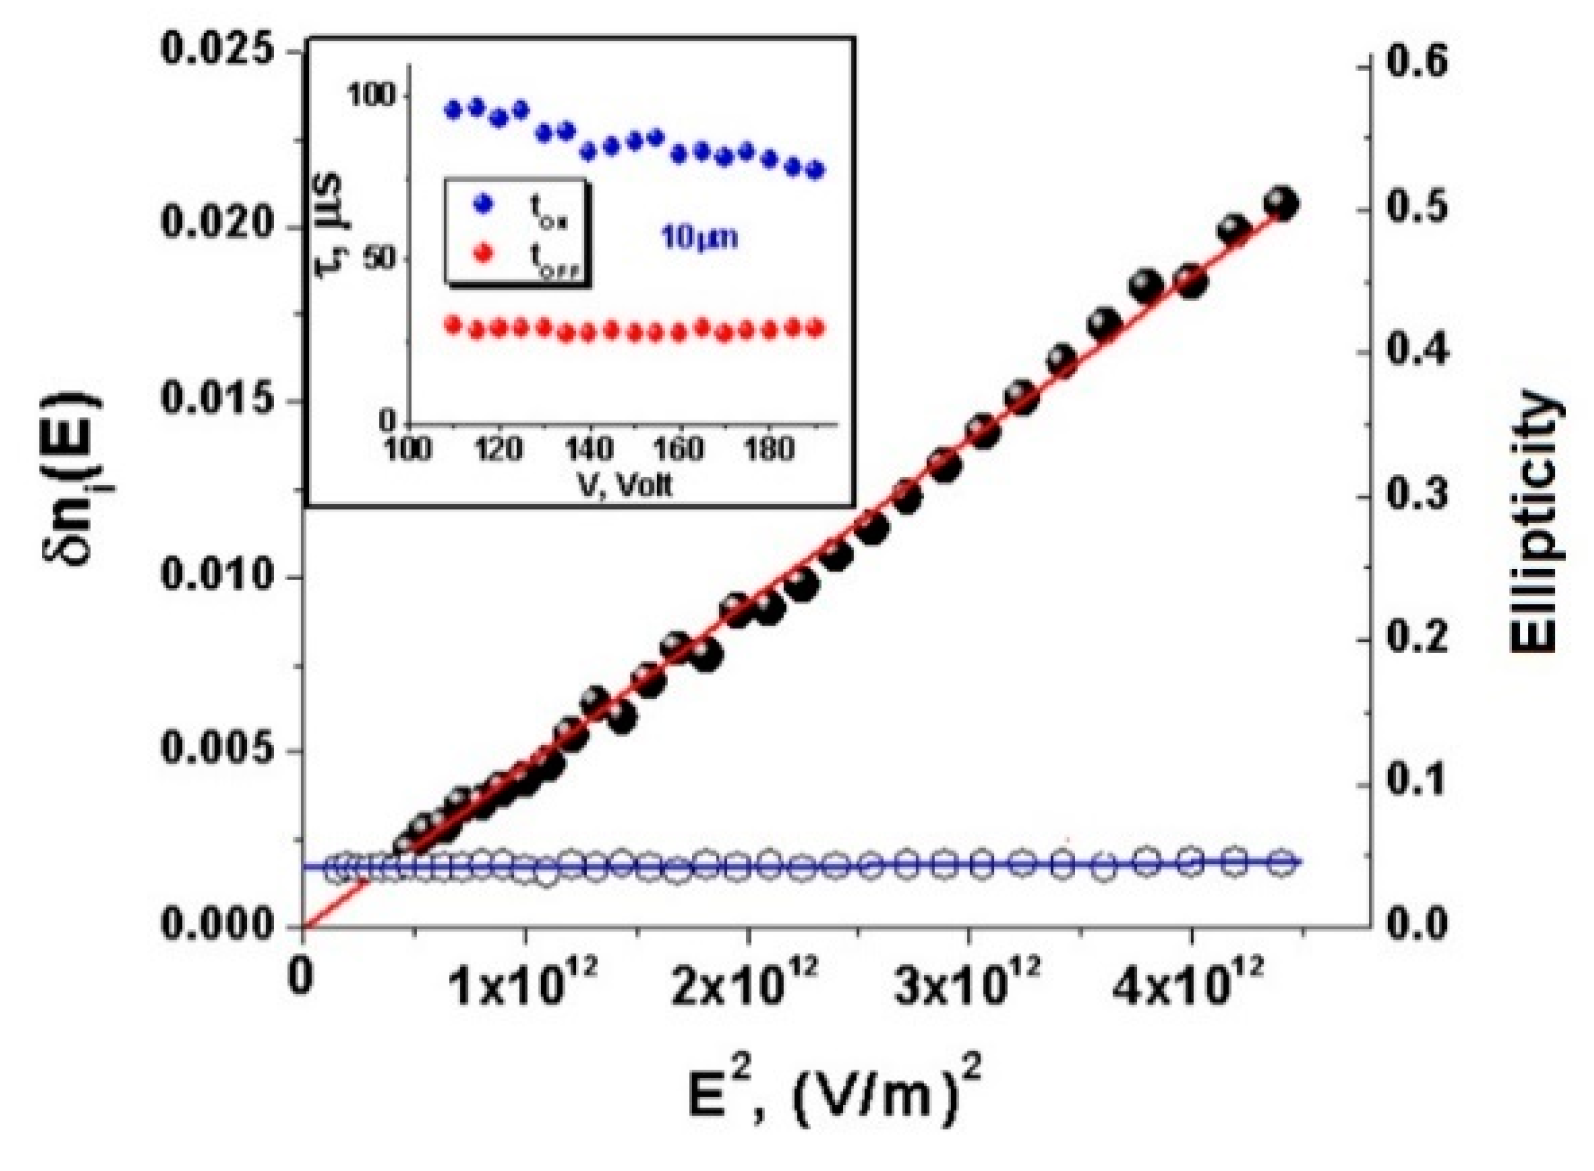
3.3. Orientational “Kerr Effect”

Vertically aligned DHFs (VADHFs) with helical pitch shorter than wavelength exhibits Kerr effect of pure phase modulation due to the inclination of optical axis of FLC helix, thus it is called orientational Kerr effect [39,40]. In this regime, the distribution of FLC molecule is modulated by electric field, introducing a deformation of the helix. In order to exclude the selective Bragg reflection, the FLC mixture with helical pitch around 150 nm was synthesized. The cell configuration operates with orientational Kerr effect, as shown in Figure 14a, smectic layers are arranged parallel to substrates with helical axis vertically aligned, and electric field is applied parallel to the substrate surface with inter-digital electrodes. In the initial state, the vertically aligned helix shows optical isotropic property for the incident beam perpendicular to the substrates. In this case, the standing FLC helix can be considered as uniaxial optical medium with optical axis vertically. The deformation of the helix induced by electric field perpendicular to the helical axis introduces optical anisotropy with birefringence of Δnind = n − n, where n/n are the in-plane refractive indices along and perpendicular to the field. The electrically induced birefringence exhibits Kerr effect and is proportional to the square of electric field: ΔnindE2. In this configuration, pure phase modulation of over 2π modulation depth showing a constant ellipticity and no hysteresis is realized with switching time less than 100 μs. It has various potential applications in modern photonic devices.
The cell geometry is shown in Figure 14a, in which the helical structure is aligned vertically and inter-digital electrode on the bottom substrate for applying electric field parallel to the smectic layers [40]. The electrodes are designed with width of 2 μm and with gap of 50 μm in between. The adopted vertical alignment material is stearic acid chromium salt with chemical formula shown in Figure 14b, which is fabricated by spin coating on substrates of with 40 nm-thick layer and soft-backing at 100 °C for 10 min. The Figure 14c illustrates the textures of vertically aligned DHF sample under polarized microscope in the absence of electric field.
With electric field applied along x axis through inter-digital electrodes under the condition that E < Ec, the principle axis of helical structure in VADHF sample is deflected from z axis by the angle of Δα on y-z plane, as show in Figure 15a [40]. Consequently, the field induced biaxiality (Δnind) appears with nE/nE as the refractive index of the helical structure along/perpendicular to the electric field, as illustrated by Figure 15b.
For normally incident light, the electrically controlled birefringence is [39,40]:
Δ n i n d = n E n E = K K e r r E 2 ,
where n||E and n⊥E are the effective parallel and perpendicular refractive indices induced by applied electric field. The Kerr constant is derived as:
K K e r r = 2 n E = 0 ( 1 n 2 / n E = 0 2 ) ( χ E / P S ) 2 ,
where PS is the spontaneous polarization, and χE is the averaged dielectric susceptibility along the field direction The Kerr constant is proportional to the “isotropic” refractive index with zero electric field αKerr~nE = 0, shown below:
n E = 0 2 = [ n 2 n 2 / ( n 2 + ( n 2 n 2 ) cos 2 θ ) 1 / 2 + n 2 ] / 2 ,
The transmittance T between two crossed polarizers shows quadratic changing with E2. The transmittance curve shown in Figure 16 indicates that 2π phase modulation is obtained at the voltage of ~ 2.1 V/μm with the VADHF sample. The light transmission is [39,40]:
T = sin 2 2 Ψ sin 2 π Δ n i n d d F L C λ ,
where dFLC is the FLC layer thickness, and Ψ is the angle between the polarization plane of incident light and the direction of electric field. From Equation (16), the induced birefringence Δnind can be derived. The experiment result, shown as open circular line in Figure 16, fits well with the theoretial plot, shown as blue solid line in Figure 16. The saturation value of induced birefringence Δnind of FLC-587 mixture is 0.05, meaning that 2π phase modulation requires the ratio of FLC thickness to wavelength to be dFLC/λ = 20 (Figure 16). For wavelength in IR region, the corresponding cell gap is also easy to fabricated with good alignment-quality [39,40].
The experiment results of Kkerr, calculated from detected Δnind by using Equation (16), shows frequency-independence at frequency up to 2 kHz, as illustrated in the insertion of Figure 16. The Kerr constant of VADHF (Kkerr = 27 nm/V2) is evaluated in comparison with commonly used materials. It is two-order larger than that of nitrobenzene, and twice larger than that of polymer stabilized blue phase LC (PSBPLC) [41]. As in Equation (17) the dispersion of Kerr constant Kkerr of VADHF at frequency higher than 2kHz results from the dispersion of dielectric susceptibility χE defined as [39,40]:
χ E = P s 2 2 K q 0 2 ,
where K is the elastic constant and q0 = 2π/P0 is the wave vector of the helix. From Equation (20), we can see that Kkerr can be further improved by the optimization of FLC material parameters.
In orientational Kerr effect of VADHF, pure phase modulation without changing the ellipticity of incident light is observed, since the electrically induced variation lies in the regime of refractive indices (Figure 17). Before the helix unwinding process (E < Ec), the induced birefringence Δnind increases quadratically with electric field and the ellipticity of output light remains unchanged. When the electric field goes in to the helix unwinding region (near or higher than Ec), the quadratic relation is broken and also leads to the increase of output ellipticity, which is due to the ration of polarization plane.
The dependence of switching-on and -off time tON and tOFF on voltage applied is shown in the insertion of Figure 17. The response time of VADHF is in the range of less than 100 μs, which allows the driving frequency to be over 1 kHz. Compared with competing technologies like PSBPLC, VADHF possesses the advantages of higher Kerr constant, faster response, and hysteresis-free performance, which are preferable in developing phase or amplitude modulation devices for emerging displays and modern photonics.

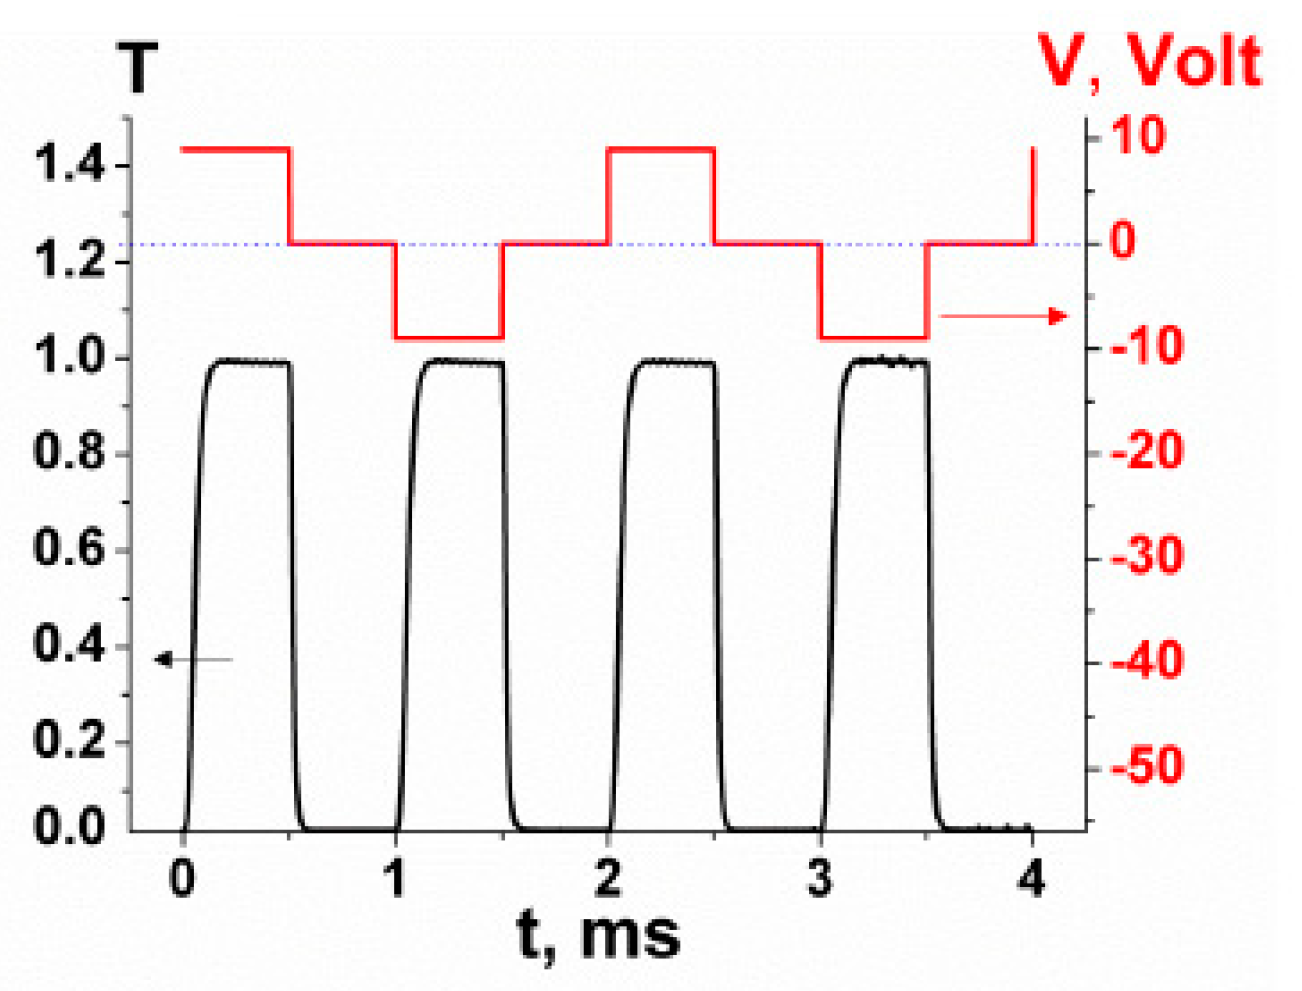
3.4. Fast Shutter with High Contrast Ratio

ESH mode can be applied as fast response shutters for amplitude, phase and polarization modulation. For instance, ESH plate sandwiched between polarizer and quarter wave plate acts as a polarization selector of two orthogonal circular polarizations with sub-millisecond response, which can be placed before passive polarization gratings for fast beam steering purpose, as shown in Figure 18a–d [42]. The switching time for beam steering achieved is below 100 μs with voltage within 10 V as shown in Figure 19.
The Pulse width modulation technique is adopted to control the residual light and thus to generate gray levels [38]. The numbers of displayed color are determined by the response time of ESH. Gray level can be generated by changing with the bright time of the cell, as shown in Figure 20a. Considering the ESH cells show less than 50 μs under 5 V fast response time, large color triangle as well as wide viewing angle are obtained. This display also has an opportunity to be applied for 3D LCD applications.

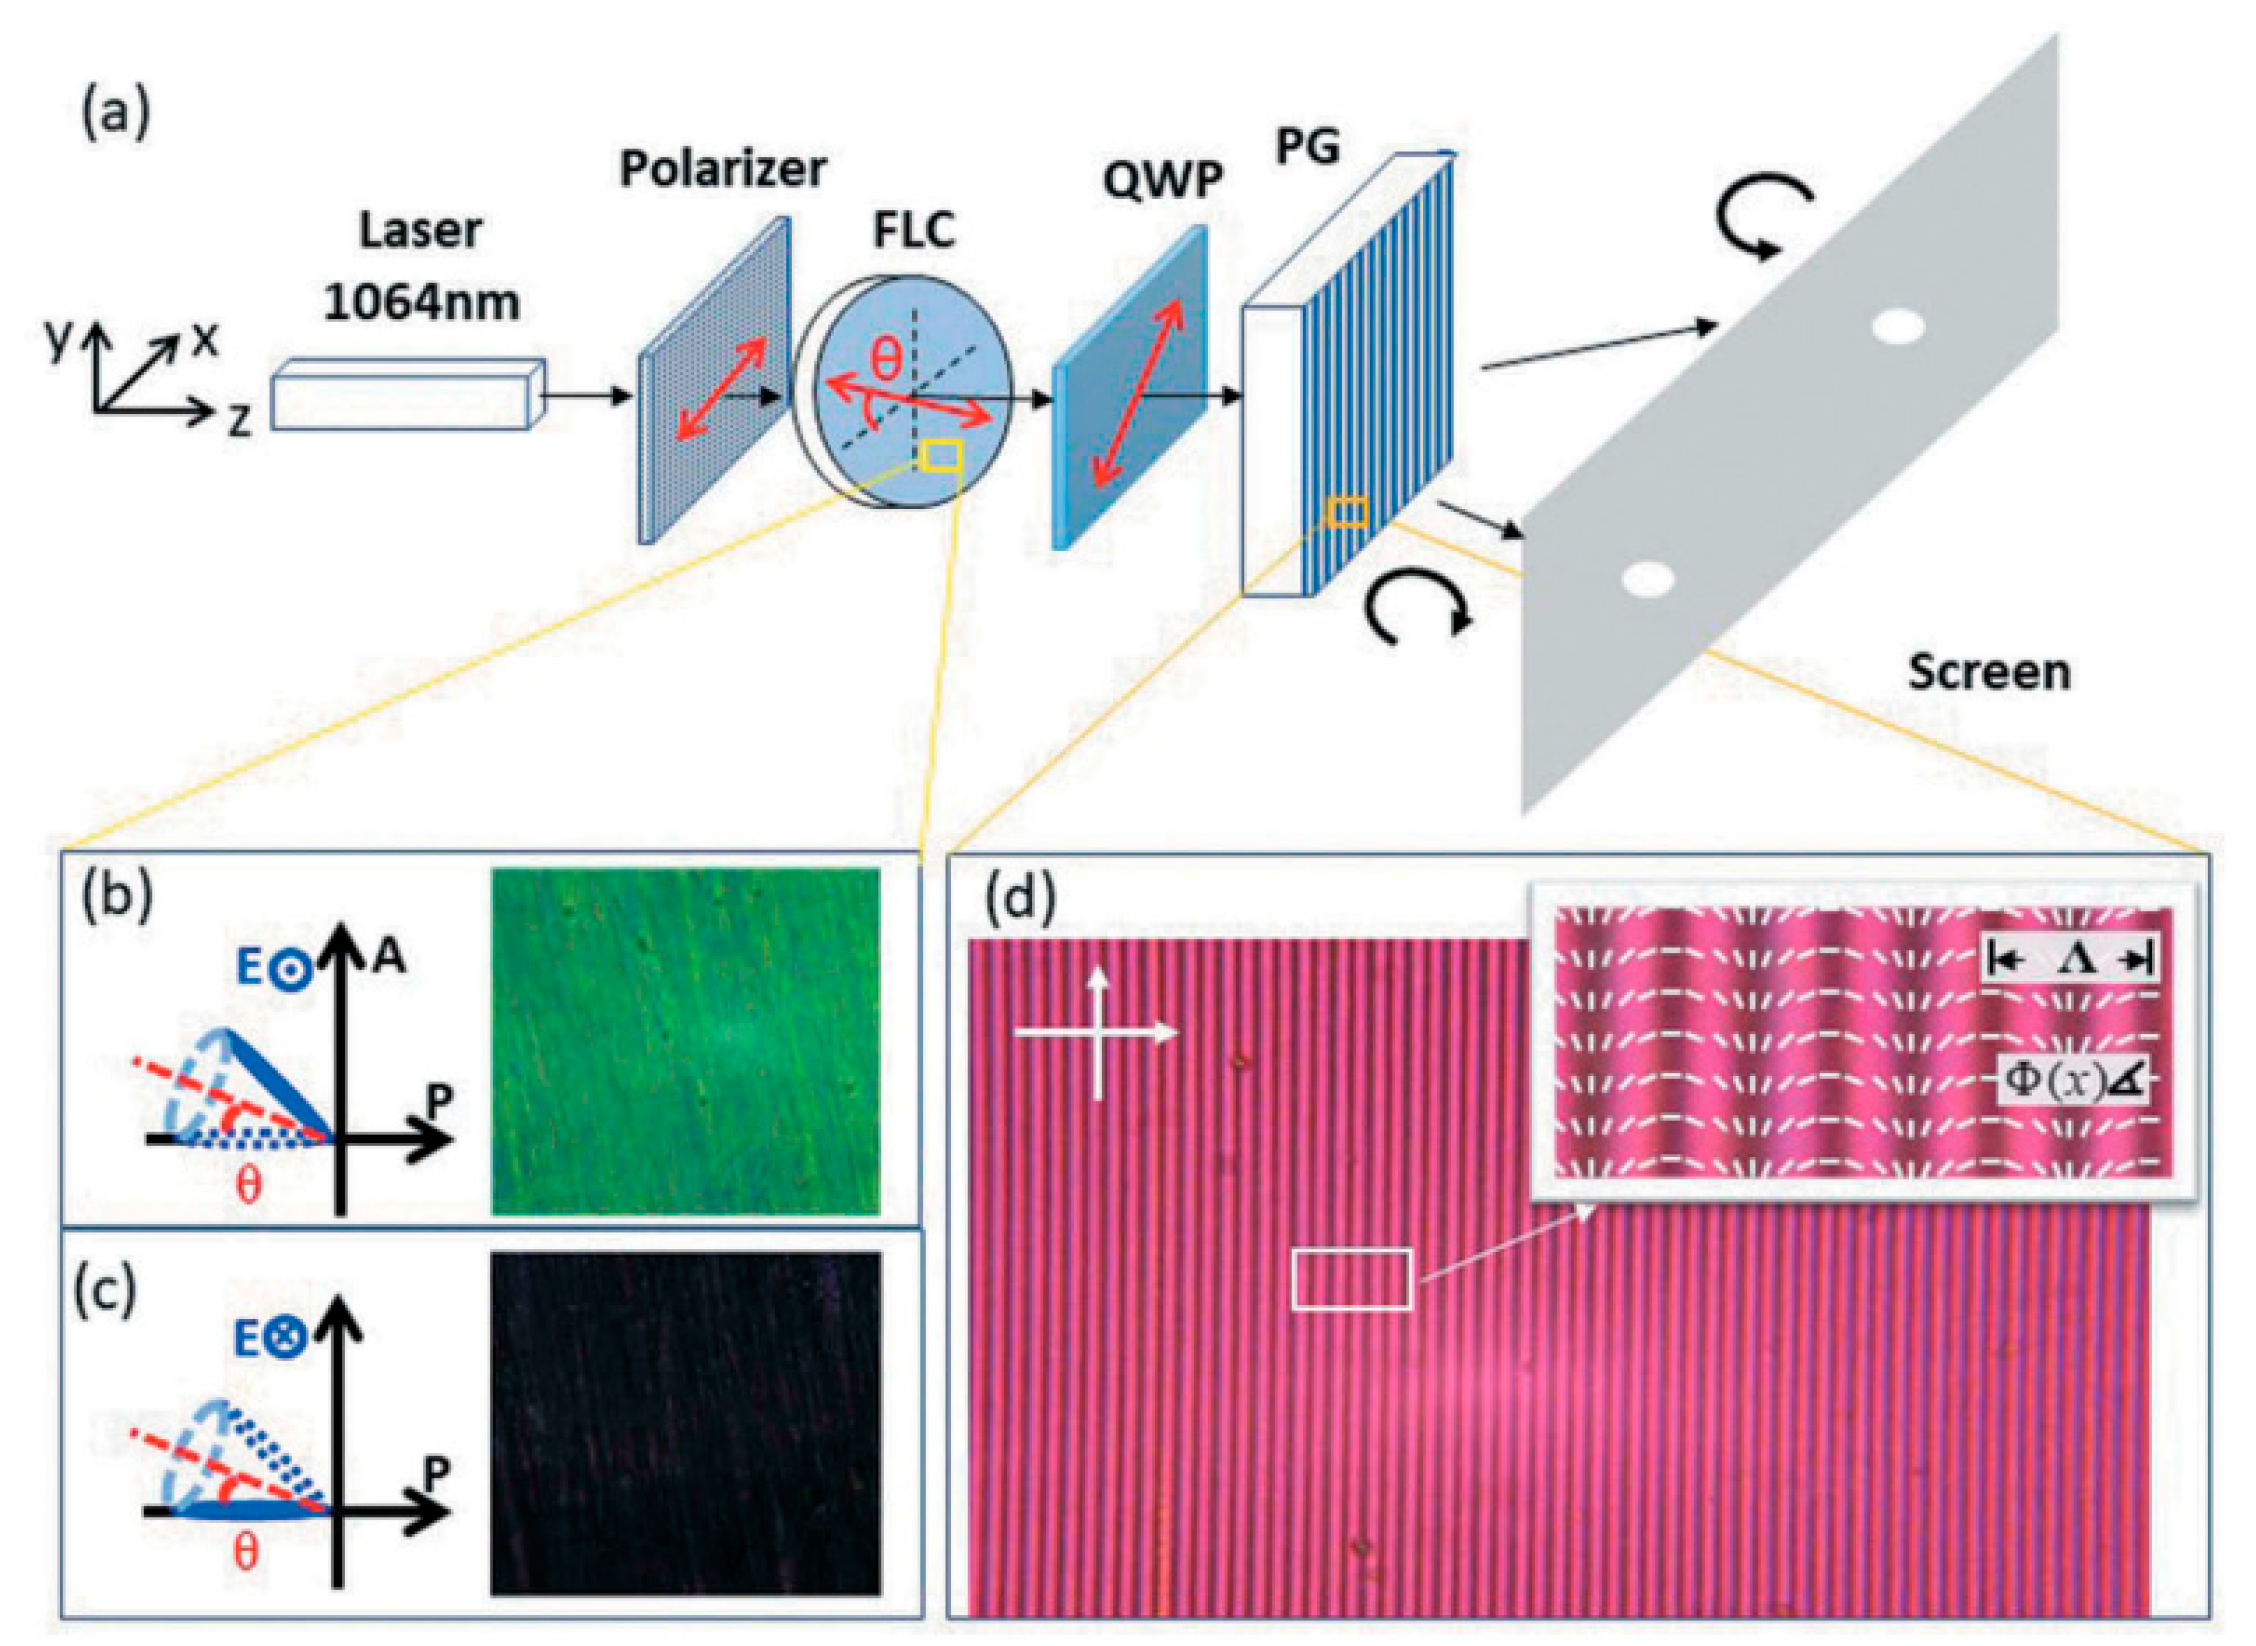
3.5. Fast Switching Gratings

Diffractive optical elements based on liquid crystals have been massively documented recently [43,44,45,46,47,48,49,50]. These can be classified into three basic categories: (1) the intrinsic diffractive structure such as cholesterics or ferroelectrics [43]; (2) non-uniform electric field deployed by patterned electrodes [44]; (3) periodical initial orientation by surface or volume alignment [45].
The diffraction due to the intrinsic structure like ferroelectric domains or periodic helix brings diffraction lobes, which influence the dark-state quality of displays, as shown in Figure 21a of the viewing angle chart in terms of Luminance (cd/m2) of dark state of FLC display illumined by white LED. The intensity profile along the diffraction lobe shown in Figure 21b illustrates the energy distribution in bright and dark states along. In addition, the larger spontaneous polarization and higher electric amplitude contribute to the inherent diffraction of FLC, as shown in the right insertion of Figure 21b [50]. Then enhancement of the diffraction efficiency can be obtained by introducing chiral single wall carbon nano tubes (SWCNT) into FLC mixtures [44]. In this manner, one faces the tradeoff between improvement of diffraction and the confinement of electronic conductivity. Thus, further research is necessary for the intrinsic diffraction of FLCs to be improved and explore potential applications.
With applying non-uniformly distributed electric field by properly designing the patterned electrodes, one can realize tunable diffraction based on LCs. Figure 22a,b shows two designs of inter-digital electrode and periodically vertical field for FLCs. In this case, the combination of periodic electric field and intrinsic structure needs to be taken into consideration to achieve desired diffraction profile [45]. Moreover, the defects induced at the boundary between areas of different electric field may arise, as shown in Figure 22d on top on ITO electrode, which ought to be solved for the device robustness.
Another approach is based on the periodic alignment of the FLCs [46,47,48,49]. The periodical volume-alignment ban be obtained with polymer stabilized FLCs with properly index-matching between adopted polymer and FLC material. However, the additional diffraction and hysteresis due to the polymer network may appear [45,46]. Another approach is to pattern the helix orientations by surface alignment for instance by photoalignment technology. With the advantages of re-writability and controllable anchoring energy of sulfonic azo-dyes, the high quality of periodic orientation and hysteresis-free operation are possible to achieve [47,49].
Based on the optimal aligning condition described by Equation (13), the diffractive optical elements made by ESH FLCs inherit the properties like high contrast, no diffraction lobe as shown in Figure 23a, and fast switching under low voltage [23]. Two step exposure deployed with single mask as shown in Figure 23b is normally applied for generation of two-domain pattern [47]. In this process, the easy axis of two domains can be arranged orthogonally or with arbitrary angle depending on the application circumstances. Figure 23 shows the fabrication process as well as the textures of orthogonally aligned domains forming 1D or 2D binary ESH gratings with period of 50 µm.
The diffraction pattern and the intensity profile for 1D and 2D grating are shown in the insertion of Figure 24a,b, respectively. The dark states of the FLC grating shown in Figure 24c are identical for 1D and 2D ESH gratings. The optical quality of both diffractive and non-diffractive mode as well as the contrast between them is evaluated by plot of intensity distribution shown in Figure 24d,e. The diffraction efficiency calculated from the transmittance of diffractive orders gets to saturated value over 70% with electrical field over 1.3 V/μm as illustrated in Figure 24 [45,48].
Besides optical quality, the dynamic response is also a critical parameter to evaluate LC based diffractive elements. By using ITO electrodes uniformly coated on substrates, the response of diffractive orders is similar to that of planar aligned ESH cell, as shown in Figure 25. The peak of switching time represent the helix unwinding process, so the accordance voltage is defined as critical voltage. After the helix is totally unwound by electric field, the switching time follows proportional decay along the increase of applied voltage as described by Equation (3). When the applied electric field averaged by cell gap reaches 6.6 V/µm, the switching time is around 20 μs, which can be further minimized by improvement of material parameters. The insertion of Figure 25 shows the waveform of response under high driving frequency of 5 kHz. The contrast ratio of the first diffractive order, defined as Imax/Imin, is over 7000:1 at 6 V/μm of 2 kHz and decreases slightly due to small modulation time. The high contrast can be enhanced by higher voltage even for higher frequency [39,47]. With the advantages of fast switching, high contrast and high efficiency, ESH mode can be applied for various diffractive elements, such as Dammann gratings, Fresnel plates and so on.
Diffractive Fresnel lens composed of ESH domains is shown in Figure 26a–d, in which the angle of adjacent aligning orientations is set to be 45°. Thus, Figure 26a,b show textures containing bright and dark circles under polarized microscope [51,52]. The photograph of diffractive and non-diffractive state is also shown. The spatial resolution of ESH patter is in submicron region by using photoalignment technology [53]. In summary, the ESH diffraction mode in association with photoalignment exhibiting high optical quality as well as fast switching time providing high flexibility in design and fabrication of various diffractive elements.

4. Conclusions

With the advantage of photoalignment technology, FLC electrooptical modes providing a fast response and a high contrast, including SSFLC mode, DHF mode, and ESH mode, are described and analyzed for applications in next-generation displays and modern photonic devices. The possible applications include high-resolution micro-displays based on FSC displays, 2D/3D switchable LCDs based on switchable goggles or lenses, and so on. Further research for improvement of FLC displays can focus on certain aspects: (i) development of new fast responded FLC materials with fast switching and a sufficient number of switchable gray levels (V-shape switching); (ii) implementation of the working prototypes of novel FSC FLC displays, including the 3D version; (iii) investigations of regimes of operation to allow to use efficient addressing of FLC displays including TFT drivers enabling a high switching current; (iv) solving the problem of a mechanical stability of FLC layers; (v) mass production of new FLC materials with optimal characteristics.

Author Contributions

Methodology, V.C., Q.G. and K.Y.; writing—original draft preparation, Q.G. and V.C.; writing—review and editing, K.Y. and H.Z.; supervision, H.Z and M.T.

Funding

This research was funded by National Natural Science Foundation of China (61875004, 61405009), Young Elite Scientists Sponsorship Program by CAST, and MEPhI Academic Excellence Project (agreement with the Ministry of Education and Science of the Russian Federation of August 27, 2013; project no. 02.a03.21.0005).

Acknowledgments

The authors acknowledge the fruitful discussion with E.P. Pozhidaev.

Conflicts of Interest

The authors declare no conflict of interest.

References

  1. Tan, G.; Lee, Y.H.; Zhan, T.; Yang, J.; Liu, S.; Zhao, D.; Wu, S.T. Foveated imaging for near-eye displays. Opt. Express 2018, 26, 25076. [Google Scholar] [CrossRef] [PubMed]
  2. Song, D.H.; Kim, J.W.; Kim, K.-H.; Rho, S.J.; Lee, H.; Kim, H.; Yoon, T.H. Ultrafast switching of randomly-aligned nematic liquid crystals. Opt. Express 2012, 20, 11659. [Google Scholar] [CrossRef] [PubMed]
  3. Akahashi, T.T.; Urue, H.F.; Hikada, M.S.; Atsuda, N.M. Preliminary Study of Field Sequential Fullcolor Liquid Crystal Display using Polymer Stabilized Ferroelectric Liquid Crystal Display. Jpn. J. Appl. Phys. 1999, 38, 534–536. [Google Scholar] [CrossRef]
  4. Castles, F.; Morris, S.M.; Gardiner, D.J.; Malik, Q.M.; Coles, H.J. Ultra-fast-switching flexoelectric liquid-crystal display with high contrast. J. Soc. Inf. Disp. 2010, 18, 128. [Google Scholar] [CrossRef]
  5. Packham, C.; Escuti, M.; Ginn, J.; Oh, C.; Quijano, I.; Boreman, G. Polarization Gratings: A Novel Polarimetric Component for Astronomical Instruments. Publ. Astron. Soc. Pacific 2010, 122, 1471–1482. [Google Scholar] [CrossRef] [Green Version]
  6. He, Z.; Gou, F.; Chen, R.; Yin, K.; Zhan, T.; Wu, S.T. Liquid Crystal Beam Steering Devices: Principles, Recent Advances, and Future Developments. Crystals 2019, 9, 292. [Google Scholar] [CrossRef]
  7. Andreev, A.; Andreeva, T.; Kompanets, I.; Zalyapin, N. Helix-Free Ferroelectric Liquid Crystals: Electro Optics and Possible Applications. Appl. Sci. 2018, 8, 2429. [Google Scholar] [CrossRef]
  8. Hofmann, U.; Janes, J.; Quenzer, H.J. High-Q MEMS resonators for laser beam scanning displays. Micromachines 2012, 3, 509–528. [Google Scholar] [CrossRef]
  9. Wu, T.; Sher, C.W.; Lin, Y.; Lee, C.F.; Liang, S.; Lu, Y.; Huang Chen, S.W.; Guo, W.; Kuo, H.C.; Chen, Z. Mini-LED and Micro-LED: Promising Candidates for the Next Generation Display Technology. Appl. Sci. 2018, 8, 1557. [Google Scholar] [CrossRef]
  10. Chen, H.-S.; Lin, Y.-H.; Srivastava, A.K.; Chigrinov, V.G.; Chang, C.-M.; Wang, Y.-J. A large bistable negative lens by integrating a polarization switch with a passively anisotropic focusing element. Opt. Express 2014, 22, 13138. [Google Scholar] [CrossRef] [PubMed]
  11. Kotova, S.P.; Patlan, V.V.; Samagin, S.A. Tunable liquid-crystal focusing device. 2. Experiment. Quantum Electron. 2011, 41, 65–70. [Google Scholar] [CrossRef]
  12. Wang, L.; Lin, X.W.; Hu, W.; Shao, G.H.; Chen, P.; Liang, L.J.; Jin, B.B.; Wu, P.H.; Qian, H.; Lu, Y.N.; et al. Broadband tunable liquid crystal terahertz waveplates driven with porous graphene electrodes. Light Sci. Appl. 2015, 4, e253. [Google Scholar] [CrossRef]
  13. Hisakado, Y.; Kikuchi, H.; Nagamura, T.; Kajiyama, T. Large electro-optic Kerr effect in polymer-stabilized liquid-crystalline blue phases. Adv. Mater. 2005, 17, 96–98. [Google Scholar] [CrossRef]
  14. Ren, H.; Lin, Y.H.; Fan, Y.H.; Wu, S.T. Polarization-independent phase modulation using a polymer-dispersed liquid crystal. Appl. Phys. Lett. 2005, 86, 1–3. [Google Scholar] [CrossRef]
  15. Zhu, J.L.; Ni, S.B.; Song, Y.; Zhong, E.W.; Wang, Y.J.; Chen, C.P.; Ye, Z.; He, G.; Wu, D.Q.; Song, X.L.; et al. Improved Kerr constant and response time of polymer-stabilized blue phase liquid crystal with a reactive diluent. Appl. Phys. Lett. 2013, 102, 071104. [Google Scholar] [CrossRef]
  16. Chigrinov, V.G.; Baikalov, V.A.; Pozhidaev, E.P.; Blinov, L.M.; Beresnev, L.A.; Allagulov, A.I. Flexoelectric polarization of a ferroelectric smectic liquid crystal. Sov. Phys. JETP 1985, 61, 1193. [Google Scholar]
  17. Kim, S.H.; Shi, L.; Chien, L.C. Fast flexoelectric switching in a cholesteric liquid crystal cell with surface-localized polymer network. J. Phys. D. Appl. Phys. 2009, 42, 195102. [Google Scholar] [CrossRef]
  18. Clark, N.A.; Lagerwall, S.T. Submicrosecond bistable electro-optic switching in liquid crystals. Appl. Phys. Lett. 1980, 36, 899–901. [Google Scholar] [CrossRef]
  19. Lagerwall, S.T. Ferroelectric and antiferroelectric liquid crystals. Ferroelectrics 2004, 301, 15–45. [Google Scholar] [CrossRef]
  20. Chigrinov, V.G. Liquid Crystal Devices: Physics and Applications; Artech-House: Boston, London, 1999. [Google Scholar]
  21. Chigrinov, V.G.; Kozenkov, V.M.; Kwok, H.S. Photoalignment of Liquid Crystalline Materials: Physics and Applications; Wiley: Hoboken, NJ, USA, 2008. [Google Scholar]
  22. Pozhidaev, E.; Chigrinov, V.; Huang, D.; Zhukov, A.; Ho, J.; Kwok, H.S. Photoalignment of ferroelectric liquid crystals by azodye layers. Jpn. J. Appl. Physics 2004, 43, 5440–5444. [Google Scholar] [CrossRef]
  23. Guo, Q.; Srivastava, A.K.; Pozhidaev, E.P.; Chigrinov, V.G.; Kwok, H. Optimization of alignment quality of ferroelectric liquid crystals by controlling anchoring energy. Appl. Phys. Express 2014, 7, 021701. [Google Scholar] [CrossRef]
  24. Panarin, Y.; Pozhidaev, E.; Chigrinov, V. Dynamics of controlled birefringence in an electric field deformed helical structure of a ferroelectric liquid crystal. Ferroelectrics 1991, 114, 181–186. [Google Scholar] [CrossRef]
  25. Pozhidaev, E.P. Electrooptical properties of deformed-helix ferroelectric liquid crystal display cells. Proc. SPIE 2001, 4511, 92–99. [Google Scholar]
  26. Beresnev, L.A.; Chigrinov, V.G.; Dergachev, D.I.; Pozhidaev, E.P.; Funfschilling, J.; Schadt, M. Deformed helix ferroelectric liquid crystal display: A new electrooptic mod in ferroelectric chiral smectic C liquid crystal. Liq. Cryst. 1989, 5, 1171–1177. [Google Scholar] [CrossRef]
  27. Presnyakov, V.; Liu, Z.; Chigrinov, V.G. Fast optical retarder using deformed-helical ferroelectric liquid crystals. Proc. SPIE 2005, 5970, 59701K. [Google Scholar]
  28. Chigrinov, V.G.; Kwok, H.S. Photoalignment of liquid crystals: applications to fast response ferroelectric liquid crystals and rewritable photonic devices. Proc. Liquid Cryst. Sci. Technol. 2013, 4, 199–226. [Google Scholar]
  29. Pozhidaev, E.; Chigrinov, V.; Hegde, G.; Xu, P. Multistable electro-optical modes in ferroelectric liquid crystals. J. Soc. Inf. Disp. 2009, 17, 53–59. [Google Scholar] [CrossRef]
  30. Guo, Q.; Brodzeli, Z.; Pozhidaev, E.P.; Fan, F.; Chigrinov, V.G.; Kwok, H.S.; Silvestri, L.; Ladouceur, F. Fast electro-optical mode in photo-aligned reflective deformed helix ferroelectric liquid crystal cells. Opt. Lett. 2012, 37, 2343–2345. [Google Scholar] [CrossRef]
  31. Pozhidaev, E.; Chigrinov, V. Fast Photo-Aligned V-shape Ferroelectric LCD Based on DHF Mode. SID Symp. Dig. Tech. Pap. 2010, 41, 387. [Google Scholar] [CrossRef]
  32. Hegde, G.; Xu, P.; Pozhidaev, E.; Chigrinov, V.; Kwok, H.S. Electrically controlled birefringence colours in deformed helix ferroelectric liquid crystals. Liq. Cryst. 2008, 35, 1137–1144. [Google Scholar] [CrossRef]
  33. Pozhidaev, E.P.; Minchenko, M.; Molkin, V.; Torgova, S.; Srivastava, A.K.; Chigrinov, V.; Kwok, H.S.; Vashenko, V.; Krivoshey, A. High Frequency Low Voltage Shock-Free Ferroelectric Liquid Crystal: A New Electro-Optical Mode with Electrically Suppressed Helix. In Proceedings of the 31th International Display Research Conference EuroDisplay, Arcachon, France, 19–22 September 2011. [Google Scholar]
  34. Pozhidaev, E.P.; Chigrinov, V.G. Bistable and multistable states in ferroelectric liquid crystals. Crystallogr. Reports 2006, 51, 1030–1040. [Google Scholar] [CrossRef]
  35. Guo, Q.; Zhao, X.; Zhao, H.; Chigrinov, V.G. Reverse bistable effect in ferroelectric liquid crystal devices with ultra-fast switching at low driving voltage. Opt. Lett. 2015, 40, 2413–2416. [Google Scholar] [CrossRef] [PubMed]
  36. Chigrinov, V.G.; Kwok, H.S.; Yakovlev, D.; Simonenko, G.V.; Tsoi, V.I. LCD Optimization and Modeling. J. SID 2004, 12, 183–187. [Google Scholar] [CrossRef]
  37. Kiselev, A.D.; Pozhidaev, E.P.; Chigrinov, V.G.; Kwok, H.S. Polarization-gratings approach to deformed-helix ferroelectric liquid crystals with subwavelength pitch. Phys. Rev. E 2011, 83, 1–11. [Google Scholar] [CrossRef] [PubMed]
  38. Chigrinov, V.; Pozhidaev, E.; Srivastava, A.; Qi, G.; Fan, F.; Ma, Y.; Lastochkin, A.; Kwok, H.S. Novel Photoaligned Fast Ferroelectric Liquid Crystal Display. In Proceedings of the LCT6-1, IDW’11 Conference, Nagoya, Japan, 7–9 December 2011. [Google Scholar]
  39. Pozhidaev, E.P.; Kiselev, A.D.; Chigrinov, V.G.; Srivastava, A.K.; Minchenko, M.V.; Kotova, S.P. Orientational Kerr-effect in Ferroelectric Liquid Crystals. In Proceedings of the 24th International Liquid Crystal Conference, Mainz, Germany, 19–24 August 2012. [Google Scholar]
  40. Pozhidaev, E.P.; Kiselev, A.D.; Srivastava, A.K.; Chigrinov, V.G.; Kwok, H.S.; Minchenko, M.V. Orientational Kerr effect and phase modulation of light in deformed-helix ferroelectric liquid crystals with subwavelength pitch. Phys. Rev. E 2013, 87, 1–8. [Google Scholar] [CrossRef] [PubMed]
  41. Li, Y.; Chen, Y.; Yan, J.; Liu, Y.; Cui, J.; Wang, Q.; Wu, S.T. Polymer-stabilized blue phase liquid crystal with a negative Kerr constant. Opt. Mater. Express 2012, 2, 1135. [Google Scholar] [CrossRef]
  42. Guo, Q.; Xu, L.; Sun, J.; Yang, X.; Liu, H.; Yan, K.; Zhao, H.; Chigrinov, V.G.; Kwok, H.S. Fast switching beam steering based on ferroelectric liquid crystal phase shutter and polarisation grating. Liq. Cryst. 2019, 46, 1383–1388. [Google Scholar] [CrossRef]
  43. Srivastava, A.K.; de Bougrenet de la Tocnaye, J.L.; Dupont, L. Liquid Crystal Active Glasses for 3D Cinema. J. Disp. Technol. 2010, 6, 522–530. [Google Scholar] [CrossRef]
  44. Srivastava, A.K.; Pozhidaev, E.P.; Chigrinov, V.G.; Manohar, R. Single walled carbon nano-tube, ferroelectric liquid crystal composites: Excellent diffractive tool. Appl. Phys. Lett. 2011, 99, 1–4. [Google Scholar] [CrossRef]
  45. Srivastava, A.K.; Chigrinov, V.G.; Kwok, H.S. Ferroelectric Liquid Crystal Gratings. In Proceedings of the Liquid Crystals Photonic Workshop, Hong Kong, China, 9–11 December 2012. [Google Scholar]
  46. Woltman, S.J.; Eakin, J.N.; Crawford, G.P.; Žumer, S. Electro-optical investigations of holographic-polymer-dispersed ferroelectric liquid crystals. J. Opt. Soc. Am. A 2007, 24, 3789. [Google Scholar] [CrossRef]
  47. Srivastava, A.K.; Hu, W.; Chigrinov, V.G.; Kiselev, A.D.; Lu, Y.Q. Fast switchable grating based on orthogonal photo alignments of ferroelectric liquid crystals. Appl. Phys. Lett. 2012, 101, 031112. [Google Scholar] [CrossRef]
  48. Ma, Y.; Sun, J.; Srivastava, A.K.; Guo, Q.; Chigrinov, V.G.; Kwok, H.S. Optically rewritable ferroelectric liquid-crystal grating. Europhys. Lett. 2013, 102, 24005. [Google Scholar] [CrossRef]
  49. Hu, W.; Srivastava, A.; Xu, F.; Sun, J.T.; Lin, X.W.; Cui, H.Q.; Chigrinov, V.; Lu, Y.-Q. Liquid crystal gratings based on alternate TN and PA photoalignment. Opt. Express 2012, 20, 5384. [Google Scholar] [CrossRef] [PubMed]
  50. Beresnev, L.A.; Loseva, M.V.; Chernova, N.I.; Kononov, S.G.; Adomenas, P.V.; Pozhidaev, E.P. Ferroelectric domains in liquid crystal. JETP Lett. 1990, 51, 516–521. [Google Scholar]
  51. Wang, X.Q.; Srivastava, A.K.; Chigrinov, V.G.; Kwok, H.S. Switchable Fresnel lens based on micropatterned alignment. Opt. Lett. 2013, 38, 1775. [Google Scholar] [CrossRef]
  52. Srivastava, A.K.; Wang, X.Q.; Chigrinov, V.G.; Kwok, H.S. Liquid Crystal Fresnel Lens. Filled USPTO Application. U.S. Patent No. US 61/958742, August 2013. [Google Scholar]
  53. Shteyner, E.A.; Srivastava, A.K.; Chigrinov, V.G.; Kwok, H.S.; Afanasyev, A.D. Submicron-scale liquid crystal photo-alignment. Soft Matter 2013, 9, 5160–5165. [Google Scholar] [CrossRef]
Figure 1. Geometry of surface stabilized ferroelectric liquid crystals (FLC) cell.
Crystals 09 00470 g001
Figure 2. Electrooptical response of the surface stabilized FLC (SSFLC) cell for different phase factors k = 1 to 9, the phase factor k is defined as dΔn/λ = k/4 [20].
Crystals 09 00470 g002
Figure 3. Cell configuration (a) and director distribution (b) of deformed helix ferroelectric (DHF) cell [20].
Crystals 09 00470 g003
Figure 4. The electrooptic response of the DHF cell, placed between crossed polarizer and analyzer, and helix axis parallel to polarizer. [28].
Crystals 09 00470 g004
Figure 5. Dependence of switching on time of 1.5 μm cell filled with the FLC-595 [28,33]. Insertions: bottom right is the driving voltage waveform; top: the FLC layer textures between crossed polarizers, horizontal scale of all images is 200 μm; top left—the voltage is not applied, top right—textures at ± 1 V.
Crystals 09 00470 g005
Figure 6. The frequency dependence of the response time at different voltages under condition V ≤ 0.5 V. The linear frequency dependence of the inverse response time at V > 1 V [28,33].
Crystals 09 00470 g006
Figure 7. Dependencies of the contrast ratio on driving voltage frequency at V = 1.5 V and V = 3 V. The FLC-595 layer-thickness is 1.5 μm, no SiO2 layers, measurements have been carried out at T = 22 °C, wavelength λ = 0.63 μm [28,33]. Insertion left: Dependencies on voltage: measured tilt angle and the cell light transmission in comparison with transmission of empty cell placed between crossed polarizers. Insertion right: Contrast ratio dependence on time after the application of mechanical shock.
Crystals 09 00470 g007
Figure 8. Continuous variation of the width of ferroelectric domains between crossed polarizers with a change in the applied voltage of the FLC layer. The image area is 350 × 400 μm2 [34].
Crystals 09 00470 g008
Figure 9. S-shaped (a) and V-shape (b) FLC multi-stable switching [29].
Crystals 09 00470 g009
Figure 10. Electro-optical response of (a) traditional bistable and (b) reverse bistable FLC. The polarizer is placed along angle β with respect to helical axis, where β = θ and θ is the tilt angle of ferroelectric liquid crystal. (c) is the frequency characteristics of the hysteresis loop width [35].
Crystals 09 00470 g010
Figure 11. Symmetric (voltage sign independent) electro-optic response of DHF–FLC [31]. (a) Top—the driving voltage waveform applied to the cell, bottom—the electro-optical response of the cell. (b) V-shaped mode in the envelope curve of light transmission saturation states measured at electro-optical response frequency 2 kHz. The light transmission Th evaluated in comparison with transmission of empty cell placed between parallel polarizers; this transmission is defined as Th = 1.
Crystals 09 00470 g011
Figure 12. Frequency dependence of response time in DHF regime [38].
Crystals 09 00470 g012
Figure 13. Bottom is the electrooptical response of the DHF. Top is driving signal applied and synchronized sequentially with corresponding red, green, and blue light emitting diodes [38].
Crystals 09 00470 g013
Figure 14. Schematic representation of geometry of a vertically aligned DHF cell [40]: (a) 1—glass plates, 2—in-plane electrodes, 3—smectic layers parallel to glass substrates, 4—a voltage generator. (b) The chemical structure of stearic acid chromium salt. (c) The texture of Vertically aligned DHFs (VADHF) cell placed between crossed polarizers at V = 0 V. The red mark is 20 μm.
Crystals 09 00470 g014
Figure 15. (a) Illustration of the deflection of principal axis in the presence of electric field. (b) Schematic representation of the refractive indices ellipsoid in the absence (left) and in the presence (right) of electric field [40].
Crystals 09 00470 g015
Figure 16. The dependence of transmittance and induced birefringence on amplitude of electric field for VADHF cell placed between crossed polarizers A at Ψ = 45° [40]. The solid blue line is the theoretical fitting. Insertion shows the frequency dependence of Kerr constant.
Crystals 09 00470 g016
Figure 17. The induced birefringence and the ellipticity of the emerging light of 18 μm thick VADHF cell at the frequency of 40 Hz [40]. The insertion represents the variation of the switching on and off time with respect to the applied voltage.
Crystals 09 00470 g017
Figure 18. Schematic illustration of ESH as a polarization shutter in a beam steering set up. (a) The optical setup with FLC phase shutter. (b,c) are FLC textures (right) under two voltage polarities recorded by polarized microscope with polarizer and analyzer illustrated (left), the helical axis is shifted angle θ from polarizer. (d) Texture of polarization grating [42].
Crystals 09 00470 g018
Figure 19. The dependence of switching time on applied electrical field [42].
Crystals 09 00470 g019
Figure 20. (a) Driving scheme for ESH FSC. Top three are the waveforms applied to three sequential RGB LEDs. The fourth waveform is the driving signal of ESH cell. (b) Some of the achieved colors with different gray levels [38].
Crystals 09 00470 g020
Figure 21. (a) The luminance viewing angle plot for the FLC in the dark state, (b) the intensity profile along the diffraction lobe. The left insertion shows the photograph of the bright and dark state under crossed polarizers, and right insertion shows the intensity profile of the diffraction lobe [44].
Crystals 09 00470 g021
Figure 22. (a) The schematic of the FLC grating cell with inter-digital electrodes, the blue means positive and red means negative charge. (b) the schematics of the FLC grating cell with periodic vertical electric field. (c) Diffraction pattern of FLC grating describe in (a). (d) Texture of defects after several cycle of operations on the top of ITO electrodes of FLC grating cell described in (a) [45].
Crystals 09 00470 g022
Figure 23. (a) The intensity profile of the diffraction of ESH cell between crossed polarizers in bright and dark state and insertion shows photographs of the respective states. (b) The two-step exposure fabrication procedure. (c) and (d) shows the textures of 1D and 2D ESH gratings [45].
Crystals 09 00470 g023
Figure 24. The dependence of first order transmittance on electric field in bright and dark state of ESH grating theoretically (solid line) and experimentally (dotted line). Insertions: Diffraction pattern of (a) 1D grating, (b) 2D grating and (c) black state; (d,e) are intensity profiles of 1D and 2D gratings measured at V = 5 V [47].
Crystals 09 00470 g024
Figure 25. Voltage dependence of the response time at frequency of 500 Hz (solid circles) and frequency dependence of the first order contrast ratio at voltage of 10 V (open circles). Insertion shows the waveforms of the applied voltage (bottom) and the transmittance of first order (top) at frequency of 5kHz [47].
Crystals 09 00470 g025
Figure 26. (a,b) illustrate the textures of the ESH Fresnel lens under polarized microscope. (c,d) show the photographs of the diffractive and non-diffractive states [51].
Crystals 09 00470 g026

