Article

Crystal Structure of NADPH-Dependent Methylglyoxal Reductase Gre2 from Candida Albicans

1
Department of Biology Education, Kyungpook National University, Daegu 41566, Korea
2
Research Institute for Phylogenomics and Evolution, Kyungpook National University, Daegu 41566, Korea
3
School of Life Sciences, Kyungpook National University, Daegu 41566, Korea
4
Biosystem Research Group, Korea Institute of Toxicology, Daejeon 34114, Korea
*
Authors to whom correspondence should be addressed.
Crystals 2019, 9(9), 471; https://doi.org/10.3390/cryst9090471
Submission received: 16 August 2019 / Revised: 7 September 2019 / Accepted: 8 September 2019 / Published: 10 September 2019
(This article belongs to the Special Issue Crystallographic Studies of Enzymes)

Abstract

:
Gre2 is a key enzyme in the methylglyoxal detoxification pathway; it uses NADPH or NADH as an electron donor to reduce the cytotoxic methylglyoxal to lactaldehyde. This enzyme is a member of the short-chain dehydrogenase/reductase (SDR) superfamily whose members catalyze this type of reaction with a broad range of substrates. To elucidate the structural features, we determined the crystal structures of the NADPH-dependent methylglyoxal reductase Gre2 from Candida albicans (CaGre2) for both the apo-form and NADPH-complexed form at resolutions of 2.8 and 3.02 Å, respectively. The CaGre2 structure is composed of two distinct domains: the N-terminal cofactor-binding domain and the C-terminal substrate-binding domain. Extensive comparison of CaGre2 with its homologous structures reveals conformational changes in α12 and β3′ of the NADPH-complex forms. This study may provide insights into the structural and functional variation of SDR family proteins.

Graphical Abstract

1. Instruction

Methylglyoxal (MG; CH3COCHO) is an extremely toxic compound to a wide variety of cells from microorganisms to mammals and plants. It acts as an inhibitor of cell division and is associated with a range of biological effects, including microtubule assembly, protein synthesis, and carcinogenicity [1,2]. During the triosephosphate isomerase reaction of glycolysis pathway, MG is generated as an unavoidable by-product under alkaline conditions from glyceraldehyde or dihydroxyacetone [3,4]. Accumulation of MG causes damage to nucleic acids and proteins in eukaryotic cells by irreversibly forming advanced glycation end products during glucose and fructose catalytic metabolism and producing bioactive free radicals [5,6,7].
There are typically two cellular processes that detoxify methylglyoxal. The first process converts methylglyoxal into D-lactate, which has the same redox level as methylglyoxal, by the glutathione-dependent glyoxalase system involving two enzymes; glyoxalase I (EC 4.4.1.5, lactoylglutathione methylglyoxal-lyase) and glyoxalase II (EC 3.1.2.6, hydroxyacylglutathione hydrolase). However, apart from this well-conserved pathway, glyoxalase III, which was discovered in an Escherichia coli lysate, converts MG directly into D-lactate without cofactors [8]. The second pathway uses specific enzymes, such as methylglyoxal reductase, with either NADH or NADPH as the electron donor to reduce methylglyoxal to lactaldehyde, followed by oxidation of lactaldehyde with NAD+ [9,10].
NADPH-dependent methylglyoxal reductase (EC1.1.1.283) is a member of the extended short-chain dehydrogenase/reductase (SDR) superfamily, which so far contains approximately 3000 primary structures in sequence databases and includes oxidoreductases, lyases, and isomerases. Despite the low sequence identity (15%–30%) between these SDR enzymes, their 3D structures all display a typical Rossman fold for cofactor binding with highly similar α/β patterns and a central β-sheet [11]. Furthermore, the key active site, a catalytic triad of Tyr, Lys, and Ser, is found in almost all SDR forms [2,12,13]. Tyr is the most conserved amino acid within the whole family and functions as the catalytic base. Ser stabilizes the substrate, and Lys interacts with the nicotinamide ribose and helps to lower the pKa of Tyr-OH [11]. However, the substrate-binding cleft structures are remarkably diverse among SDR proteins, which is consistent with the broad substrate spectrum of this family [2].
In the experimental yeast model, Saccharomyces cerevisiae, NADPH-dependent methylglyoxal reductase (Gre2) has been well studied in both its apo-form and NADPH-complexed form [2]. Gre2 is encoded by the GRE2 gene (genes de respuesta a estres, or “stress-responsive gene” in Spanish). The GRE2 promotor is induced along with those of GRE1 and GRE3 in response to a wide range of adverse conditions, which include osmotic, oxidative, ionic, heat shock, furfural, and heavy metal stresses [14,15,16]. Gre2, as a member of the SDR family, catalyzes the reduction of di-ketones; ketones; aliphatic, cyclic α- and β-keto esters; aldehydes; and various carbonyl compounds and chiral molecules for the pharmaceutical industry [2]. A solved three-dimensional structure of Gre2 shows high homology with 46% identity to NADPH-dependent aldehyde reductase from Kluyveromyces marxianus and with 30% identity to aldehyde reductase II from the red yeast Sporobolomyces salmonicolor [12,17]. Furthermore, Gre2 has sequence similarity to dihydroflavonol reductases from higher plants such as Vitis vinifera, and it is considered a distant homolog of 3-β-hydroxysteroid dehydrogenases from mammals such as mice and rats [12]. To date, Gre2 and its homologs from S. cerevisiae, Aspergillus niger, and goat liver have been purified to homogeneity, and their enzymatic properties characterized [17].
Candida albicans is the most frequently isolated fungal pathogen that causes severe diseases in immunocompromised patients; the pathogenicity is influenced by both extrinsic conditions and intrinsic factors that include detoxifying reductases [6]. However, no published report on C. albicans-specific structural features or molecular mechanism of methylglyoxal reductase is currently available. To fill this gap, we obtained crystals of C. albicans NADPH-dependent methylglyoxal reductase (CaGre2) in both its apo-form and NADPH-complexed form using the full-length C. albicans GRE2 tagged with hexahistidine (His6) at its N-terminus. The experimental data enabled us to uncover a detailed three-dimensional CaGre2 structure with and without the presence of the cofactor NADPH as well as to gain broader structural insight into this enzyme by comparing it with relevant homologs.

2. Materials and Methods

2.1. Overexpression and Purification of CaGre2

The full-length GRE2 gene (Gene ID: AJIU01000026.1) was amplified by polymerase chain reaction (PCR) using C. albicans genomic DNA (Korean Collection for Type Cultures), as reported in our previous study [18]. Briefly, the amplified product was cloned into the pET28a expression vector, which inserts a His6 tag to the N-terminus and causes overexpression of the recombinant protein in Escherichia coli strain BL21 Star (DE3). Cells were grown in Luria-Bertani (LB) medium (Ambrothia, Daejeon, Republic of Korea) containing 50 mg/L kanamycin (Applichem, St. Louis, MO, USA), followed by induction with 0.3 mM isopropyl β-D-1-thiogalactopyranoside (IPTG; Calbiochem, Sigma-Aldrich, St. Louis, MO, USA) for 16 h at 20 °C. Cells were harvested and disrupted by ultrasonication (SONICS, VCX-500/750, Sonics & Materials, Inc., Newtown, CT, USA), and then cell debris was removed by centrifugation. The soluble fraction was loaded to a Ni-NTA HiTrap chelating column (GE Healthcare, Mississauga, ON, Canada). The target protein was eluted with buffer containing 500 mM imidazole and subsequently loaded onto a HiPrep 16/60 Sephacryl S-300 HR column (GE Healthcare, Mississauga, ON, Canada) for size-exclusion chromatography (SEC). The purified CaGre2 protein was concentrated to 24 mg/mL and was stored at −80 °C until further crystallization trials.

2.2. Crystallization

Over 600 different conditions from sparse-matrix screening solution kits used for CaGre2 crystallization trials were performed at 7 °C using the sitting-drop vapor diffusion method. Cube-shaped crystals of CaGre2 appeared in drops containing equal volumes (1 µL) of protein sample (12 mg/mL) and reservoir solution (0.1 M sodium citrate tribasic dihydrate (pH 5.6), 20% (v/v) 2-propanol, and 20% (w/v) PEG 4000) in 1 day. Optimized crystals were obtained using the same conditions as the hanging drop vapor-diffusion method. The size of the crystals was approximately 0.1 × 0.1 × 0.1 mm. The CaGre2 crystals were flash cooled in liquid nitrogen after being transferred to a cryoprotectant containing crystallization buffer supplemented with 30% (v/v) glycerol. Crystals of the CaGre2-NADPH complex were obtained by soaking optimized CaGre2 crystals in the crystallizing buffer supplemented with 2 mM NADPH for 15 min, followed by flash-cooling in liquid nitrogen in the presence of crystallizing buffer supplemented with 30% (v/v) ethylene glycol.

2.3. Data Collection, Structure Solution, and Refinement

X-ray diffraction datasets of the CaGre2 apo-form protein and the protein in complex with NADPH were collected at 100 K on the beamline 5C of the Pohang Accelerator Laboratory (PAL, Pohang, Republic of Korea) using a Quantum 315 CCD detector (Area Detector Systems Corporation, Poway, CA, USA). Data were processed using the HKL2000 software suite (HKL Research, Charlottesville, VA, USA). The experimental electron density maps of both the apo-form and NADPH-complexed form were obtained by the molecular replacement method with Gre2 from Saccharomyces cerevisiae (PDB code, 4PVC), which has a 48.82% sequence identity with CaGre2, as a search model using Phaser in PHENIX software, version 1.9 (https://www.phenix-online.org/) (Lawrence Berkeley Laboratory, Berkeley, CA, USA) [19]. Model building and interpretation were performed using the WinCoot program (PHENIX, Berkeley, CA, USA). The structural models were refined using the PHENIX.refine program. Details of the data collection and relevant crystallographic statistics are listed in Table 1. All the structural figures were produced with the graphics program PyMOL (www.pymol.org) (Schrödinger Inc., New York, NY, USA).

3. Results

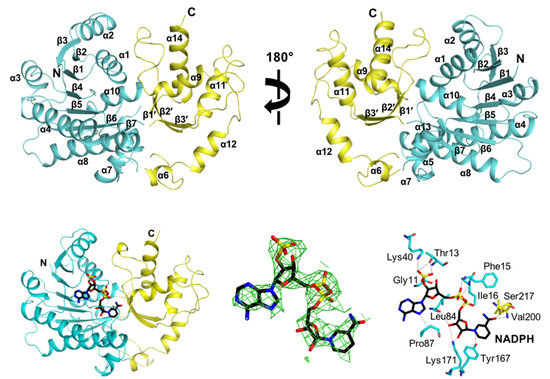
3.1. Overall Structure of CaGre2

CaGre2 shares high sequence homology with Gre2 from other yeasts, such as Spathaspora passalidarum (67.1%), Candida orthosilosis (64.9%), and Schefferomyces stipitis (61.8%) (Figure 1A) [21]. Based on the processed data, the CaGre2 crystal volume per protein mass (VM) was 3.69 Å3/Da. These results indicate that an asymmetric unit of CaGre2 contains only one molecule, with 66.7% solvent content [18,22]. The crystallographic state of CaGre2 was consistent with the results of SEC performance and with the PISA evaluation (solvation free energy gain = 0.89 kcal/mol, and interface complexation significance score = 0.00) [23]. The structure of CaGre2 is composed of 14 α-helices and 10 β-strands, which represent 46.1% and 15.5% of the total number of amino acid residues, respectively. There are two distinct domains in a CaGre2 molecule: one domain for cofactor binding in the N-terminus and the other domain for substrate binding in the C-terminal region (Figure 1B).
As is seen in other SDR enzyme structures, the cofactor-binding domain of CaGre2 adopts a typical Rossmann-fold motif, which is a β-sheet composed of seven parallel β-strands (β1-7 with strand topology 3-2-1-4-5-6-7) that form the hydrophobic core of the domain surrounded by nine α-helices (α1-5, α7-8, α10, α13) on both sides of the β-sheet (Figure 1B). Additionally, the conserved dinucleotide-binding motif (G11A12T13G14F15I16A17), which is responsible for the binding of NADPH, is exhibited as a loop followed by β1 and a partial helix of α1. The C-terminal substrate-binding domain is formed by five helices (α6, α9, α11-12, α14) and three twisted β-strands (β1′, β2′, β3′), with lengths ranging from 5 to 16 and from 3 to 6 residues, respectively (Figure 1).

3.2. Structural Comparisons between CaGre2 and Homologous Proteins

To define the structural homologs of CaGre2, a PDB search using the Dali protein structure comparison server was performed [24]. The output revealed that the CaGre2 structure has homology with enzymes from yeasts, plants, mammals, and bacteria (Figure 2). The overall structure of CaGre2 is highly similar to those of Saccharomyces cerevisiae NADPH-dependent methylglyoxal reductase Gre2 (ScGre2; PDB code, 4PVC) and Scheffersomyces stipitis carbonyl reductase (SsCR; PDB code, 5GMO), with gaining root mean square deviations (r.m.s.d) of 1.3 and 1.4 Å (342 Cα positions aligned), and Z-scores of 47.2 and 45.3, respectively (Table 2). The plant-derived homologous structures have somewhat high homology with CaGre2, such as Medicago truncatula cinnamyl-alcohol dehydrogenase 2 (MtCAD2; PDB code, 4QTZ) and Sorghum bicolor cinnamoyl-CoA reductase 1 (SbCCR1; PDB code, 5TQM), with r.m.s.d of 2.5 and 2.2 Å, and Z-scores of 35.4 and 33.1, respectively. However, the CaGre2 structure has relatively low homology with enzymes from mammals and bacteria, UDP-galactose 4-epimerase (UGE) from Homo sapiens (HsUGE; PDB code, 1EK5) and Escherichia coli (EcUGE; PDB code, 1NAI), with r.m.s.d. of approximately 3.0 Å, and Z-scores of roughly 26. Remarkably, all these enzymes are classified as belonging to the SDR family. As expected, the overall structural comparisons of CaGre2 against each of its counterparts revealed that both CaGre2 and the homologous enzymes exhibited a typical folding pattern for the Rossmann motif in the cofactor-binding domain with quite similar patterns (Figure 2).
The substrate-binding domain of CaGre2 homologous structures showed varied conformations at the corresponding positions of α12 and β3′ in CaGre2 (Figure 2). β3′ is located between the β7 strand from the Rossman fold and the α11 helix in the C-terminal domain (Figure 1A). β7 and α11 (corresponding to CaGre2) are found in homologous structures with almost the same orientation as in CaGre2. Notably, only the CaGre2 structure contains an additional α12 helix, whereas structures of yeast (ScGre2, SsCR) and plant (MtCAD2, SbCCR1) show highly flexible loops at the corresponding positions (Figure 2). Moreover, a β-strand made up of four residues was found in HsUGE and EcUGE. β3′ varies in length among the compared homologous structures, but CaGre2 has the longest, which comprises five amino acids, and consequently twists to a larger degree compared with the others, which are formed by only 2–4 residues. This segment in EcUGE is exhibited as a loop region, instead of a β-strand (Figure 2).

3.3. NADPH Binding Site

To study the cofactor binding mode, we obtained crystals of the CaGre2 structure in complex with NADPH. The cofactor NADPH is bound to the N-terminal (cofactor binding) domain in the proximity of the C-terminal domain of CaGre2 (Figure 3A). Based on our refined structure, an apparent electron density of NADPH is shown in the FoFc omit map. Although the B-factor of NADPH is somewhat high compared to protein, it could be due to low resolution. In addition, the B-factor of the CaGre2 protein from the apo structure shows much lower than that of NADPH complex structure. Taken together, it suggests that NADPH is stably bound within the cofactor binding site (Figure 3B). NADPH interacts primarily by hydrogen bonding with 11 residues from both the N- and C-terminal domains of CaGre2 (Figure 3C). The residues Gly11, Thr13, Phe15, and Ile16 of the dinucleotide-binding motif interact with NADPH via five hydrogen bonds. In detail, the main chains of Phe15 and Ile16 form two hydrogen bonds with the diphosphate moiety of NADPH. Meanwhile, the main chain of Gly11 and the side chain of Thr13 interact with the ribose ring of the adenine mononucleotide phosphate (AMP) moiety. Thus, the carbonyl group of Gly11 provides stabilization of the NADPH hydroxyl group by one hydrogen bond. Thr13, along with Lys40, is involved in bonding with NADPH via the phosphate group at the ribose 2’ position. Notably, the salt-bridge between Lys40 and the 2’-phosphate of adenosine in NADPH suggests that CaGre2 might exhibit a stronger affinity for NADPH than NADH, as also happens with some other enzymes in the SDR family, such as ScGre2 and Sporobolomyces salmonicolor carbonyl reductase (SaCR; PDB code, 1ZZE). In the nicotinamide mononucleotide (NMN) moiety, both Leu84 and Lys171 interact with the 3’-hydroxyl group of the ribose ring by hydrogen bonds. Simultaneously, Tyr167, Val 200, and Ser217 from the C-terminal domain stabilize the nicotinamide ring of NADPH by hydrogen bonds. These interactions contribute to positioning the NMN moiety correctly via six hydrogen bonds. Furthermore, in the AMP moiety, the adenine ring is captured by interactions between its N7 atom and the pyrrolidine group of Pro87 (Figure 3C).
To assess NADPH-dependent conformational changes in CaGre2, the apo-form of CaGre2 was superimposed onto the NADPH-complexed structure (Figure 3D). The Dali pairwise structural alignment revealed an r.m.s.d. of 0.6 Å over 339 Cα atoms and a Z-score of 53.9, indicating that no obvious conformational differences are detected in the overall structures. However, in the NADPH-binding site, several residues in the NADPH-complexed structure are shifted remarkably toward the NADPH molecule (Figure 3E). Strikingly, the main chains of Leu84, Pro87, Tyr167, and Ser217 move adjacent to the dinucleotide moiety by 0.96, 2.09, 1.15, and 0.8 Å, respectively. A rearrangement in side-chain orientation occurs with Gly11, Thr13, Phe15, Ile16, Lys40, and Lys82 by movement in the range of 0.18–1.57 Å. As a result, the helices α4, α7, and α8 shift slightly toward the NADPH binding site (Figure 3D).
To uncover to the key active site residues of CaGre2, a comparison of sequences was performed using the protein sequences of CaGre2, ScGre2, SsCR, and Kluyveromyces polyspora alcohol dehydrogenase (KpADH; PDB code, 5Z2X) (Figure 3F). The Ser129, Tyr167, and Lys171 residues of CaGre2 are well conserved among the four enzymes and are reported as being the core catalytic residues in those structures [2,27,28]. This suggests that these three residues most likely act as a crucial catalytic triad in CaGre2. As reported, the serine residue in the catalytic triad stabilizes the substrate, whereas tyrosine functions as a catalytic base. Lysine lowers the pKa of the hydroxyl group of the tyrosine and interacts with the nicotinamide ribose of the cofactor via hydrogen bonds [29]. Indeed, all the catalytic residues in the NADPH-complexed CaGre2 are located in the vicinity of the entrance to the substrate-binding pocket, which is oriented toward the NADPH NMN moiety (Figure 3G). Tyr167 and Lys171 form hydrogen bonds with the nicotinamide ring of NADPH (Figure 3C). Meanwhile, Ser129 has no interaction with any atom of the dinucleotide cofactor, and the hydroxyl group of Ser129 is oriented toward the outer position in the pocket relative to those of Tyr167 and Lys171 (Figure 3G).
To compare the relative positions of their catalytic triads, structures of the four yeast homologs CaGre2, ScGre2, SsCR, and KpADH were superimposed (Figure 3H). The locations of these residues were closely overlaid, as shown in the sequence alignment (Figure 3F,H). Both the tyrosine and lysine residues belong to the α8 helix, while the nearby serine residue is located on the β5-α5 loop. Nevertheless, the side-chain orientation of the lysine residue was somewhat different than that of the other residues of the triad (Figure 3H). Since lysine functions as an essential cofactor-interacting element, the rotated conformation of lysine in CaGre2 could suggest a difference in its NADPH binding mode.

3.4. Comparisons of NAD(P)H Binding Sites

To compare NAD(P)H conformations, NAD(P)H from complex structures of CaGre2 homologous from different species such as plant (SbCCR1), mammal (HsUGE), and bacteria (EcUGE) were superimposed (Figure 4A). All the four NAD(P)H conformations exhibited similar orientations, whereas each of the backbones varied remarkably with no region that fit. Both ribose rings in these NAD(P)H adopted the C2′-endo conformation but to different degrees. The two ribose moieties of NADPH from the CaGre2 structure showed less puckered forms than those of other complex structures. In addition, all the NAD(P)H show that carboxamide in the nicotinamide ring is associated with the oxygen atom in the adjacent phosphate group by a hydrogen bond, which means that all of these nicotinamide rings adopt the syn-conformation.
Due to the low sequence identity and the variations in NAD(P)H conformations among CaGre2 homologs, the environments of the NAD(P)H binding sites exhibited differences (Figure 4B–D). EcUGE might have considerably higher NADH binding affinity via 26 hydrogen bonds and 15 residues than CaGre2, SbCCR1, and HsUGE, which show 10–13 interactions via 7–11 residues. Even though the number of cofactor binding residues and hydrogen bonds was distributed almost equivalently between NMN and AMN moieties in the four compared structures, comparisons of interacting residues between CaGre2 and each of the three structural homologs reveal that several common amino acids shift their main chains rigidly in parallel manners. For example, Ile16, Tyr167, and Lys171 (corresponding to CaGre2) were conserved in location and were involved in the hydrogen bonding with NAD(P)H. Hence, this result was similar for Phe15, in that its equivalent residue is tyrosine in the other three structures. Furthermore, both Ser217 of CaGre2 with Ser225 of SbCCR1 and Leu84 of CaGre2 with Phe80 of EcUGE adopt almost identical main chain orientations and hydrogen bond formations with the same elements of the dinucleotide (Figure 3B,D).

4. Discussion

The SDR family, including Gre2 (EC1.1.1.283), is large and renowned for covering several EC classes such as lyases, isomerases, and oxidoreductases [11]. Enzymes belonging to this family utilize either NADH or NADPH as a prerequisite cofactor [13]. In general, there are two domains located on two distinct lobes to sandwich the substrate- and the cofactor NAD(P)H-binding pockets. The N-terminal domains that bind the cofactor each adopts a typical Rossmann fold despite low sequence identity, whereas the C-terminal substrate-binding domain is highly variable to catalyze a broader spectrum of substrates. As an SDR enzyme, Gre2 inherits characteristic features in both structural and functional aspects. Although both the X-ray structure and catalytic mechanism of ScGre2 have been thoroughly studied, little is known about this enzyme in other species [2]. Since ScGre2 and CaGre2 share a sequence identity of only 48%, some structural aspects of the distinct properties of CaGre2 can be suggested.
The overall structure of CaGre2 mostly adopts patterns similar to its homologous enzymes (Figure 1B, Figure 2). However, the C-terminal domain exhibits notable conformational variation in the α12 and β3′ regions. Based on the six structurally homologous enzymes from yeast (ScGre2, SsCR), plant (MtCAD2, SbCCR1), mammal (HsUGE), and bacteria (EcUGE), none of them adopt a helix conformation corresponding to that of α12 in CaGre2. The structures of yeast and plant contain flexible loops consisting of 19–24 residues that link the two domains in the equivalent positions of α12 in CaGre2. In contrast, corresponding β-sheets are seen in both HsUGE and EcUGE structures, which are all exposed to the surface and located near the entrance of the substrate-binding pocket, and might possibly limit conformational changes upon substrate binding. In addition, the longer β3′ in CaGre2, which contributes to the twisted β-sheets in the C-terminal domain that covers the bound NADPH, suggests a higher restriction in the space for cofactor binding in CaGre2 than in those of its homologs.
Hydrogen bonds are what mainly stabilize cofactor binding in CaGre2 (Figure 3C). The 2’-phosphate in the AMP moiety of NADPH contributes to salt-bridge interactions with positively-charged residues (Lys and Arg) in CaGre2, ScGre2, and S. salmonicolor carbonyl reductase [2,30]. The observation of salt-bridges supports a higher affinity as well as preferential binding of NADPH over NADH in these enzymes, which is contrary to the reported data for HsUGE an EcUGE [31,32]. Additionally, the catalytic triad Ser129-Tyr167-Lys171 in CaGre2 is well conserved in yeast (ScGre2, SsCR, KpADH) and plant homologs (MtCAD2, SbCCR1); this catalytic triad has also been reported to play crucial roles in the catalytic pathway [2,27,28,33,34].
The NAD(P)H conformations from the structures of CaGre2 and representatives from plant (SbCCR1), mammal (HsUGE), and bacteria (EcUGE) display considerable variation (Figure 4A), possibly due to their varied shapes, the different residues that comprise the cofactor-binding pockets, and their specific affinities for cofactor molecules. Nevertheless, among the four compared structures, the structurally and functionally conserved Phe15, Ile16, Tyr167, and Lys171 residues are noteworthy and likely to be important for interacting with the phosphate and NMN moieties of NAD(P)H [31,32,34].
Taken together, the crystal structures of CaGre2 apo-form and NADPH-complexed form as presented here may provide insights into elucidating the overall view of substrate specificity of SDR enzymes.

Author Contributions

Cloning, protein purification, and crystallization, G.T.N. and S.K.; diffraction data collection and analysis, G.T.N., S.K., H.S.J., and J.H.C.; enzymology, D.H.C., H.S.C., W.K.K., and J.H.C.; supervision, J.H.C.; writing—original draft, G.T.N.; and writing—review and editing, G.T.N. and J.H.C.

Funding

This research was supported by funds from the Basic Science Research Program of the National Research Foundation of Korea, funded by the Ministry of Science and ICT (Grant No. 2019R1A2C4069796), and from a cooperation project for the development of predicting platforms for human toxicity by BIT technology, funded by the Korea Institute of Toxicology to J.H.C.

Acknowledgments

We would like to thank beamline staffs Yeon-Gil Kim and Sung Chul Ha at beamlines 5C and 7A of the Pohang Accelerator Laboratory (Pohang, Korea) for data collection.

Conflicts of Interest

The authors declare no conflicts of interest.

References

  1. Murata, K.; Fukuda, Y.; Simosaka, M.; Watanabe, K.; Saikusa, T.; Kimura, A. Metabolism of 2-oxoaldehyde in yeasts. Purification and characterization of NADPH-dependent methylglyoxal-reducing enzyme from Saccharomyces cerevisiae. J. Boil. Inorg. Chem. 1985, 151, 631–636. [Google Scholar] [CrossRef] [PubMed]
  2. Guo, P.C.; Bao, Z.Z.; Ma, X.X.; Xia, Q.; Li, W.F. Structural insights into the cofactor-assisted substrate recognition of yeast methylglyoxal/isovaleraldehyde reductase Gre2. Biochim. Biophys. Acta (BBA) Proteins Proteom. 2014, 1844, 1486–1492. [Google Scholar] [CrossRef] [PubMed]
  3. Dafré, A.; Goldberg, J.; Wang, T.; Spiegel, D.; Maher, P. Methylglyoxal, the foe and friend of glyoxalase and Trx/TrxR systems in HT22 nerve cells. Free. Radic. Boil. Med. 2015, 89, 8–19. [Google Scholar] [CrossRef] [PubMed] [Green Version]
  4. Maeta, K.; Izawa, S.; Inoue, Y.J. Methylglyoxal, a metabolite derived from glycolysis, functions as a signal initiator of the high osmolarity glycerol-mitogen-activated protein kinase cascade and calcineurin/Crz1-mediated pathway in Saccharomyces cerevisiae. J. Biol. Chem. 2005, 280, 253–260. [Google Scholar] [CrossRef] [PubMed]
  5. Gomes, R.A.; Miranda, H.V.; Silva, M.S.; Graã§a, G.; Coelho, A.V.; Ferreira, A.E.D.N.; Cordeiro, C.; Freire, A.P.; Graça, G.; Ferreira, A.E.D.N. Protein glycation and methylglyoxal metabolism in yeast: Finding peptide needles in protein haystacks. FEMS Yeast Res. 2008, 8, 174–181. [Google Scholar] [CrossRef] [PubMed]
  6. Shin, Y.; Lee, S.; Ku, M.; Kwak, M.K.; Kang, S.O. Cytochrome c peroxidase regulates intracellular reactive oxygen species and methylglyoxal via enzyme activities of erythroascorbate peroxidase and glutathione-related enzymes in Candida albicans. Int. J. Biochem. Cell Boil. 2017, 92, 183–201. [Google Scholar] [CrossRef] [PubMed]
  7. Kwak, M.K.; Ku, M.; Kang, S.O. Inducible NAD(H)-linked methylglyoxal oxidoreductase regulates cellular methylglyoxal and pyruvate through enhanced activities of alcohol dehydrogenase and methylglyoxal-oxidizing enzymes in glutathione-depleted Candida albicans. Biochim. Biophys. Acta (BBA) Gen. Subj. 2018, 1862, 18–39. [Google Scholar] [CrossRef] [PubMed]
  8. Islam, T.; Ghosh, A. Genome-wide dissection and expression profiling of unique glyoxalase III genes in soybean reveal the differential pattern of transcriptional regulation. Sci. Rep. 2018, 8, 4848. [Google Scholar] [CrossRef] [PubMed]
  9. Gomes, R.A.; Miranda, H.V.; Silva, M.S.; Graça, G.; Coelho, A.V.; Ferreira, A.E.; Cordeiro, C.; Freire, A.P.J.T.F.j. Yeast protein glycation in vivo by methylglyoxal: Molecular modification of glycolytic enzymes and heat shock proteins. FEBS J. 2006, 273, 5273–5287. [Google Scholar] [CrossRef]
  10. Chen, C.N.; Porubleva, L.; Shearer, G.; Svrakic, M.; Holden, L.G.; Dover, J.L.; Johnston, M.; Chitnis, P.R.; Kohl, D.H. Associating protein activities with their genes: Rapid identification of a gene encoding a methylglyoxal reductase in the yeastSaccharomyces cerevisiae. Yeast 2003, 20, 545–554. [Google Scholar] [CrossRef]
  11. Oppermann, U.; Filling, C.; Hult, M.; Shafqat, N.; Wu, X.; Lindh, M.; Shafqat, J.; Nordling, E.; Kallberg, Y.; Persson, B.; et al. Short-chain dehydrogenases/reductases (SDR): The 2002 update. Chem. Interact. 2003, 143, 247–253. [Google Scholar] [CrossRef]
  12. Breicha, K.; Müller, M.; Hummel, W.; Niefind, K.J.A.C.S.F. Crystallization and preliminary crystallographic analysis of Gre2p, an NADP+-dependent alcohol dehydrogenase from Saccharomyces cerevisiae. Acta Crystallogr. Sect. F Struct. Biol. Cryst. Commun. 2010, 66, 838–841. [Google Scholar] [CrossRef] [PubMed]
  13. Persson, B.; Kallberg, Y. Classification and nomenclature of the superfamily of short-chain dehydrogenases/reductases (SDRs). Chem. Interact. 2013, 202, 111–115. [Google Scholar] [CrossRef] [PubMed]
  14. Moon, J.; Liu, Z.L. Engineered NADH-dependent GRE2 from Saccharomyces cerevisiae by directed enzyme evolution enhances HMF reduction using additional cofactor NADPH. Enzym. Microb. Technol. 2012, 50, 115–120. [Google Scholar] [CrossRef] [PubMed]
  15. Warringer, J.; Blomberg, A. Involvement of yeastYOL151W/GRE2 in ergosterol metabolism. Yeast 2006, 23, 389–398. [Google Scholar] [CrossRef] [PubMed] [Green Version]
  16. Garay-Arroyo, A.; Covarrubias, A.A. Three genes whose expression is induced by stress in Saccharomyces cerevisiae. Yeast 1999, 15, 879–892. [Google Scholar] [CrossRef]
  17. Akita, H.; Watanabe, M.; Suzuki, T.; Nakashima, N.; Hoshino, T. Characterization of the Kluyveromyces marxianus strain DMB1 YGL157w gene product as a broad specificity NADPH-dependent aldehyde reductase. AMB Express 2015, 5, 991. [Google Scholar] [CrossRef]
  18. Nguyen, G.T.; Kim, S.A.; Chun, H.S.; Kim, W.K.; Chang, J.H. Purification, crystallization and X-ray crystallographic analysis of methylglyoxal reductase Gre2 from Candida albicans. Korean Soc. Struct. Boil. 2019, 7, 42–46. [Google Scholar] [CrossRef]
  19. McCoy, A.J.; Grosse-Kunstleve, R.W.; Adams, P.D.; Winn, M.D.; Storoni, L.C.; Read, R.J. Phaser crystallographic software. J Appl. Cryst. 2007, 40, 658–674. [Google Scholar] [CrossRef]
  20. Karplus, P.A.; Diederichs, K. Linking crystallographic model and data quality. Science 2012, 336, 1030–1033. [Google Scholar] [CrossRef]
  21. Madden, T. The BLAST Sequence Analysis Tool. In The NCBI Handbook [Internet], 2nd ed.; National Center for Biotechnology Information (US): Bethesda, MD, USA, 2013. Available online: https://www.ncbi.nlm.nih.gov/books/NBK153387/ (accessed on 9 September 2019).
  22. Matthews, B. Solvent content of protein crystals. J. Mol. Boil. 1968, 33, 491–497. [Google Scholar] [CrossRef]
  23. Krissinel, E.; Henrick, K. Inference of Macromolecular Assemblies from Crystalline State. J. Mol. Boil. 2007, 372, 774–797. [Google Scholar] [CrossRef] [PubMed]
  24. Holm, L. Benchmarking fold detection by DaliLite v.5. Bioinformatics 2019, 5. [Google Scholar] [CrossRef] [PubMed]
  25. Thompson, J.D.; Gibson, T.J.; Higgins, D.G. Multiple sequence alignment using ClustalW and ClustalX. Curr. Protoc. Bioinform. 2003, 00, 2.3.1–2.3.22. [Google Scholar] [CrossRef] [PubMed]
  26. Courcelle, E.; Gouet, P.; Stuart, D.I.; Métoz, F. ESPript: Analysis of multiple sequence alignments in PostScript. Bioinformatics 1999, 15, 305–308. [Google Scholar]
  27. Zhou, J.; Wang, Y.; Xu, G.; Wu, L.; Han, R.; Schwaneberg, U.; Rao, Y.; Zhao, Y.L.; Zhou, J.; Ni, Y. Structural Insight into Enantioselective Inversion of an Alcohol Dehydrogenase Reveals a “Polar Gate” in Stereorecognition of Diaryl Ketones. J. Am. Chem. Soc. 2018, 140, 12645–12654. [Google Scholar] [CrossRef]
  28. Shang, Y.P.; Chen, Q.; Kong, X.D.; Zhang, Y.J.; Xu, J.H.; Yu, H.L. Efficient Synthesis of (R)-2-Chloro-1-(2,4-dichlorophenyl)ethanol with a Ketoreductase fromScheffersomyces stipitisCBS 6045. Adv. Synth. Catal. 2017, 359, 426–431. [Google Scholar] [CrossRef]
  29. Filling, C.; Berndt, K.D.; Benach, J.; Knapp, S.; Prozorovski, T.; Nordling, E.; Ladenstein, R.; Jörnvall, H.; Oppermann, U. Critical Residues for Structure and Catalysis in Short-chain Dehydrogenases/Reductases. J. Boil. Chem. 2002, 277, 25677–25684. [Google Scholar] [CrossRef] [Green Version]
  30. Kamitori, S.; Iguchi, A.; Ohtaki, A.; Yamada, M.; Kita, K. X-ray Structures of NADPH-dependent Carbonyl Reductase from Sporobolomyces salmonicolor Provide Insights into Stereoselective Reductions of Carbonyl Compounds. J. Mol. Boil. 2005, 352, 551–558. [Google Scholar] [CrossRef]
  31. Thoden, J.B.; Wohlers, T.M.; Fridovich-Keil, J.L.; Holden, H.M. Crystallographic Evidence for Tyr 157 Functioning as the Active Site Base in Human UDP−Galactose 4-Epimerase. Biochemistry 2000, 39, 5691–5701. [Google Scholar] [CrossRef]
  32. Thoden, J.B.; Frey, P.A.; Holden, H.M. Crystal Structures of the Oxidized and Reduced Forms of UDP-galactose 4-Epimerase Isolated from Escherichia coli. Biochemistry 1996, 35, 2557–2566. [Google Scholar] [CrossRef] [PubMed]
  33. Pan, H.; Zhou, R.; Louie, G.V.; Muhlemann, J.K.; Bomati, E.K.; Bowman, M.E.; Dudareva, N.; Dixon, R.A.; Noel, J.P.; Wang, X. Structural Studies of Cinnamoyl-CoA Reductase and Cinnamyl-Alcohol Dehydrogenase, Key Enzymes of Monolignol Biosynthesis. Plant Cell 2014, 26, 3709–3727. [Google Scholar] [CrossRef] [PubMed] [Green Version]
  34. Sattler, S.A.; Walker, A.M.; Vermerris, W.; Sattler, S.E.; Kang, C. Structural and biochemical characterization of cinnamoyl-CoA reductases. Plant Physiol. 2017, 173, 1031–1044. [Google Scholar] [CrossRef] [PubMed]
Figure 1. Overall structure of NADPH-dependent methylglyoxal reductase Gre2 from Candida albicans. (A) Multiple sequence alignment of CaGre2 (KGQ86193.1), CoGre2 (XP_003870607.1), SpGre2 (XP_007377476.1), and SsGre2 (XP_001384081.2). Secondary structural elements of CaGre2 are presented on the top and are colored corresponding to different domains, as shown in (B). Conserved residues are marked in red. (B) Schematic representation of the overall structure of CaGre2. (C) The right panel shows a view of 180° rotation along the Y-axis from the orientation shown in the left panel. The CaGre2 N-terminal domain is shown in cyan, and the C-terminal domain is shown in yellow.
Crystals 09 00471 g001
Figure 2. Structural comparisons of CaGre2 with homologous proteins. Overall structures of CaGre2 (cyan), ScGre2 (PDB code, 4PVC; red), SsCR (PDB code, 5GMO; orange), MtCAD2 (PDB code, 4QTZ; green), SbCCR1 (PDB code, 5TQM; light blue), HsUGE (PDB code, 1EK5; magenta), and EcUGE (PDB code, 1NAI; dark gray). Secondary structure elements (α12 and β3′) are marked corresponding to the CaGre2 structure. Red dashed circles and red arrowheads indicate the positions of structural differences. Multiple sequence alignment of α12 and β3′ are presented in blue and orange boxes, respectively. Conserved residues are marked in red.
Crystals 09 00471 g002
Figure 3. CaGre2 NADPH-complexed structure and NADPH-binding site. (A) Schematic representation of CaGre2 NADPH-complexed structure. Domains are colored as in Figure 1B. (B) Simulated-annealing omit Fo–Fc electron density at 3.02 Å resolution for NADPH, contoured at 2.4σ. (C) Hydrogen bonds between NADPH and residues in CaGre2. Hydrogen bonds are shown as black dashed lines. Residues are colored according to their domain, as in Figure 1B. Comparisons of (D) overall structures and of (E) residues participating in NADPH-binding in structures of the apo-form and NADPH-complexed form of the CaGre2 protein. The CaGre2 apo-form is shown in magenta. The CaGre2 NADPH-complexed form is shown in cyan. (F) Multiple sequence alignment of CaGre2 (KGQ86193.1), SsCR (XP_001384998.1), ScGre2 (NP_014490.1), and KpADH (XP_001644505.1) by using ClustalW [25] and ESPript [26]. The catalytic triad (S129-Y167-K171) in CaGre2 is marked with a red star. (G) Electrostatic surface presentation of the NADPH- and substrate-binding pockets. The location of catalytic residues is marked by a yellow circle. (H) Superposition of the catalytic triads in CaGre2 (cyan), ScGre2 (PDB code, 4PVD; light pink), SsCR (PDB code, 5YW4; yellow), and KpADH (PDB code, 5Z2X; light gray). Residue numbering corresponds to CaGre2. NADPH is indicated in black.
Crystals 09 00471 g003
Figure 4. Comparisons of NAD(P)H conformations and NAD(P)H-interacting residues. (A) Superposition of NAD(P)H conformations in SbCCR1 (PDB code, 5TQM; light yellow), HsUGE (PDB code, 1EK5; pink), EcUGE (PDB code, 1NAI; light gray), and CaGre2 (black) structures. Comparisons of NAD(P)H-interacting residues between CaGre2 (cyan), (B) SbCCR1 (magenta), (C) HsUGE (yellow), and (D) EcUGE (orange).
Crystals 09 00471 g004
Table 1. Data collection and processing.
Crystallographic DataCaGre2-apoCaGre2-NADPH Complex
Data Collection
Space groupI23I23
a, b, c (Å)149.59, 149.59, 149.59152.45, 152.45, 152.45
α, β, γ (˚)90, 90, 9090, 90, 90
Resolution range (Å)50.0–2.8 (2.9−2.8)a50.0–3.02 (3.07−3.02)
No. of total reflections144,851482,172
No. of unique reflections13,91811,745
Completeness (%)100 (100)100 (100)
Multiplicity10.441.1
II43.8 (8.8)32 (1.9)
Rmerge (%)b11.4 (53.1)14.2 (186.8)
CC1/2f0.998 (0.949)0.999 (0.815)
Refinement
Resolution range (Å)35.0–2.850.0–3.02
No. of reflections13,91211,745
Rworkc/Rfreed (%)17.2/21.119.8/26.2
R.M.S. deviation
Bond lengths (Å)0.0100.009
Bond angles (o)1.0341.034
Average B-factor
Protein47.991.2
Solvent39.2
Ligand 136.3
Ramachandran plotg
Most favored (%)97.8992.26
Additional allowed (%)1.515.95
PDB code6KWS6KWT
aThe numbers in parentheses are statistics from the highest resolution shell. b Rmerge = Σ |IobsIavg| / Iobs, where Iobs is the observed intensity of individual reflections and Iavg is averaged over symmetry equivalents. cR-factor = ∑h||Fo(h)| − |Fc(h)|| / ∑h|Fo(h)|, where Fo and Fc are the observed and calculated structure-factor amplitudes, respectively. dR-free was calculated with 5% of the data excluded from the refinement. e Root-mean-square deviation from ideal values. f [20]. g Categories as defined by MolProbity.
Table 2. Homologous proteins for comparison.
Protein NameSpeciesZ-Scorer.m.s.d (Å)Structural Features a,b
β7β3′α11α12
ScGre2S. cerevisiae47.21.3ss
A268–T271
hl
SsCRS. stipitis45.31.4ss
R265–N267
hl
MtCAD2M. truncatula35.42.2ss
V257–H259
hl
SbCCR1S. bicolor33.12.5ss
R275–H278
hl
HsUGEH. sapiens26.13.1ss
Y275–S276
hs
Y294–V297
EcUGEE. coli263.0slhs
Y286–A289
a Structural features (β7, β3′, α11, and α12) correspond to secondary structural elements of CaGre2. b Structural features of compared proteins are presented as h (helix) or s (strand) or l (loop). Detailed residues are listed with their corresponding structural features in the figures below.

