Analysis of Glulisine Crystallisation Utilising Phase Diagrams and Nucleants

 , , ,
, , ,  and
and 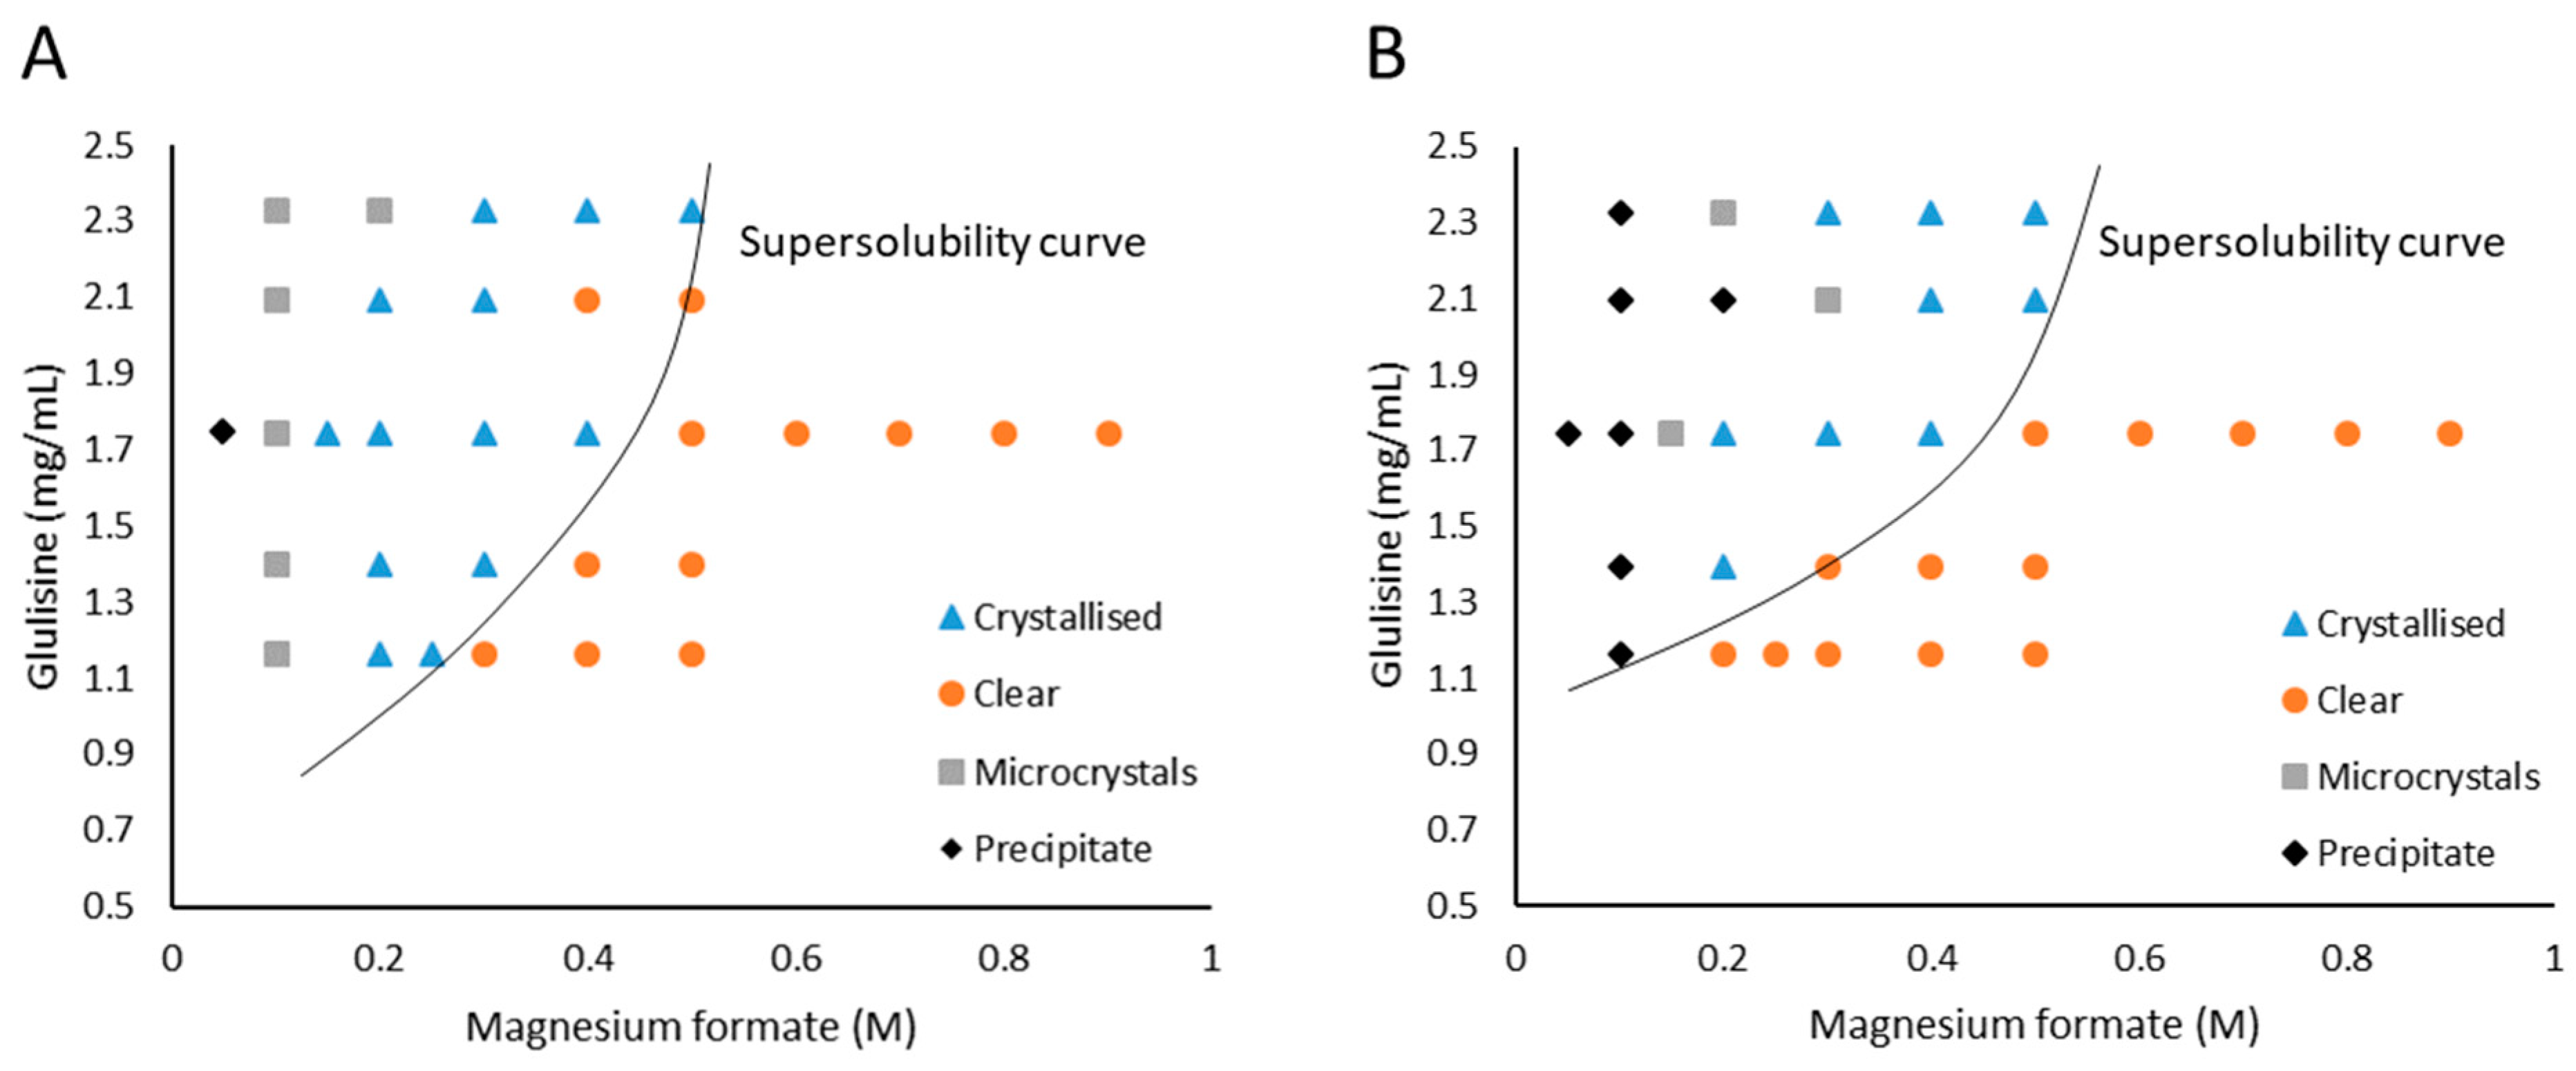
Abstract
1. Introduction
1.1. The Application of the Phase Diagram and Nucleants
1.2. Glulisine
2. Materials and Methods
2.1. Protein and Precipitants
2.2. Crystallisation Methods
2.3. Nucleants
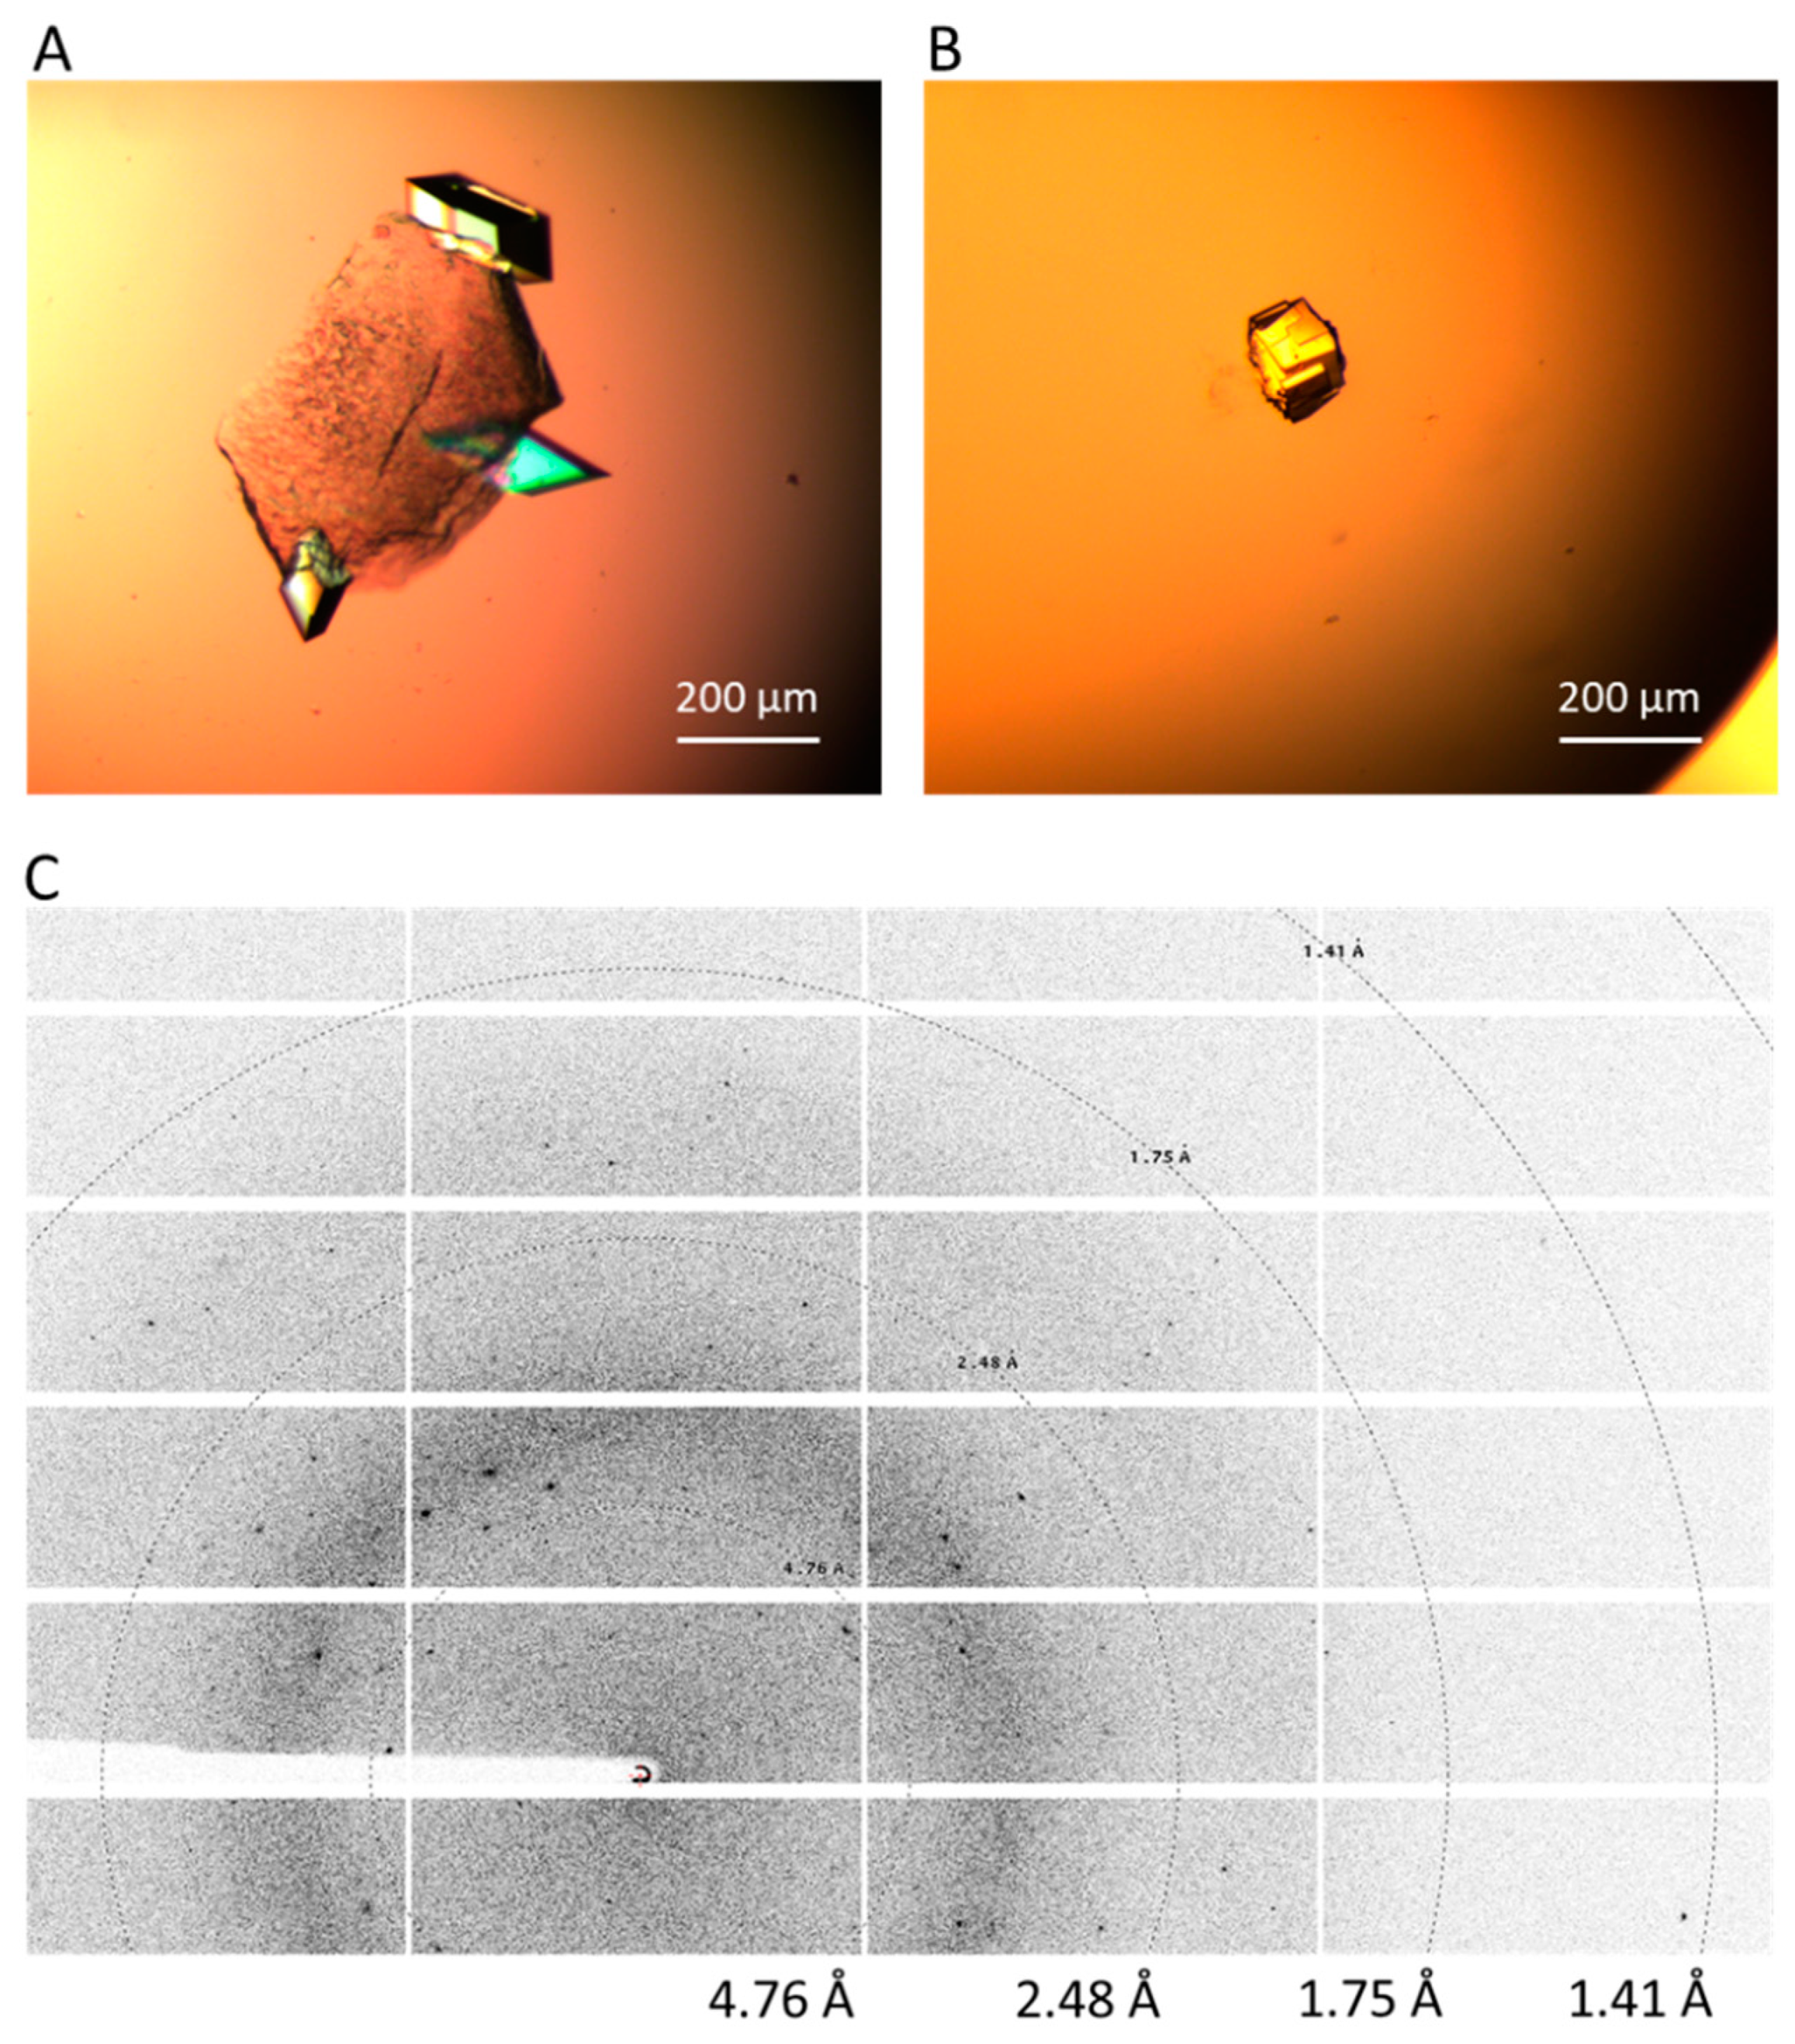
2.4. Crystal Harvesting and Data Collection
3. Results
3.1. Glulisine and Magnesium Formate
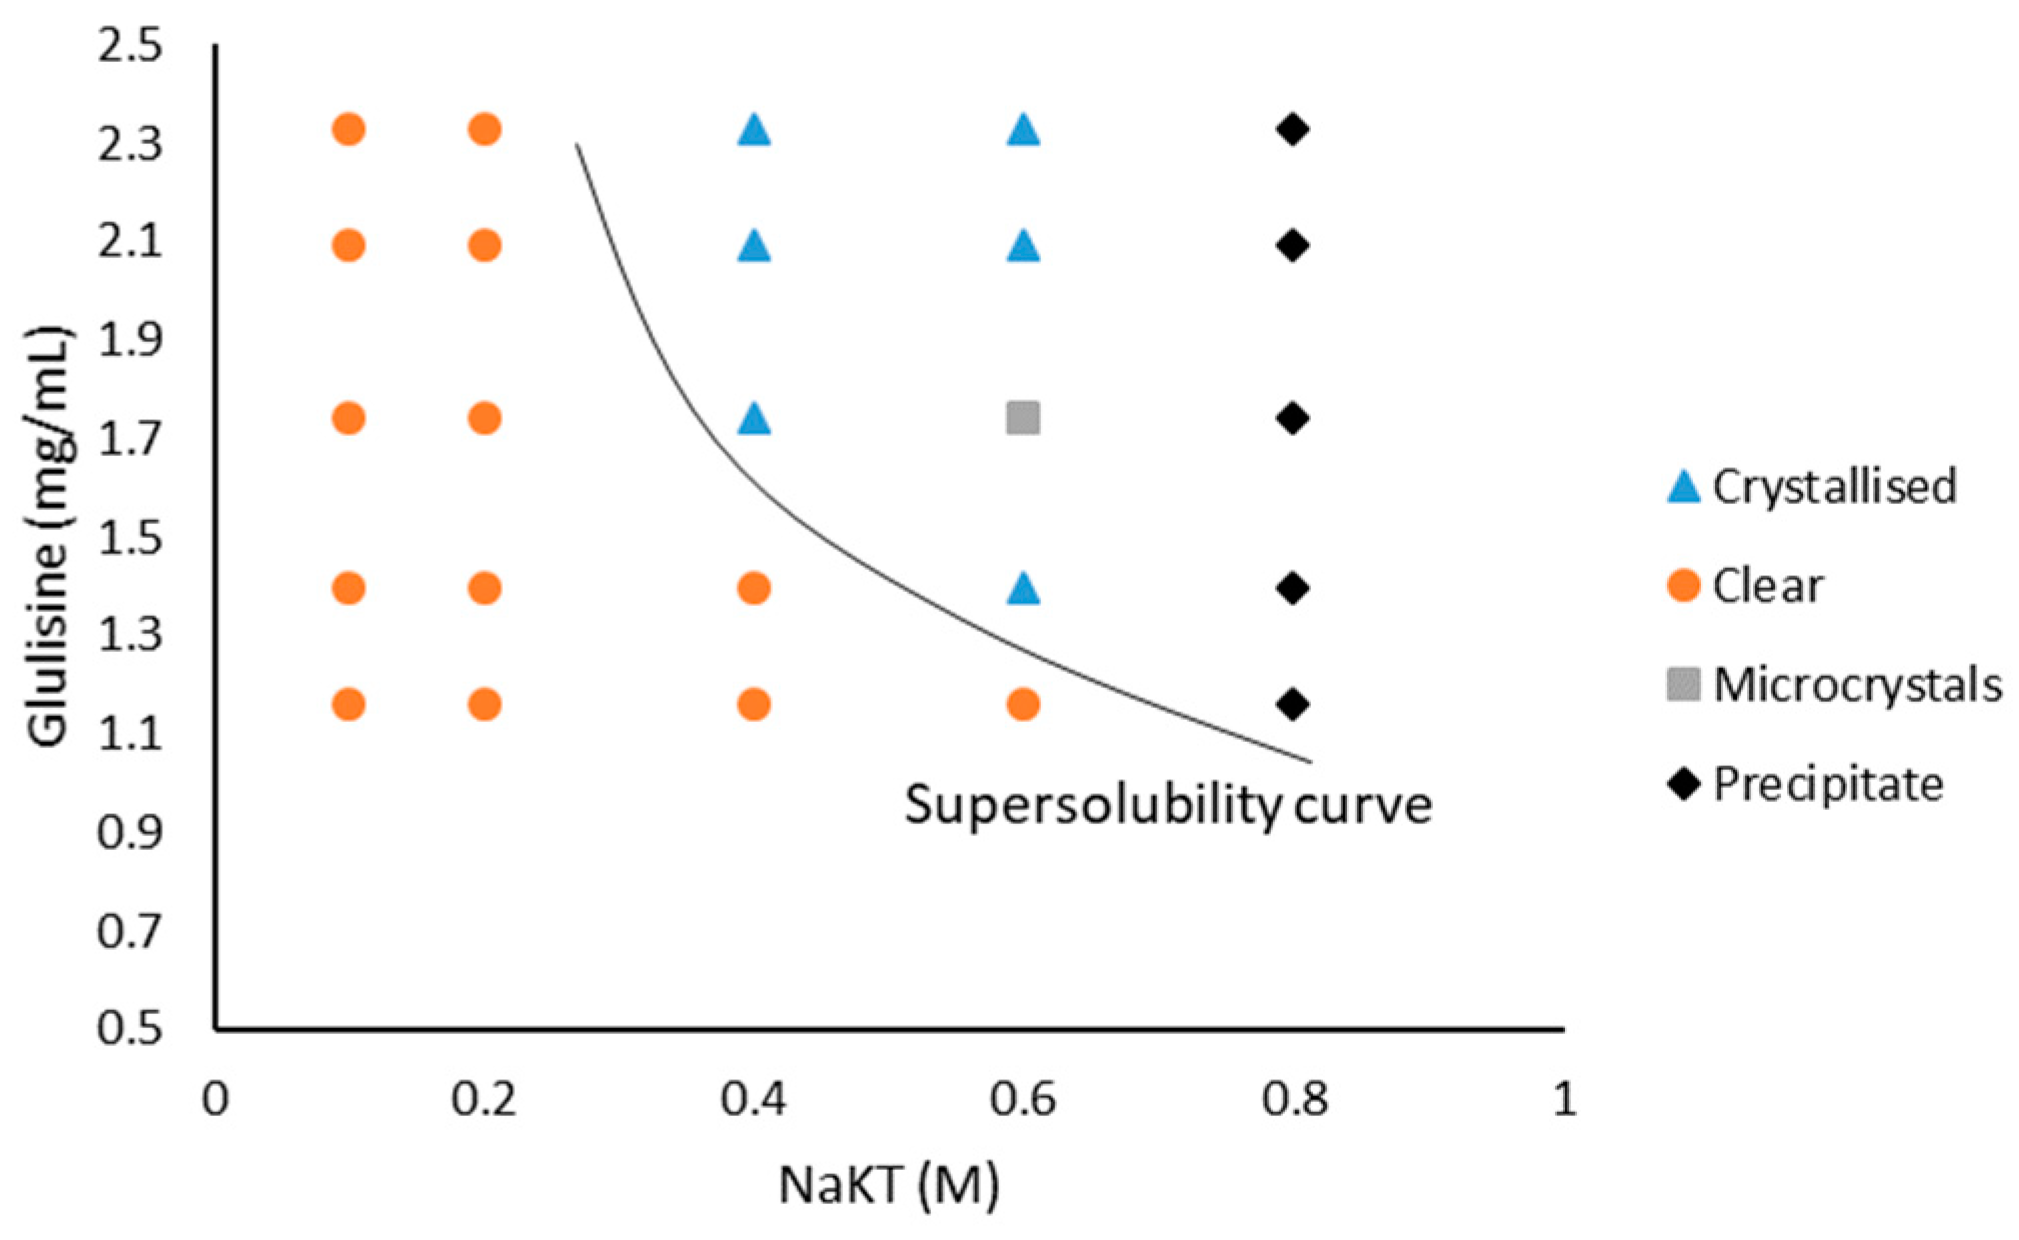
3.2. Glulisine and Sodium Potassium Tartrate Tetrahydrate (NaKT)
4. Discussion
4.1. The Solubility of Glulisine
4.2. Experimental and Technical Evaluations
4.3. Conclusions
Author Contributions
Funding
Acknowledgments
Conflicts of Interest
References
- Khurshid, S.; Saridakis, E.; Govada, L.; Chayen, N.E. Porous nucleating agents for protein crystallization. Nat. Protoc. 2014, 9, 1621. [Google Scholar] [CrossRef]
- Luft, J.; Snell, E.; DeTitta, G. Lessons from high-throughput protein crystallization screening: 10 years of practical experience. Expert Opin. Drug Discov. 2011, 6, 465–480. [Google Scholar] [CrossRef]
- Asherie, N. Protein crystallization and phase diagrams. Methods 2004, 34, 266–272. [Google Scholar] [CrossRef]
- Chayen, N.E. Methods for separating nucleation and growth in protein crystallisation. Prog. Biophys. Mol. Biol. 2005, 88, 329–337. [Google Scholar] [CrossRef]
- Chayen, N.; Akins, J.; Campbell-Smith, S.; Blow, D.M. Solubility of glucose isomerase in ammonium sulphate solutions. J. Cryst. Growth 1988, 90, 112–116. [Google Scholar] [CrossRef]
- Saridakis, E.; Chayen, N.E. Systematic Improvement of Protein Crystals by Determining the Supersolubility Curves of Phase Diagrams. Biophys. J. 2003, 84, 1218–1222. [Google Scholar] [CrossRef]
- Chayen, N.E.; Saridakis, E. Protein crystallization: From purified protein to diffraction-quality crystal. Nat. Methods 2008, 5, 147–153. [Google Scholar] [CrossRef]
- Zhou, R.-B.; Cao, H.-L.; Zhang, C.-Y.; Yin, D.-C. A review on recent advances for nucleants and nucleation in protein crystallization. CrystEngComm 2017, 19, 1143–1155. [Google Scholar] [CrossRef]
- Nanev, C.N.; Saridakis, E.; Chayen, N.E. Protein crystal nucleation in pores. Sci. Rep. 2017, 7, 35821. [Google Scholar] [CrossRef]
- Chayen, N.E.; Saridakis, E.; El-Bahar, R.; Nemirovsky, Y. Porous silicon: An effective nucleation-inducing material for protein crystallization11Edited by R. Huber. J. Mol. Biol. 2001, 312, 591–595. [Google Scholar] [CrossRef]
- Page, A.J.; Sear, R.P. Heterogeneous nucleation in and out of pores. Phys. Rev. Lett. 2006, 97, 65701. [Google Scholar] [CrossRef] [PubMed]
- Chayen, N.E.; Saridakis, E.; Sear, R.P. Experiment and theory for heterogeneous nucleation of protein crystals in a porous medium. Proc. Natl. Acad. Sci. USA 2006, 103, 597–601. [Google Scholar] [CrossRef] [PubMed]
- Saridakis, E.; Chayen, N.E. Towards a “universal” nucleant for protein crystallization. Trends Biotechnol. 2009, 27, 99–106. [Google Scholar] [CrossRef] [PubMed]
- Kertis, F.; Khurshid, S.; Okman, O.; Kysar, J.W.; Govada, L.; Chayen, N.; Erlebacher, J. Heterogeneous nucleation of protein crystals using nanoporous gold nucleants. J. Mater. Chem. 2012, 22, 21928–21934. [Google Scholar] [CrossRef]
- Hirsch, I.B. Insulin Analogues. N. Engl. J. Med. 2005, 352, 174–183. [Google Scholar] [CrossRef] [PubMed]
- Sanlioglu, A.D.; Altunbas, H.A.; Balci, M.K.; Griffith, T.S.; Sanlioglu, S. Clinical utility of insulin and insulin analogs. Islets 2013, 5, 67–78. [Google Scholar] [CrossRef] [PubMed]
- Garnock-Jones, K.P.; Plosker, G.L. Insulin glulisine: A review of its use in the management of diabetes mellitus. Drugs 2009, 69, 1035–1057. [Google Scholar] [CrossRef] [PubMed]
- Hartman, I. Insulin analogs: Impact on treatment success, satisfaction, quality of life, and adherence. Clin. Med. Res. 2008, 6, 54–67. [Google Scholar] [CrossRef]
- Chayen, N.E.; Helliwell, J.R.; Solomon-Gamsu, H.V.; Govada, L.; Morgan, M.; Gillis, R.B.; Adams, G. Insulin Glulisine. Available online: https://www.rcsb.org/structure/6GV0 (accessed on 26 August 2019).
- Chayen, N.E.; Shaw Stewart, P.D.; Blow, D.M. Microbatch crystallization under oil—A new technique allowing many small-volume crystallization trials. J. Cryst. Growth 1992, 122, 176–180. [Google Scholar] [CrossRef]
- Arakawa, T.; Timasheff, S.N. Mechanism of protein salting in and salting out by divalent cation salts: Balance between hydration and salt binding. Biochemistry 1984, 23, 5912–5923. [Google Scholar] [CrossRef]
- Collins, K.D. Ions from the Hofmeister series and osmolytes: Effects on proteins in solution and in the crystallization process. Methods 2004, 34, 300–311. [Google Scholar] [CrossRef] [PubMed]
- Tansel, B.; Sager, J.; Rector, T.; Garland, J.; Strayer, R.F.; Levine, L.; Roberts, M.; Hummerick, M.; Bauer, J. Significance of hydrated radius and hydration shells on ionic permeability during nanofiltration in dead end and cross flow modes. Sep. Purif. Technol. 2006, 51, 40–47. [Google Scholar] [CrossRef]
- Database, P.C.; National Center for Biotechnology Information. PubChem Compound Database. Available online: https://pubchem.ncbi.nlm.nih.gov/compound/119432#section=Top%0A or https://pubchem.ncbi.nlm.nih.gov/compound/5988; (accessed on 16 August 2018).
- Collins, K.D. Charge density-dependent strength of hydration and biological structure. Biophys. J. 1997, 72, 65–76. [Google Scholar] [CrossRef]
- Chayen, N.E. Comparative Studies of Protein Crystallization by Vapour-Diffusion and Microbatch Techniques. Acta Crystallogr. Sect. D 1998, 54, 8–15. [Google Scholar] [CrossRef] [PubMed]
- Nagel, N.; Graewert, M.A.; Gao, M.; Heyse, W.; Jeffries, C.M.; Svergun, D.; Berchtold, H. The quaternary structure of insulin glargine and glulisine under formulation conditions. Biophys. Chem. 2019, 253, 106226. [Google Scholar] [CrossRef]


© 2019 by the authors. Licensee MDPI, Basel, Switzerland. This article is an open access article distributed under the terms and conditions of the Creative Commons Attribution (CC BY) license (http://creativecommons.org/licenses/by/4.0/).
Share and Cite
Li, Y.; Govada, L.; Solomon, H.V.; Gillis, R.B.; Adams, G.G.; Chayen, N.E. Analysis of Glulisine Crystallisation Utilising Phase Diagrams and Nucleants. Crystals 2019, 9, 462. https://doi.org/10.3390/cryst9090462
Li Y, Govada L, Solomon HV, Gillis RB, Adams GG, Chayen NE. Analysis of Glulisine Crystallisation Utilising Phase Diagrams and Nucleants. Crystals. 2019; 9(9):462. https://doi.org/10.3390/cryst9090462
Chicago/Turabian StyleLi, Yanmin, Lata Govada, Hodaya V. Solomon, Richard B. Gillis, Gary G. Adams, and Naomi E. Chayen. 2019. "Analysis of Glulisine Crystallisation Utilising Phase Diagrams and Nucleants" Crystals 9, no. 9: 462. https://doi.org/10.3390/cryst9090462
APA StyleLi, Y., Govada, L., Solomon, H. V., Gillis, R. B., Adams, G. G., & Chayen, N. E. (2019). Analysis of Glulisine Crystallisation Utilising Phase Diagrams and Nucleants. Crystals, 9(9), 462. https://doi.org/10.3390/cryst9090462