Article

Structural and Reactivity Analyses of Nitrofurantoin–4-dimethylaminopyridine Salt Using Spectroscopic and Density Functional Theory Calculations

1
Department of Physics, University of Lucknow, Lucknow 226 007, India
2
Centre for Pharmaceutical Engineering Science and School of Pharmacy and Medical Sciences, University of Bradford, Bradford BD7 1DP, UK
*
Authors to whom correspondence should be addressed.
Crystals 2019, 9(8), 413; https://doi.org/10.3390/cryst9080413
Submission received: 4 July 2019 / Revised: 6 August 2019 / Accepted: 6 August 2019 / Published: 9 August 2019
(This article belongs to the Special Issue Pharmaceutical Crystals)

Abstract

:
Pharmaceutical salt, nitrofurantoin–4-dimethylaminopyridine (NF-DMAP), along with its native components NF and DMAP are scrutinized by FT-IR and FT-Raman spectroscopy along with density functional theory so that an insight into the H-bond patterns in the respective crystalline lattices can be gained. Two different functionals, B3LYP and wB97X-D, have been used to compare the theoretical results. The FT-IR spectra obtained for NF-DMAP and NF clearly validate the presence of C33–H34⋅⋅⋅O4 and N23–H24⋅⋅⋅N9 hydrogen bonds by shifting in the stretching vibration of –NH and –CH group of DMAP+ towards the lower wavenumber side. To explore the significance of hydrogen bonding, quantum theory of atoms in molecules (QTAIM) has been employed, and the findings suggest that the N23–H24⋅⋅⋅N9 bond is a strong intermolecular hydrogen bond. The decrement in the HOMO-LUMO gap, which is calculated from NF → NF-DMAP, reveals that the active pharmaceutical ingredient is chemically less reactive compared to the salt. The electrophilicity index (ω) profiles for NF and DMAP confirms that NF is acting as electron acceptor while DMAP acts as electron donor. The reactive sites of the salt are plotted by molecular electrostatic potential (MEP) surface and calculated using local reactivity descriptors.

Graphical Abstract

1. Introduction

The active pharmaceutical ingredient (API) is a drug or a chemical liable for the pharmacological and therapeutic activities in the body. It is the key ingredient that treats a disease or disorder [1]. In recent years, pharmaceutical salts have drawn considerable attention owing to their impending potential uses in pharmacy and biomedical science [2]. The market value of a drug can be drastically reduced due to its poor physicochemical properties, which in turn can cause the demand to replace it. This is the major reason why there is an increased interest in the physicochemical properties upgradation methods such as salt formation [3]. Pharmaceutical salts are ionizable drugs that have been combined with a counter-ion to form a neutral compound. Salts are stable, and due to the presence of ionic bond, they are highly soluble in the polar solvents that include water [4]. The presence of ionizable groups in the molecule is an essential requirement for the formation of salts. An API can be either in the form of cation (approximately 75% of pharmaceutical salts) or anion, and the counter molecule is called as coformer, which can be either in the form of cation or anion. By changing the coformer of a pharmaceutical salt, the physicochemical properties of the drug can be modulated [5,6,7,8,9]. Converting a neutral API into a salt may enhance its chemical stability, solubility and bioavailability, and the solid form of the drug is made easier to administer. In medicinal treatment, nearly half of the drugs used today are given as salt forms. This implies that the saltification of a drug molecule is a substantial and beneficial stage in drug development.
Nitrofurantoin (NF), a drug of nitrofurans group, is an antibiotic drug to cure urinary tract (kidney and bladder) infections (UTI) and also provides chronic cure against recurrent infections. As antibacterial resistance to NF is rare, it is used for long term treatment of UTIs [10,11]. NF prevents several bacterial enzyme systems (gram-positive and gram-negative bacteria) and has broad antibacterial activity [12]. The dissolution rate of NF in water is low [10], and also its bioavailability drops upon storage [13,14,15,16]. Due to these paucities and to enhance the physicochemical stability (solubility and bioavailability) of NF tablets, preparation of pharmaceutical salt of NF could potentially present significant opportunities [17].
In the present work, pharmaceutical salt nitrofurantoin–4-dimethylaminopyridine (NF-DMAP) is studied where NF is an API in anionic form and DMAP a coformer, which is one of the derivatives of pyridine in cationic form. DMAP is more basic compared to pyridine with the electron releasing substituents (methyl groups) on the amino-nitrogen atom, which is disposed in para-position to that of pyridyl group. The crystal structure of NF-DMAP is reported by one of the authors of this manuscript [18]. NF-DMAP salt has conceived the monoclinic crystal system with P21/c space group [18].
Salt formation is a promising avenue that is used to increase the therapeutic efficacy of APIs. In order to examine the changes/alteration from API (NF) to salt (NF-DMAP), we have computationally calculated the chemical reactivity, vibrational properties, effect of hydrogen bonding in NF-DMAP.
In this work, a complete vibrational study of NF-DMAP salt and NF by Raman and infrared (IR) spectral analysis combined with density functional theory (DFT) approach has been performed. It should be mentioned that vibrational spectroscopy is the most accepted analytical tool, and DFT is the utmost acknowledged theoretical approach to study the molecular structure of different molecular systems [19,20,21,22,23,24]. In order to attain a comprehensive analysis of the hydrogen bond patterns, both DFT and spectroscopic methods have been used. From the computational studies, the results obtained using two functionals (B3LYP and wB97X-D) employing a single basis set 6-311++G(d,p) are compared to understand the geometry and reactivity of NF-DMAP salt. Natural bond orbital (NBO) analysis is used to examine the strength of intermolecular H-bonds, and QTAIM approach confirms the results. Moreover, the performance of two descriptors (global and local reactivity descriptors) has been examined to explain the subtle changes in the properties of nitrofurantoin–4-dimethylaminopyridine from NF and DMAP.

2. Experimental Details

NF (β-form) and DMAP were obtained from Sigma-Aldrich and acetonitrile is of analytical grade and used as received. As per literature, solution crystallisation of NF and DMAP was performed using the equimolar amounts of NF and DMAP using acetonitrile to obtain crystals of NF-DMAP salt [18].
Shimadzu IR Affinity-1S FTIR spectrophotometer has been employed to record IR spectra of NF-DMAP salt (at 34 °C).
The transmission infrared spectrum of NF was acquired by using an FT-IR spectrometer (Bio-Rad, FTS 3000 MX IR spectrometer, Singapore) (at 30 °C) [25].
The FT-Raman spectrum of NF-DMAP salt was documented on a Bruker IFS 55 EQUINOX (at 30 °C) [25].
The dispersive-Raman microscope employed in the study of NF was a JY Horiba LabRAM HR equipped with a confocal microscope (at 29 °C) [25].

3. Computational Details

Initially, energy and optimized electronic structure of NF-DMAP salt and its precursor components were computed by the DFT method [26] using the Gaussian 09 suite [27]. 6-311++G(d,p) [28,29] basis set with B3LYP [30,31,32] and wB97X-D functional [33] (uses a variation of Grimme’s D2 dispersion model) was used for the calculations. An inclusive set of 120 internal coordinates were well-defined using Pulay’s recommendations for normal mode analysis [34]. The vibrational assignments of the normal modes were recommended based on the potential energy distribution (PED) calculated using the program Gar2Ped [35]. Pictorial representation of molecular geometries and substantiation of calculated data were prepared with the program GaussView [36]. Topological parameters at bond critical points (BCP) were analysed within the framework of the QTAIM with the use of AIM2000 program package [37]. The details of the theoretical background are given in the Supplementary Material.

4. Results and Discussion

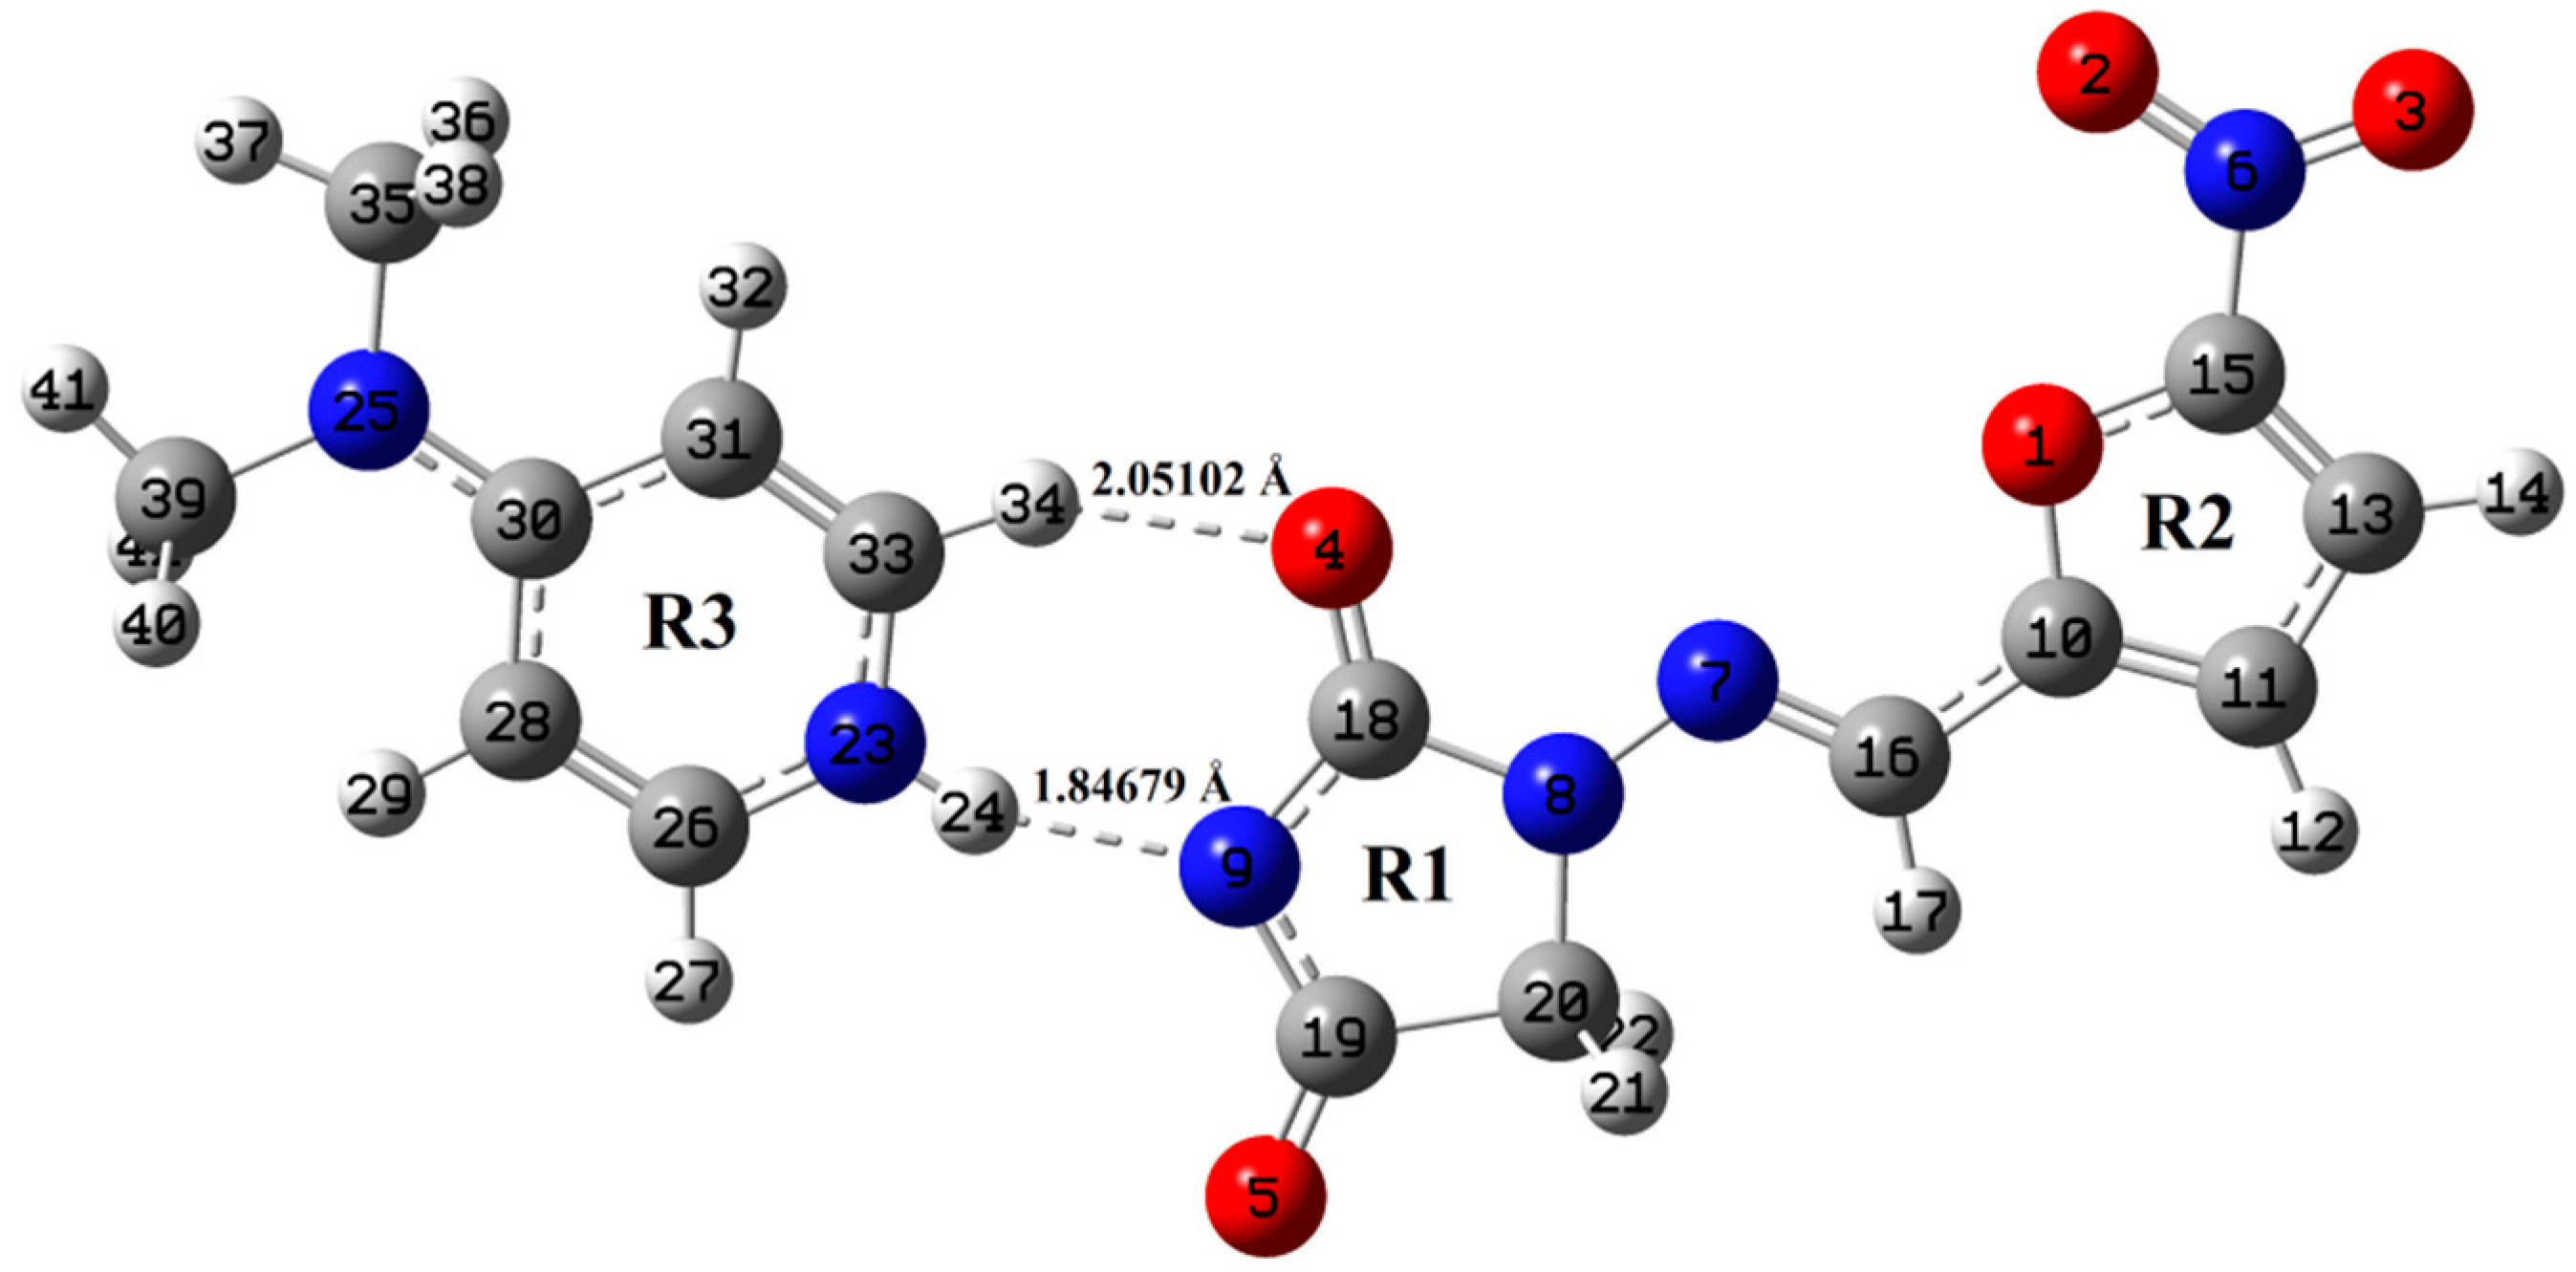
4.1. Geometry Optimization and Energies

The crystal structure determination of NF-DMAP salt suggests its crystallization in the monoclinic space group P21/c with one molecule each of NF and DMAP+ in the asymmetric unit [18]. The reported lattice parameters for the NF-DMAP are a = 8.616(4) Å, b = 26.655(11) Å and c = 7.029(3) Å; α = 90°, β = 100.722(9) and γ = 90 [18]. Transfer of a proton took place from the imide functional group (N–H) of NF to the pyridyl–N of DMAP. In the crystallographic structure of the salt, four molecules of NF-DMAP (monomer) are present in a unit cell (Figure S1), but NF is forming H-bond with one DMAP+ only (Figures S2 and S3). No H-bond interactions are present between one unit of NF-DMAP (monomer) and other (Figure S3). Different units of NF-DMAP (monomer) within the unit cell are arranged in layer form and interact with each other via weak interactions, i.e., π-π stacking (non-classical interaction) (Figure S4). This is the reason why, here, calculations have been performed on the NF-DMAP (1:1, monomer) salt which has taken into account all the H-bond interactions. The three crystal systems considered in this study, NF-DMAP (1:1), NF (monomer) and DMAP (monomer), are known [15,18,38]. Hence, their crystallographic data have been served to obtain the initially optimized structure with energy minima. These three structures are optimized at the B3LYP and wB97X-D theory of DFT with 6-311++G(d,p) as basis set.
In the present study, we have probed the performance of density functionals, one of which is the “standard” functional that does not include dispersion (B3LYP) whereas the other one takes into account dispersion (wB97X-D) in reproducing molecular structures. The primary difference between B3LYP and wB97X-D is the addition of a semi empirical dispersion term which causes the weaker London forces. Different theories are used for different calculation schemes (B3LYP and wB97X-D), which is why they have led to slightly different 3D molecular structures. The main purpose of our work is to compare two different functional in DFT to understand the geometry and reactivity of NF-DMAP salt. The ground state optimized geometries of NF-DMAP (B3LYP), NF-DMAP (wB97X-D), NF (wB97X-D and B3LYP) and DMAP (wB97X-D and B3LYP) are shown in Figure 1 and Figure 2, Figures S5 and S6 respectively. The ground state energy of the NF-DMAP (1:1) salt is computed by using B3LYP and wB97X-D; methods are −1286.054068 and −1285.61456 Hartrees, respectively. The value of this energy for NF and DMAP calculated using wB97X-D (B3LYP) are −903.40623 (−903.71326) and −382.23392 (−382.36016) Hartrees, respectively. The molecular geometries obtained using B3LYP functional are more stable.
Optimized geometrical parameters of NF-DMAP and NF calculated by B3LYP and wB97X-D methods are presented in Table S1, combined with the crystallographic data of both salt and API [15,18]. The molecular geometries of NF-DMAP calculated using B3LYP and wB97X-D methods are compared with the geometry of a single molecule of NF. When the geometrical parameters of NF-DMAP calculated using both the functionals and the experimental values are compared, it shows that the calculations are comparable. Minor changes, however, are seen in the geometrical parameters involving in hydrogen bonding. Intermolecular H-bonds (N23–H24⋅⋅⋅N9 and C33–H34⋅⋅⋅O4) are present within the salt. The calculated length of C33–H34 bond of DMAP and NF-DMAP using wB97X-D (B3LYP) are 1.08735 (1.08713) Å and 1.09207 (1.08944) Å, respectively. In case of NF-DMAP, this C33-H34 bond has slightly greater length as compared to DMAP only, as in DMAP, this bond is free while it is involved in H-bond in case of NF-DMAP. When comparison is done between NF-DMAP (1:1) and NF (monomer) for the C18–O4 bond, a difference of 0.0252 Å (B3LYP) and 0.0251 Å (wB97X-D) has been observed. In case of salt, C33–H34⋅⋅⋅O4 H-bond is formed while in NF (API only) this C18-O4 bond is free. A difference of 0.0283 Å has been observed between experimental bond length (N9-C18) of salt and API, as in NF, hydrogen atom is attached to N9 atom whereas this hydrogen is transferred to pyridyl-N23 of coformer resulting in N23–H24 bond. As a result of transferring of H atom from N9 to N23, shortening in the bond length N9-C18 occurs in case of salt. The bond length calculated using B3LYP is quite similar to the observed value, which means for the present study B3LYP is giving plausible results for calculating parameters involved in hydrogen bonding [24]. The angle values are also almost the same when calculated by two functionals; however, small differences are observed between values involved in H-bonding. Small deviations are found in dihedral angles involved in intermolecular H-bonding (see Figure 1 and Figure 2).

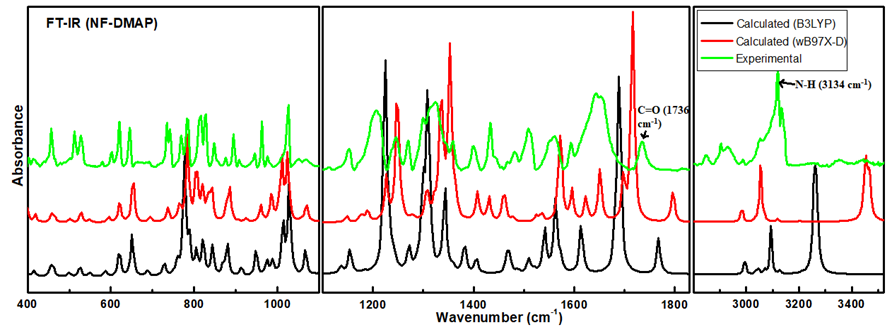
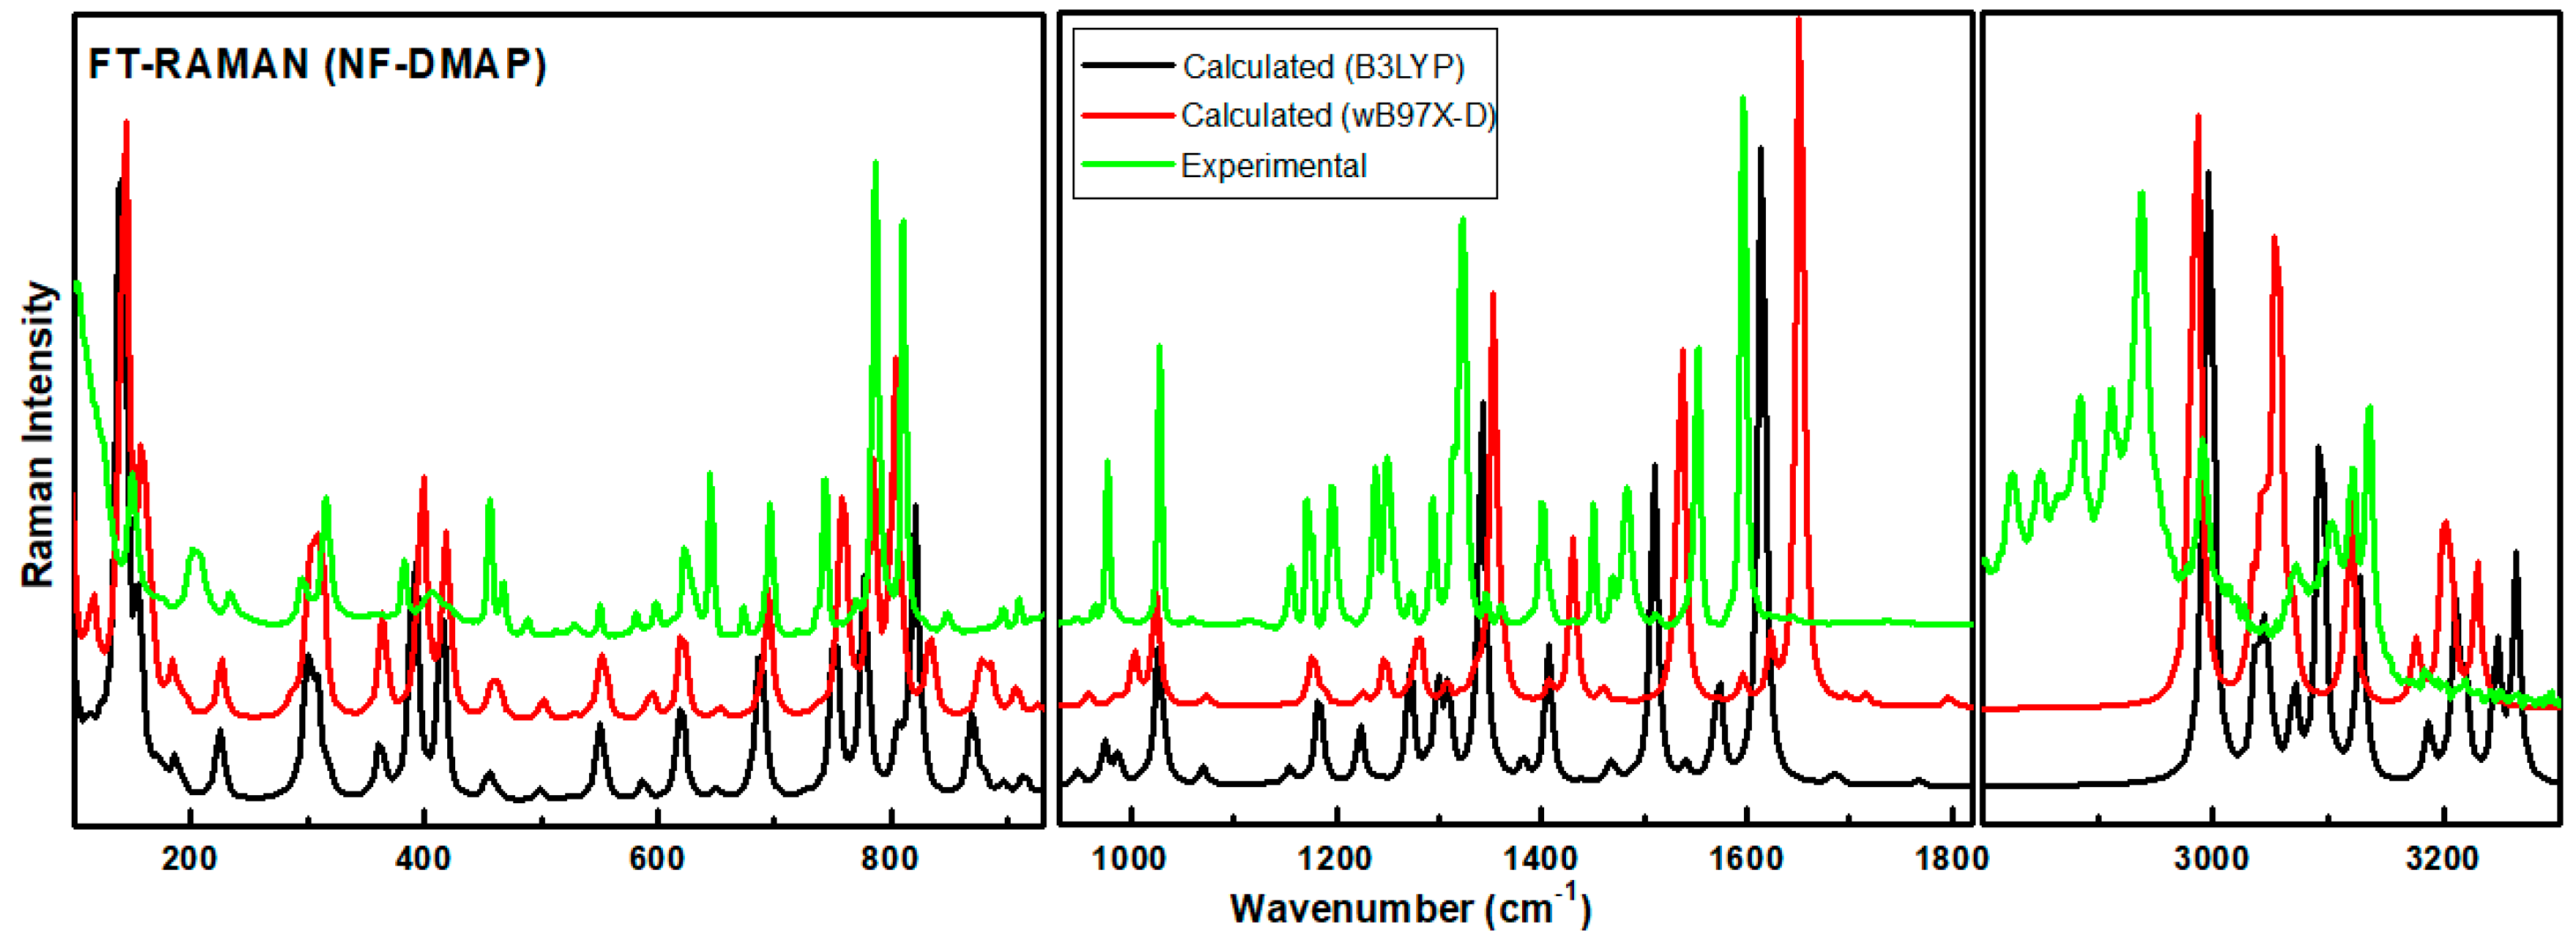
4.2. Vibrational Assignment

The total number of atoms in API (NF) and salt (NF-DMAP) are 23 and 42, which means that these can give 63 and 120 (3N−6) normal modes, respectively. The theoretical and experimental vibrational of NF-DMAP and NF calculated at B3LYP and wB97X-D methods and their assignments using PED are given in the Tables S2 and S3 (for NF-DMAP) and the Tables S4 and S5 (for NF), respectively. The relative study of experimental and calculated (scaled) IR and Raman spectra of NF is given in the Figures S7 and S8.
The calculated Raman and IR intensities were used to convolute each predicted vibrational mode with a Lorentzian line shape (FWHM = 4 cm−1) to produce simulated spectra. Comparison between experimental and theoretical IR spectra for NF-DMAP (calculated using wB97X-D and B3LYP) in the region 3500–400 cm−1 is presented in Figure 3. Calculated (scaled) and experimental Raman spectra of salt are shown in Figure 4. As the comparison is made between the calculated (gaseous phase) and experimental (solid state) spectra and the anharmonicity effects are also not included, the calculated wave numbers found in the present study are somewhat greater than the observed ones. Consequently, the computed wavenumbers are reduced by 0.980 and 0.991 for wB97X-D and B3LYP functionals, respectively, to eliminate anharmonicity existing in real system [39,40,41]. The main motive to discuss the vibrational modes corresponding to the bands affected by hydrogen bonds in the salt is to give information related to the functional groups, i.e., whether they are bonded or non-bonded, and to confirm the transfer of proton from NF to DMAP+ and also to know the sites which took part in forming hydrogen bond between NF (API) and DMAP (coformer), which are responsible for making NF-DMAP salt.

4.3. Vibrational Wavenumbers Involved in Hydrogen Bonding

The N–H group of pyridyl ring is H-bonded with N9 atom of the hydantoin ring. Because of the presence of N23–H24⋅⋅⋅N9 H-bond, change in bondlengths and wavenumbers associated with it occurred. The position of N23–H24 stretching band depends on the potency of the formation of H-bond. In the observed FT-IR spectrum of NF-DMAP salt, the N23–H24 stretch is seen at 3134 cm−1, whereas it is calculated as 3458 and 3263 cm−1, using wB97X-D and B3LYP level of theory, respectively. The peak of free N-H bond falls in the range 3600–3400 cm−1 [39,40,41]. However, the N–H peak in NF-DMAP is somewhat lower than this range. In neutral DMAP, which is not in cationic form, no N–H stretching peak occurs in the vibrational spectra. The lowering of N–H stretching vibrations in the observed spectra can be endorsed to the intermolecular N–H⋅⋅⋅N interaction [42,43].
The stretching vibrations of the carbonyl (C=O) group usually cause the bands in the region 1600–1800 cm−1 in aromatic compounds [44,45,46]. The stretching vibration of the C=O4 group is observed at 1736 cm−1 in IR spectrum and calculated at 1797/1768 cm−1 using wB97X-D/B3LYP. The same mode is calculated at 1639/1547 cm−1 using wB97X-D/B3LYP in the case of NF and found at 1566/1563 cm−1 in the IR/Raman spectra.
Moreover, amongst different C-H bonds of ring 3, one (C-H34) is H bonded while others are free resulting in C-H34 bond elongation. Because of this, C-H34 stretching wavenumber is calculated at 3055/3094 cm−1 (wB97X-D/B3LYP) while free C-H stretching wavenumber occurs at higher wavenumber [34]. This proves that the C-H34 group of DMAP+ plays a part in intermolecular H-bonding with C=O4 of NF. For some molecular systems, wB97X-D gives good results; however, for other systems, B3LYP affords better results [23,24]. It may be concluded that wavenumbers calculated using B3LYP method match well with the observed values showing B3LYP is better functional than wB97X-D for the studied molecular system.

4.4. Quantum Theory of Atoms in Molecules (QTAIM) Calculations for Hydrogen Bonding

QTAIM is a technique for estimation and comparison of properties (especially chemical bonds) of atoms and molecules [37]. This theory creates the spatial partition of atoms. The presence of critical points describes the presence of a bond amongst two nuclei in QTAIM. With the purpose of having a perception into a region of a system, this method has been used. Geometrical and topological parameters are appropriate means to exemplify the nature and strength of H-bonds. The geometrical conditions for the occurrence of hydrogen bonds are given by Koch and Popelier centered on QTAIM [47]. The presence of H-bonds are also supported by Rozas et al. [48], which classifies these interactions as follows: (i) strong H-bonds have Laplacian of electron density (∇2ρBCP) < 0, total electron energy density HBCP < 0 and have covalent character; (ii) medium H-bonds have (∇2ρBCP) > 0, HBCP < 0 and have partially covalent character and (iii) weak H-bonds have (∇2ρBCP) > 0 and HBCP > 0 and have electrostatic character.
The molecular graphs of NF-DMAP using the AIM program at the wB97X-D/6-311++G(d,p) and B3LYP/6-311++G(d,p) level are shown in Figures S9 and S10, respectively. Topological, geometrical and energy parameters for intermolecular hydrogen bonds of interacting atoms at the wB97X-D/6-311++G(d,p) and B3LYP/6-311++G(d,p) level are listed in Table 1. The geometrical parameters for hydrogen bonds in NF-DMAP are given in Table S6, and bond contributions to atomic net charges are tabulated in Table S7. According to Rozas theory, all the H-bonds are medium in nature and have partial covalent character as they have (∇2ρBCP) > 0, HBCP < 0. In this contribution, hydrogen bond energy (EHB) is also calculated using the QTAIM theory. EHB is correlated to VBCP by the relation; EHB = 1/2(VBCP). Amongst all the H-bonds N23–H24⋅⋅⋅N9 is the strongest H-bond present between NF and DMAP+.

4.5. Natural Bond Orbital (NBO) Analysis

NBO analysis deals with the tactic that studies inter and intramolecular orbital interaction in a molecule, predominantly charge transfer or conjugative interactions in the molecular system. This is executed in view of all likely interactions amongst donor and acceptor NBOs and valuing their energetic significance by second-order perturbation theory. A stabling donor-acceptor interaction is obtained when the delocalization of electron density amongst occupied Lewis type as well as unoccupied non-Lewis NBO orbitals occurs. The strength of the interaction and the amount of conjugation of the system can be predicted by the E(2) value.
NBO analysis is accomplished on NF-DMAP using wB97X-D/6-311++G(d,p) and B3LYP/6-311++G(d,p) methods with the purpose of interpreting the intermolecular rehybridization and delocalization of electron density within the NF-DMAP salt. The Tables S8 and S9 present the particular electron donor orbital, acceptor orbital and the interacting stabilization energy for the NF-DMAP following from the second-order perturbation theory.
In NF-DMAP, the significant interaction within unit 1 from n(3) O3→π*O2-N6 has stabilization energy of 148.50 kcal/mol, n(2) N9→ π*O4-C18, and π*O5-C19 has 84.89 kcal/mol and 76.95 kcal/mol, respectively, and consequently, they provide sturdier stabilization to the structure (Table S7). From Table S7, it is prominent that the maximum occupancies 1.98661 and 1.98618 are found for πO4-C18 and πO5–C19, respectively. Therefore, the results suggest that the πO4-C18 and πO5–C19 are handled by π-character of the hybrid orbitals.
The strongest interactions, computed in similar interaction energy, are the electron donations from a lone pair orbital on the oxygen atom, electron donating from n(3)O3 to π*O2–N6, tends to high stabilization energy of 227.86 kcal/mol using wB97X-D method (Table S8). The strong intra-molecular hyperconjugation interaction of the πC26–C28/πC31–C33 to the n(1) N23 bond in the ring leads to stabilization of ring present in the coformer.
In NF-DMAP, charge transfer from NF unit (1) to DMAP+ unit (2) due to n(1) N9→ σ*N23–H24 stabilized the molecule up to 18.66 and 22.72 kcal/mol, calculated using B3LYP and wB97X-D methods, respectively, and this proves the existence of classical interaction N23–H24⋅⋅⋅N9.

4.6. Chemical Reactivity

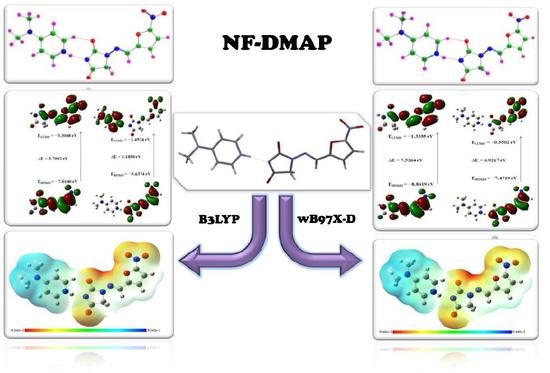
4.6.1. Frontier Molecular Orbitals (FMOs)

Frontier molecular orbitals (FMOs) and their properties are used for describing various kinds of reactions and for calculating the most reactive site in a conjugated system. To reveal the chemical reactivity and biological activity of a complex, the HOMO and LUMO energy and their gap are calculated. HOMO, which may be believed as the outer orbital holding electrons, has a tendency to donate the electrons as e donor and henceforth the ionization potential is directly associated with the energy of the HOMO. In contrast, LUMO may take electrons and the LUMO energy is directly associated with electron affinity [49]. In NF-DMAP, the HOMO is located over the complete NF. Then again, in the API alone, the LUMO is located over the complete molecule except for hydantoin ring.
A molecule having a lesser HOMO-LUMO gap is more polarizable and is usually related to low kinetic stability and high chemical reactivity [49,50]. Thus, the softness corresponds to the HOMO-LUMO gap. The smaller the HOMO-LUMO energy gap the softer the molecule or a multicomponent crystal. The HOMO-LUMO energy gaps of API and salt calculated at wB97X-D (B3LYP) are shown in Figure 5 and Figure 6. On-going from API to salt, the energy gap reduces for both the functionals, which infers that the chemical reactivity of salt is more than API. The energy gap of NF-DMAP salt is less than the NF (API) and previously studied cocrystal of NF, nitrofurantoin-melamine monohydrate (NF-MELA-H2O) [24]. Therefore, salt is showing better chemical reactivity than cocrystal and API.

4.6.2. Molecular Electrostatic Potential (MEP) Analysis

MEP surface proposes a visual technique to comprehend the comparative polarity of the compound [51,52]. It provides a pictorial method to recognize the relative polarity of the compound. MEP is extensively employed as a reactivity plot presenting most plausible areas for the electrophilic attack. The values and spatial dispersal of MEP are in reality accountable for the chemical performance of an agent in a reaction. The MEP maps permit to visualize differently charged regions of a complex. Charge distributions determine how two molecules interact with each another. The Figures S11 and S12 depict the MEP of NF and DMAP mapped using B3LYP method, which explains the charge distributions of the molecule in 3-D. The figure exhibits different colors on the surface that represent different values of the electrostatic potential. Green, red, and blue colors represent regions of zero, most electronegative and most positive electrostatic potential, respectively. Potential decreases in the order blue > green > yellow > orange > red. Red color specifies the high repulsion and blue specifies the high attraction.
The imide group of hydantoin ring of NF is a major nucleophilic centre (blue in colour) while the pyridyl-N of DMAP is a major electrophilic centre (red in colour). Due to the proton transfer from the imide group of NF to the pyridyl-N of DMAP, the reduction in electrostatic potential around these sites (green in colour) takes place, resulting in the formation of NF-DMAP salt.
Here pictorial representation of the atomic regions of NF-DMAP, which are prone to electrophilic or nucleophilic attack, has been done. Regions of negative potential are generally related with the lone pair of electronegative atoms. MEP map of NF-DMAP along with electrostatic potential V (r) and point charges (e), presented in Figure S13 (B3LYP), shows that the negative region is mainly localized over the C=O groups of hydantoin ring and NO2 group of NF anion as these sites are related with the lone pair of oxygen atoms. The maximum positive region is localized on the CH group of ring 3 and CH3 group of DMAP+. Therefore, additional bonding will prevail on these sites.

4.6.3. Global Reactivity Descriptors

For comprehending several aspects of pharmacological sciences comprising drug design and the potential eco-toxicological physiognomies of the drugs, numerous new chemical reactivity descriptors have been suggested.
The conceptual DFT commendably dealt with the understanding of chemical reactivity and site selectivity of the molecular systems. Global reactivity descriptors; chemical potential (μ), electronegativity (χ), global hardness (η), global softness (S) and global electrophilicity index (ω) are extremely effective in calculating global chemical reactivity trends. These descriptors refer to the overall stability of the molecule. Contrariwise, the local equivalent refers to the site reactivity and selectivity [49,50]. The HOMO-LUMO energy gap, χ, μ, η, S and ω for API, coformer, salt using wB97X-D and B3LYP methods are listed in Table 2. It is seen that the μ of NF-DMAP is negative, and it means that it does not decompose suddenly into the components it is made up of. The η specifies the conflict towards the distortion of electron cloud of chemical systems under small disturbance that comes across during the chemical process. According to the definition of ω, it measures the vulnerability of chemical species to take electrons. Low values of ω recommend a good nucleophile; however, greater values specify the existence of good electrophiles [53]. At the B3LYP and wB97X-D level, the electrophilicity index values are following the order API < salt. The last result suggests that the NF-DMAP is the chemically most reactive species. Furthermore, it can be said that the values of these descriptors depend on the level of theory used.
The value of electrophilic charge transfer (ECT) using two functionals B3LYP and wB97X-D comes out to be 1.5879 and 0.1053 for the reactant molecules NF and DMAP which directs that charge travels from NF (API) to DMAP (coformer) during the formation of salt as the value of ECT is greater than zero (Table 2). The smaller value of μ and larger value of ω for NF furthermore approve its electrophilic actions. Similarly, larger value of μ and a smaller value of ω for DMAP approve its nucleophilic actions. Therefore, NF acts as an e acceptor and DMAP as an e donor.

4.6.4. Local Reactivity Descriptors

With the purpose of determining the accurate distribution of the active sites of NF-DMAP; Fukui function (FF, fk+, fk and fk0) values are calculated. It is significant to highlight that the FF values are dependent on the type of charges used. Here, Hirshfeld charges are taken for the calculations, which were calculated using B3LYP/6-311++G(d,p) and wB97X-D/6-311++G(d,p) methods. The Tables S10 and S11 show the Fukui functions, local softnesses and local electrophilicity indices for certain atomic sites present in NF-DMAP and NF. Here fk+/fk and fk/fk+ ratios are also calculated in addition to FF (fk+, fk), local softness (Sk+, Sk) and electrophilicity indices (ωk+, ωk) as these ratios reveal different reactive atomic sites having high values for both fk+ and fk. In case of wB97X-D level of theory, it has been established that the carbon atom C16 has a higher fk+ value which means this atomic site is bound to nucleophilic attack. Whereas C15 has the highest value of fk value which specifies that this atomic site is prone to electrophilic attack. While in case of B3LYP level of theory, nitrogen atom N8 is suitable for nucleophilic attack and oxygen atom O3 is suitable for electrophilic attack.

5. Conclusions

The present work focused on studying the hydrogen bonding interactions, structure–reactivity relationships between a pharmaceutical salt and coformers that include active ingredient for the development of the new drugs. In this contribution, a salt of an antibiotic drug, nitrofurantoin-4-dimethylaminopyridine (NF-DMAP), along with its precursor components (NF and DMAP), was characterized by vibrational spectroscopy (FT-IR and Raman) and DFT using two functionals B3LYP and wB97X-D. To exploit the potential of hydrogen bonding and reactivity, QTAIM, and to understand electrostatic potential Frontier, molecular analyses have been performed. The findings suggest that the geometric parameters calculated at B3LYP level represent a worthy approximation to the crystallographic values as compared to wB97X-D level of computations. On comparing the calculated bond lengths of C33–H34 bond, which is involved in H-bonding, and C26–H27 bond, which is free, a difference of 0.00714 (0.00978) Å has been observed using B3LYP(wB97X-D) functional. This difference is because of the interaction of C33–H34 bond of DMAP+ with carbonyl group (C=O4) of NF resulting in the formation C33–H34⋅⋅⋅O4–C18 hydrogen bond and in the elongation of C33–H34 bond in NF-DMAP. Formation of C33–H34⋅⋅⋅ O4–C18 H-bond is also confirmed by the spectroscopic studies. The N–H stretching vibration in NF-DMAP is observed at 3134 cm−1, which confirms the formation of N23–H24⋅⋅⋅N9 H-bond. The potency of this H-bond is also calculated by NBO and QTAIM and comes out to be −9.6009 kcal mol−1 (using B3LYP theory). Frontal molecular orbital analysis gives an indication that charge transfer takes place within NF-DMAP salt. Reduction in the electrostatic potential of MEP surface of NF-DMAP also confirms the proton transfer from NF to DMAP. The HOMO-LUMO gap decreases on moving from NF to NF-DMAP, which infers NF is chemically less reactive than NF-DMAP. Moreover, salt is showing better chemical reactivity than previously published cocrystal (NF-MELA-H2O). The ECT value is greater than zero indicating that charge is transferred from NF to DMAP. From the Fukui function, the most reactive site for electrophilic attacks is observed on the oxygen (O3) of nitro group of NF. The more reactive site for the nucleophilic attack is located on the nitrogen N8 using B3LYP functional, which is also visible from the MEP surface of NF-DMAP. Thus, the present work significantly enhances the knowledge of structural and chemical reactivity of NF-DMAP, which possibly offers analogies for studying the structure–reactivity relationships and for the development of the new drugs.

Supplementary Materials

The following are available online at https://www.mdpi.com/2073-4352/9/8/413/s1. Figure S1: H-bond interactions within the unit cell of NF-DMAP; Figure S2: Intermolecular H-bond present within NF-DMAP.; Figure S3: All the intermolecular H-bonds present within the unit cell; Figure S4: Short contacts present between two molecules (monomer) of NF-DMAP; Figure S5: Optimized structure of NF using wB97X-D and B3LYP level of theories; Figure S6: Optimized structure of DMAP using wB97X-D and B3LYP level of theories; Figure S7: Comparison of experimental and calculated (scaled) IR spectra of NF; Figure S8: Comparison of experimental and calculated (scaled) Raman spectra of NF; Figure S9: Molecular graph of the NF-DMAP using B3LYP level of theory; Figure S10: Molecular graph of the NF-DMAP using wB97X-D level of theory; Figure S11: Molecular electrostatic potential (MEP) for NF using B3LYP level of theory; Figure S12: Molecular electrostatic potential (MEP) for DMAP using B3LYP level of theory; Figure S13: Molecular electrostatic potential (MEP) along with electrostatic potential V (r) and point charges (e) for NF-DMAP using B3LYP level of theory. Table S1: The experimental geometric parameters of NF-DMAP and NF and calculated geometric parameters of NF-DMAP and NF using B3LYP/6-311++g(d,p) and wB97X-D/6-311++g(d,p) theory; Table S2: Theoretical and experimental vibrational wavenumbers (cm−1) of NF-DMAP with PED using B3LYP functional; Table S3: Theoretical and experimental vibrational wavenumbers (cm−1) of NF-DMAP with PED using wB97X-D level of theory; Table S4. Theoretical and experimental vibrational wavenumbers (cm−1) of NF with PED using B3LYP level of theory; Table S5: Theoretical and experimental vibrational wavenumbers (cm−1) of NF with PED using wB97X-D level of theory; Table S6: Geometrical parameters for intermolecular hydrogen bond in NF-DMAP; Table S7: Bond contributions to atomic net charges for NF-DMAP using QTAIM approach; Table S8: Second order perturbation theory analysis of Fock matrix in NBO basis for inter and intramolecular interactions within NF-DMAP using B3LYP functional; Table S9. Second order perturbation theory analysis of Fock matrix in NBO basis for inter and intramolecular interactions within NF-DMAP using wB97X-D functional; Table S10. Calculated local reactivity properties of atoms of NF-DMAP by Hirshfeld derived charges; Table S11. Calculated local reactivity properties of the atoms of NF using Hirshfeld derived charges.

Author Contributions

For research articles with several authors, a short paragraph specifying their individual contributions must be provided. The following statements should be used “conceptualization, E.K., P.T. and V.R.V.; methodology, E.K. and V.R.V.; software, X.X.; validation, E.K. and P.T.; formal analysis, E.K.; investigation, E.K. and V.R.V.; resources, E.K., P.T. and V.R.V.; data curation, E.K. and V.R.V.; writing—original draft preparation, E.K.; writing—review and editing, E.K., A.S., K.S., D.G., K.H.A., P.T. and V.R.V.; visualization, E.K.; supervision, P.T. and V.R.V.; project administration, P.T. and V.R.V.

Funding

This research was funded by University Grant Commission (UGC), India. V.R.V. thank Newton-Bhabha for Ph.D. placement award (2017) and Royal Society seed corn research grant (2018-19).

Acknowledgments

We thank A. P. Ayala, Universidade Federal do Ceará, Brazil, for executing Fourier Transform-Raman spectra of the salt. E. Khan and K. Srivastava are grateful to UGC, India, for providing the BSR-SRF meritorious fellowship. D. Gangopadhyay is grateful to SERB, DST, India, for providing the National Post-doctoral Fellowship (Project File Number: PDF/2016/003162). We acknowledge Central Facility for Computational Research (CFCR), University of Lucknow. V. R. Vangala thanks the Newton-Bhabha for Ph.D. placement award (2017) and Royal Society seed corn research grant (2018-19).

Conflicts of Interest

The authors declare no conflict of interest.

References

  1. Duggirala, N.K.; Perry, M.L.; Almarsson, Ö.; Zaworotko, M.J. Pharmaceutical cocrystals: Along the path to improved medicines. Chem. Commun. 2016, 52, 640–655. [Google Scholar] [CrossRef] [PubMed]
  2. Grothe, E.; Meekes, H.; Vlieg, E.; ter Horst, J.H.; de Gelder, R. Solvates, salts, and cocrystals: A proposal for a feasible classification system. Cryst. Growth Des. 2016, 16, 3237–3243. [Google Scholar] [CrossRef]
  3. Zhu, B.; Wang, J.R.; Zhang, Q.; Li, M.; Guo, C.; Ren, G.; Mei, X. Stable cocrystals and salts of the antineoplastic drug apatinib with improved solubility in aqueous solution. Cryst. Growth Des. 2018, 18, 4701–4714. [Google Scholar] [CrossRef]
  4. Skorepova, E.; Bím, D.; Husak, M.; Klimes, J.; Chatziadi, A.; Ridvan, L.; Boleslavska, T.; Beranek, J.; Sebek, P.; Rulísek, L. Increase in solubility of poorly-ionizable pharmaceuticals by salt formation: A case of agomelatine sulfonates. Cryst. Growth Des. 2017, 17, 5283–5294. [Google Scholar] [CrossRef]
  5. Brittain, H.G. Vibrational spectroscopic studies of cocrystals and salts. 1. The benzamide-benzoic acid system. Cryst. Growth Des. 2009, 9, 2492–2499. [Google Scholar] [CrossRef]
  6. Brittain, H.G. Vibrational spectroscopic studies of cocrystals and salts. 2. The benzylamine-benzoic acid system. Cryst. Growth Des. 2009, 9, 3497–3503. [Google Scholar] [CrossRef]
  7. Brittain, H.G. Vibrational spectroscopic studies of cocrystals and salts. 3. Cocrystal products formed by benzene carboxylic acids and their sodium salts. Cryst. Growth Des. 2010, 10, 1990–2003. [Google Scholar] [CrossRef]
  8. Brittain, H.G. Vibrational spectroscopic studies of cocrystals and salts. 4. Cocrystal products formed by benzylamine, α-methylbenzylamine, and their chloride salts. Cryst. Growth Des. 2011, 11, 2500–2509. [Google Scholar] [CrossRef]
  9. Aitipamula, S.; Vangala, V.R. X-ray crystallography and its role in understanding the physicochemical properties of pharmaceutical cocrystals. J. Ind. Inst. Sci. 2017, 97, 227–243. [Google Scholar] [CrossRef]
  10. Pienaar, E.W.; Caira, M.R.; Lotter, A.P. Polymorphs of nitro-furantoin 1. Preparation and X-ray crystal-structures of two monohydrated forms of nitrofurantoin. J. Crystallogr. Spectr. Res. 1993, 23, 739–744. [Google Scholar] [CrossRef]
  11. WHO Model List of Essential Medicines [WWW Document]. Available online: http://www.who.int/selectionmedicines/committees/expert/17/sixteenthadultlisten (accessed on 8 March 2017).
  12. Macrodantin Package Insert; Procter & Gamble—US: Pineville, LA, USA, 2009.
  13. Ebian, A.E.A.R.; Moustafa, R.M.A.; Abul-Enin, E.B. Nitrofurantoin. I. Effect of aging at different relative humidities and higher temperatures on the drug release and the physical properties of tablets. Egypt J. Pharm. Sci. 1985, 26, 287–300. [Google Scholar]
  14. Ebian, A.E.A.R.; Fikrat, H.T.; Moustafa, R.M.A.; Abul-Enin, E.B. Nitrofurantoin. II. Correlation of in vivo bioavailability to in vitro dissolution of nitrofurantoin tablets aged at different relative humidities and elevated temperatures. Egypt J. Pharm. Sci. 1986, 27, 347–358. [Google Scholar]
  15. Bertolasi, B.Y.V.; Gilli, P.; Ferretti, V.; Gilli, G. Structure and crystal packing of the antibacterial drug 1-{[(5-nitro-2-furanyl)methylene]amino}-2,4-imidazolidinedione (nitrofurantoin). Acta Crystallogr. Sect. C 1993, 49, 741–744. [Google Scholar] [CrossRef]
  16. Marshall, P.V.; York, P. Crystallisation solvent induced solid- state and particulate modifications of nitrofurantoin. Int. J. Pharm. 1989, 55, 257–263. [Google Scholar] [CrossRef]
  17. Otsuka, M.; Teraoka, R.; Matsuda, Y. Physicochemical stability of nitrofurantoin anhydrate and monohydrate under various temperature and humidity conditions. Pharm. Res. 1991, 8, 1066. [Google Scholar] [CrossRef]
  18. Vangala, V.R.; Chow, P.S.; Tan, R.B.H. The solvates and salt of antibiotic agent, nitrofurantoin: Structural, thermochemical and desolvation studies. CrystEngComm 2013, 15, 878–889. [Google Scholar] [CrossRef]
  19. Stephen Chan, H.C.; Kendrick, J.; Neumann, M.A.; Leusen, F.J.J. Towards abinitio screening of co-crystal formation through lattice energy calculations and crystalstructure prediction of nicotinamide, isonicotinamide, picolinamide and paracetamolmulti-component crystals. CrystEngComm 2013, 15, 3799. [Google Scholar] [CrossRef]
  20. Srivastava, K.; Shukla, A.; Karthick, T.; Velaga, S.P.; Tandon, P.; Sinha, K.; Shimpi, M.R. Molecular structure, spectroscopic signature and reactivity analyses of paracetamol hydrochloride monohydrate salt using density functional theory calculations. CrystEngComm 2019, 21, 857–865. [Google Scholar] [CrossRef]
  21. Sacchi, M.; Brewer, A.Y.; Jenkins, S.J.; Parker, J.E.; Friščić, T.; Clarke, S.M. Combined diffraction and density functional theory calculations of halogen-bonded cocrystal monolayers. Langmuir 2013, 29, 14903–14911. [Google Scholar] [CrossRef]
  22. Shukla, A.; Khan, E.; Alsirawan, M.B.; Mandal, R.; Tandon, P.; Vangala, V.R. Spectroscopic (FT-IR, FT-Raman, 13C SS-NMR) and quantum chemical investigations to explore the structural insights of nitrofurantoin-4-hydroxybenzoic acid cocrystal. New J. Chem. 2019, 43, 7136–7149. [Google Scholar] [CrossRef]
  23. Shukla, A.; Khan, E.; Srivastava, K.; Sinha, K.; Tandon, P.; Vangala, V.R. Study of molecular interactions and chemical reactivity of the nitrofurantoin–3-aminobenzoic acid cocrystal using quantum chemical and spectroscopic (IR, Raman, 13 C SS-NMR) approaches. CrystEngComm 2017, 19, 3921–3930. [Google Scholar] [CrossRef]
  24. Khan, E.; Shukla, A.; Jhariya, A.N.; Tandon, P.; Vangala, V.R. Nitrofurantoin-melamine monohydrate (cocrystal hydrate): Probing the role of H-bonding on the structure and properties using quantum chemical calculations and vibrational spectroscopy. Spectrochim. Acta Part. A Mol. Biomol. Spectrosc. 2019, 221, 117170. [Google Scholar] [CrossRef] [PubMed]
  25. Khan, E.; Shukla, A.; Jadav, N.; Telford, R.; Ayala, A.P.; Tandon, P.; Vangala, V.R. Study of molecular structure, chemical reactivity and H-bonding interactions in the cocrystal of nitrofurantoin with urea. New J. Chem. 2017, 41, 11069–11078. [Google Scholar] [CrossRef] [Green Version]
  26. Hohenberg, P.; Kohn, W. Inhomogeneous electron gas. Phys. Rev. B 1964, 136, 864–871. [Google Scholar] [CrossRef]
  27. Frisch, M.J.; Trucks, G.W.; Schlegel, H.B.; Scuseria, G.E.; Robb, M.A.; Cheeseman, J.R.; Scalmani, G.; Barone, V.; Mennucci, B.; Petersson, G.A.; et al. Gaussian 09, Revision E.01; Gaussian, Inc.: Wallingford, CT, USA, 2009. [Google Scholar]
  28. Petersson, G.A.; Allaham, M.A. A complete basis set model chemistry. II. Open-shell systems and the total energies of the first-row atoms. J. Chem. Phys. 1991, 94, 6081–6091. [Google Scholar] [CrossRef]
  29. Petersson, G.A.; Bennett, A.; Tensfeldt, T.G.; Allaham, M.A.; Shirley, W.A.; Mantzaris, J. A complete basis set model chemistry. I. The total energies of closed-shell atoms and hydrides of the first-row elements. J. Chem. Phys. 1988, 89, 2193–2218. [Google Scholar] [CrossRef]
  30. Becke, A.D. Density-functional thermochemistry. III. The role of exact exchange. J. Chem. Phys. 1993, 98, 5648–5652. [Google Scholar] [CrossRef]
  31. Lee, C.T.; Yang, W.T.; Parr, R.G. Development of the Colle-Salvetti correlation-energy formula into a functional of the electron density. Phys. Rev. B 1988, 37, 785–789. [Google Scholar] [CrossRef] [Green Version]
  32. Parr, R.G.; Yang, W. Density Functional Theory of Atoms and Molecules; Oxford University Press: New York, NY, USA, 1989. [Google Scholar]
  33. Chai, J.D.; Head-Gordon, M. Long-range corrected hybrid density functionals with damped atom-atom dispersion corrections. Phys. Chem. Chem. Phys. 2008, 10, 6615–6620. [Google Scholar] [CrossRef]
  34. Pulay, P.; Fogarasi, G.; Pang, F.; Boggs, J.E. Systematic ab initio gradient calculation of molecular geometries, force constants, and dipole moment derivatives. J. Am. Chem. Soc. 1979, 101, 2550–2560. [Google Scholar] [CrossRef]
  35. Martin, J.M.L.; Alsenoy, C.V. Gar2ped; University of Antwerp: Antwerpen, Belgium, 1995. [Google Scholar]
  36. Frisch, A.; Nielson, A.B.; Holder, A.J. Gaussview User Manual; Gaussian, Inc.: Pittsburgh, PA, USA, 2000. [Google Scholar]
  37. Bader, R.F.W.; Cheeseman, J.R. AIMPAC: A Suite of Programs for the AIM Theory; McMaster University: Hamilton, ON, Canada, 2000. [Google Scholar]
  38. National Center for Biotechnology Information. Pubchem Compound Database [WWW Document]. Available online: https://pubchem.ncbi.nlm.nih.gov/compound/14284 (accessed on 15 January 2017).
  39. Karasulu, B.; Götze, J.P.; Thiel, W. Assessment of Franck–Condon methods for computing vibrationally broadened UV–vis absorption spectra of flavin derivatives: Riboflavin, roseoflavin, and 5-thioflavin. J. Chem. Theory Comput. 2014, 10, 5549–5566. [Google Scholar] [CrossRef] [PubMed]
  40. Scott, A.P.; Radom, L. Harmonic vibrational frequencies:  An evaluation of hartree−fock, møller−plesset, quadratic configuration interaction, density functional theory, and semiempirical scale factors. J. Phys. Chem. 1996, 100, 16502–16513. [Google Scholar] [CrossRef]
  41. Wong, M.W. Vibrational frequency prediction using density functional theory. Chem. Phys. Lett. 1996, 256, 391–399. [Google Scholar] [CrossRef]
  42. Banwell, C.N.; McCash, E.M. Fundamentals of Molecular Spectroscopy; Mcgraw-Hill: New York, NY, USA, 1994. [Google Scholar]
  43. Lambert, J.B. Introduction to Organic Spectroscopy; Macmillan: New York, NY, USA, 1987. [Google Scholar]
  44. Delgado, M.C.R.; Hernandez, V.; Navarrete, J.T.L.; Tanaka, S.; Yamashita, Y. Electronic, optical, and vibrational properties of bridged dithienylethylene-based NLO chromophores. J. Phys. Chem. B. 2004, 108, 2516–2526. [Google Scholar] [CrossRef]
  45. Socrates, G. Infrared and Raman Characteristic Group Frequencies: Tables and Charts; John Wiley & Sons: Hoboken, NJ, USA, 2007. [Google Scholar]
  46. Smith, B.C. Infrared Spectral Interpretation: A Systematic Approach; CRC Press: Boca Raton, FL, USA, 1999. [Google Scholar]
  47. Koch, U.; Popelier, P.L.A. Characterization of C-H∙∙∙O hydrogen bonds on the basis of the charge density. J. Phys. Chem. 1995, 99, 9747–9754. [Google Scholar] [CrossRef]
  48. Rozas, I.; Alkorta, I.; Elguero, J. Behavior of ylides containing N, O, and C atoms as hydrogen bond acceptors. J. Am. Chem. Soc. 2000, 122, 11154–11161. [Google Scholar] [CrossRef]
  49. Fukui, K. Role of frontier orbitals in chemical reactions. Science 1982, 218, 747. [Google Scholar] [CrossRef]
  50. Khan, E.; Shukla, A.; Srivastava, A.; Shweta, P.; Tandon, P. Molecular structure, spectral analysis and hydrogen bonding analysis of ampicillin trihydrate: A combined DFT and AIM approach. New J. Chem. 2015, 39, 9800–9812. [Google Scholar] [CrossRef]
  51. Chidangil, S.; Shukla, M.K.; Mishra, P.C. A molecular electrostatic potential mapping study of some fluoroquinolone anti-bacterial agents. J. Mol. Model. 1998, 4, 250–258. [Google Scholar] [CrossRef]
  52. Luque, F.J.; Lopez, J.M.; Orozco, M. Perspective on electrostatic interactions of a solute with a continuum. A direct utilization of ab initio molecular potentials for the prevision of solvent effects. Theor. Chem. Acc. 2000, 103, 343–345. [Google Scholar] [CrossRef]
  53. Parr, R.G.; Szentpaly, L.; Liu, S. Electrophilicity index. J. Am. Chem. Soc. 1999, 121, 1922. [Google Scholar] [CrossRef]
Figure 1. Optimized structure of NF-DMAP using B3LYP method.
Crystals 09 00413 g001
Figure 2. Optimized structure of NF-DMAP using wB97X-D method.
Crystals 09 00413 g002
Figure 3. Experimental and theoretical IR spectra for NF-DMAP in the range 3600–400 cm−1.
Crystals 09 00413 g003
Figure 4. Experimental and theoretical Raman spectra for NF-DMAP in the range 3600–100 cm−1.
Crystals 09 00413 g004
Figure 5. The HOMO-LUMO energy gap of NF and NF-DMAP calculated at the B3LYP level of theory.
Crystals 09 00413 g005
Figure 6. The HOMO-LUMO energy gap of NF and NF-DMAP calculated at the wB97X-D level of theory.
Crystals 09 00413 g006
Table 1. Geometrical (calculated bond length) and topological parameters for hydrogen bonds of interacting atoms of NF-DMAP: Electron density (ρBCP), Laplacian of electron density (∇2ρBCP), electron kinetic energy density (GBCP), electron potential energy density (VBCP), total electron energy density (HBCP) at bond critical point (BCP) and hydrogen bond energy (EHB).
InteractionsBond Length (Å)ρBCP
(a.u.)
2ρBCP
(a.u.)
GBCP
(a.u.)
VBCP
(a.u.)
HBCP
(a.u.)
EHB
(kcal mol−1)
B3LYP
N23-H24⋅⋅⋅N91.867130.037010.115510.00107−0.03103−0.02996−9.7358
C33-H34⋅⋅⋅O42.095740.020150.06811−0.00216−0.01270−0.01486−3.9847
wB97X-D
N23-H24⋅⋅⋅N91.846790.038820.122670.00156−0.03378−0.03222−10.5986
C33-H34⋅⋅⋅O42.051020.021960.07461−0.00216−0.01432−0.01648−4.4926
Table 2. Calculated EHOMO, ELUMO, energy gap (EL–EH), chemical potential (μ), electronegativity (χ), global hardness (η), global softness (S) and global electrophilicity index (ω) at 298.15 K for NF, DMAP and NF-DMAP using wB97X-D and B3LYP level of theory.
MoleculeEH (eV)EL (eV)EL–EH (eV)χ (eV)μ (eV)η (eV)S (eV−1)ω (eV)ΔNmaxECT
B3LYP
NF−7.0140−3.30483.70925.1590−5.15941.85460.26967.17662.7819
DMAP−5.9664−0.52765.43883.2470−3.24702.71940.18391.93851.19401.5879
NF-DMAP−5.6374−2.45243.18504.0449−4.04491.59250.31395.13692.5400
wB97X-D
NF−8.8619−1.33557.52645.0990−5.09873.76320.13293.45411.3549
DMAP−7.8984−0.87657.02194.3870−4.38753.51100.14242.74141.24960.1053
NF-DMAP−7.4719−0.55026.92174.0110−4.01103.46080.14452.32431.1590

