Article

Coherent Magnetization Rotation of a Layered System Observed by Polarized Neutron Scattering under Grazing Incidence Geometry

1
J-PARC Center, Japan Atomic Energy Agency, 2-4 Shirakata, Tokai, Ibaraki 319-1195, Japan
2
Institut Laue Langevin, 71 Avenue des Martyrs, 38042 Grenoble, France
*
Author to whom correspondence should be addressed.
Current address: Physics and Materials Science Research Unit, University of Luxembourg, 162A Avenue de la Faïencerie, L-1511 Luxembourg, Luxembourg.
Crystals 2019, 9(8), 383; https://doi.org/10.3390/cryst9080383
Submission received: 2 July 2019 / Revised: 22 July 2019 / Accepted: 23 July 2019 / Published: 26 July 2019
(This article belongs to the Special Issue Investigation of Nanostructures with X-ray Scattering Techniques)

Abstract

:
The in-plane magnetic structure of a layered system composed of polycrystalline grains smaller than the ferromagnetic exchange length was studied to elucidate the mechanism controlling the magnetic properties considerably different from the bulk using polarized neutron scattering under grazing incidence geometry. The measured result, together with quantitative analysis based on the distorted wave Born approximation, showed that the in-plane length of the area with a uniform orientation of moments ranging from 0.5–1.1 μ m was not significantly varied during the process of demagnetization followed by remagnetization. The obtained behavior of moments is in good agreement with the two-dimensional random anisotropy model where coherent magnetization rotation is dominant.

1. Introduction

Layered magnetic structures have drawn considerable interests because of their attractive and useful magnetic properties not seen in the bulk such as exchange coupling between layers, giant magnetoresistance, and tunnel magnetoresistance [1,2,3]. These magnetic properties can be attributed to the reduced size of the structure to the nm range where interface effects become significant. The process of demagnetization followed by remagnetization can be seen as magnetic properties different from the bulk. The idea of the formation and movement of domain walls disagrees with the measured data when the grain size becomes comparable to or smaller than the ferromagnetic exchange length. In this case, the exchange interaction between neighboring moments prevails over the magneto-crystalline anisotropies. The counterplay of the exchange interaction and local magneto-crystalline anisotropies should be responsible for the magnetic properties such as the coercivity and initial permeability. This is known as the random anisotropy model originally proposed for amorphous nanomagnets [4,5,6]. The information on the behavior of moments, the in-plane magnetic structure, during the demagnetization and remagnetization is needed to demonstrate whether this model agrees with our system composed of polycrystalline grains smaller than the ferromagnetic exchange length.
In this study, the in-plane magnetic structure of an Fe/Si multilayer was observed by polarized off-specular neutron scattering (OSS) and grazing-incidence small-angle neutron scattering (GISANS) measurements to understand what is responsible for the magnetic properties of our system. The Fe/Si multilayer is frequently used as a neutron-polarizing supermirror because Fe is an easily-deposited ferromagnetic material with a large saturation magnetization and low coercivity, and Si has a scattering length density (SLD) close to Fe for spin-down neutrons. To enhance the momentum transfer range of the neutron spin polarization, the minimum thickness of the neutron-polarizing supermirror needs to be decreased and the total number of layers increased [7,8]. The magnetic properties in terms of softness and squareness are important for the neutron-polarizing supermirrors because high polarization efficiencies are required at low external magnetic fields to satisfy the demands in the experiments [9,10,11,12,13,14,15,16]. Until now, some studies demonstrated that the polarized OSS measurement was effective in the analysis of the in-plane/out-of-plane magnetic structure of magnetic multilayers. Syromyatnikov et al. showed that the polarized OSS profiles contained information on the magnetic inhomogeneities in magnetic multilayers [17,18,19]. Kentzinger et al. demonstrated a depth-resolved investigation on the in-plane magnetic structure for an FeCoV/TiN neutron-polarizing supermirror [20]. The impact of substrate bias voltage on the roughness and magnetic structure in Fe/Si multilayers was studied using the polarized OSS measurement [21]. Our previous work showed that magnetron-sputtered Fe/Si multilayers form areas with uniform orientation of moments much larger than Fe grains in the process of magnetization [22].
This study shows the behavior of moments in the Fe/Si multilayer during the process of demagnetization and remagnetization observed by the polarized OSS and GISANS. The scattering data were analyzed by the simulation based on the distorted wave Born approximation (DWBA). The result of the quantitative data analysis, together with the measured hysteresis data, revealed that the behavior of moments can be understood by the two-dimensional random anisotropy model where coherent magnetization rotation is dominant.

2. Materials and Methods

The Fe/Si multilayer of 30 bilayers with a thickness of 10 nm was fabricated by using a DC-magnetron sputtering system installed at the Institut Laue Langevin (ILL) [14]. The detail of the sample preparation can be found in [22] because the same Sample B was used in this study.
The magnetic hysteresis measurement was performed by using a SQUID magnetometer (Quantum Design MPMS2) generating magnetic fields up to 8.0 × 10 5 A/m. The hysteresis loop was measured with applied magnetic fields within the sample plane at a temperature of 300 K.
The polarized OSS measurement was carried out by using the D17 polarized neutron reflectometer at the high-flux reactor in the ILL [23,24]. The monochromatic mode was used in this study. The incident beam had an average wavelength of 0.549 nm and a wavelength spread of 4.5% in full width at half maximum (FWHM). The angular resolution ( Δ α i / α i ) was less than 3.6%. A periodic Fe/Si multilayer was used as the monochromator-polarizer for the incident beam. A 3 He gas cell polarizer was used for polarization analysis [24,25]. The 3 He gas in the cell was refreshed every day. The time-dependent transmission and polarization were monitored. The correction for transmission of the 3 He gas was applied to the measured data. The correction for the polarization inefficiencies was applied to the measured reflectivity data, whereas the measured polarization was taken into account in the simulation for the OSS. A 2D position-sensitive detector with a resolution of 2.2 mm within the scattering plane was located at a distance of 3.1 m from the sample, covering a scattered angle of 4 .
The polarized GISANS measurement was carried out by using the D33 small angle diffractometer at the ILL [26]. The monochromatic mode was used in this study. The incident beam had an average wavelength of 0.80 nm and a wavelength spread of 10% in FWHM. The divergent angle was less than 1.95 mrad. A supermirror polarizer was used for the incident beam polarization [27]. The same 3 He polarization system as the D17 reflectometer was used for the polarization analysis. The corrections for the transmission of the 3 He gas and polarization inefficiencies were applied to the measured GISANS data. A 2D position-sensitive detector covering an area of 640 × 640 mm 2 with a pixel size of 2.5 mm in width and 5.0 mm in height was located at a distance of 2.0 m from the sample.
The scattering geometry of the polarized OSS and GISANS measurements is shown in Figure 1, which was the same as the previous study in [22] (Figure 1 is reprinted from [22], with permission from Elsevier). Neutrons were incident on the sample at the angle α i and scattered at the angles of α f and 2 θ f in the planes within and perpendicular to the ( x , z ) plane, respectively. All interactions with the sample were assumed as elastic. The z-component of the momentum transfer q z = k 0 ( sin α i + sin α f ) was perpendicular to the sample plane, whereas the x- and y-components, q x k 0 ( cos α f cos α i ) and q y 2 k 0 sin θ f , were within the sample plane. Further detail of the measurements can be found in [22].

3. Results

3.1. Magnetic Hysteresis Measurement

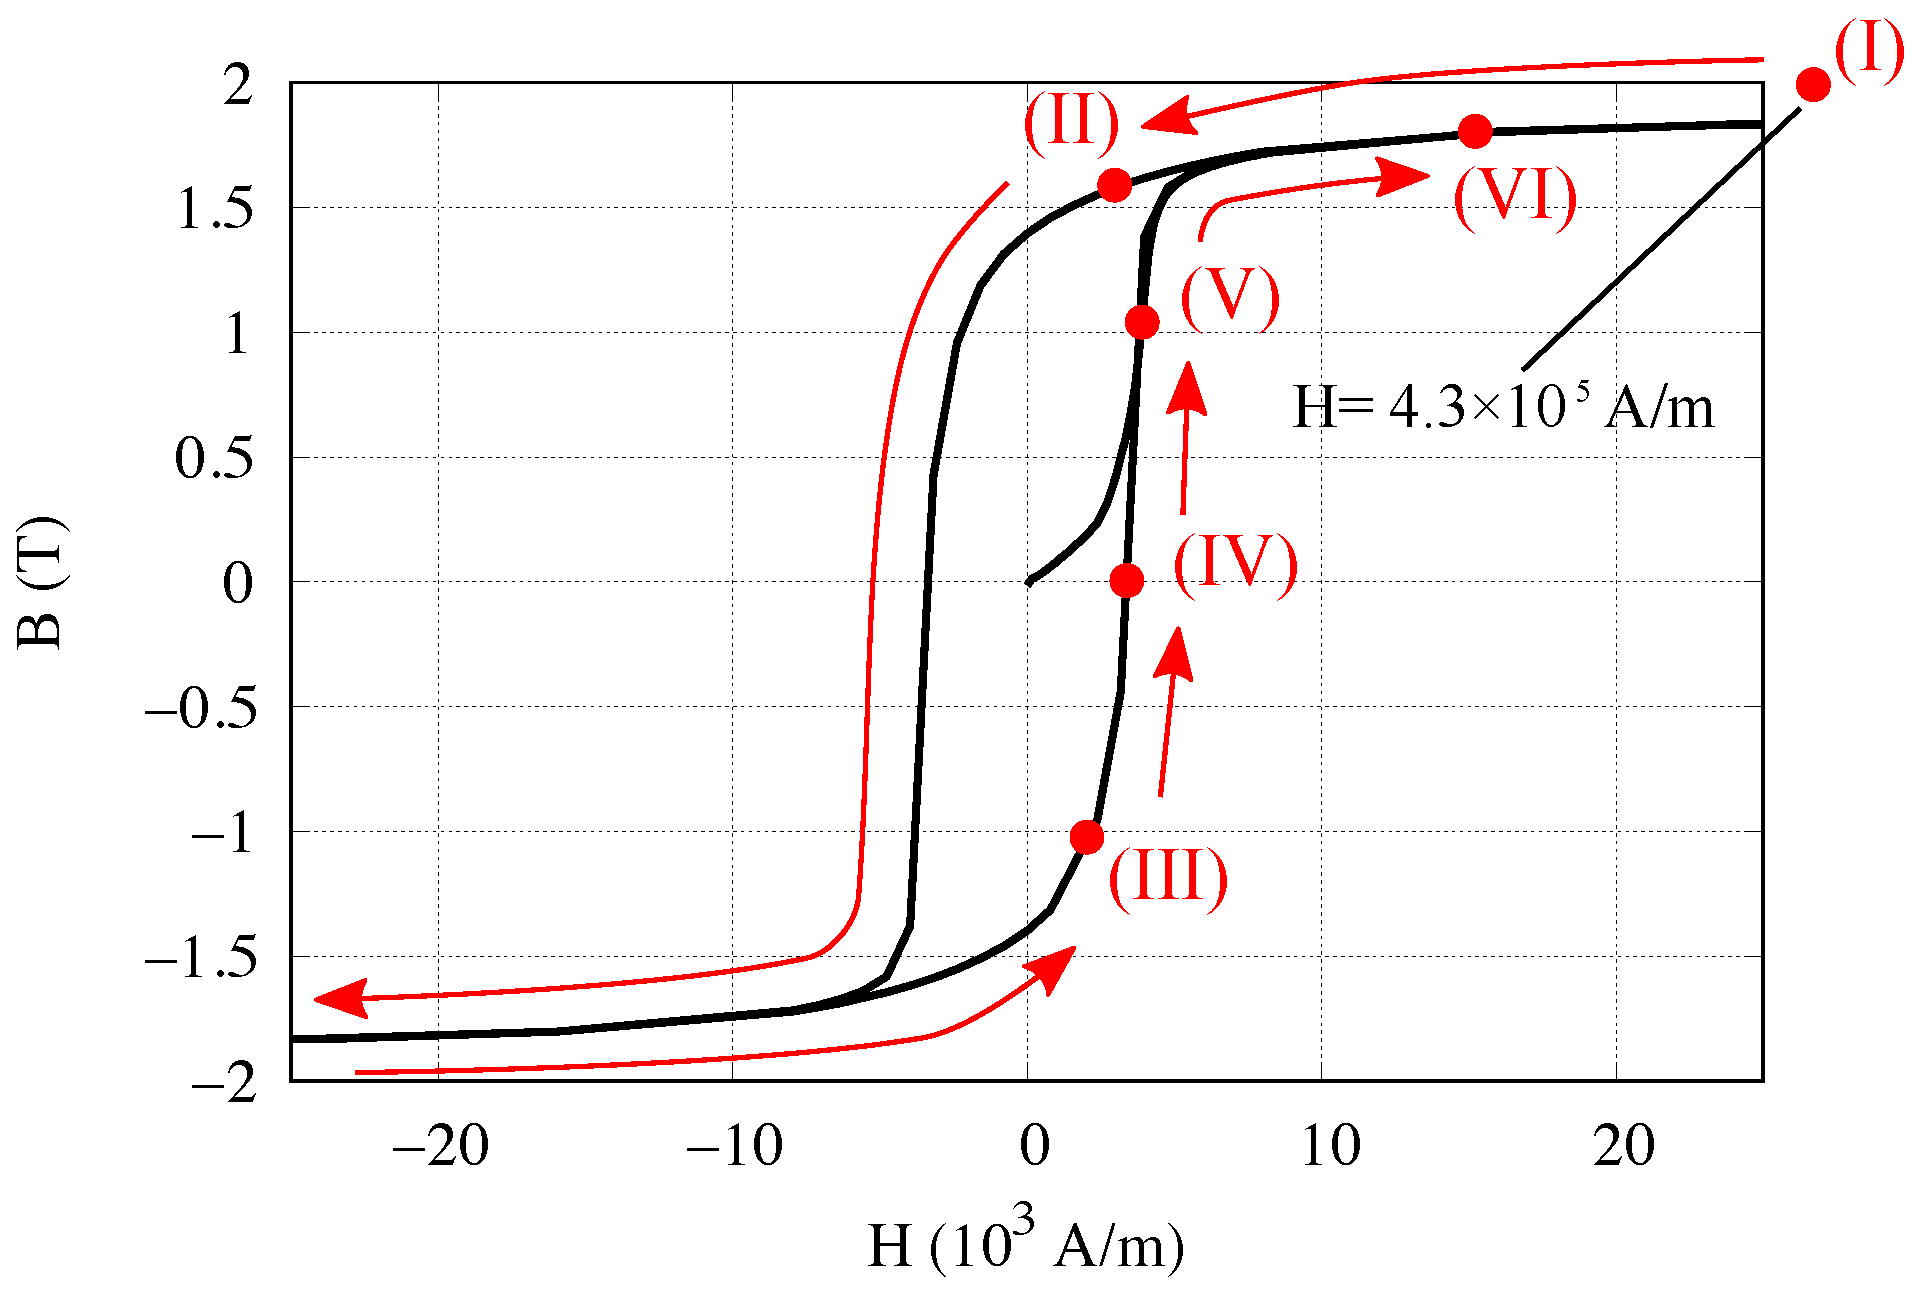
The magnetic hysteresis measurement was performed for the Fe/Si multilayer. The measured hysteresis loop is shown in Figure 2. The saturation magnetization M s , coercivity H c , and initial permeability μ i were 2.05 T, 3.3 × 10 3 A/m, and 6.8 × 10 , respectively. The measured values were normalized with the volume of the Fe layers, using an Fe thickness of 3.8 nm where the thickness of the “magnetically-dead” layers was determined as 1.2 nm per a period by the result of the polarized neutron reflectivity measurement shown in Section 3.2 and subtracted from a nominal Fe thickness of 5.0 nm calculated by the sputtering rate. This explains the measured saturation magnetization compared with the bulk value ( 2.15 T) and is consistent with the previously-obtained results [14,16,28].

3.2. Polarized OSS Measurement

The polarized OSS measurement was performed to observe the behavior of moments during the magnetization reversal process. The applied field was varied as follows. The first and second OSS measurements were carried out at a field of (I) 4.3 × 10 5 and (II) 2.4 × 10 3 A/m, respectively. The following were performed at fields of (III) 2.1 × 10 3 , (IV) 3.3 × 10 3 , (V) 4.2 × 10 3 , and (VI) 1.5 × 10 4 A/m after the sample was saturated at a field of 4.3 × 10 5 A/m opposing the neutron guide field, as shown in Figure 2. This ensured that the applied magnetic field was parallel to the field axis of the polarized 3 He cell and avoided polarization losses. The sample was magnetically saturated at (I). The condition (IV) corresponded to the coercive state. The remaining conditions (II), (III), (V), and (VI) corresponded to 75, 50 , 50, and 85% of saturation magnetization, respectively.
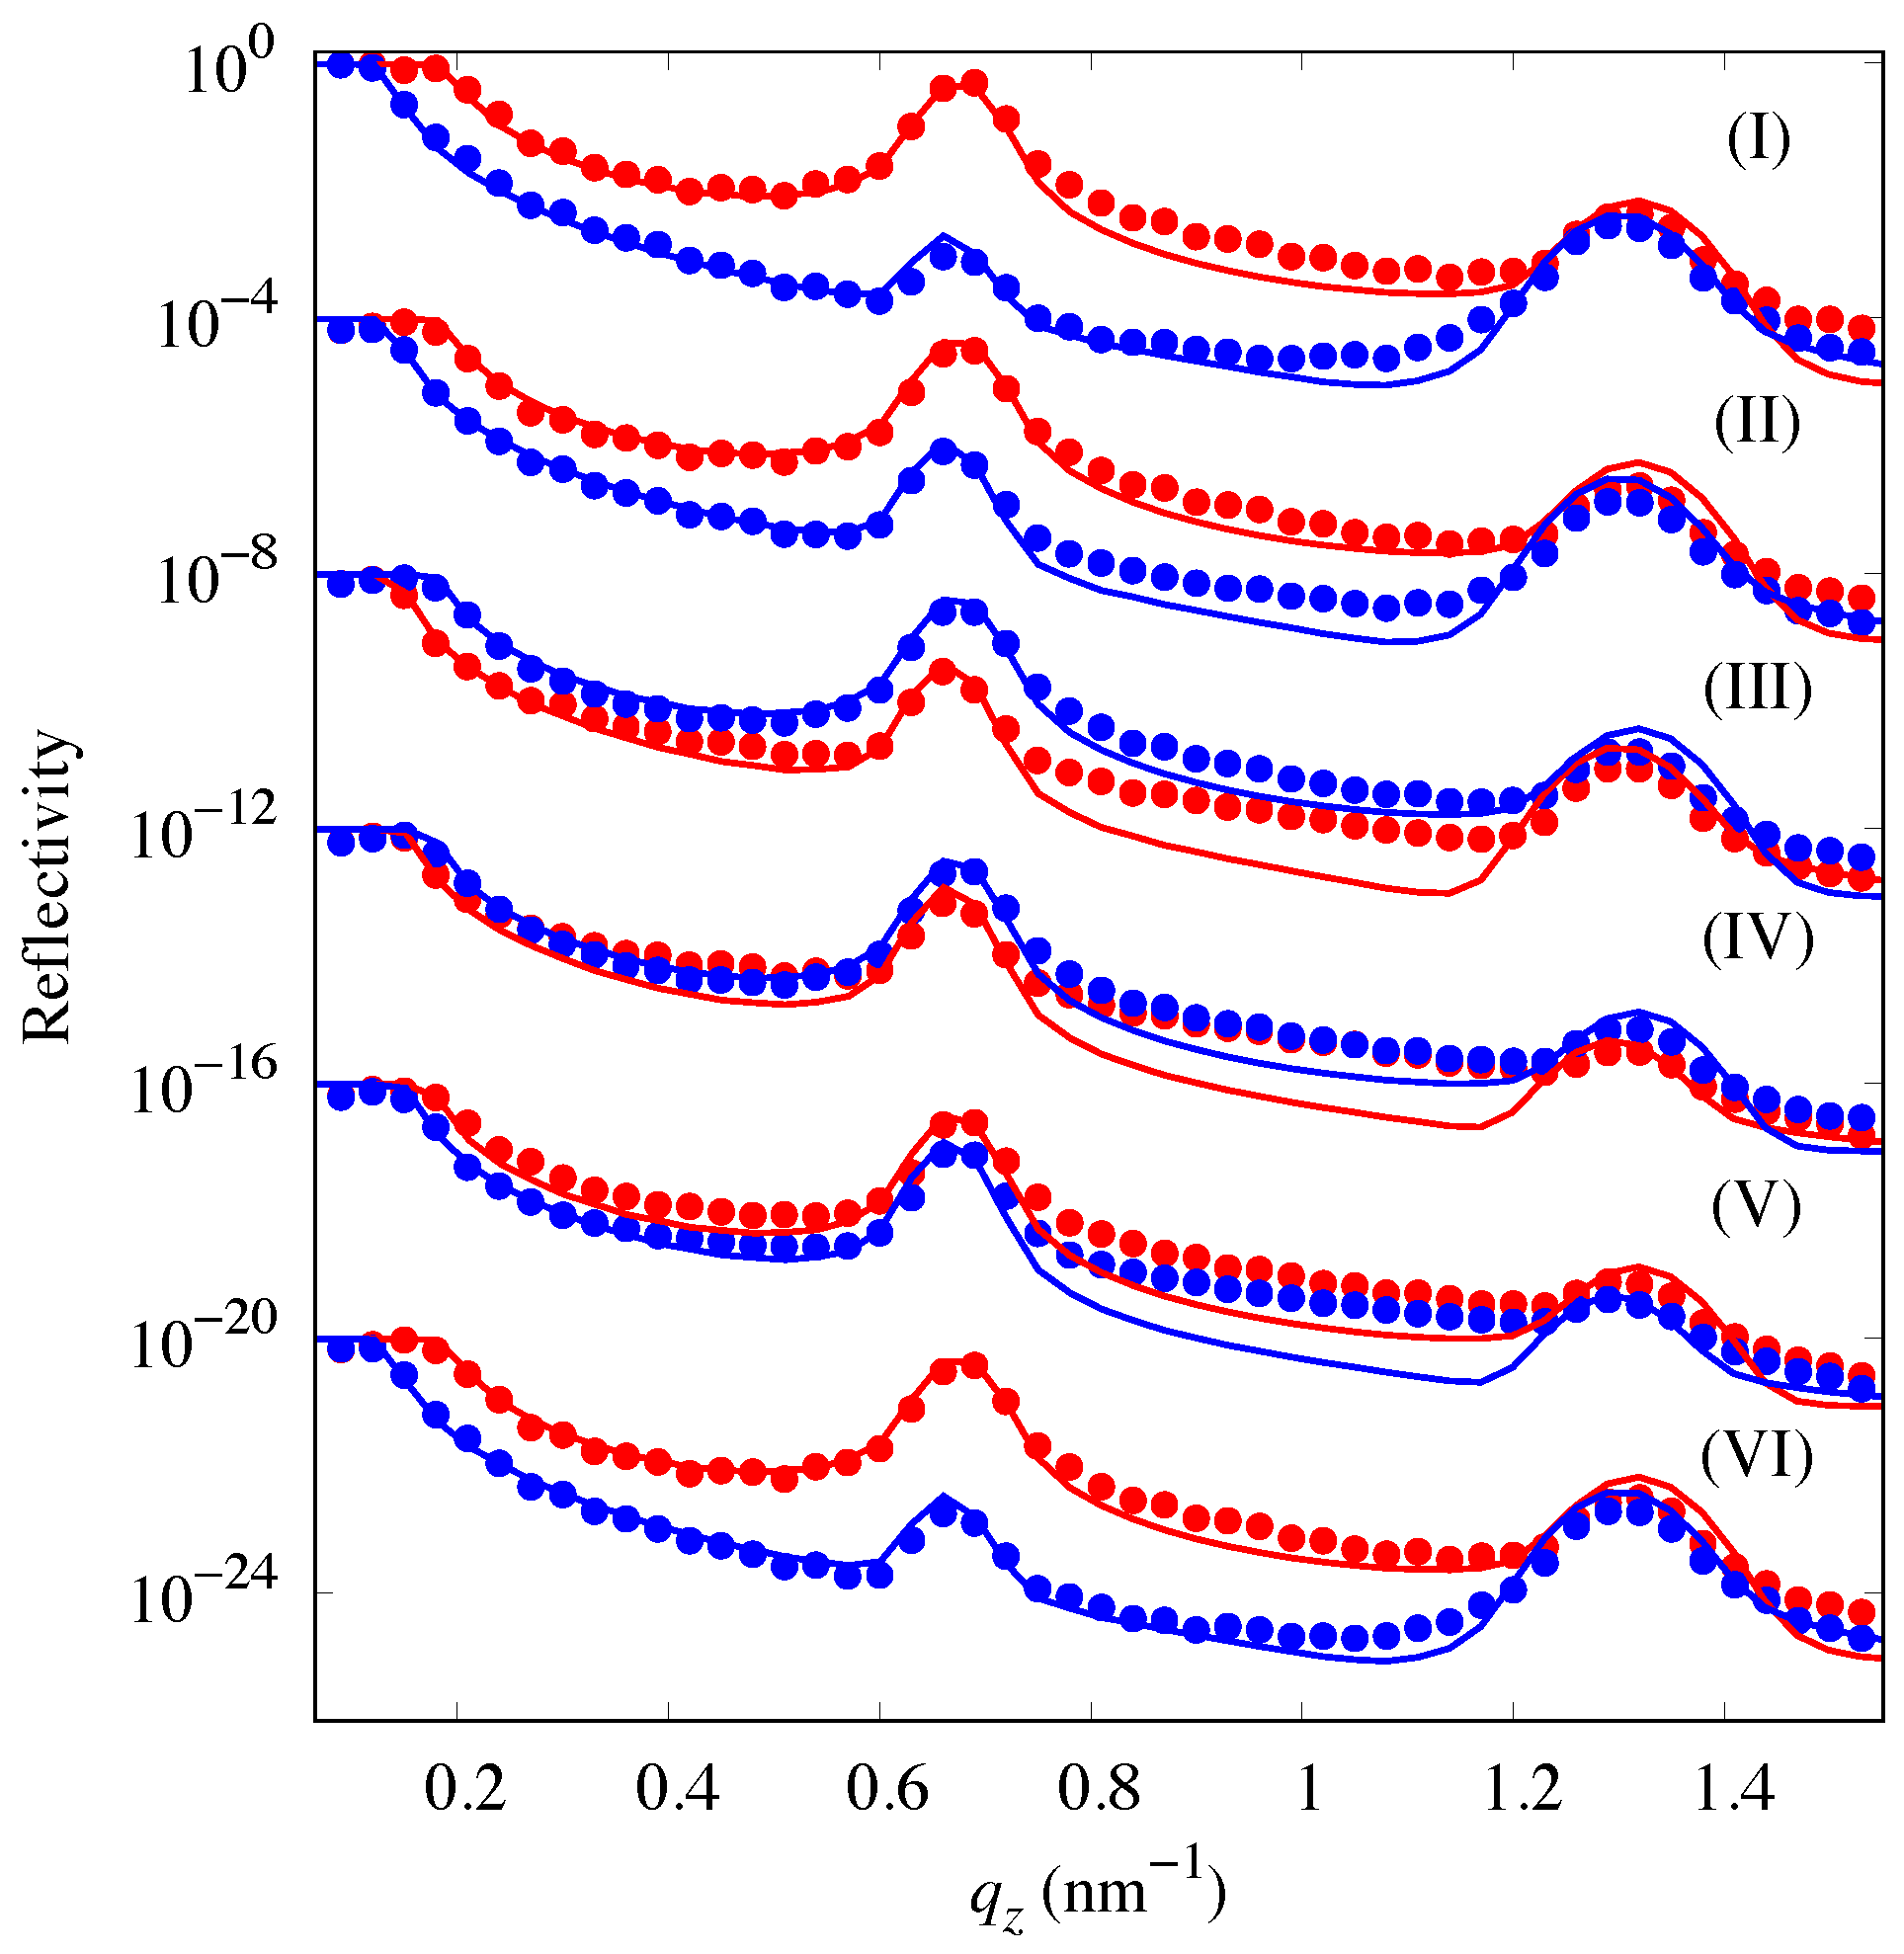
Figure 3 shows the polarized neutron reflectivity profiles where the measured data were extracted from the OSS images [29]. Statistical errors of the measured data were less than the size of the symbols. The measured reflectivities were fitted using GenX code [30,31]. GenX is a versatile program using the differential evolution algorithm for fitting the X-ray and neutron reflectivity data. The specular reflection was calculated by using the Parratt recursive formula [32]. The following model was used to fit the measured reflectivities. Each bilayer was assumed as equivalent and composed of four separate layers: the Fe component was divided into three separate layers, which can have individual nuclear SLDs; and a single Si layer. Since the interface of magnetic materials is usually analyzed as magnetically smoother than structurally for neutrons [20], only structural roughness at the top and bottom of the Si layer was taken into account. The errors of the parameters corresponded to a 10% increase in the figure-of-merit function. The fitted result is summarized in Table 1.
The fitting parameters were the magnetic SLD of the middle Fe layer (i.e., the Fe layer sandwiched between two “magnetically-dead” Fe layers), interface roughnesses at the top and bottom of the Si layer, and thicknesses and nuclear SLDs for all four layers. These were obtained by the fitting to the measured profile (I) and fixed for the fitting to the profiles (II)–(VI), except for the magnetic SLD of the middle Fe layer. This was based on the assumption that the parameters except for the magnetization should not depend on the field strength. In saturation (I), all moments in the sample were aligned with the external field, and the largest contrast between R + + and R was observed. The contrast between R + + and R at (II) became smaller than that of (I). This meant that the sample was slightly demagnetized. The net magnetization was still negative at (III) even though the applied field became positive. This is consistent with the measured result in which an inverted order of R and R + + with respect to (I) is observed. The splitting between R + + and R collapsed at (IV) because the applied field approached the coercive field. The net magnetization was reversed to positive at (V). This was reflected in the measured profiles with a splitting between R + + and R in the same direction as for the saturated measurement (I). Moments were almost aligned to the applied field direction at (VI), where the reflectivity approached that of saturation (I). The magnetic SLDs at around the coercivity, (III)–(V), were lower than those expected in Figure 2. This resulted from the magnetic field distribution between the pole pieces of the magnet. The measured value of the field and that averaged over the illuminated area of the sample can differ within a few percent. The measured result was consistent with that of the hysteresis measurement shown in Figure 2. The fitting required that the Fe layers adjacent to the Si layers to be less dense and non-magnetic, which resulted from interface effects such as inter-diffusion. The “magnetically-dead” layers with a thickness of 1.2 nm per a period were necessary to reproduce high R at the second Bragg peak by forming spikes with a half-period of the bilayer thickness in the SLD profiles for spin down neutrons. This is consistent with previously-obtained results [14,16,22,28,33,34,35,36,37]. The measured reflectivity was higher than that fitted in the q z range between the first and second Bragg peaks at low fields (III)–(V) because the OSS intensity became comparable to that specularly reflected, as shown in Figure 4. Our previous study showed that no spin-flip specular reflection was observed from our sample because it had an in-plane magnetic structure much smaller than the neutron coherent length [38], and the direction of moments averaged over the sample surface coincided with the external field [22]. The measured spin-flip intensity at the specular position in Figure 4 was reproduced by the non-spin-flip reflection leaked to the non-spin-flip channels due to the inefficiencies of the polarizing devices in addition to the OSS intensity.
The simulation based on DWBA was used for the data analysis of the OSS and GISANS (in Section 3.3) measurements [20,39,40]. The height of the interfaces, varying with the relative lateral coordinate, was supposed to follow a Gaussian distribution with the variance, the root-mean-squared roughness, saturated at a distance corresponding to the cut-off length ξ r R . The roughness correlation between neighboring interfaces is defined by the z-correlation length ξ r z . In the model of the in-plane magnetic structure, the areas where the moments were aligned in the same direction were expressed as rectangular boxes with lengths 2 ξ m x and 2 ξ m y along the x- and y-axes and a height equal to the thickness of the layer with magnetization (middle Fe layer). The moments in the coupled area fluctuated within the sample plane at an angle ϕ with respect to the external field even though the magnitude was the same as saturation. ϕ followed a Gaussian distribution defined by the mean value Φ and variance ( Δ Φ ) 2 . The correlation of the moments between neighboring layers, valid only for the spin-flip scattering, was defined by the z-correlation length ξ m z .
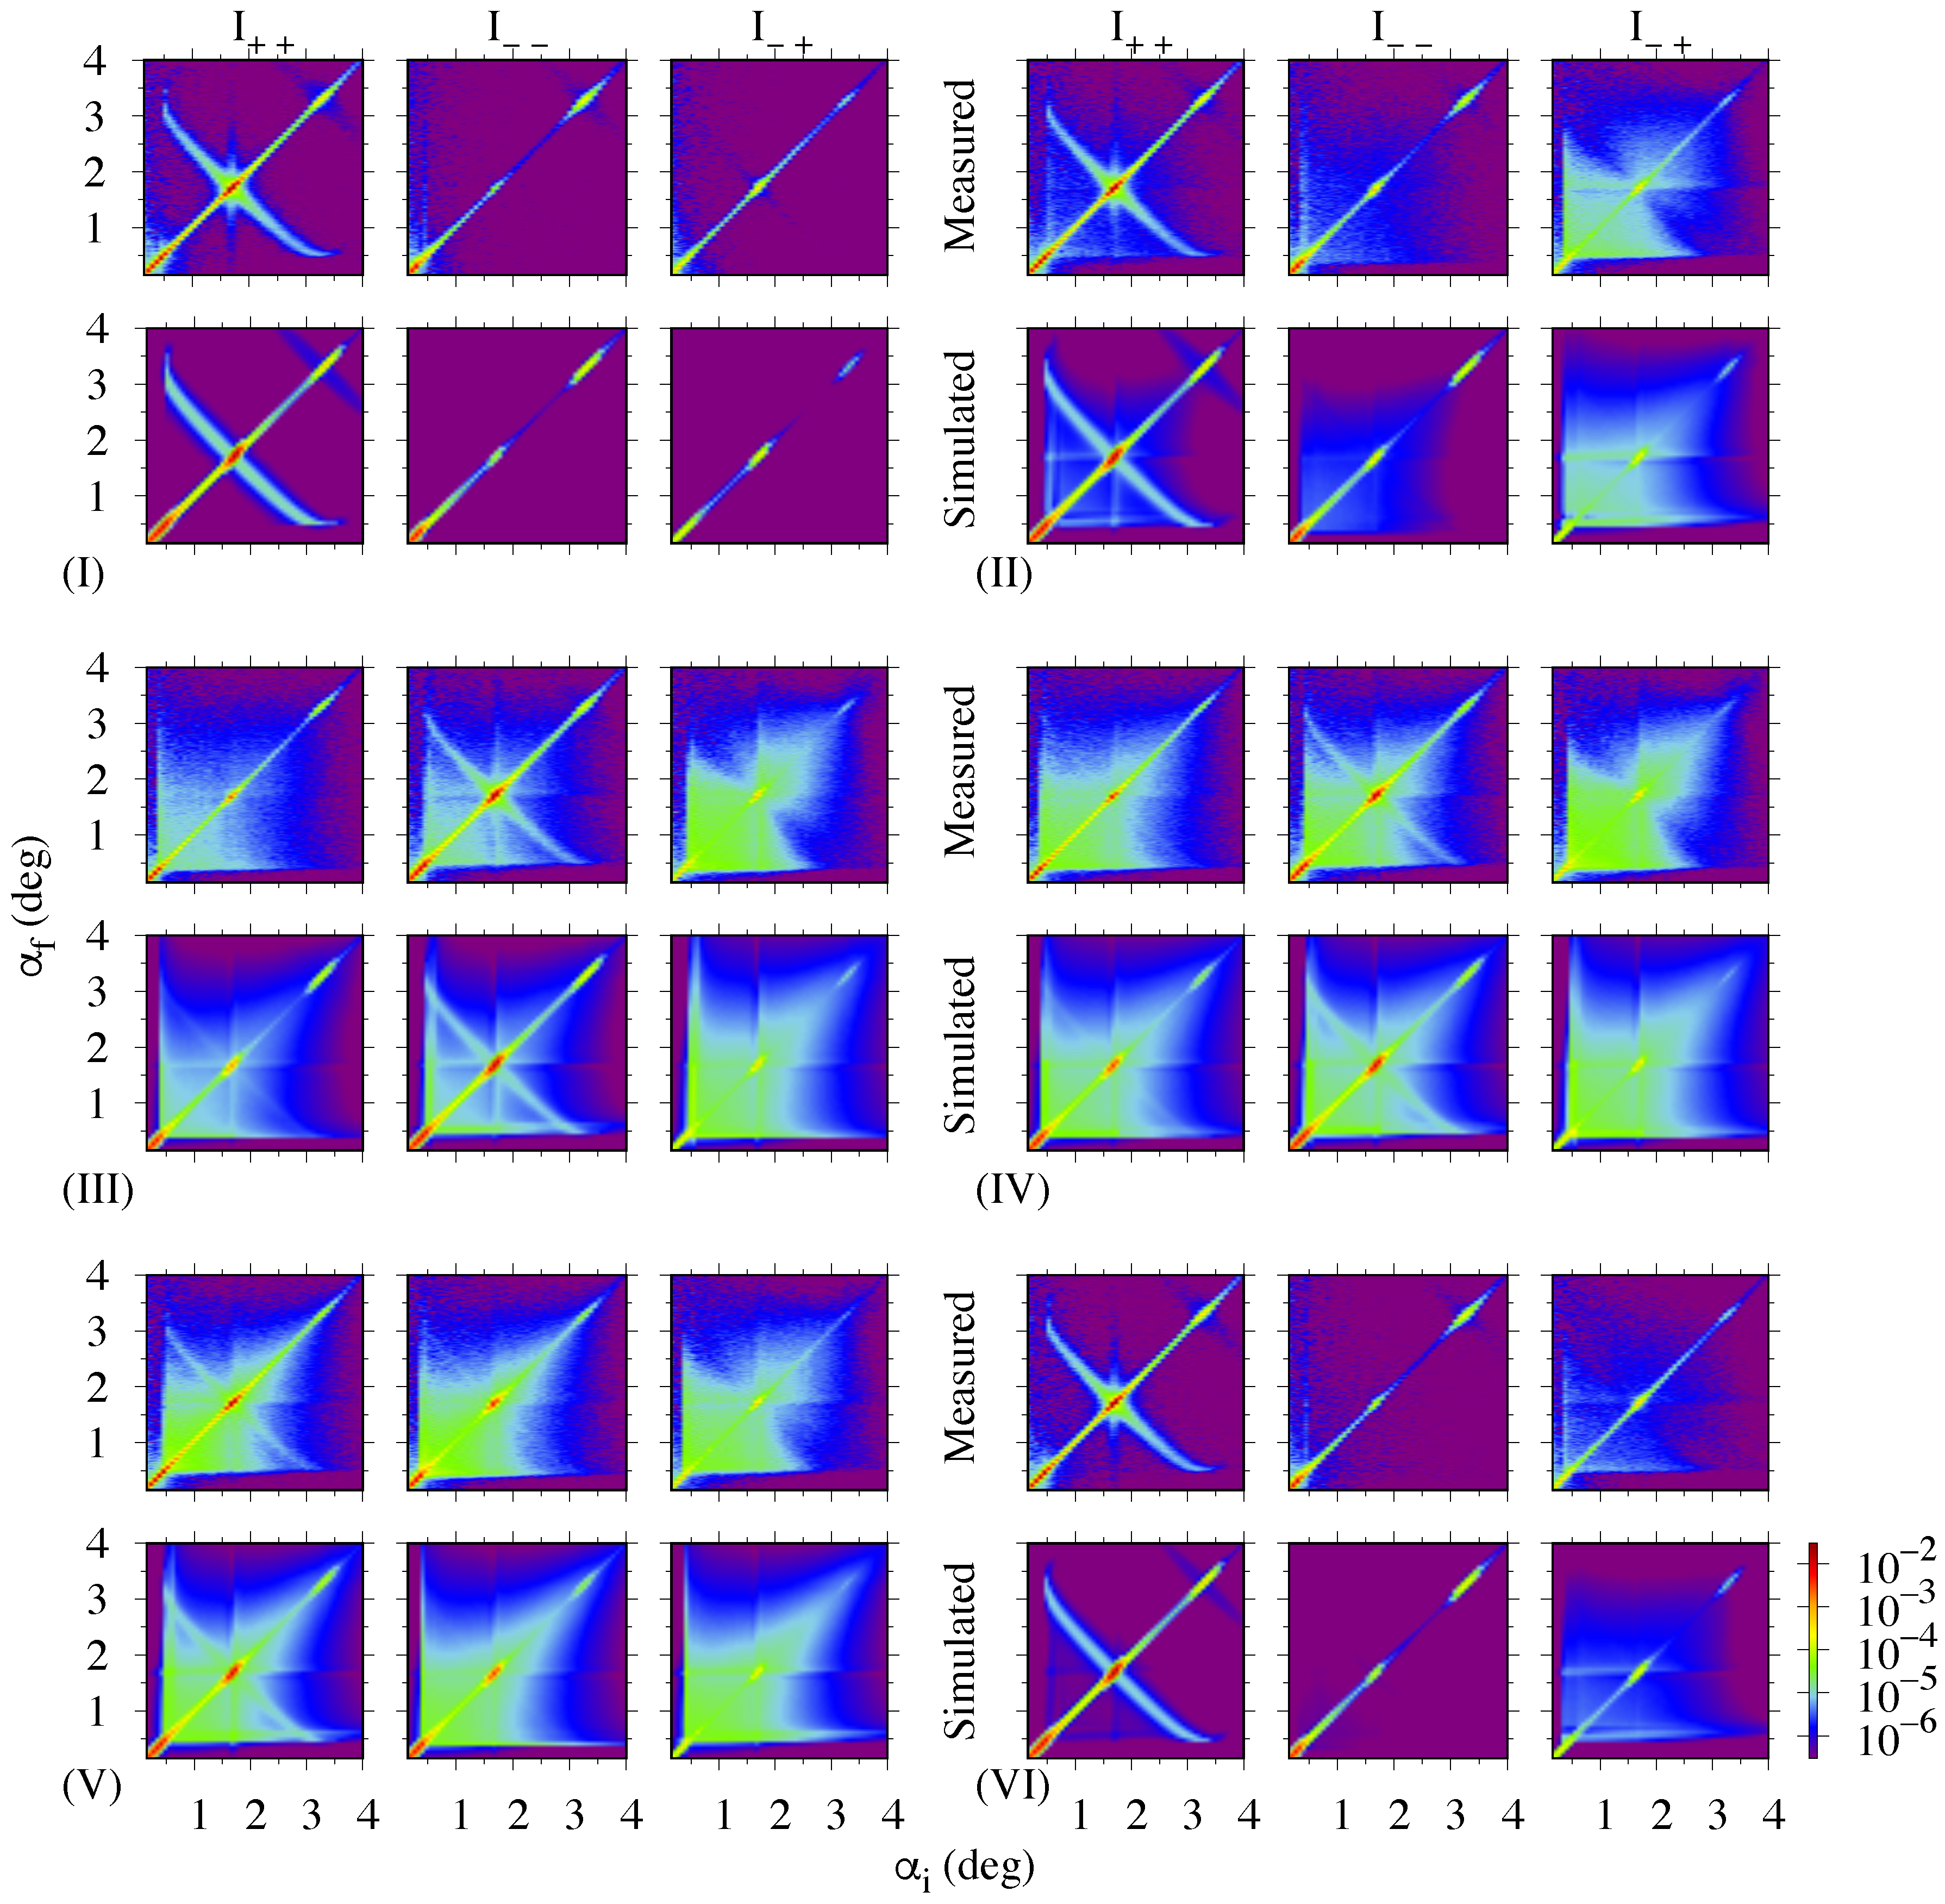
The measured and simulated OSS images at (I) are shown in Figure 4(I). No magnetic scattering was seen at (I) since the moments were perfectly aligned to the direction of the applied field ( Φ = ( Δ Φ ) 2 = 0 ). Intense scattering was observed where q z satisfied the Bragg condition ( α i + α f = 3.4 and 6.6 ) in the I + + channel. This scattering, called the Bragg sheet, resulted from the roughness correlation in the sample normal direction [17,18,41,42]. The parameters characterizing the interface structure were determined as ξ r R 50 nm and ξ r z = 100 ± 50 nm. These values were fixed in the following OSS simulations because these should not depend on the field strength.
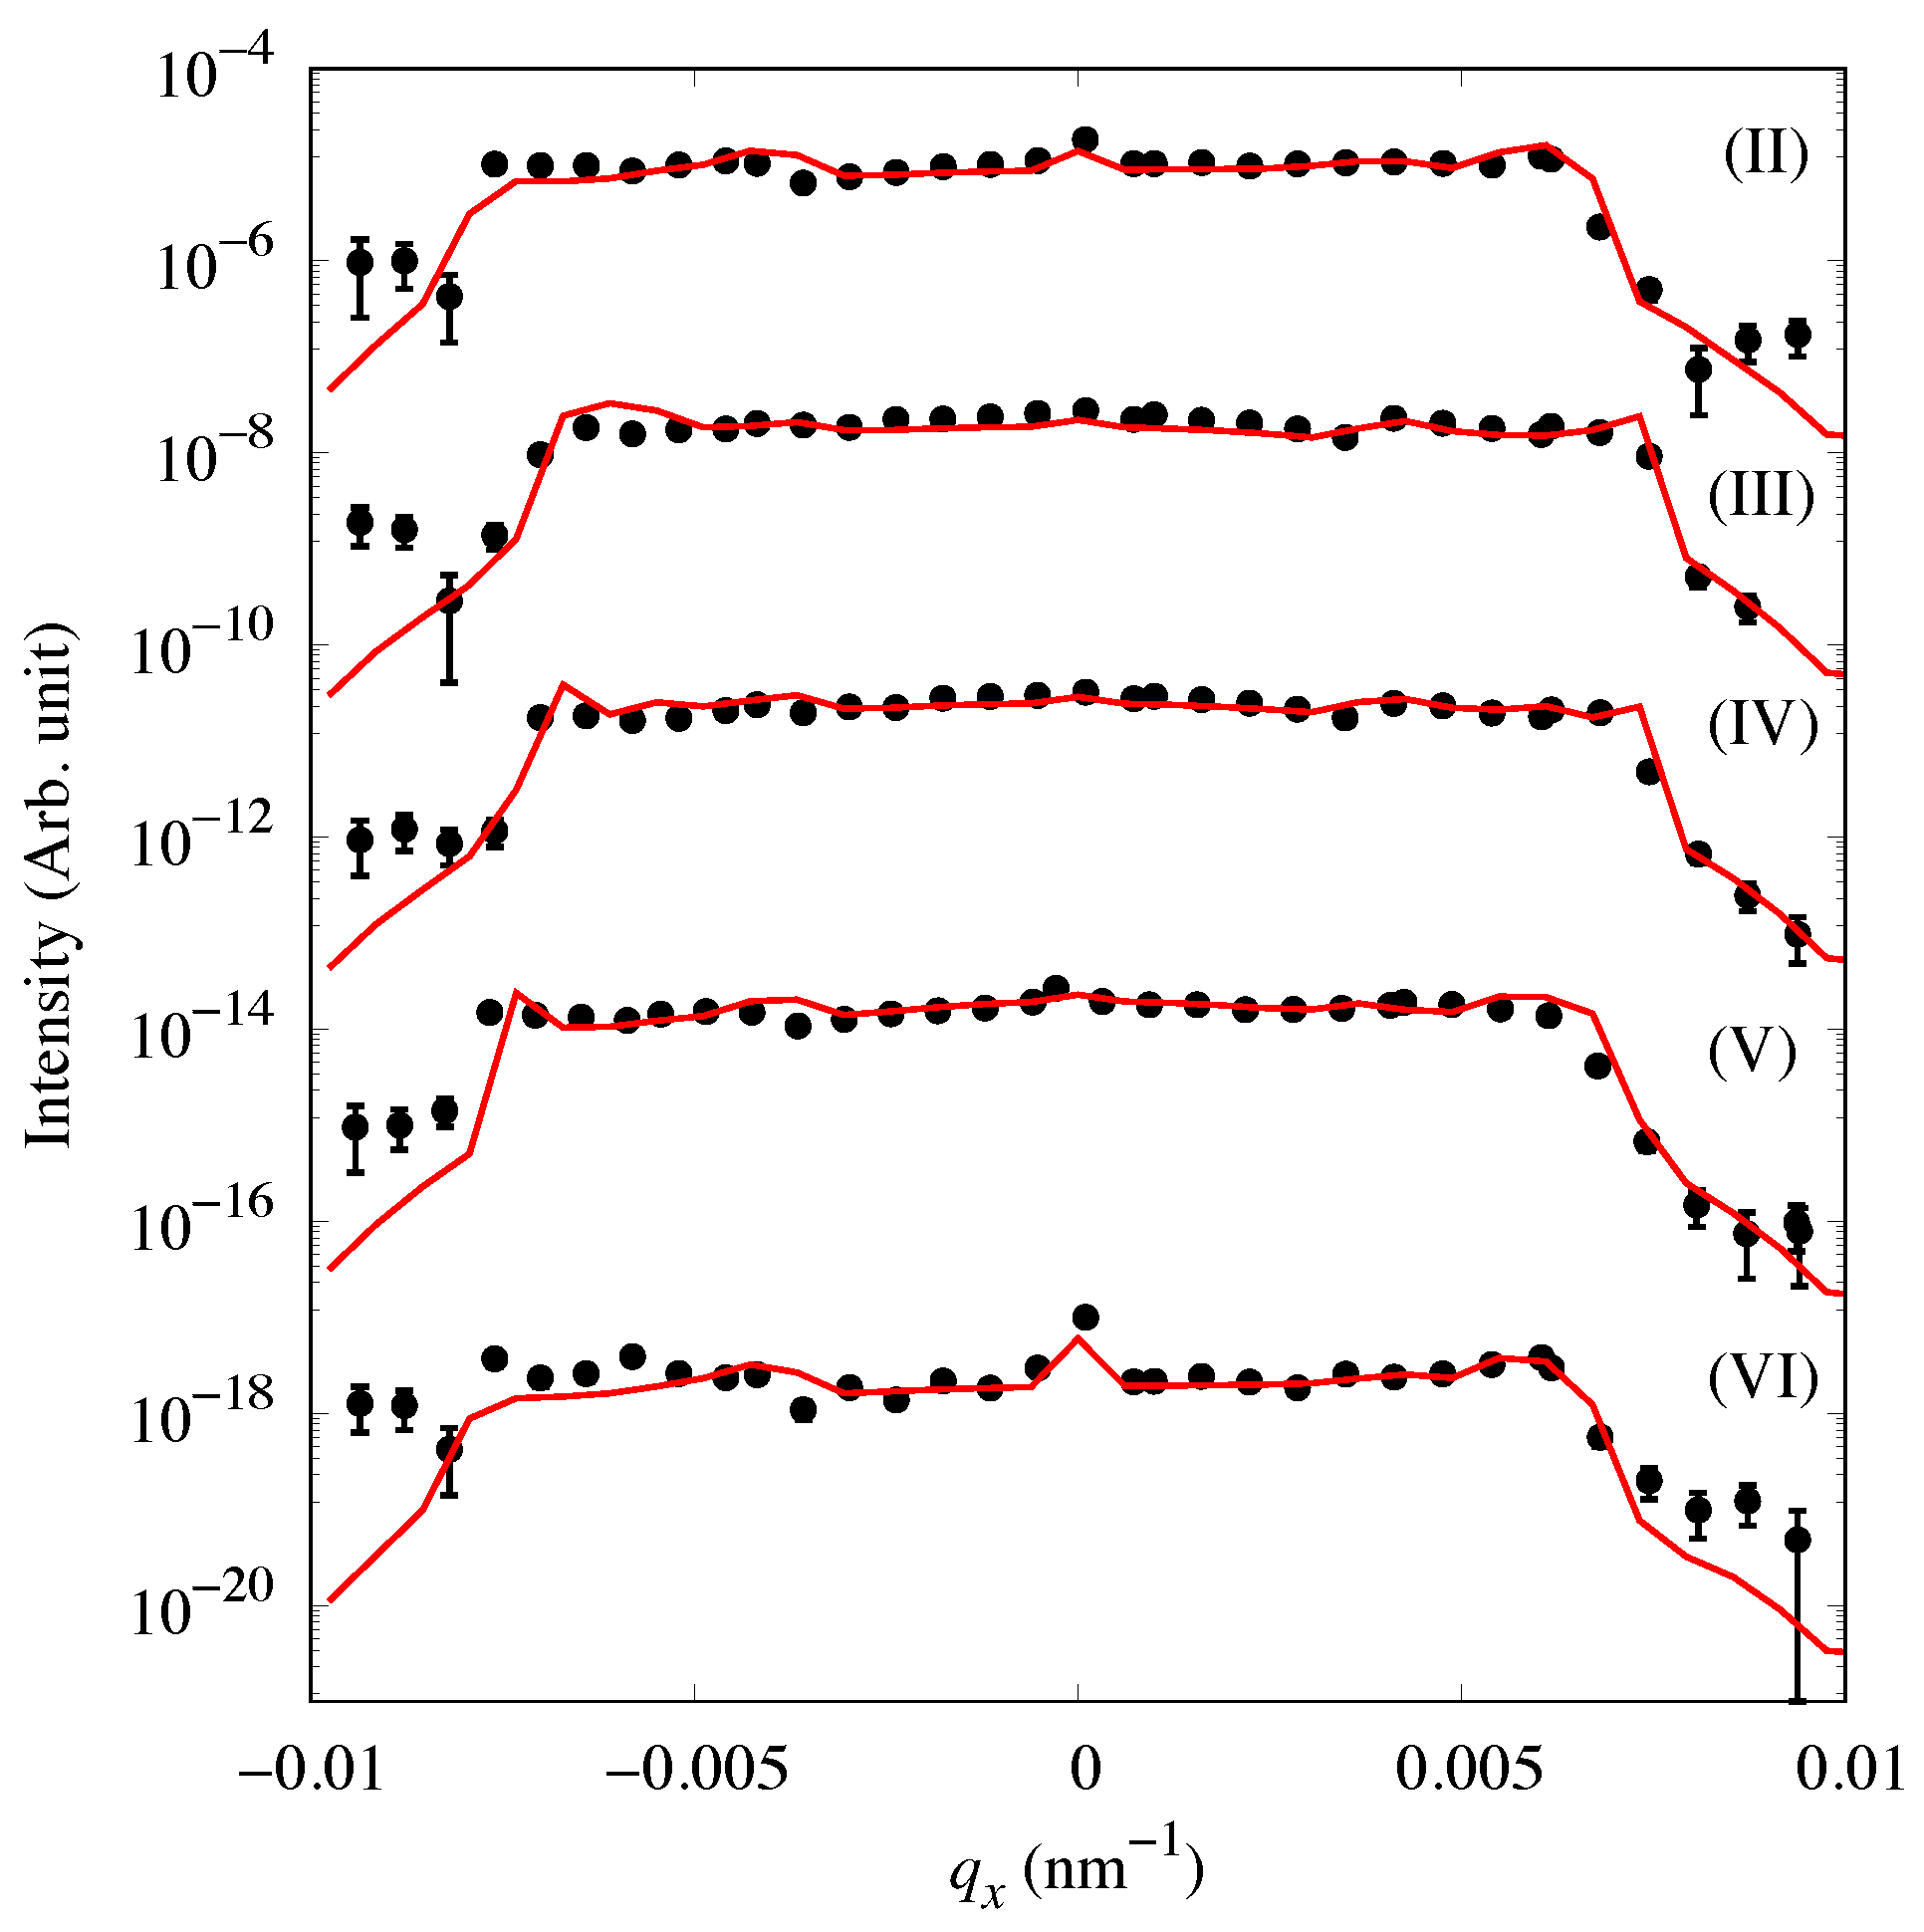
The OSS images at (II)–(VI) are shown in Figure 4(II)–(VI). The spin-flip and non-spin-flip magnetic scattering was observed at low field along with the roughness scattering seen in Figure 4(I). Contrary to the roughness scattering, the magnetic scattering had a broad distribution on the α i - α f plane. This meant that moments were not correlated in the surface normal direction. The z-correlation length of the magnetic scattering was determined as ξ m z 1.0 nm, much smaller than the bilayer thickness. The magnetic SLDs in Table 1 corresponded to a reduction factor of the saturated moment by cos Φ , where Φ = 28 , 131, 110, 65, and 10 for (II)–(VI), respectively. These values of Φ were used in the OSS simulation. Moments were fluctuating more with respect to the external field direction as the absolute value of the net magnetization decreased. This created the magnetic scattering intensity depending on the field strength. The auto-correlation component decreased as ( Δ Φ ) 2 increased for the spin-flip scattering, whereas that increased for the non-spin-flip scattering [20,22]. ( Δ Φ ) 2 = 30 , 40, 62, 82, and 32 for (II)–(VI) were provided by the intensity ratio I + / I . The lateral correlation length of the magnetic scattering ξ m x was determined by the scattering intensity profile along q x [22]. This can be approximated by α i + α f = const . Figure 5 shows the measured and simulated intensity profiles at α i + α f = 2.5 ( q z 0.50 nm 1 ). The I + channel was chosen to prevent the contamination of the roughness scattering. The lateral correlation length for the magnetic scattering was estimated as ξ m x = 100 , 200, 150, 150, and 100 nm for (II)–(VI), respectively. It was, however, not possible to determine the value of ξ m x precisely because the simulated profiles did not vary with the decreasing value of ξ m x . The length of the coupled area was too small compared with the length scale of the OSS measurement [43].

3.3. Polarized GISANS Measurement

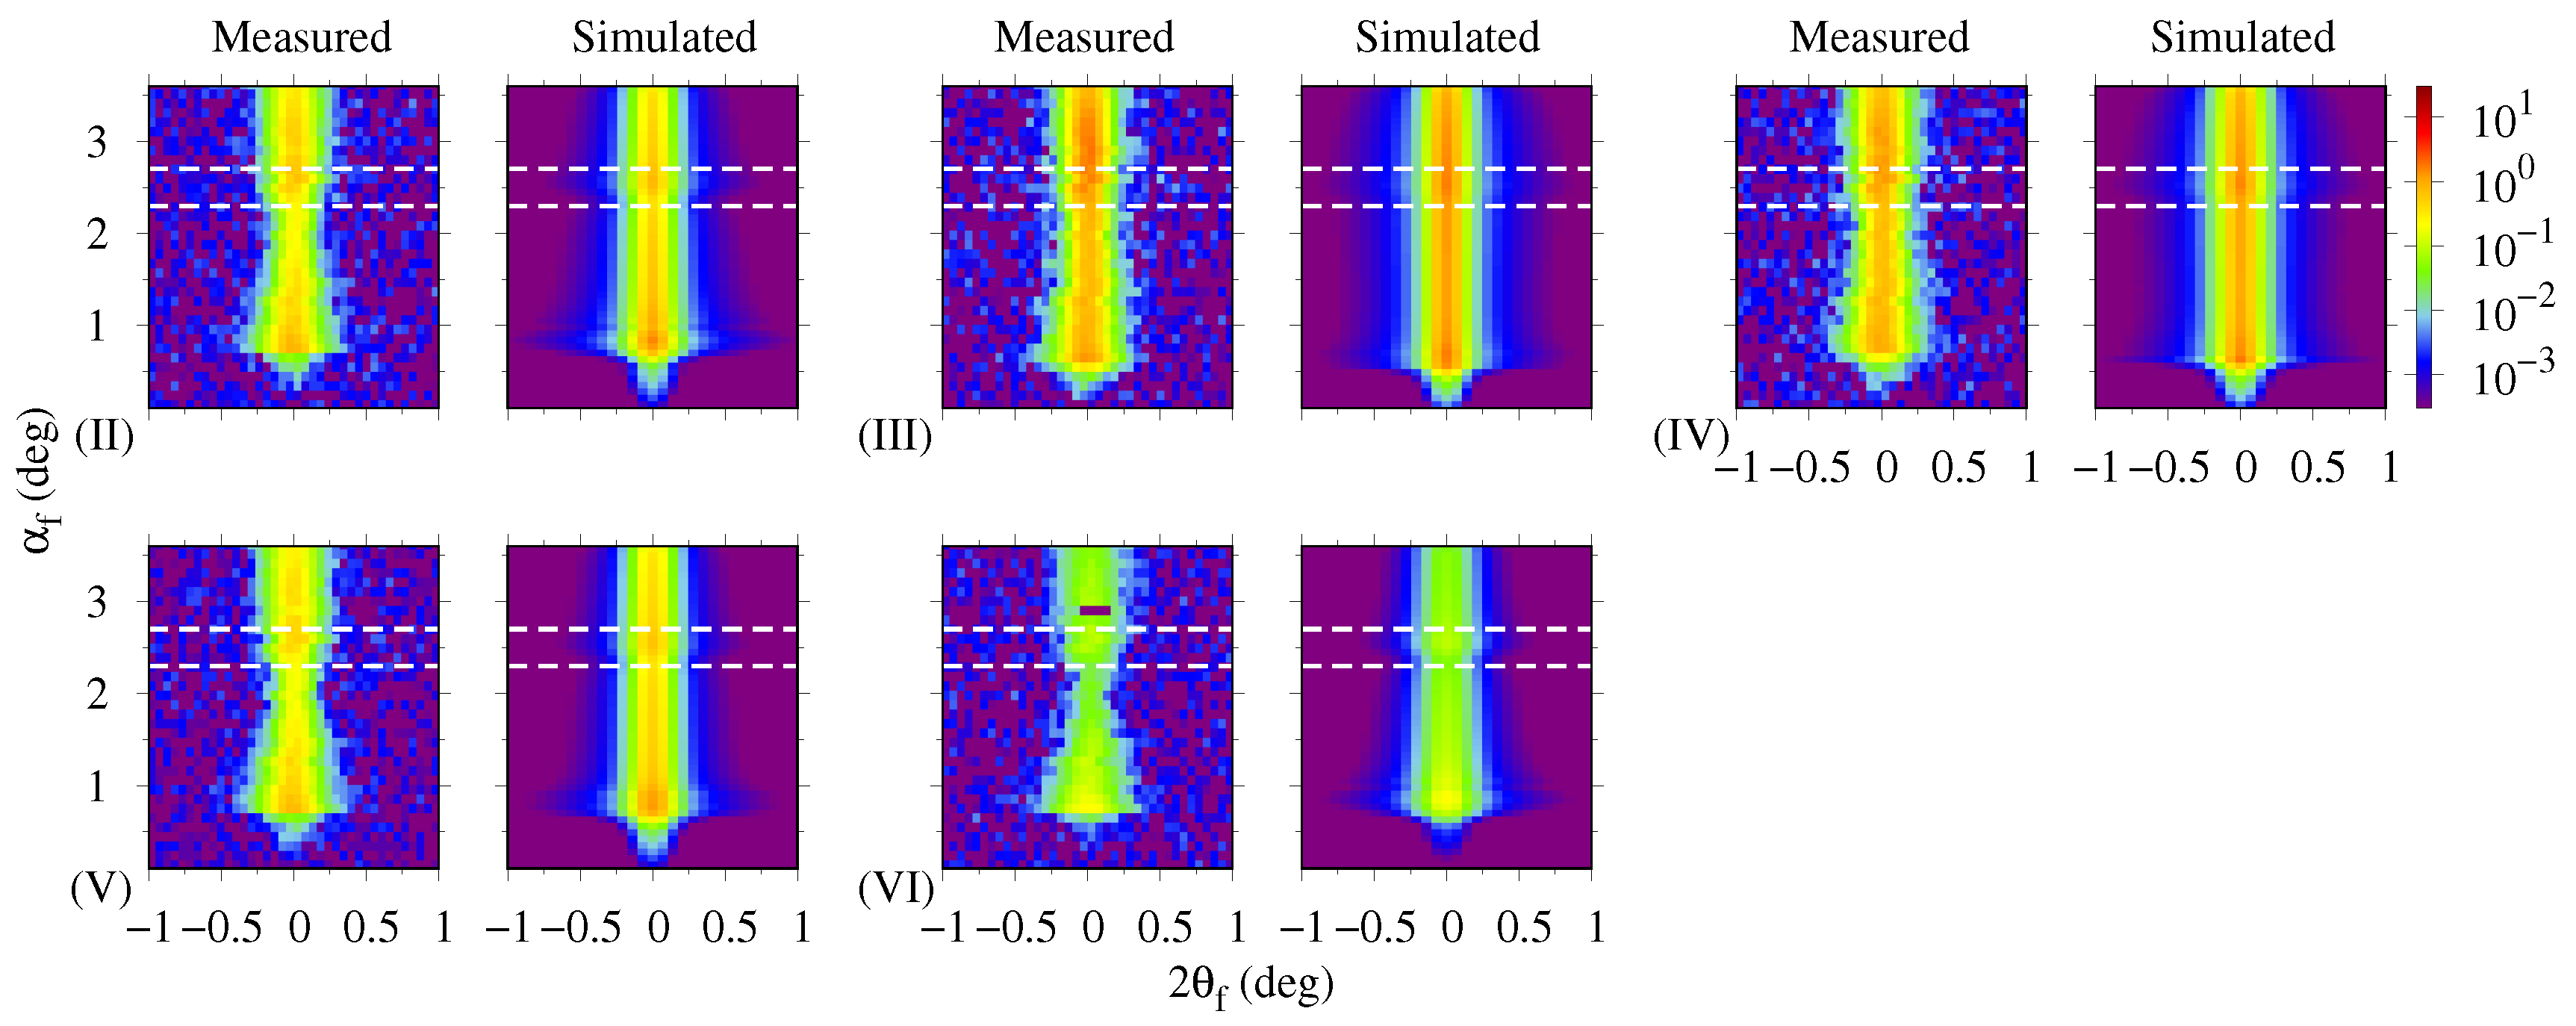
The polarized GISANS measurement was performed to determine the lateral correlation lengths of the magnetic scattering precisely because the GISANS had a length scale smaller than the OSS. The field applied to the sample was varied in the same way as the OSS measurement described in Section 3.2. The local maximum of the magnetic scattering at α f = 1.7 ( 2.48 ) of the I + channel in Figure 4, resulting from the large modulus of the Fresnel coefficients at the first Bragg condition, was aimed at in the GISANS measurement. The incident angle was chosen as α i = 2.0 ( 2.91 ) . Hence, the local maximum of the magnetic scattering, the target of the measurement, can be separated from the contamination due to the polarization inefficiency of the roughness scattering at α f = 1.3 ( 1.89 ) and specular reflection at α f = 2.0 ( 2.91 ). The values in the parentheses were the angles corrected for a wavelength of 0.80 nm resulting from the different values of the wavelength between the OSS and GISANS measurements. Figure 6 shows the measured and simulated GISANS images ( I + channel). The intensity of the magnetic scattering increased with decreasing net magnetization, which was consistent with the result of the OSS measurement. The values of ( Δ Φ ) 2 given by the OSS were more reliable than those obtained by the GISANS because the polarization of the incident and scattered neutrons was higher for the OSS setup.
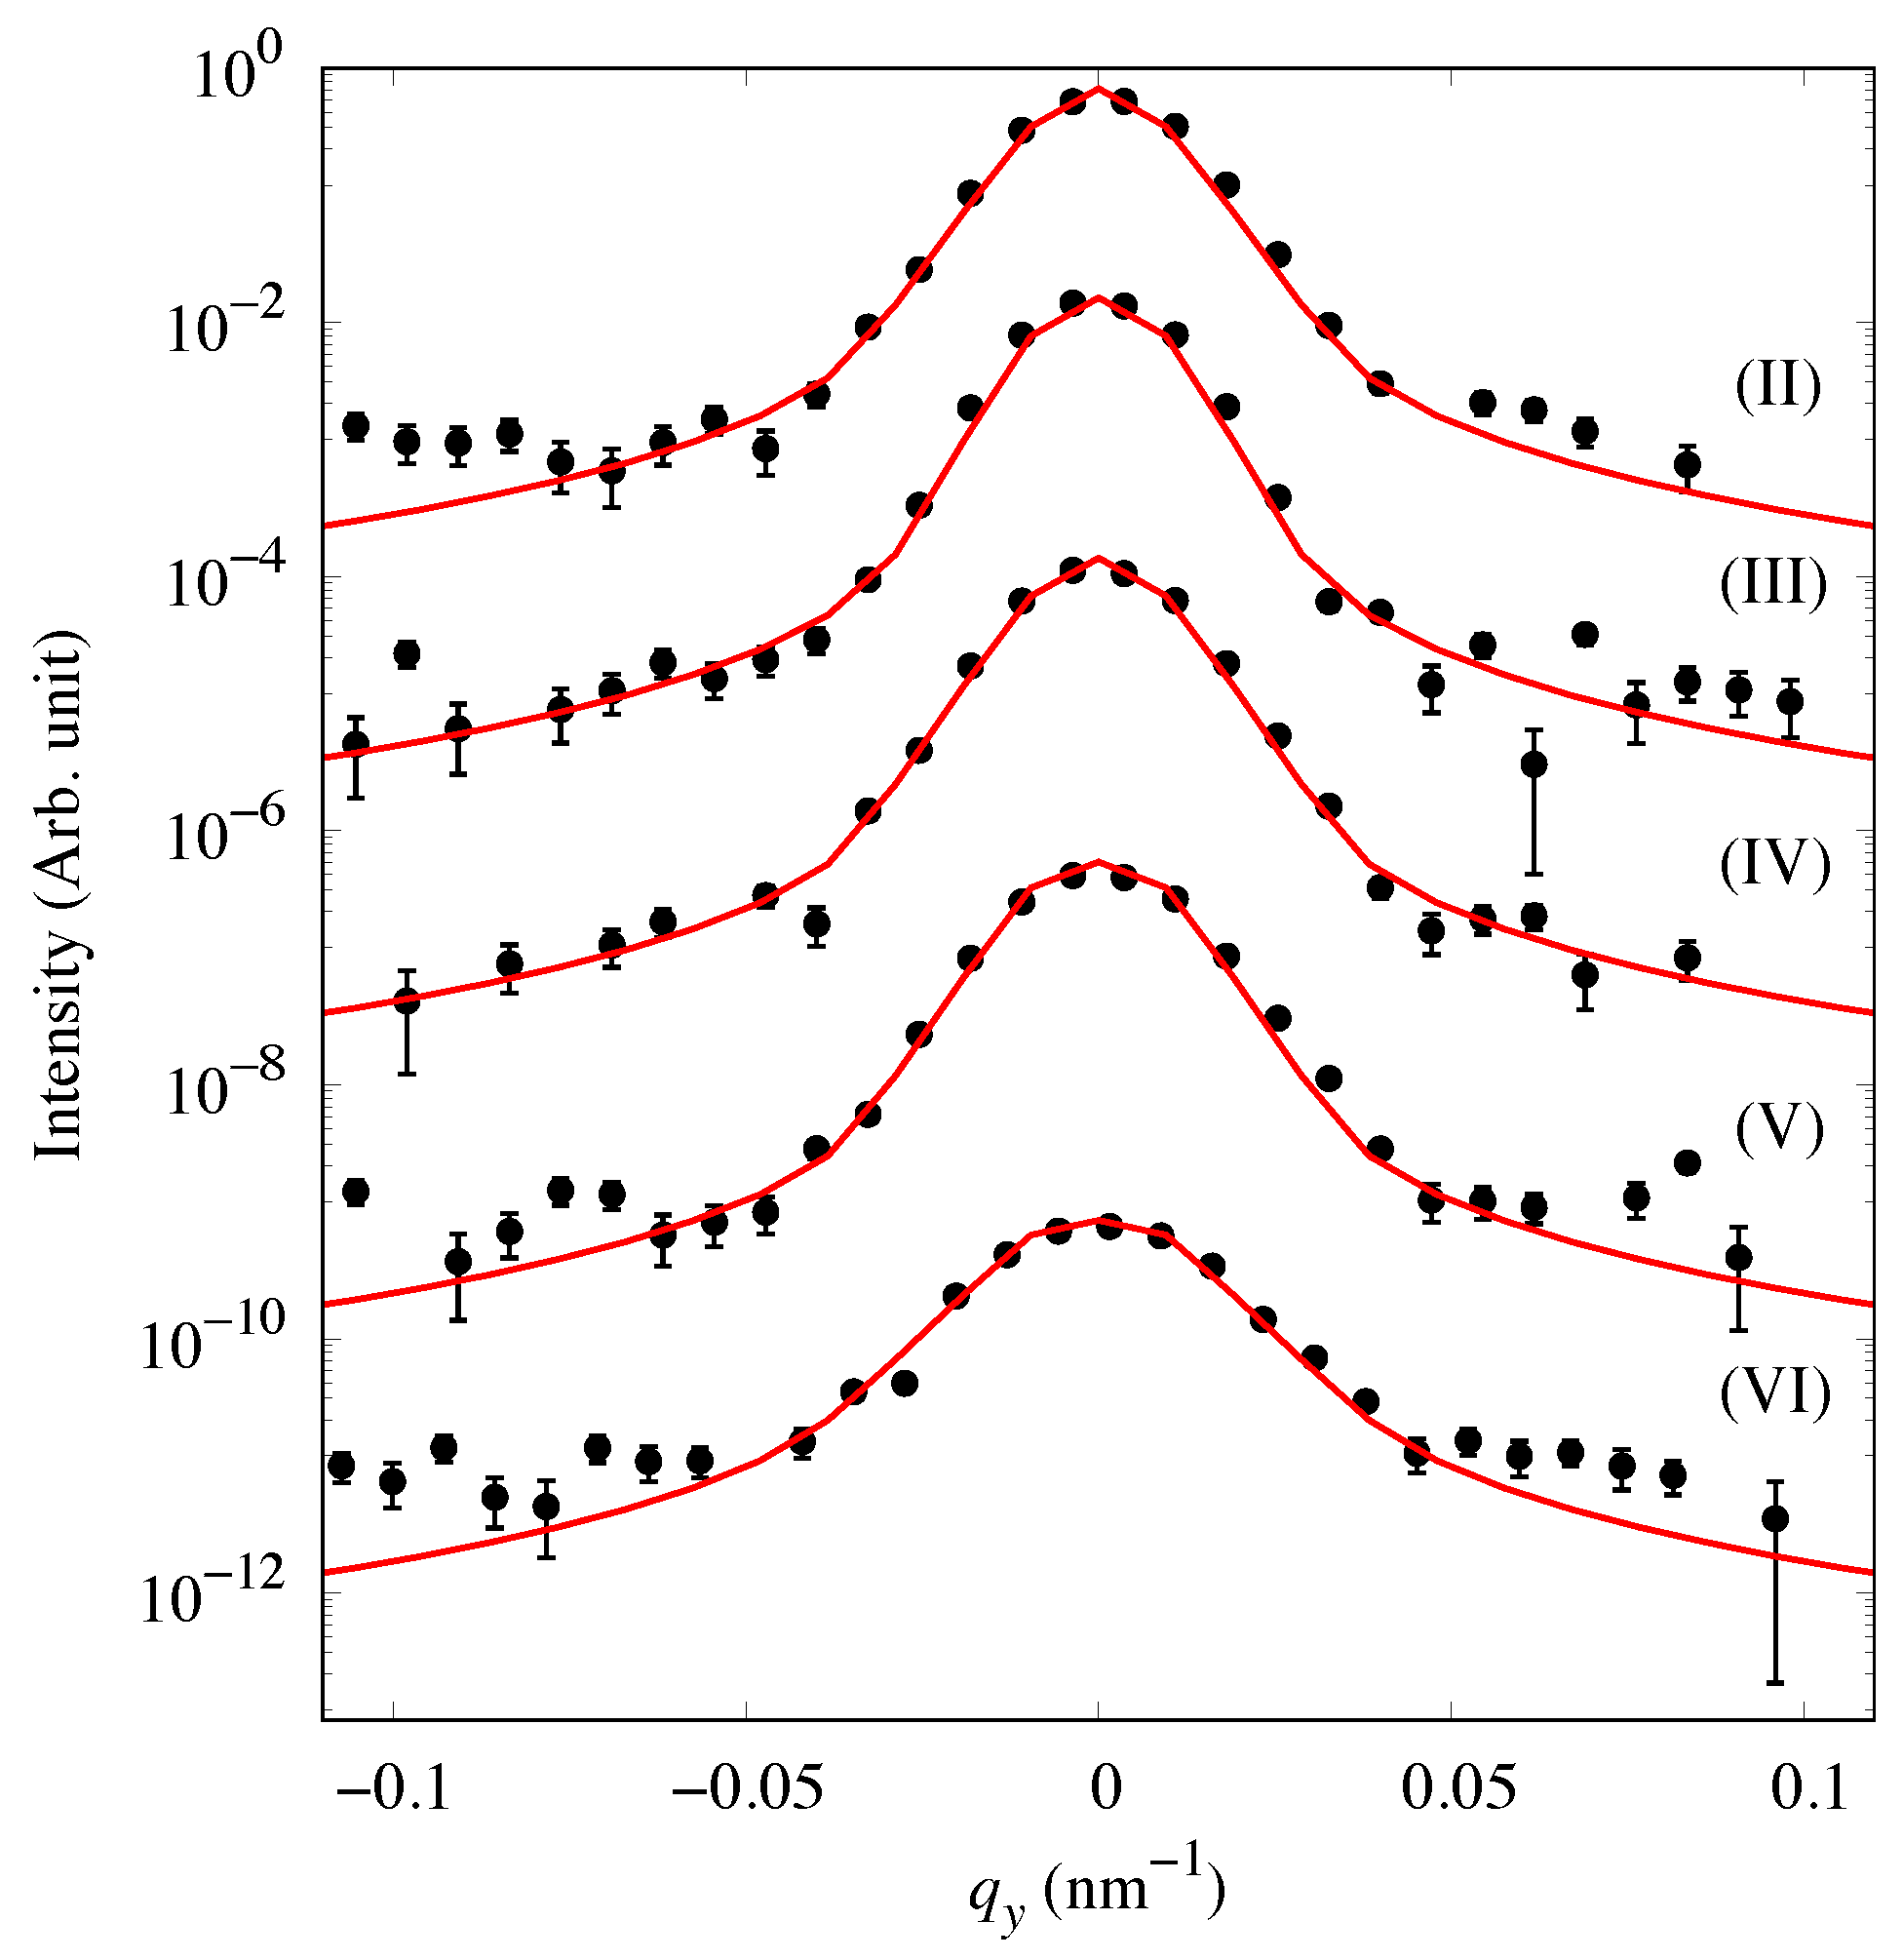
Figure 7 shows the measured and simulated profiles along q y ( 2 θ f ) where the intensity was summed in the α f direction from 2.3– 2.7 . The lateral correlation length of the magnetic scattering was estimated as ξ m y = 425 ± 50 , 550 ± 50 , 500 ± 50 , 500 ± 50 , and 250 ± 50 for (II)–(VI), respectively. These values considerably differed from those determined by the OSS. This can be attributed to the difference in the accessible length scale between the OSS and GISANS [43]. In addition, ξ m y was determined without ambiguity because the intensity profile in q y did not depend on the Fresnel coefficients [22]. Hence, the values obtained by the GISANS were more reliable than those in the OSS. The in-plane length of the coupled area was not significantly varied during the process of demagnetization and remagnetization even though it was analyzed as smaller at (II) and (VI), close to saturation.

4. Discussion

The in-plane Fe grain size of the sample was determined by the X-ray diffraction measurement to be D = 8.2 ± 0.1 nm as shown in Figure 2b in [22]. In a nanocrystalline layered system, the magnetic properties can be explained by the random anisotropy model. This model was proposed for amorphous magnets [4] and extended to magnetic nanocrystalline alloys [5,44]. When the grains size was reduced to be smaller than the ferromagnetic exchange length (≈20 nm for Fe), a large number of grains were ferromagnetically coupled by the exchange interaction between neighboring moments. The magneto-crystalline anisotropies K 1 in each grain that were randomly oriented within the sample plane were averaged over the length scale of the coupled areas. According to the two-dimensional random anisotropy model [45,46], H c and μ i are written as,
H c = p c K M s p c K 1 2 D 2 M s A
μ i = p μ M s 2 μ 0 K p μ M s 2 A μ 0 K 1 2 D 2 ,
where K is the average magneto-crystalline anisotropies, A is the exchange stiffness, μ 0 is the permeability of the vacuum, and p c and p μ are dimensionless pre-factors close to unity. Comparison of the measured H c and μ i shown in Figure 2 with those calculated by Equations (1) and (2), using the parameters of K 1 = 4.8 × 10 4 J/m 3 and A = 1.49 × 10 11 J/m [47,48], resulted in p c = 0.69 and p μ = 0.19 . Meanwhile, the three-dimensional random anisotropy model failed to explain the measured result because the obtained values of p c = 1.4 × 10 1 and p μ = 9.1 × 10 3 , according to Equations (5a) and (5b) in [45], indicated that our system was magnetically too hard. Hence, our system was in good agreement with the two-dimensional random anisotropy model where a large number of grains were coupled within the sample plane.
The measured polarized OSS and GISANS data were successfully analyzed by the simulation based on the DWBA where the coupled areas were modeled as rectangular boxes and the orientation of moments were assumed to follow a Gaussian distribution. The analyzed result showed that moments were correlated only in the in-plane direction and that the lateral correlation length of the magnetic scattering ranging from 250–550 nm for (II)–(VI) was much larger than the in-plane grain size. This meant that the in-plane length of the coupled area was 0.5–1.1 μ m, not significantly varied during the demagnetization and remagnetization process. This was a quite different behavior from the bulk because the in-plane length of the coupled areas would increase with increasing field strength as a result of the movement of domain walls if the magnetic properties of our system behaved like in the bulk. Instead, the measured result was consistent with the two-dimensional random anisotropy model where coherent magnetization rotation was dominant. Assuming that the in-plane length of the coupled areas had a distribution, moments in the small coupled areas were relatively easy to demagnetize and hard to remagnetize compared with the large ones because K decreased with the increasing number of grains in the coupled area. This explains the small values of the lateral correlation length of the magnetic scattering for (II) and (VI), corresponding to the beginning of demagnetization and the end of remagnetization, and the maximum value for (III), immediately after the external field was reversed.
The obtained result showed that the magnetic properties of our system can be understood by the two-dimensional random anisotropy model where coherent magnetization rotation is dominant. According to this model, smaller grain size and uniform uniaxial anisotropy lead to further improvement of the magnetic properties in terms of softness. Further study is needed to establish a method to control the grain size and uniform uniaxial anisotropy such as magneto-elastic anisotropies.

5. Conclusions

We performed the polarized OSS and GISANS measurements for the Fe/Si multilayer composed of polycrystalline grains smaller than the ferromagnetic exchange length to understand what was responsible for the magnetic properties different from the bulk. The measured data were analyzed by simulation using the DWBA where the areas with uniform orientation of moments were assumed as rectangular boxes. The analysis with the DWBA reasonably explained the measured data. The result of the analysis indicated that a large number of grains form the ferromagnetically-coupled area within the sample plane. The in-plane length of the coupled areas was analyzed as 0.5–1.1 μ m, not significantly varied during the process of demagnetization and remagnetization. The obtained result, together with the measured values of H c and μ i , suggested that our system was interpreted by the two-dimensional random anisotropy model where the coherent magnetization rotation was dominant. A comprehensive understanding of the magnetic properties of layered systems would be obtained if one investigates samples with a broader range of the grain size.

Author Contributions

Conceptualization, R.M. and T.B.; methodology, R.M., T.B., T.S., and D.H.; formal analysis, R.M., T.S., and D.H.; investigation, R.M., T.B., T.S., and D.H.; writing, original draft preparation, R.M.; writing, review and editing, T.S.; project administration and supervision, R.M., T.B., P.C. and K.S.

Funding

This research was supported in part by JSPS KAKENHI Grant Number 19K12647.

Acknowledgments

The authors thank the ILL for providing the beam time and support (doi:https://dx.doi.org/10.5291/ILL-DATA.5-54-225). R.M. thanks the staff of the neutron optics group of the ILL for the sample preparation and support for the polarized neutron scattering measurement using the 3 He cell. The magnetic hysteresis measurement was performed by using a SQUID magnetometer at the Comprehensive Research Organization for Science and Society (CROSS) user laboratories. The technical assistance for the hysteresis measurement provided by M. Ishikado (CROSS) is gratefully acknowledged.

Conflicts of Interest

The authors declare no conflict of interest.

References

  1. Grünberg, P.; Schreiber, R.; Pang, Y. Layered magnetic structures: Evidence for antiferromagnetic coupling of Fe layers across Cr interlayers. Phys. Rev. Lett. 1986, 57, 2442–2445. [Google Scholar] [CrossRef] [PubMed]
  2. Baibich, M.N.; Broto, J.M.; Fert, A.; Nguyen Van Dau, F.; Pertroff, F.; Etienne, P.; Creuzet, G.; Friederich, A.; Chazelas, J. Giant Magnetoresistance of (001)Fe/(001)Cr magnetic superlattices. Phys. Rev. Lett. 1988, 61, 2472–2475. [Google Scholar] [CrossRef] [PubMed]
  3. Binasch, G.; Grünberg, P.; Saurenbach, F.; Zinn, W. Enhanced magnetoresistance in layered magnetic structures with antiferromagnetic interlayer exchange. Phys. Rev. B 1989, 39, 4828–4830. [Google Scholar] [CrossRef] [PubMed] [Green Version]
  4. Alben, R.; Becker, J.J.; Chi, M.C. Random anisotropy in amorphous ferromagnets. J. Appl. Phys. 1978, 49, 1653–1658. [Google Scholar] [CrossRef]
  5. Herzer, G. Nanocrystalline soft magnetic materials. J. Magn. Magn. Mater. 1992, 112, 258–262. [Google Scholar] [CrossRef]
  6. Herzer, G. Anisotropies in soft magnetic nanocrystalline alloys. J. Magn. Magn. Mater. 2005, 294, 99–106. [Google Scholar] [CrossRef]
  7. Turchin, V.F. Diffraction of slow neutrons by stratified systems. At. Energy 1967, 22, 124–125. [Google Scholar] [CrossRef]
  8. Mezei, F. Novel polarized neutron devices: Supermirror ans spin component amplifier. Commun. Phys. 1976, 1, 81–85. [Google Scholar]
  9. Schärpf, O. Recent advances with supermirror polarizers. AIP Conf. Proc. 1982, 89, 182. [Google Scholar]
  10. Majkrzak, C.F.; Passell, L. Multilayer thin films as polarizing monochromators for neutrons. Acta Crystallogr. Sect. A 1985, 41, 41–48. [Google Scholar] [CrossRef]
  11. Mezei, F. Very high reflectivity supermirrors and their applications. Proc. SPIE 1988, 983, 10. [Google Scholar]
  12. Majkrzak, C.F.; Nunez, V.; Copley, J.R.D.; Ankner, J.F.; Greene, G.L. Supermirror transmission polarizers for neutrons. Proc. SPIE 1992, 1738, 90. [Google Scholar]
  13. Böni, P.; Clemens, D.; Senthil Kumar, M.; Pappas, C. Applications of remanent supermirror polarizers. Phys. B Condens. Matter 1999, 267–268, 320–327. [Google Scholar] [CrossRef]
  14. Høghøj, P.; Anderson, I.; Siebrecht, R.; Graff, W.; Ben-Saidane, K. Neutron polarizing Fe/Si mirrors at ILL. Phys. B Condens. Matter 1999, 267–268, 355–359. [Google Scholar] [CrossRef]
  15. Hino, M.; Hayashida, H.; Kitaguchi, M.; Kawabata, Y.; Takeda, M.; Maruyama, R.; Ebisawa, T.; Torikai, N.; Kume, T.; Tasaki, S. Development of large-m polarizing neutron supermirror fabricated by using ion beam sputtering instrument at KURRI. Phys. B Condens. Matter 2006, 385–386, 1187–1189. [Google Scholar] [CrossRef]
  16. Maruyama, R.; Yamazaki, D.; Okayasu, S.; Takeda, M.; Zettsu, N.; Nagano, M.; Yamamura, K.; Hayashida, H.; Soyama, K. Effect of Si interlayers on the magnetic and mechanical properties of Fe/Ge neutron-polarizing multilayer mirrors. J. Appl. Phys. 2012, 111, 063904. [Google Scholar] [CrossRef]
  17. Syromyatnikov, V.; Toperverg, B.; Deriglazov, V.; Schebetov, A.; Ebel, T.; Kampmann, R.; Wagner, R. Non-specular polarized neutron scattering from rough interfaces in periodic multilayered magnetic structures. Phys. B Condens. Matter 1997, 234–236, 475–476. [Google Scholar] [CrossRef]
  18. Syromyatnikov, V.G.; Menelle, A.; Toperverg, B.P.; Soroko, Z.N.; Schebetov, A.F. Off-specular polarised neutron scattering from rough interfaces in Co/Ti and Fe/Al multilayered structures. Phys. B Condens. Matter 1999, 267–268, 190–193. [Google Scholar] [CrossRef]
  19. Syromyatnikov, V.G.; Toperverg, B.P.; Siebrecht, R.; Menelle, A.; Pleshanov, N.K.; Pusenkov, V.M.; Schebetov, A.F.; Soroko, Z.N.; Ul’yanov, V.A. Observation of peculiarities in magnetic off-specular polarized neutron scattering from rough interfaces in Co/Ti periodic multilayer. Phys. B Condens. Matter 2000, 276–278, 700–701. [Google Scholar] [CrossRef]
  20. Kentzinger, E.; Rücker, U.; Toperverg, B.; Ott, F.; Brückel, T. Depth-resolved investigation of the lateral magnetic correlations in a gradient nanocrystalline multilayer. Phys. Rev. B 2008, 77, 104435. [Google Scholar] [CrossRef] [Green Version]
  21. Paul, A.; Teichert, A.; Krist, T.; Steitz, R. Substrate-stress-induced magnetic and nonmagnetic structural correlations in Fe/Si multilayers. J. Appl. Crystallogr. 2015, 48, 1023–1033. [Google Scholar] [CrossRef]
  22. Maruyama, R.; Bigault, T.; Wildes, A.R.; Dewhurst, C.D.; Soyama, K.; Courtois, P. Study of the in-plane magnetic structure of a layered system using polarized neutron scattering under grazing incidence geometry. Nucl. Instrum. Methods Phys. Res. A 2016, 819, 37–53. [Google Scholar] [CrossRef]
  23. Cubitt, R.; Fragneto, G. D17: The new reflectometer at the ILL. Appl. Phys. A 2002, 74 (Suppl. 1), S329–S331. [Google Scholar] [CrossRef]
  24. Saerbeck, T.; Cubitt, R.; Wildes, A.; Manzin, G.; Andersen, K.H.; Gutfreund, P. Recent upgrades of the neutron reflectometer D17 at ILL. J. Appl. Crystallogr. 2018, 51, 249–256. [Google Scholar] [CrossRef]
  25. Andersen, K.H.; Cubitt, R.; Humblot, H.; Jullien, D.; Petoukhov, A.; Tasset, F.; Schanzer, C.; Shah, V.R.; Wildes, A.R. The 3He polarizing filter on the neutron reflectometer D17. Phys. B Condens. Matter 2006, 385–386, 1134–1137. [Google Scholar] [CrossRef]
  26. Dewhurst, C.D. D33-a third small-angle neutron scattering instrument at the Institut Laue Langevin. Meas. Sci. Technol. 2008, 19, 034007. [Google Scholar] [CrossRef]
  27. Dewhurst, C.D. Modelling of wavelength cut-off filters and polarising mirrors in a neutron guide. Nucl. Instr. Meth. Phys. Res. A 2012, 683, 16–23. [Google Scholar] [CrossRef]
  28. Ankner, J.F.; Majkrzak, C.F.; Homma, H. Magnetic dead layer in Fe/Si multilayer: Profile refinement of polarized neutron reflectivity data. J. Appl. Phys. 1993, 73, 6436–6437. [Google Scholar] [CrossRef]
  29. Cubitt, R.; Saerbeck, T.; Campbell, R.A.; Barker, R.; Gutfreund, P. An improved algorithm for reducing reflectometry data involving divergent beams or non-flat samples. J. Appl. Crystallogr. 2015, 48, 2006–2011. [Google Scholar] [CrossRef]
  30. Björck, M.; Andersson, G. GenX: An extensible X-ray reflectivity refinement program utilizing differential evolution. J. Appl. Crystallogr. 2007, 40, 1174–1178. [Google Scholar] [CrossRef]
  31. Björck, M. Fitting with differential evolution: An introduction and evaluation. J. Appl. Crystallogr. 2011, 44, 1198–1204. [Google Scholar] [CrossRef]
  32. Parratt, L.G. Surface studies of solids by total reflection of X-rays. Phys. Rev. 1954, 95, 359–369. [Google Scholar] [CrossRef]
  33. Majkrzak, C.F.; Axe, J.D.; Böni, P. Magnetic structure of multiple bilayers of thin films of Fe and Ge. J. Appl. Phys. 1985, 57, 3657–3659. [Google Scholar] [CrossRef]
  34. Dufour, C.; Bruson, A.; George, B.; Marchal, G.; Mangin, P. Polarized neutron study of Fe/Si multilayers. Solid State Commun. 1989, 69, 963–968. [Google Scholar] [CrossRef]
  35. Boher, P.; Houdy, P.; Monkenbusch, M.; Penfold, J.; Eastoe, J.; Smith, D.J. RF-sputtered Fe/Ge multilayers for neutron polarizing monochromators. Proc. SPIE 1992, 1738, 176–189. [Google Scholar]
  36. Fullerton, E.E.; Mattson, J.E.; Lee, S.R.; Sowers, C.H.; Huang, Y.Y.; Felcher, G.; Bader, S.D. Non-oscillatory antiferromagnetic coupling in sputtered Fe/Si superlattices. J. Magn. Magn. Mater. 1992, 117, L301–L306. [Google Scholar] [CrossRef]
  37. Maruyama, R.; Yamazaki, D.; Akutsu, K.; Hanashima, T.; Miyata, N.; Aoki, H.; Takeda, M.; Soyama, K. Development of high-polarization Fe/Ge neutron-polarizing supermirror: Possibility of fine-tuning of scattering length density in ion beam sputtering. Nucl. Instrum. Methods Phys. Res. A 2018, 888, 70–78. [Google Scholar] [CrossRef]
  38. Zabel, H.; Theris-Bröhl, K.; Toperverg, B.P. Polarized neutron reflectivity and scattering from magnetic nanostructures and spintronic materials. In Handbook of Magnetism and Advanced Magnetic Materials; Kronmüller, H., Parkin, S., Eds.; John Wiely & Sons, Ltd.: Chichester, UK, 2007; pp. 1237–1307. [Google Scholar]
  39. Toperverg, B.P. Off-specular polarized neutron scattering from magnetic fluctuations in thin films and multilayers. Appl. Phys. A 2002, 74 (Suppl. 1), S1560–S1562. [Google Scholar] [CrossRef]
  40. Kentzinger, E.; Rücker, U.; Toperverg, B.; Brückel, T. Determination of the magnetic fluctuations in an Fe/Cr/Fe trilayer exhibiting a neutron resonance state. Phys. B Condens. Matter 2003, 335, 89–94. [Google Scholar] [CrossRef]
  41. Holý, V.; Baumbach, T. Nonspecular X-ray reflection from rough multilayers. Phys. Rev. B 1994, 49, 10668–10676. [Google Scholar] [CrossRef]
  42. Renaud, G.; Lazzari, R.; Leroy, F. Probing surface and interface morphology with grazing incidence small angle X-ray scattering. Surf. Sci. Rep. 2009, 64, 255–380. [Google Scholar] [CrossRef]
  43. Maruyama, R.; Bigault, T.; Wildes, A.R.; Dewhurst, C.D.; Saerbeck, T.; Honecker, D.; Yamazaki, D.; Soyama, K.; Courtois, P. Accessible length scale of the in-plane structure in polarized neutron off-specular and grazing-incidence small-angle scattering measurements. J. Phys. Conf. Ser. 2017, 862, 012017. [Google Scholar] [CrossRef] [Green Version]
  44. Herzer, G. Nanocrystalline soft magnetic alloys. In Handbook of Magnetic Materials; Buschow, K.H.J., Ed.; Elsevier: Amsterdam, The Netherlands, 1997; pp. 415–462. [Google Scholar]
  45. Herzer, G. Grain size dependence of coercivity and permeability in nanocrystalline ferromagnets. IEEE Trans. Magn. 1990, 26, 1397–1402. [Google Scholar] [CrossRef]
  46. Herzer, G. Magnetization process in nanocrystalline ferromagnetets. Mater. Sci. Eng. A 1991, 133, 1–5. [Google Scholar] [CrossRef]
  47. Cullity, B.D.; Graham, C.D. Introduction to Magnetic Materials; John Wiley & Sons: Hoboken, NJ, USA, 2005. [Google Scholar]
  48. Chikazumi, S. Physics of Magnetism; John Wiley & Sons: New York, NY, USA, 1964. [Google Scholar]
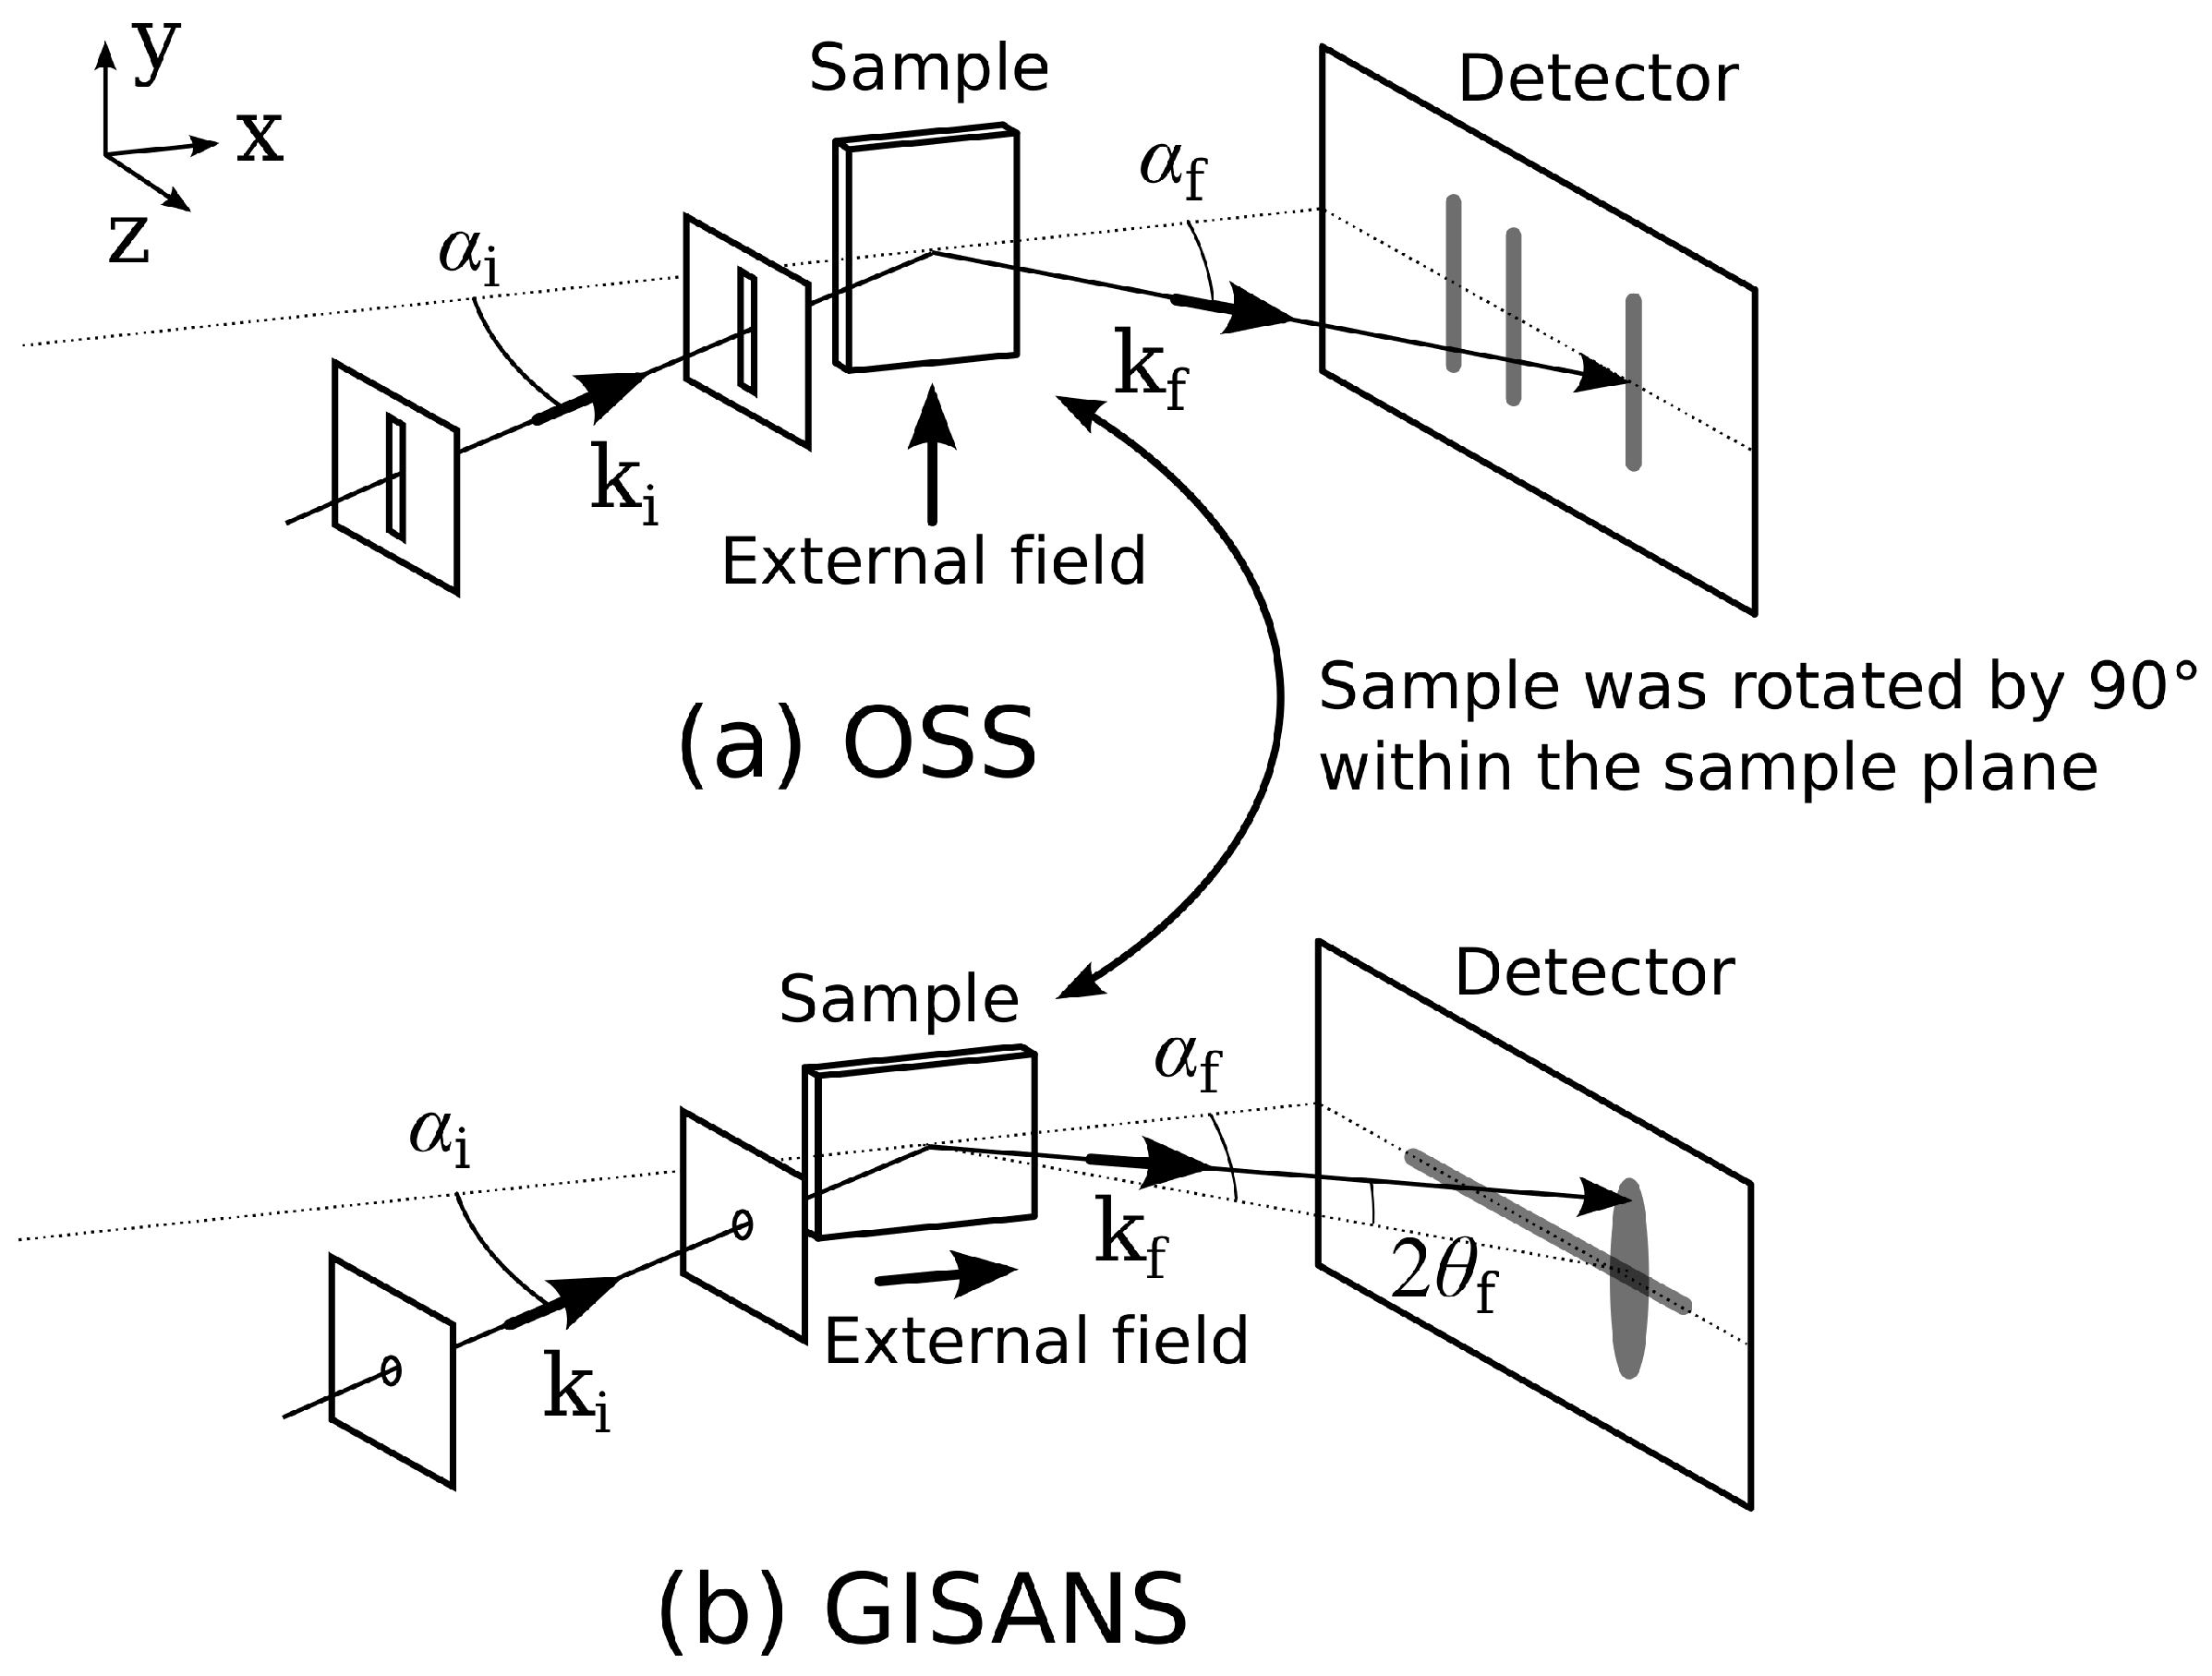
Figure 1. Scattering geometry of the off-specular neutron scattering (OSS) (a) and grazing-incidence small-angle neutron scattering (GISANS) (b) measurements. The external field was applied to the y- and x-axes in the OSS and GISANS, respectively. The sample was rotated by 90 within the sample plane between the OSS and GISANS to ensure that the same structure was observed.
Crystals 09 00383 g001
Figure 2. Measured hysteresis curve of the Fe/Si multilayer. Red circles (I)–(VI) indicate the conditions chosen for the polarized OSS and GISANS measurements. The applied field was varied along the red arrows.
Crystals 09 00383 g002
Figure 3. Polarized neutron reflectivity profiles of the Fe/Si multilayer. (I)–(VI) correspond to the measured conditions shown in Figure 2. R + + and R are shown in red and blue. The symbols and lines indicate the measured and fitted reflectivities, respectively. Each profile is shifted vertically by four orders of magnitude relative to the profile for the immediately previous field for clarity.
Crystals 09 00383 g003
Figure 4. Polarized OSS images of the Fe/Si multilayer. (I)–(VI) correspond to the measured conditions shown in Figure 2.
Crystals 09 00383 g004
Figure 5. Measured (plots) and simulated (lines) OSS profiles along the condition of α i + α f = 2.5 ( q z 0.50 nm 1 ) in the I + channel. (II)–(VI) correspond to the measured conditions shown in Figure 2. Each profile is shifted vertically by two orders of magnitude relative to the profile for the immediately previous field for clarity.
Crystals 09 00383 g005
Figure 6. Polarized GISANS images of the Fe/Si multilayer ( I + channel). (II)–(VI) correspond to the measured conditions shown in Figure 2.
Crystals 09 00383 g006
Figure 7. Measured (plots) and simulated (lines) GISANS profiles where the intensity was summed in the α f direction between the broken lines ( 2.3 α f 2.7 ) in Figure 6. (II)–(VI) correspond to the measured conditions shown in Figure 2. Each profile is shifted vertically by two orders of magnitude relative to the profile for the immediately previous field for clarity.
Crystals 09 00383 g007
Table 1. Structural parameters of the sample given by the fitting to the polarized neutron reflectivities. Fe 1 and Fe 2 : “Magnetically-dead” layers just above and below the middle Fe layer. SLD, scattering length density.
LayersThicknessRoughnessNuclear SLDMagnetic SLD
(nm)(nm)( × 10 2 fm/nm 3 )( × 10 2 fm/nm 3 )
Si 4.80 ± 0.2 0.52 ± 0.3 2.89 ± 0.4
Fe 1 0.66 ± 0.2 0.65 ± 0.3 6.95 ± 0.6
Fe 3.65 ± 0.3 7.96 ± 0.6 (I) 4.95 ± 0.4 , (II) 4.36 ± 0.4 , (III) 3.27 ± 0.3 ,
(IV) 1.71 ± 0.2 , (V) 2.11 ± 0.2 , (VI) 4.87 ± 0.4
Fe 2 0.59 ± 0.2 7.88 ± 0.6