Article

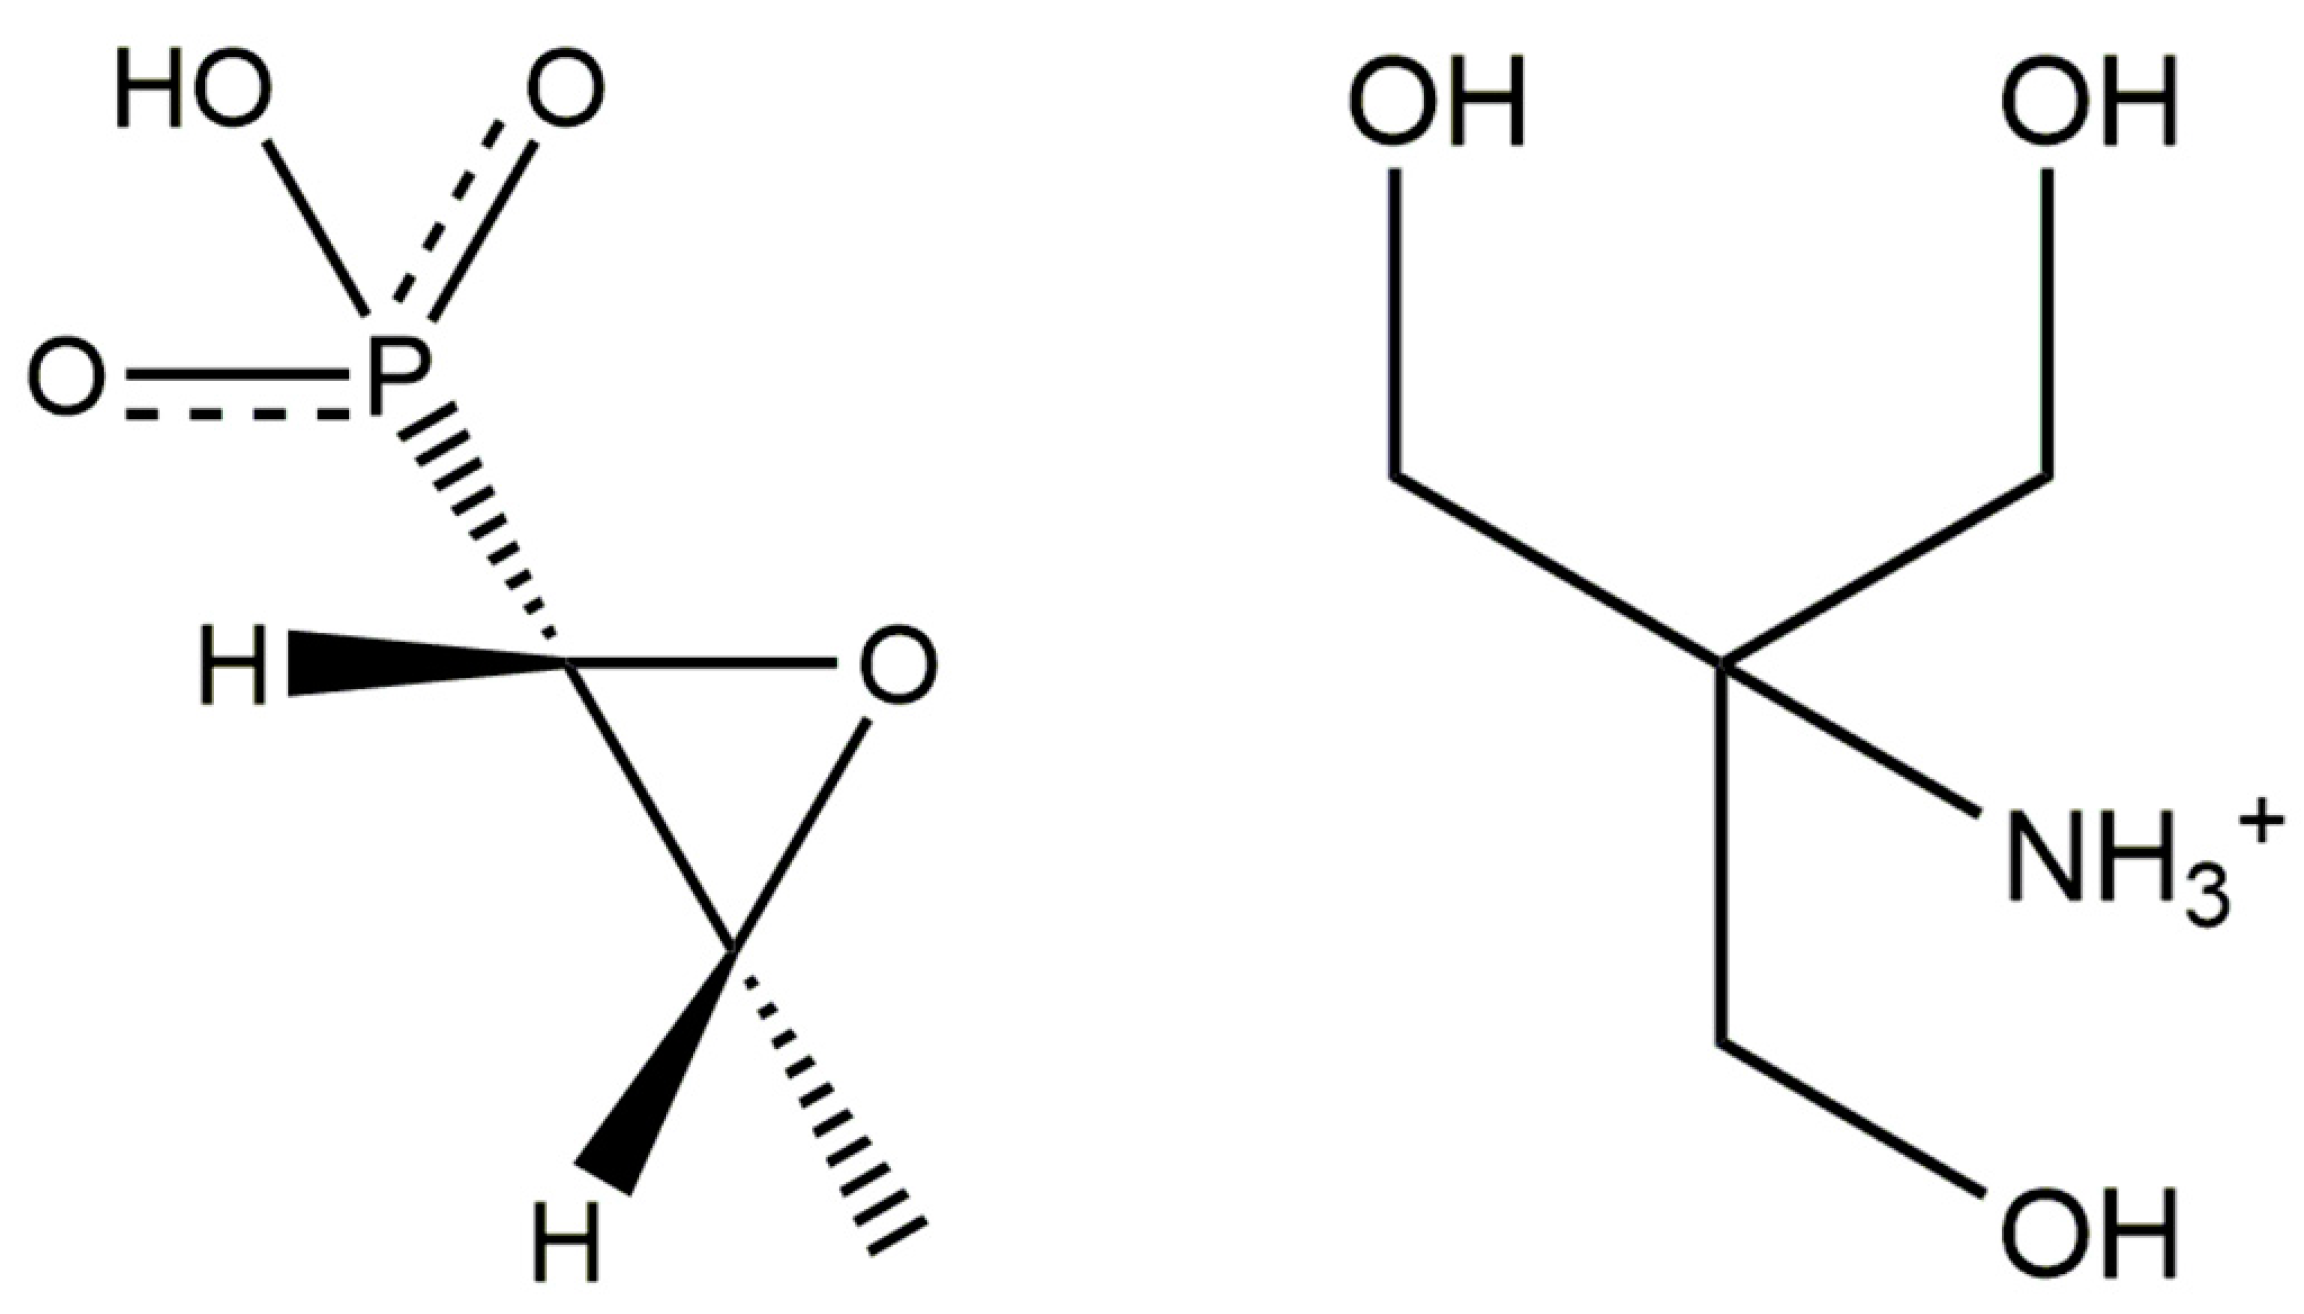
Crystal Structure of Fosfomycin Tromethamine, (C4H12NO3)(C3H6O4P), from Synchrotron Powder Diffraction Data and Density Functional Theory

1
Chemistry Department, North Central College, Naperville, IL 60540, USA
2
Chemistry Department, Illinois Institute of Technology, Chicago, IL 60616, USA
3
Database Department, International Centre for Diffraction Data, Newtown Square, PA 19073, USA
*
Author to whom correspondence should be addressed.
Crystals 2019, 9(8), 384; https://doi.org/10.3390/cryst9080384
Submission received: 17 June 2019 / Revised: 14 July 2019 / Accepted: 19 July 2019 / Published: 26 July 2019
(This article belongs to the Special Issue Crystal Structure Characterization by Powder Diffraction)

Abstract

:
The crystal structure of fosfomycin tromethamine has been solved and refined using synchrotron X-ray powder diffraction data, and optimized using density functional techniques. Fosfomycin tromethamine crystallizes in space group P1 (#1) with a = 6.20421(6), b = 9.00072(7), c = 10.91257(15) Å, α = 93.4645(5), β = 101.9734(3), γ = 99.9183(2)°, V = 584.285(2) Å3, and Z = 2. A network of discrete hydrogen bonds links the cations and anions into layers parallel to the ab-plane. The outer surfaces of the layers are composed of the methyloxirane rings of the anions and the methylene groups of the cations. Furthermore, 93% of the atoms are consistent with an additional (pseudo)center of symmetry. The powder pattern has been submitted to ICDD® for inclusion in the Powder Diffraction File™.

1. Introduction

Fosfomycin is a broad-spectrum antibiotic produced by certain Streptomyces species, and can also be made synthetically. Fosfomycin was discovered in a joint research project of Merck & Co. and Compañia Española de Penicilina y Antibióticos (CEPA). CEPA began producing fosfomycin on a commercial scale in 1971 (http://www.ercros.es/internas.asp?arxiu=qh_aranjuezh). The tromethamine salt of fosfomycin is sold under the brand name Monurol®, prescribed to treat bacterial bladder infections, including acute cystitis or lower urinary tract infections in women. The IUPAC name (CAS Registry number 78964-85-9) is [1,3-dihydroxy-2-(hydroxymethyl)propan-2-yl]azanium;hydroxy-[(2R,3S)-3-methyloxiran-2-yl]phosphinate. A two-dimensional molecular diagram is shown in Figure 1.
The powder diffraction data for fosfomycin tromethamine have been reported by Huang et al. [1], however, no crystal structure information was reported. This work was carried out as part of a project [2] to determine the crystal structures of large-volume commercial pharmaceuticals, and include high-quality powder diffraction data for these pharmaceuticals in the Powder Diffraction File [3].

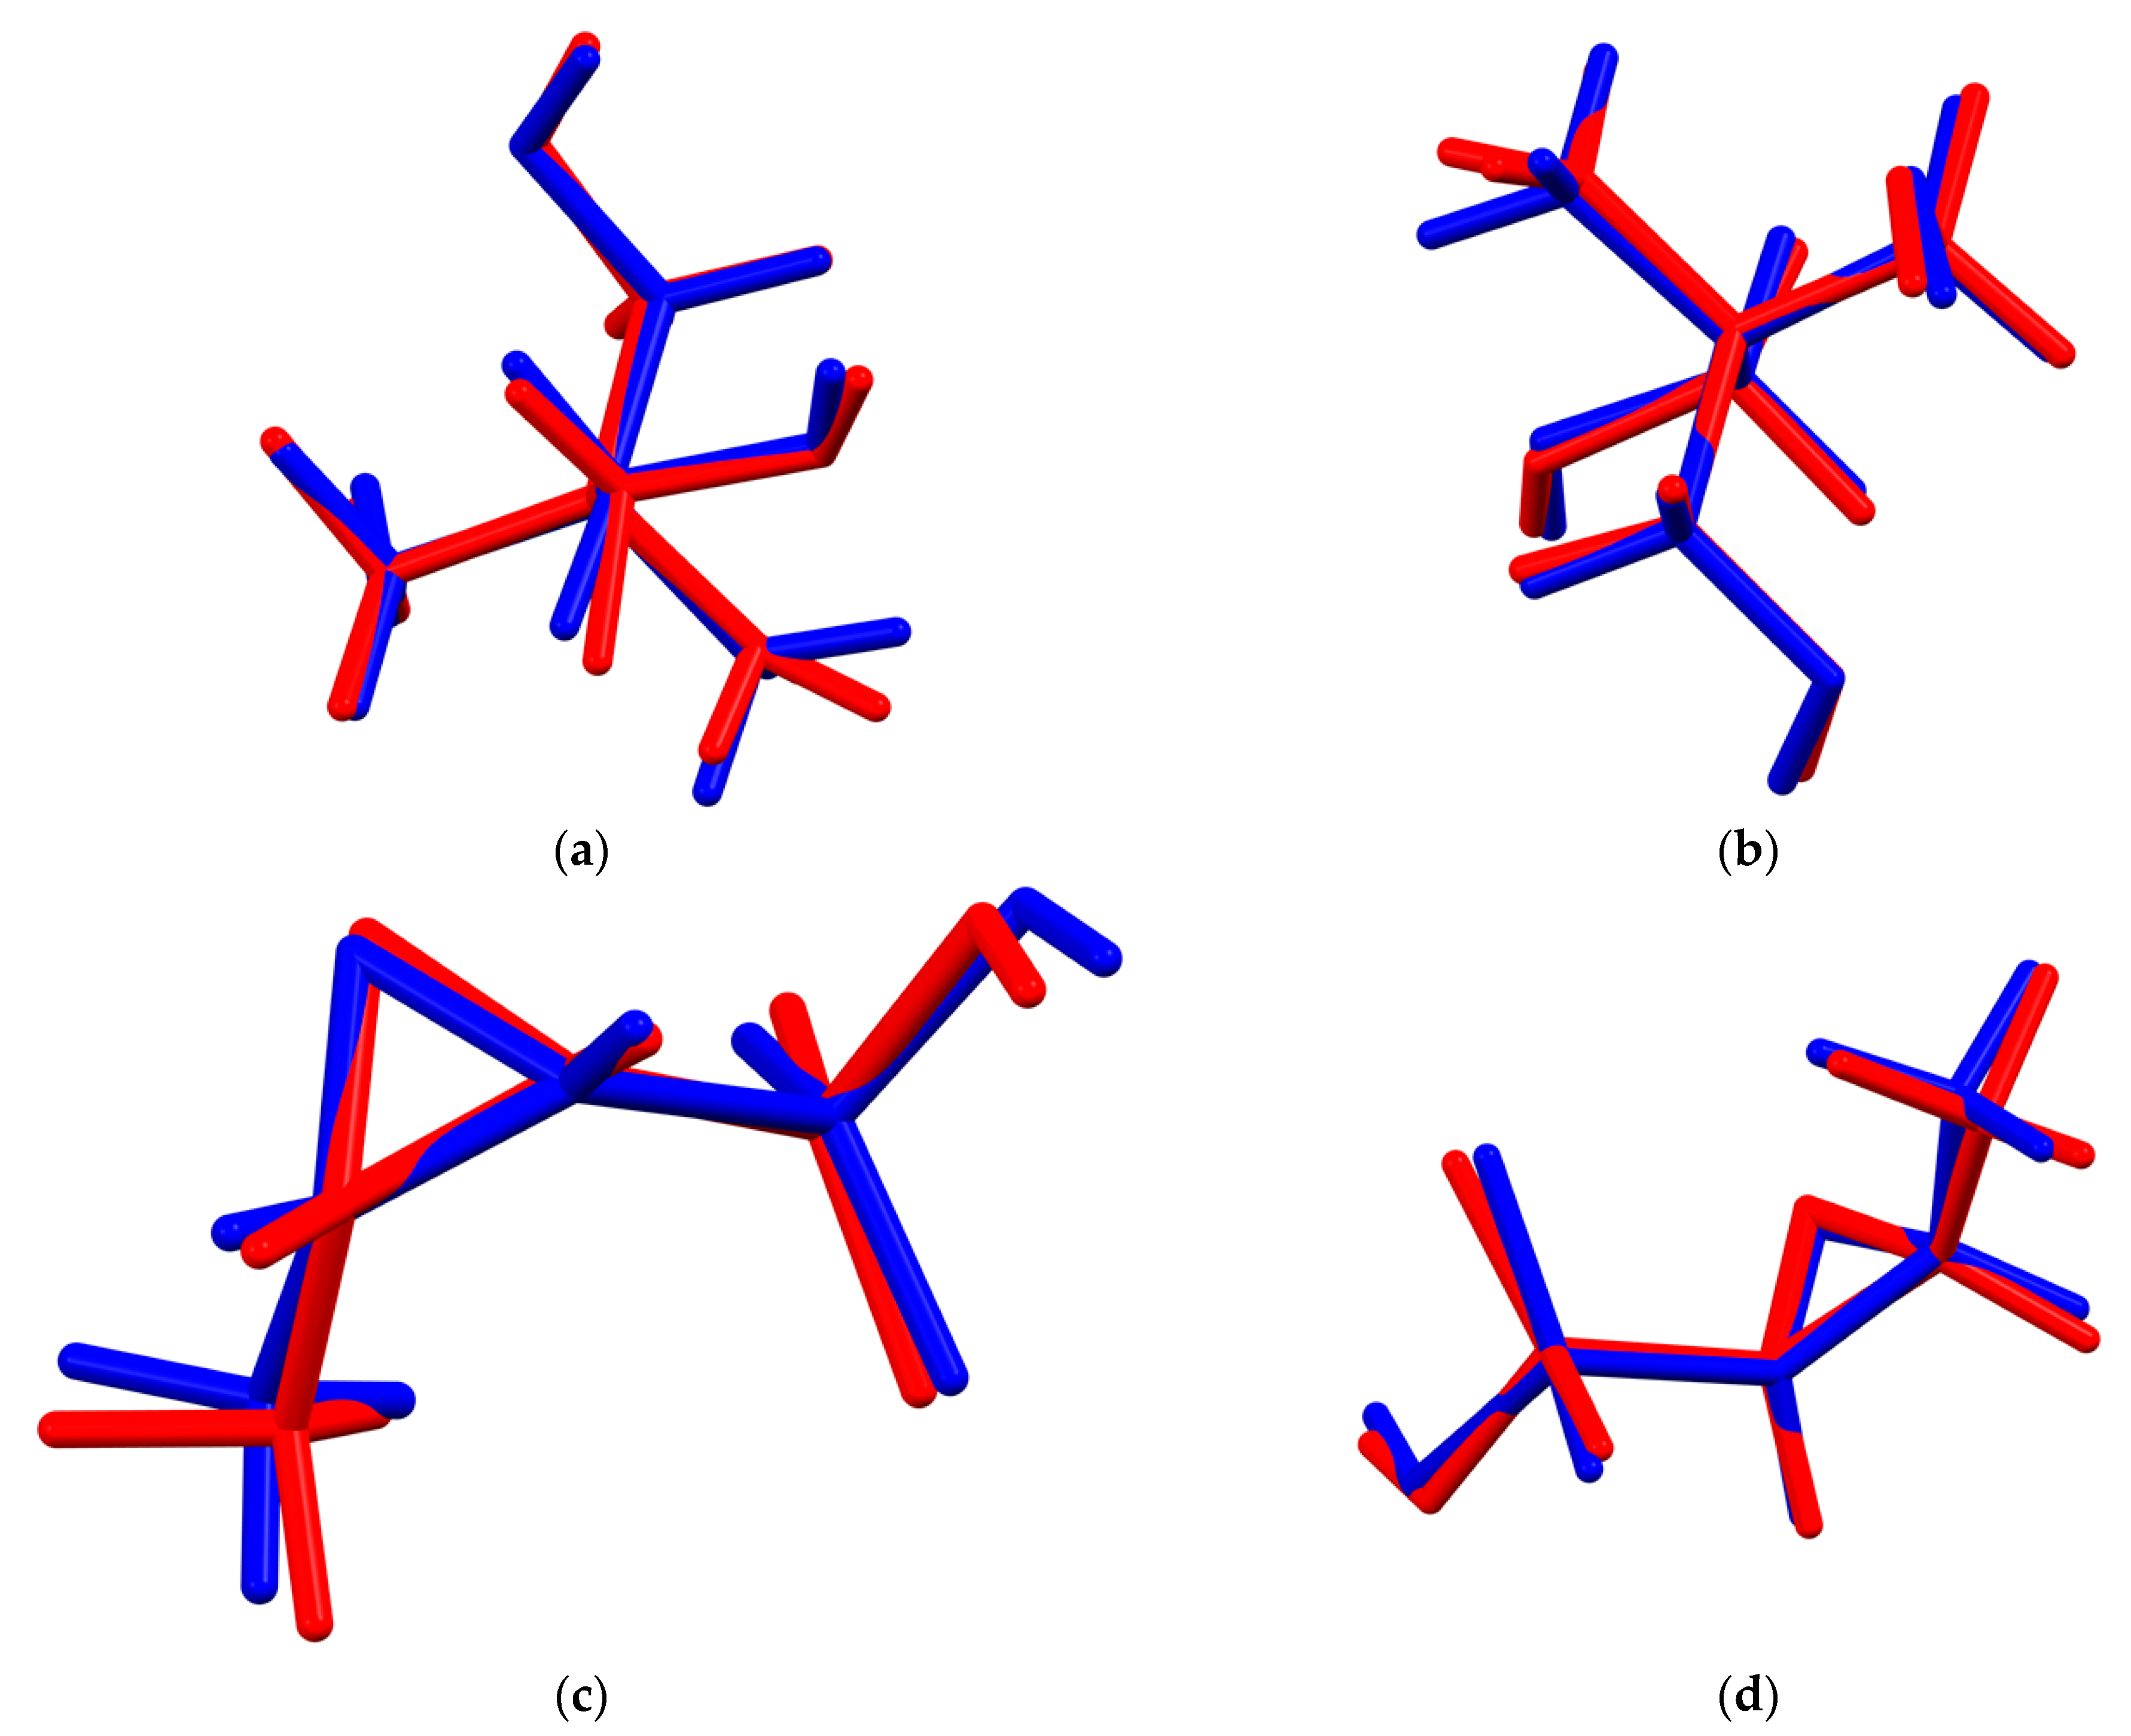
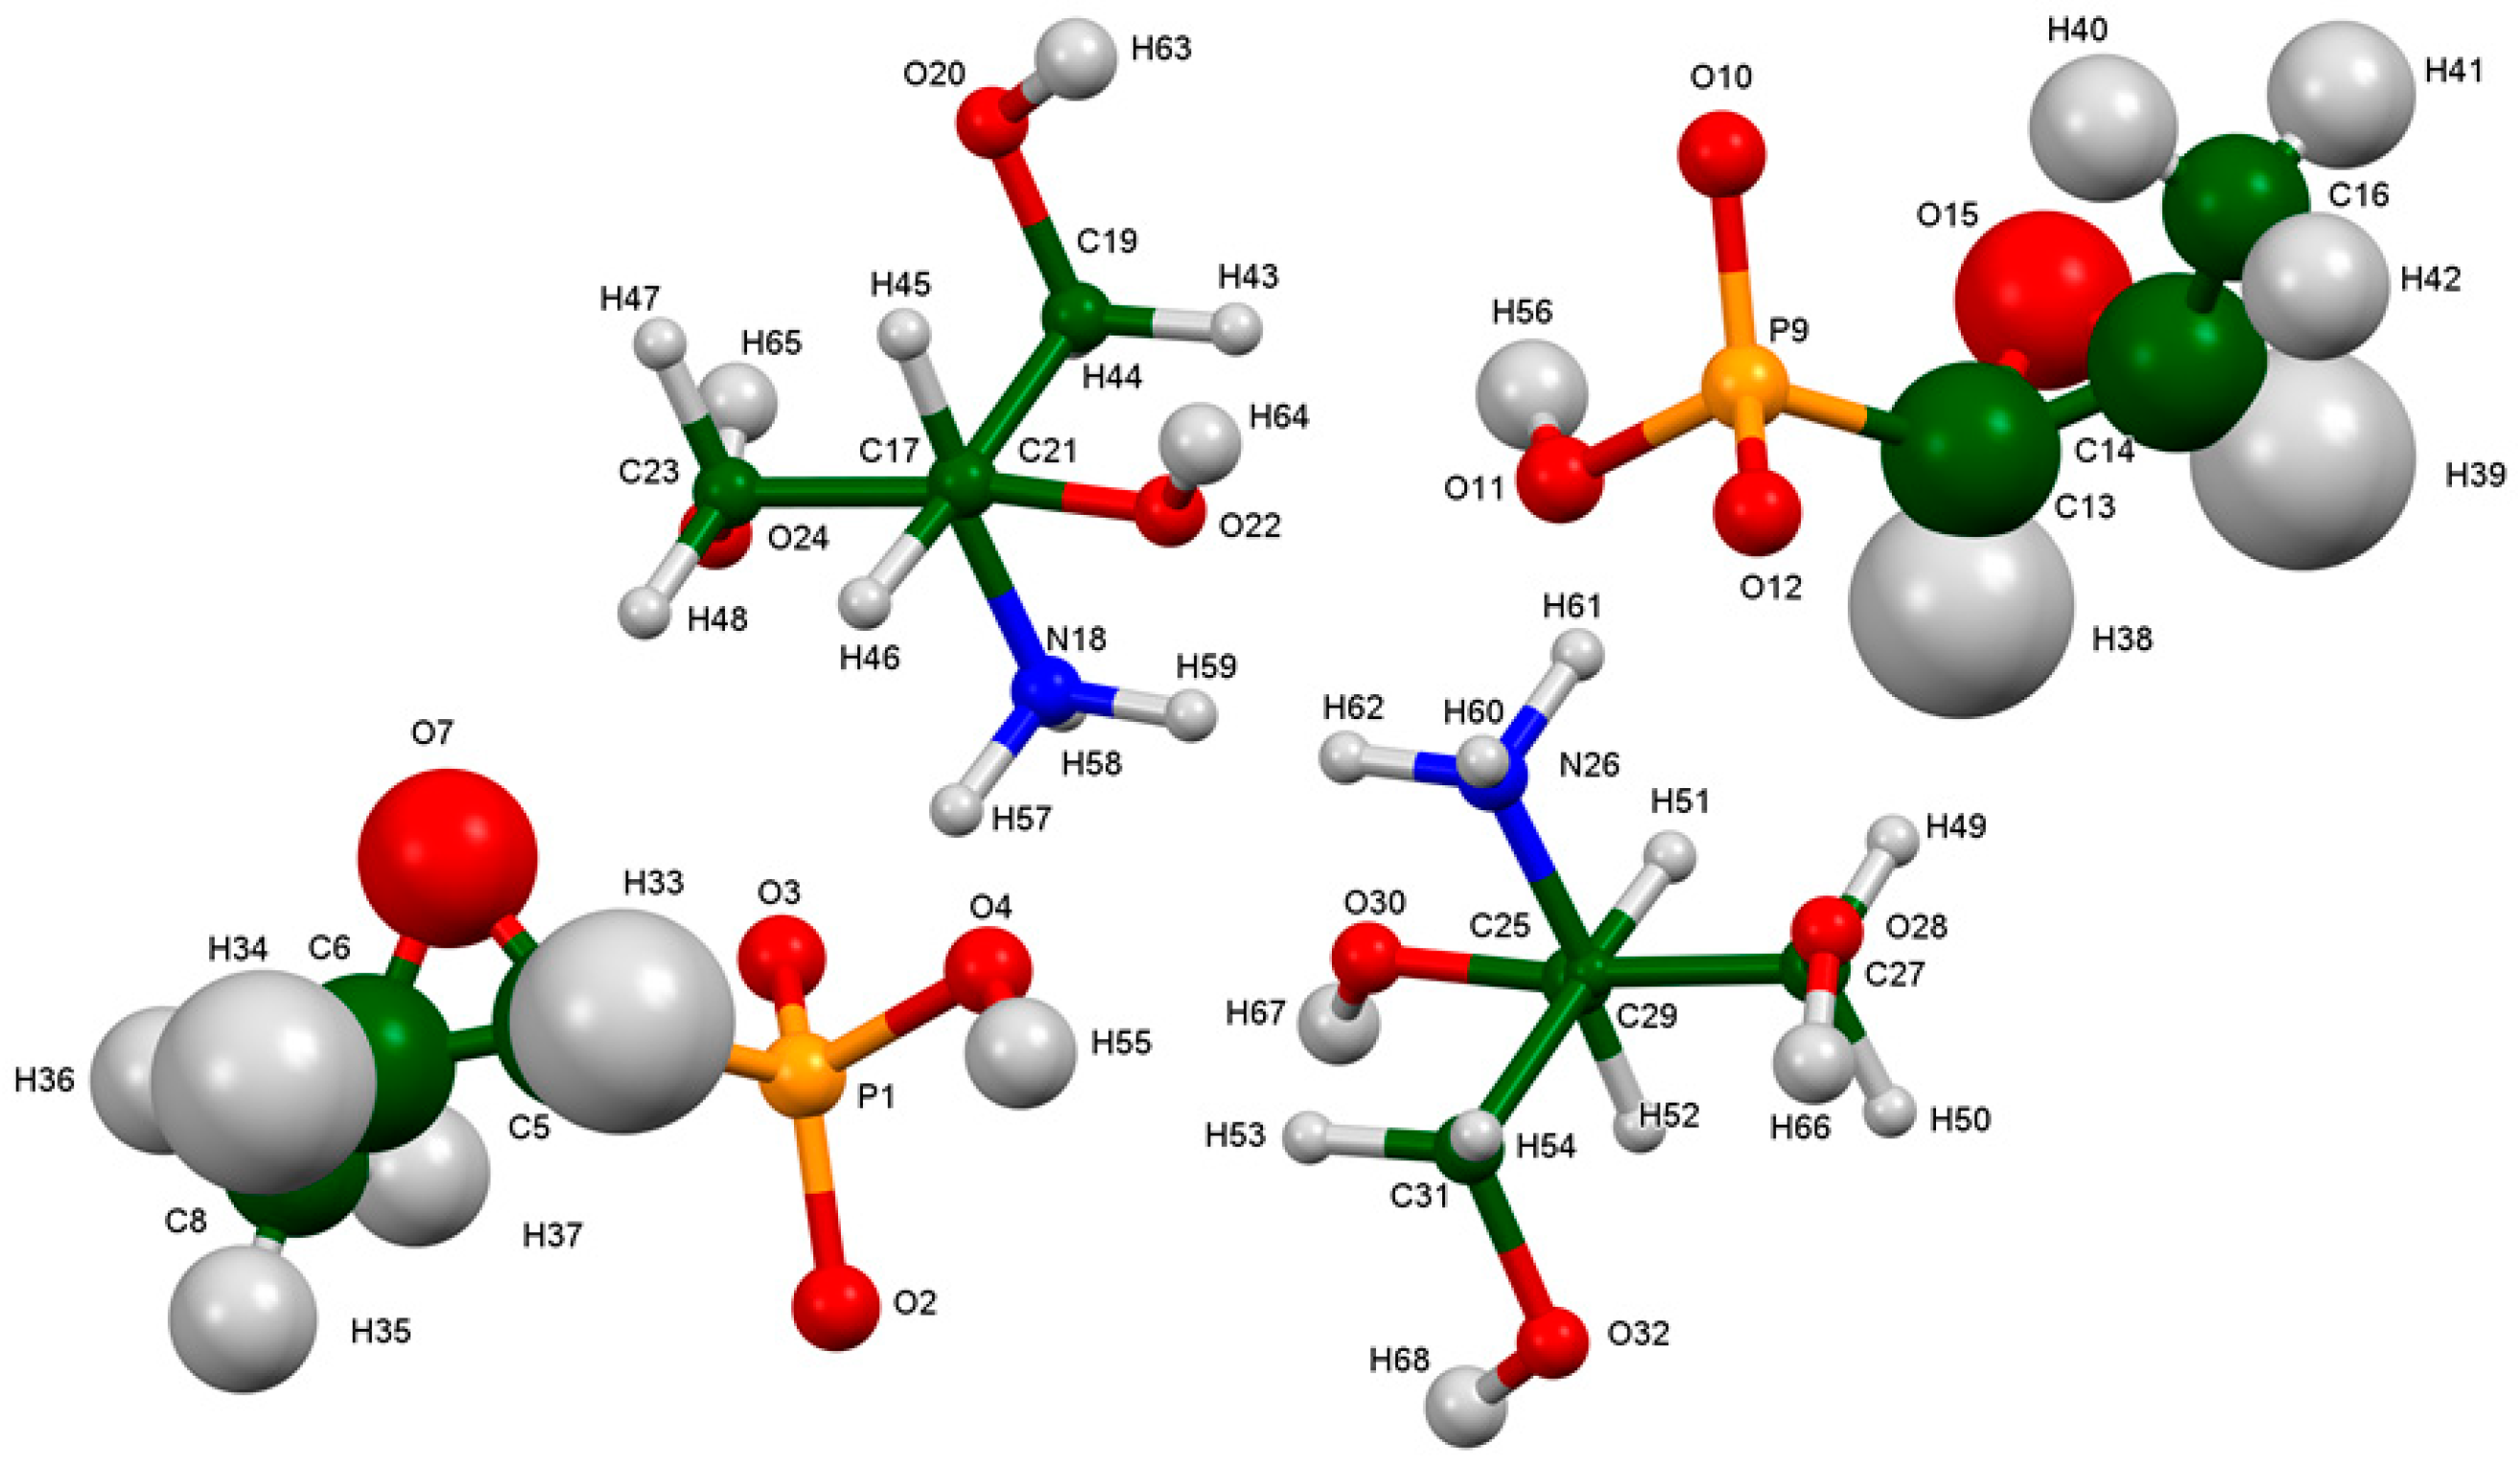
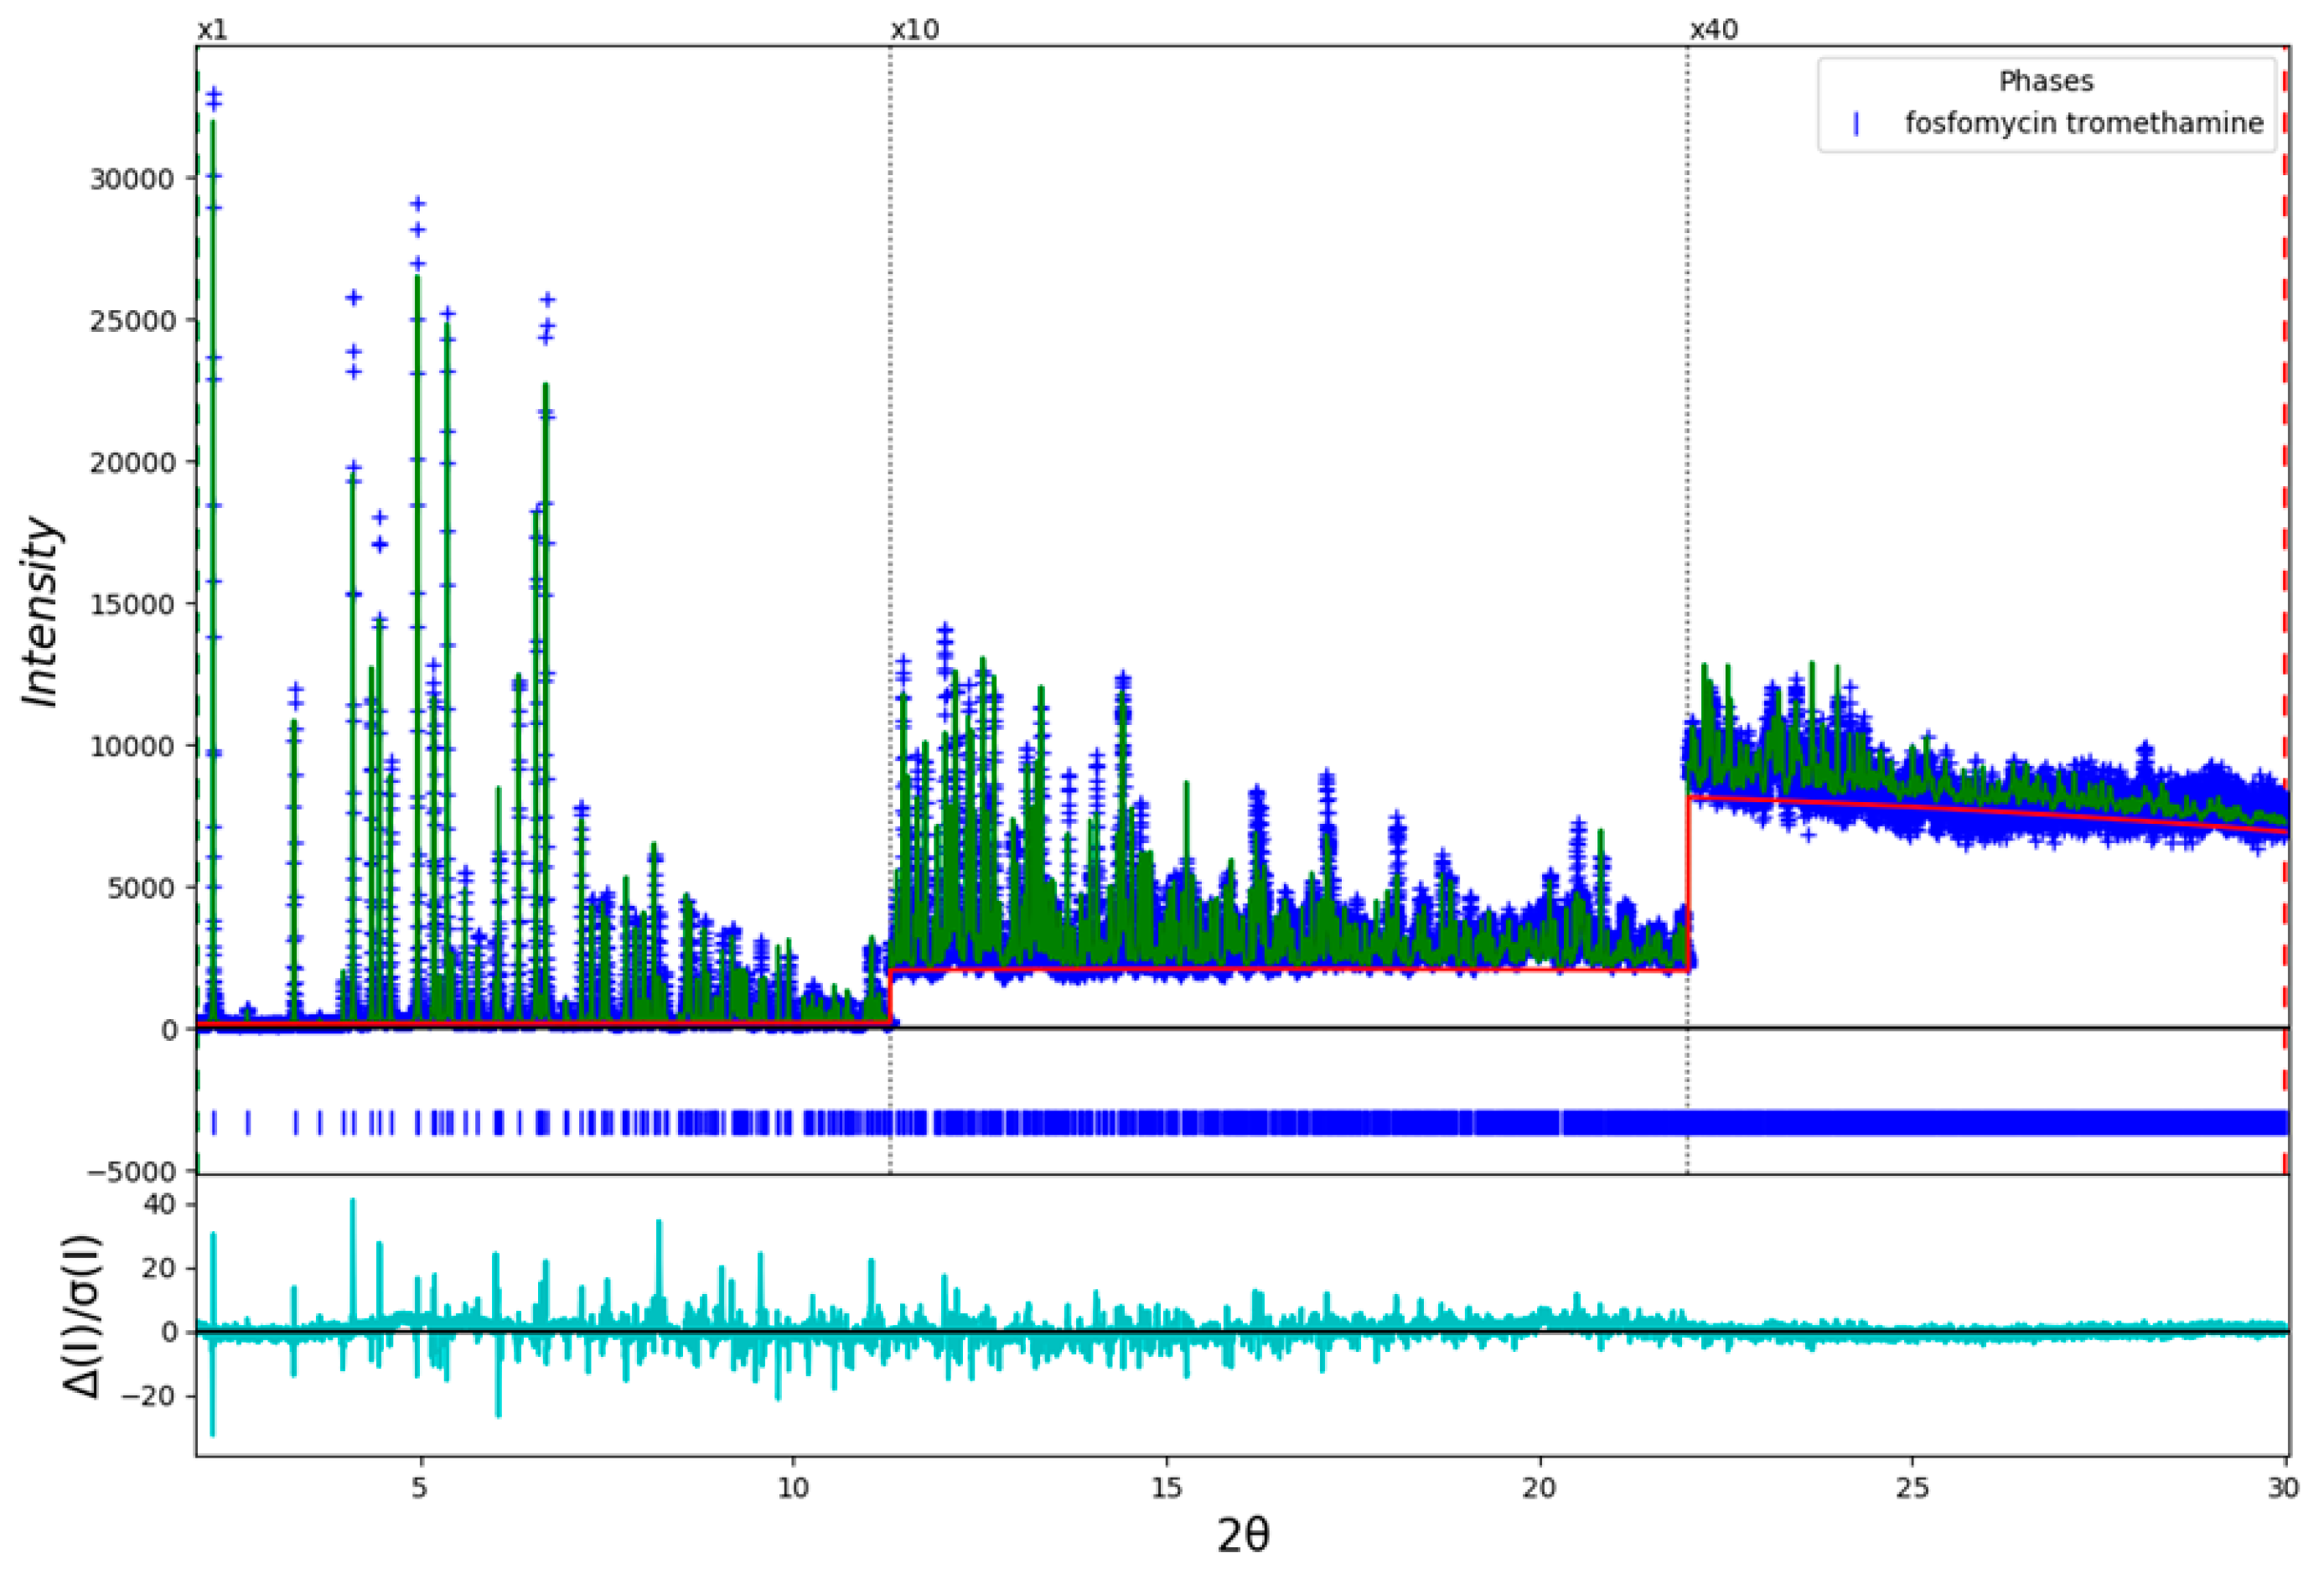
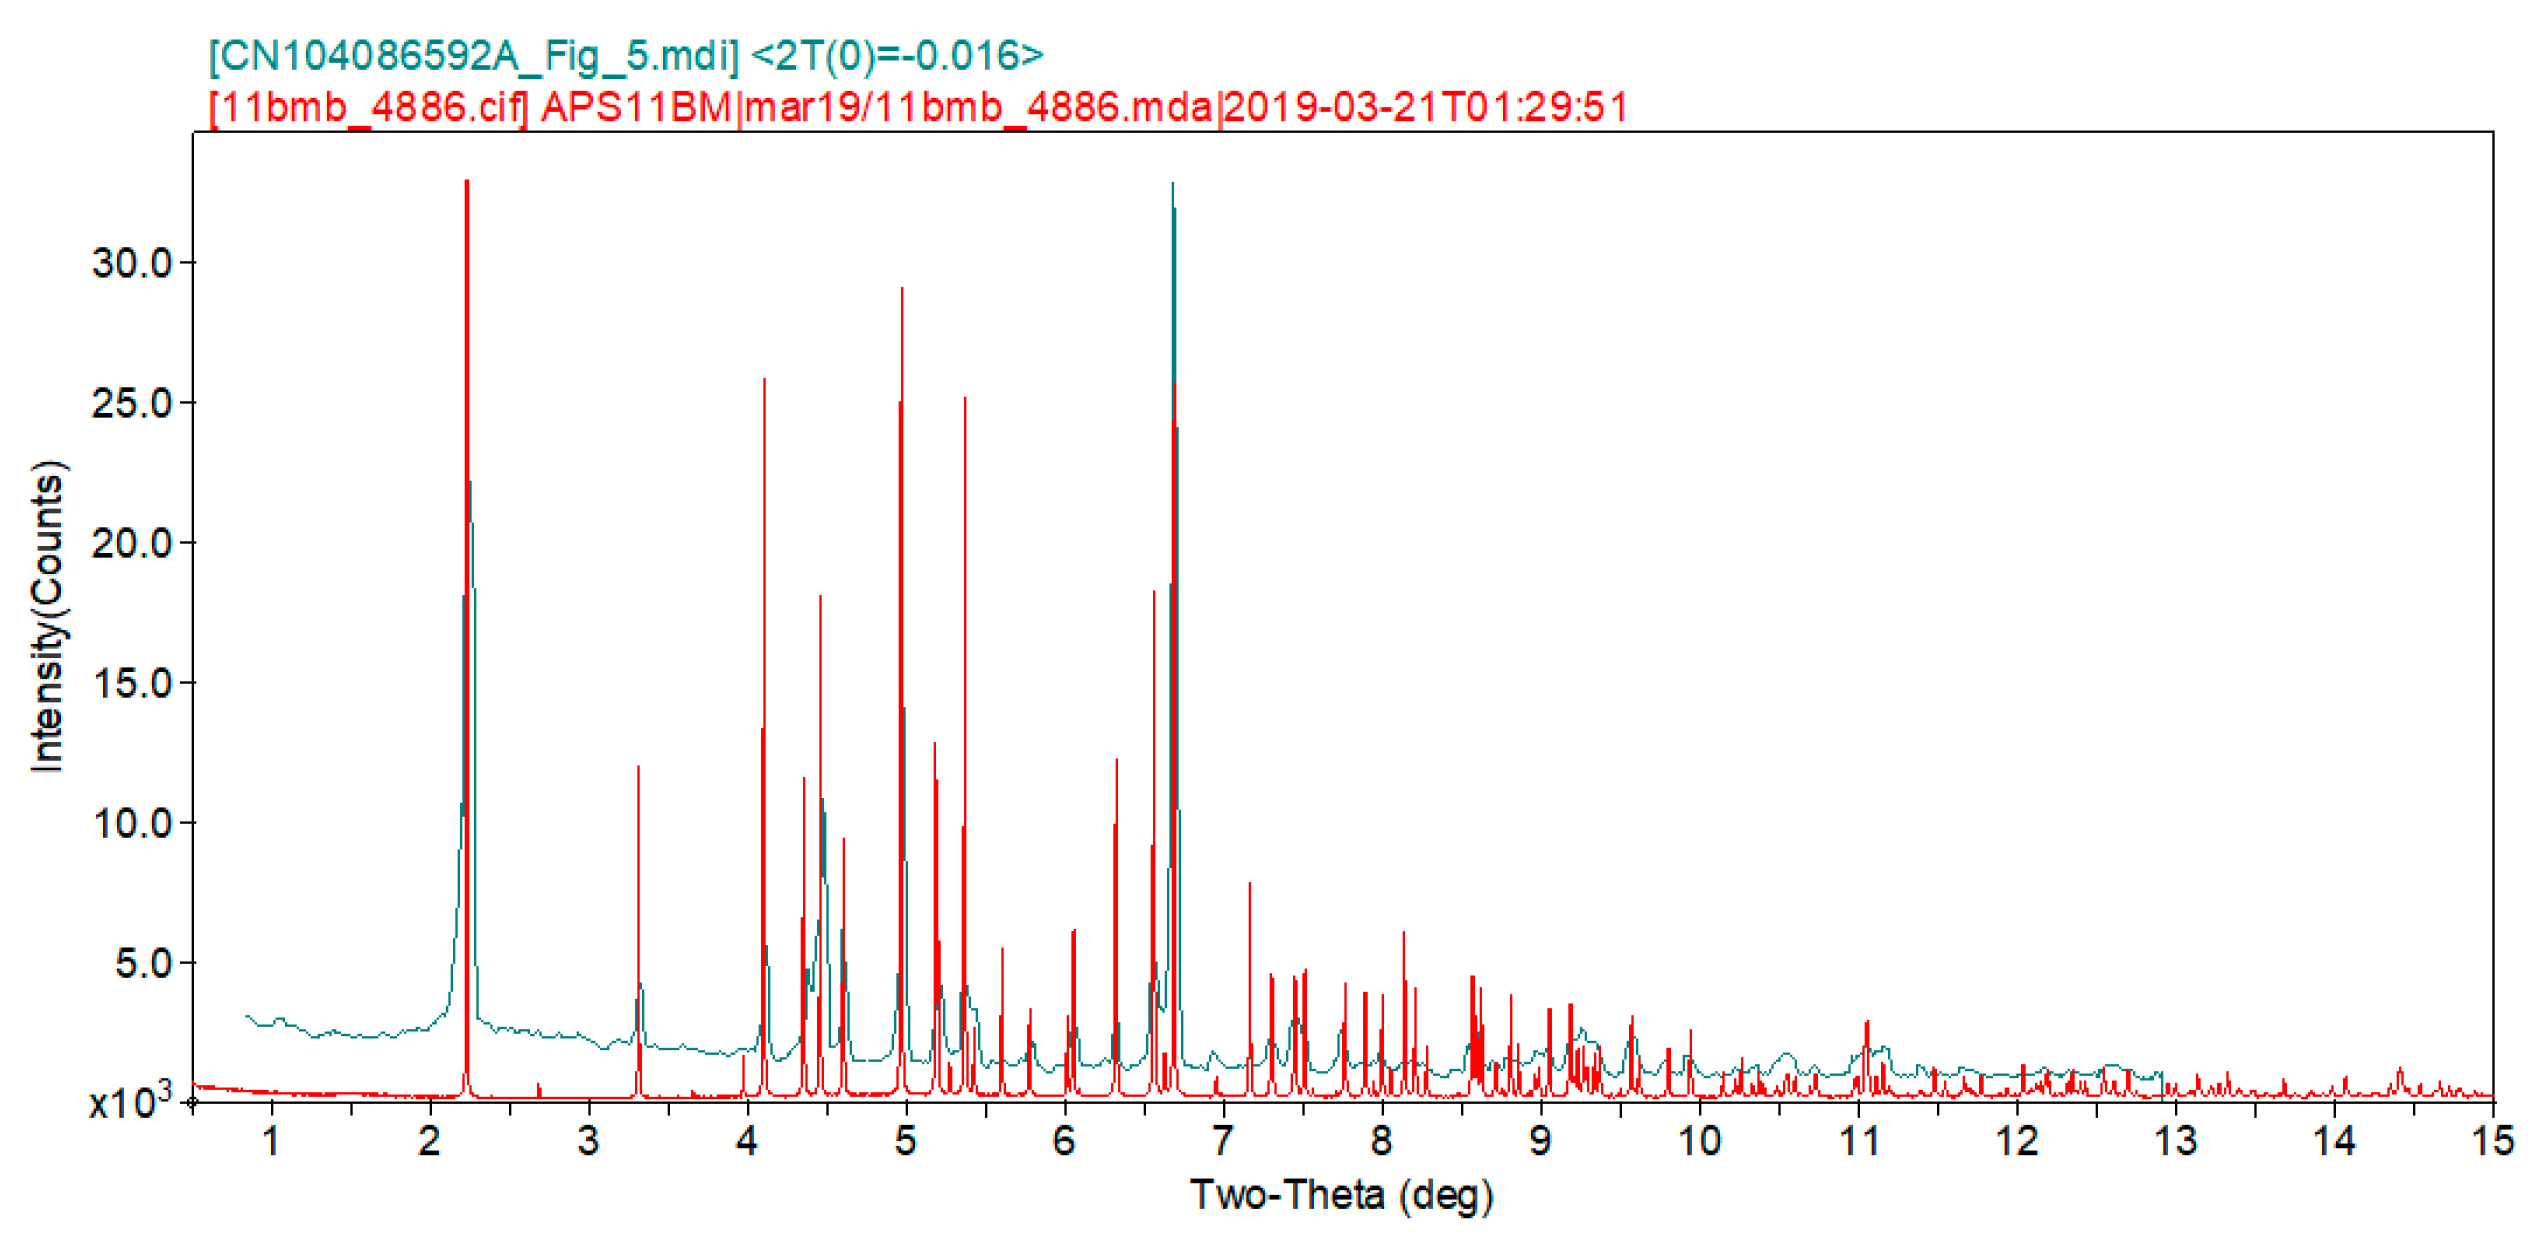
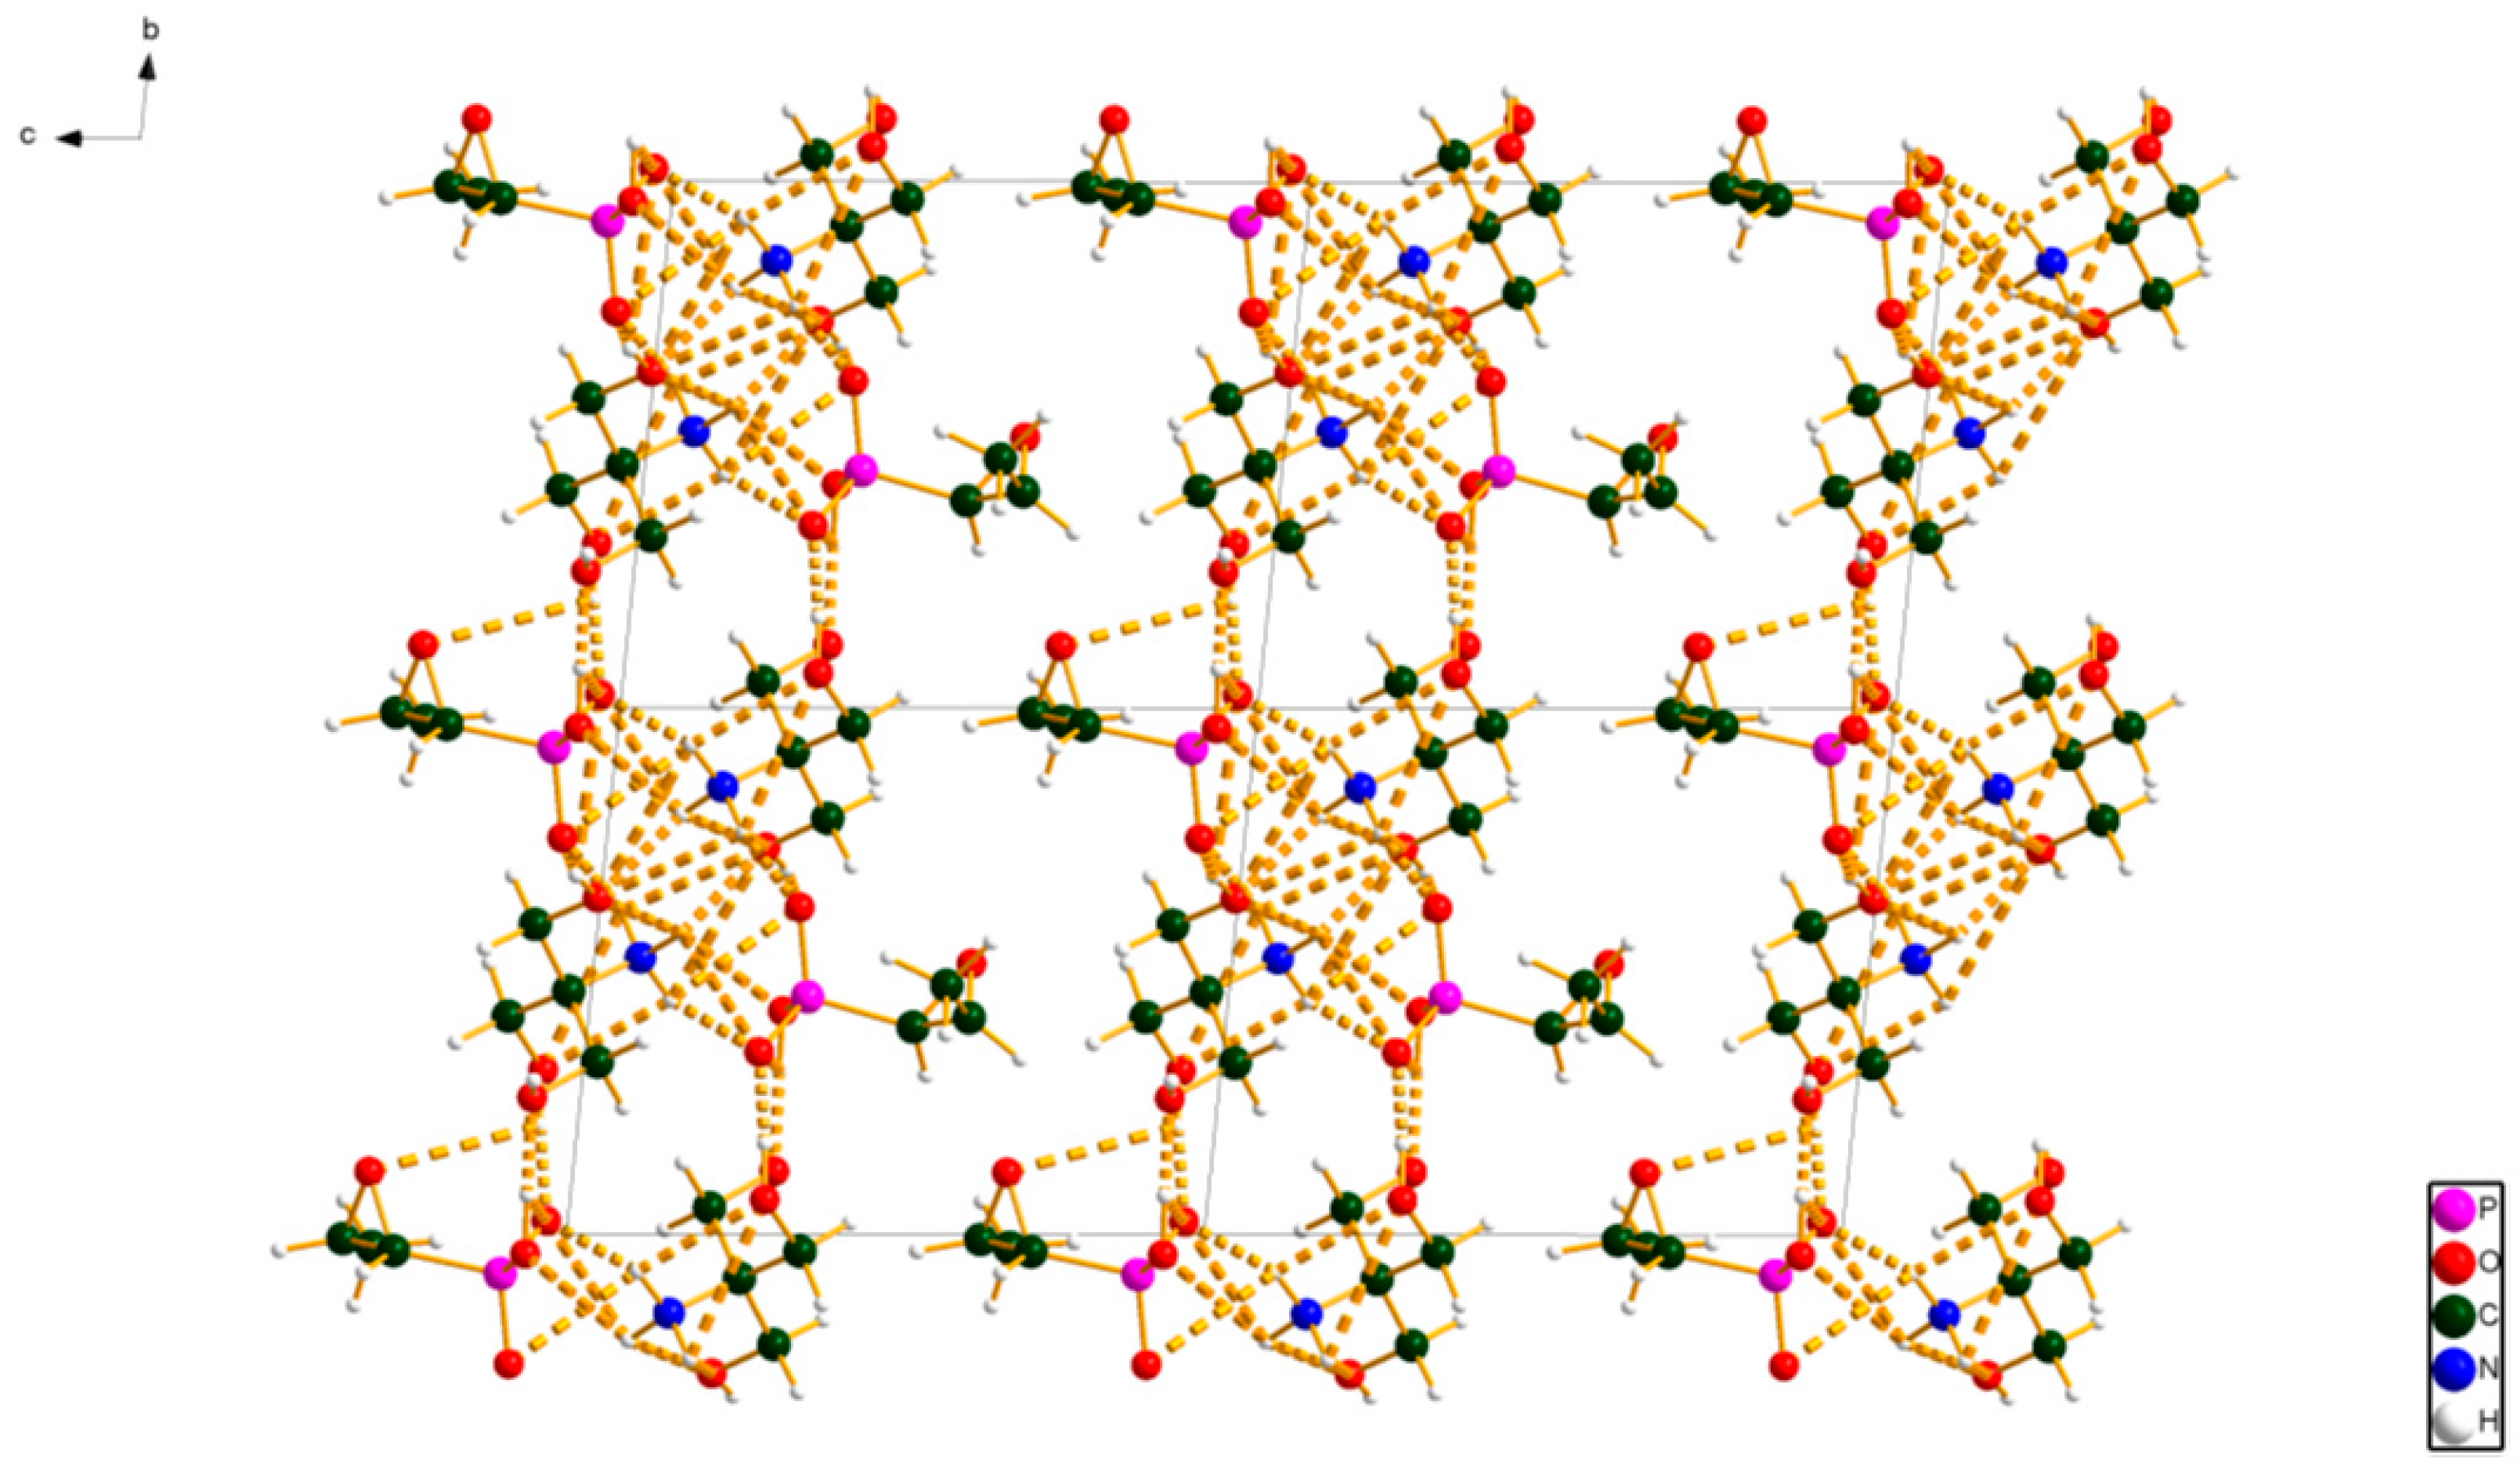
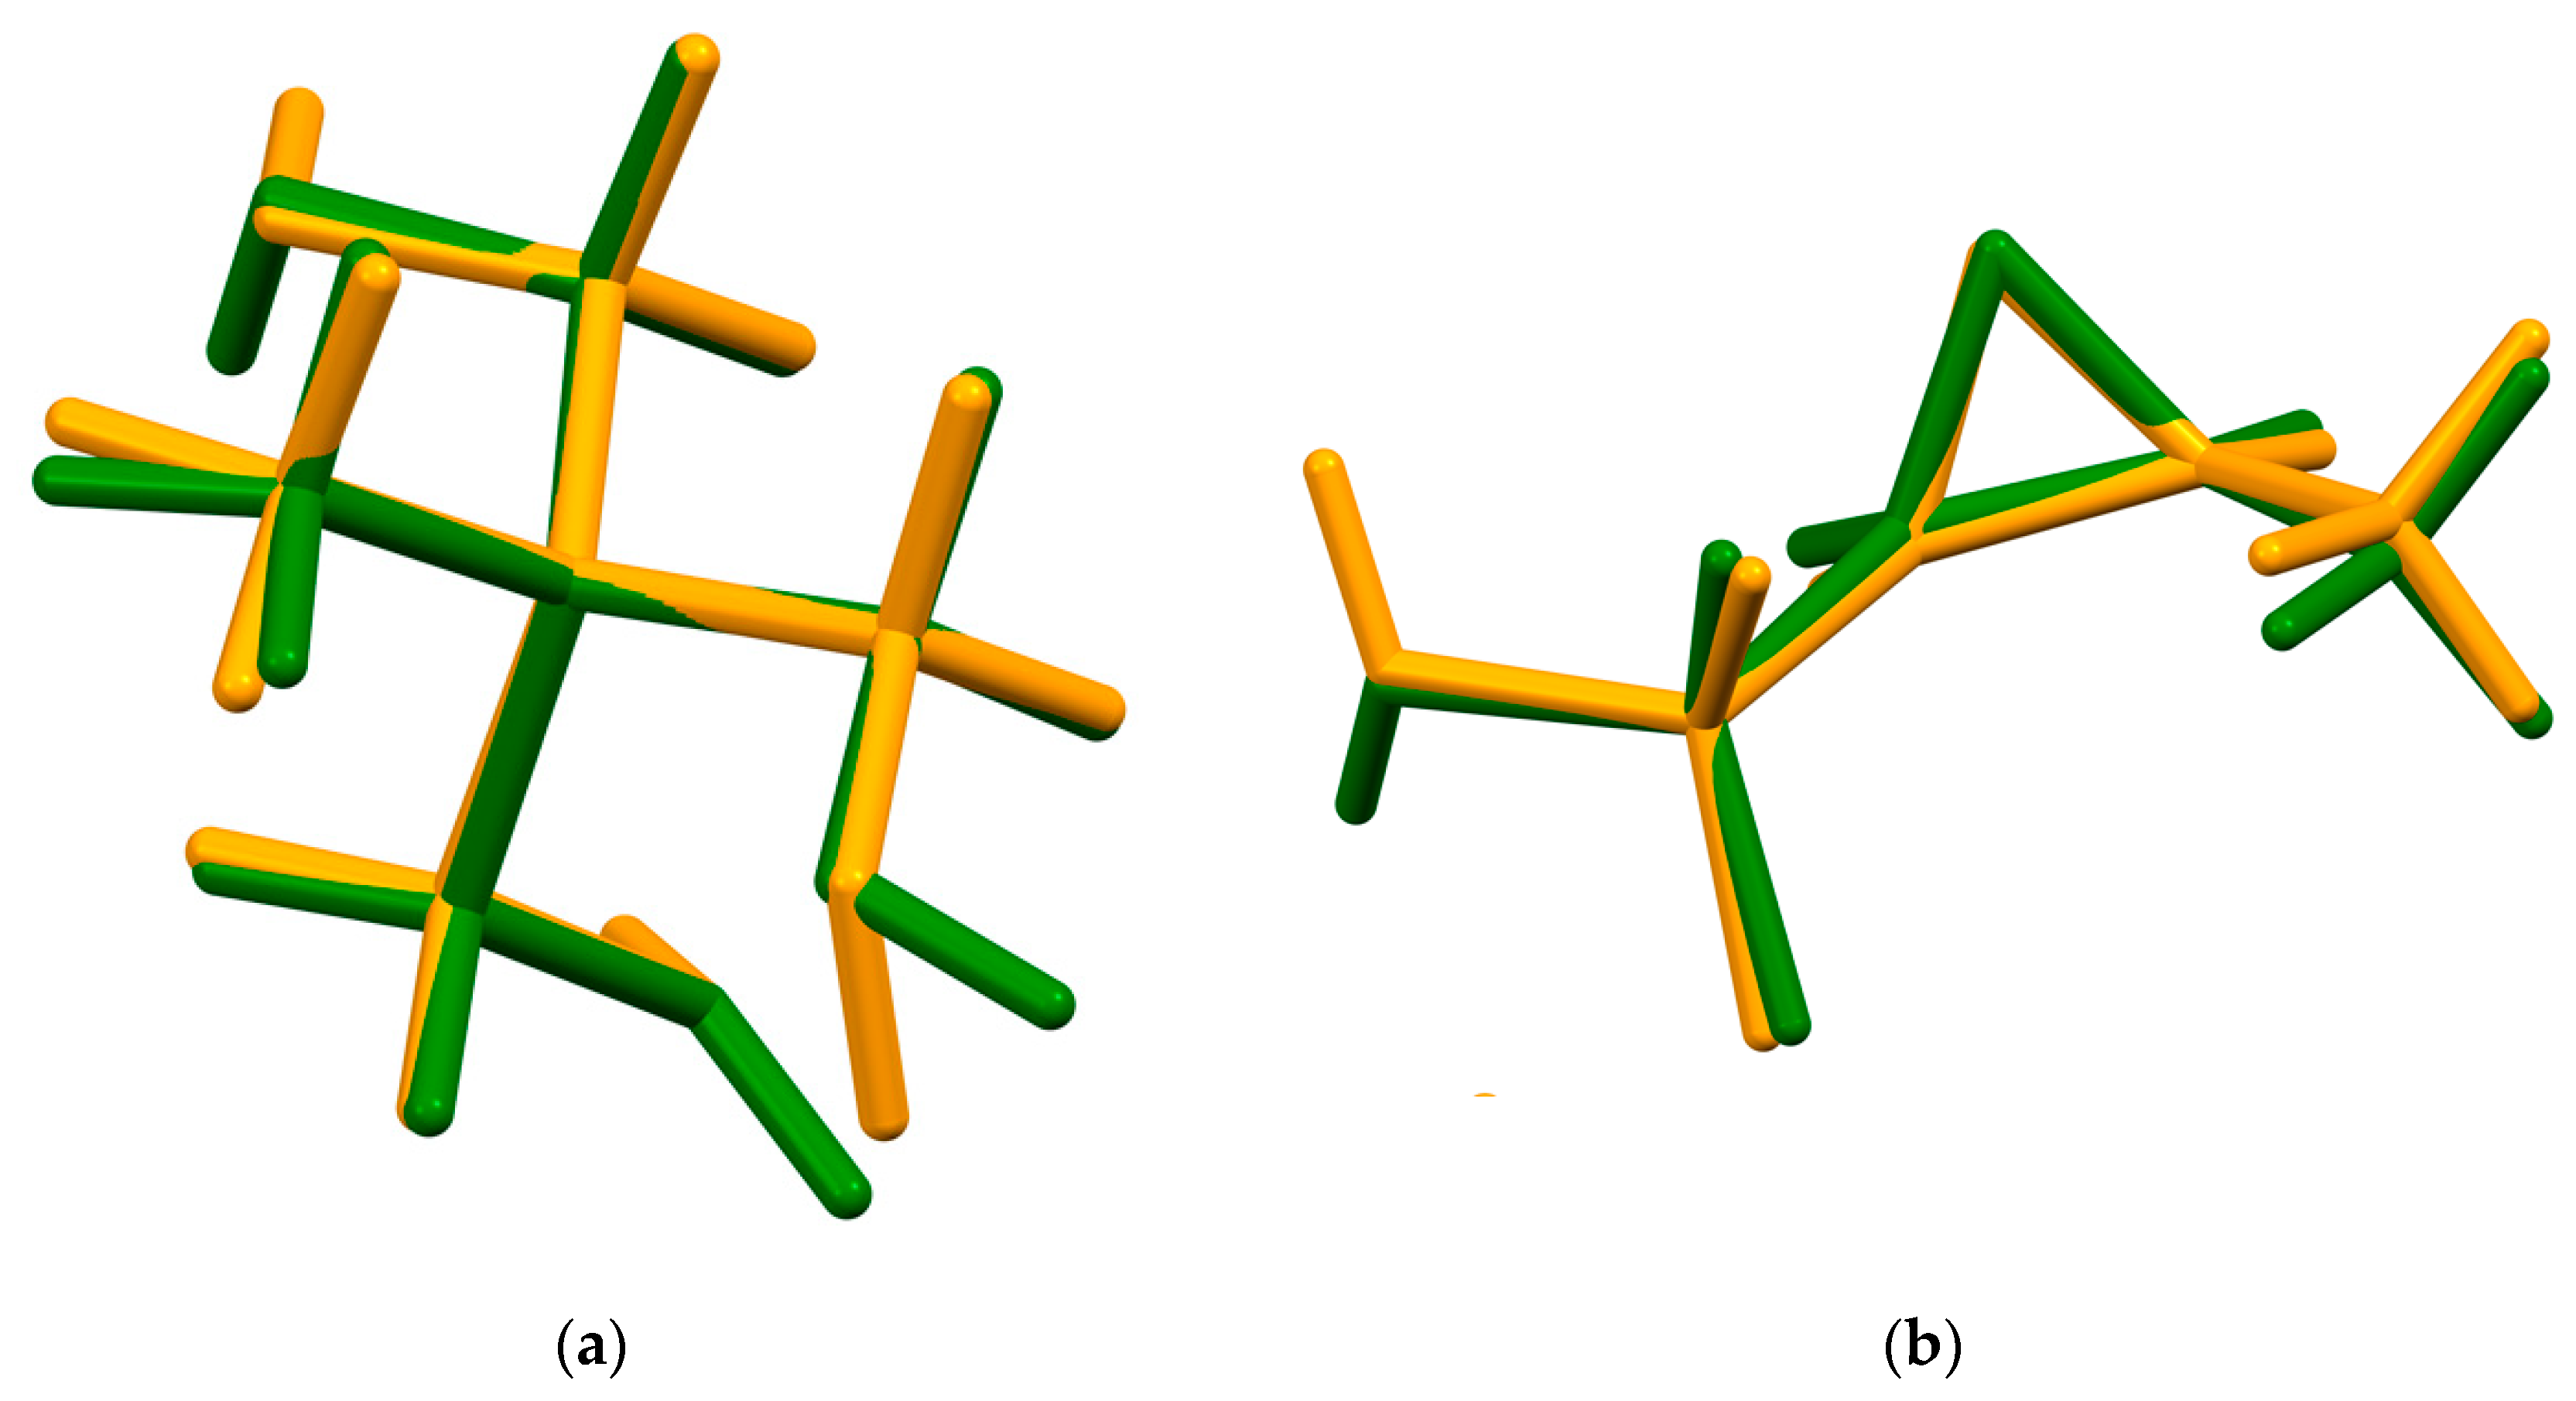
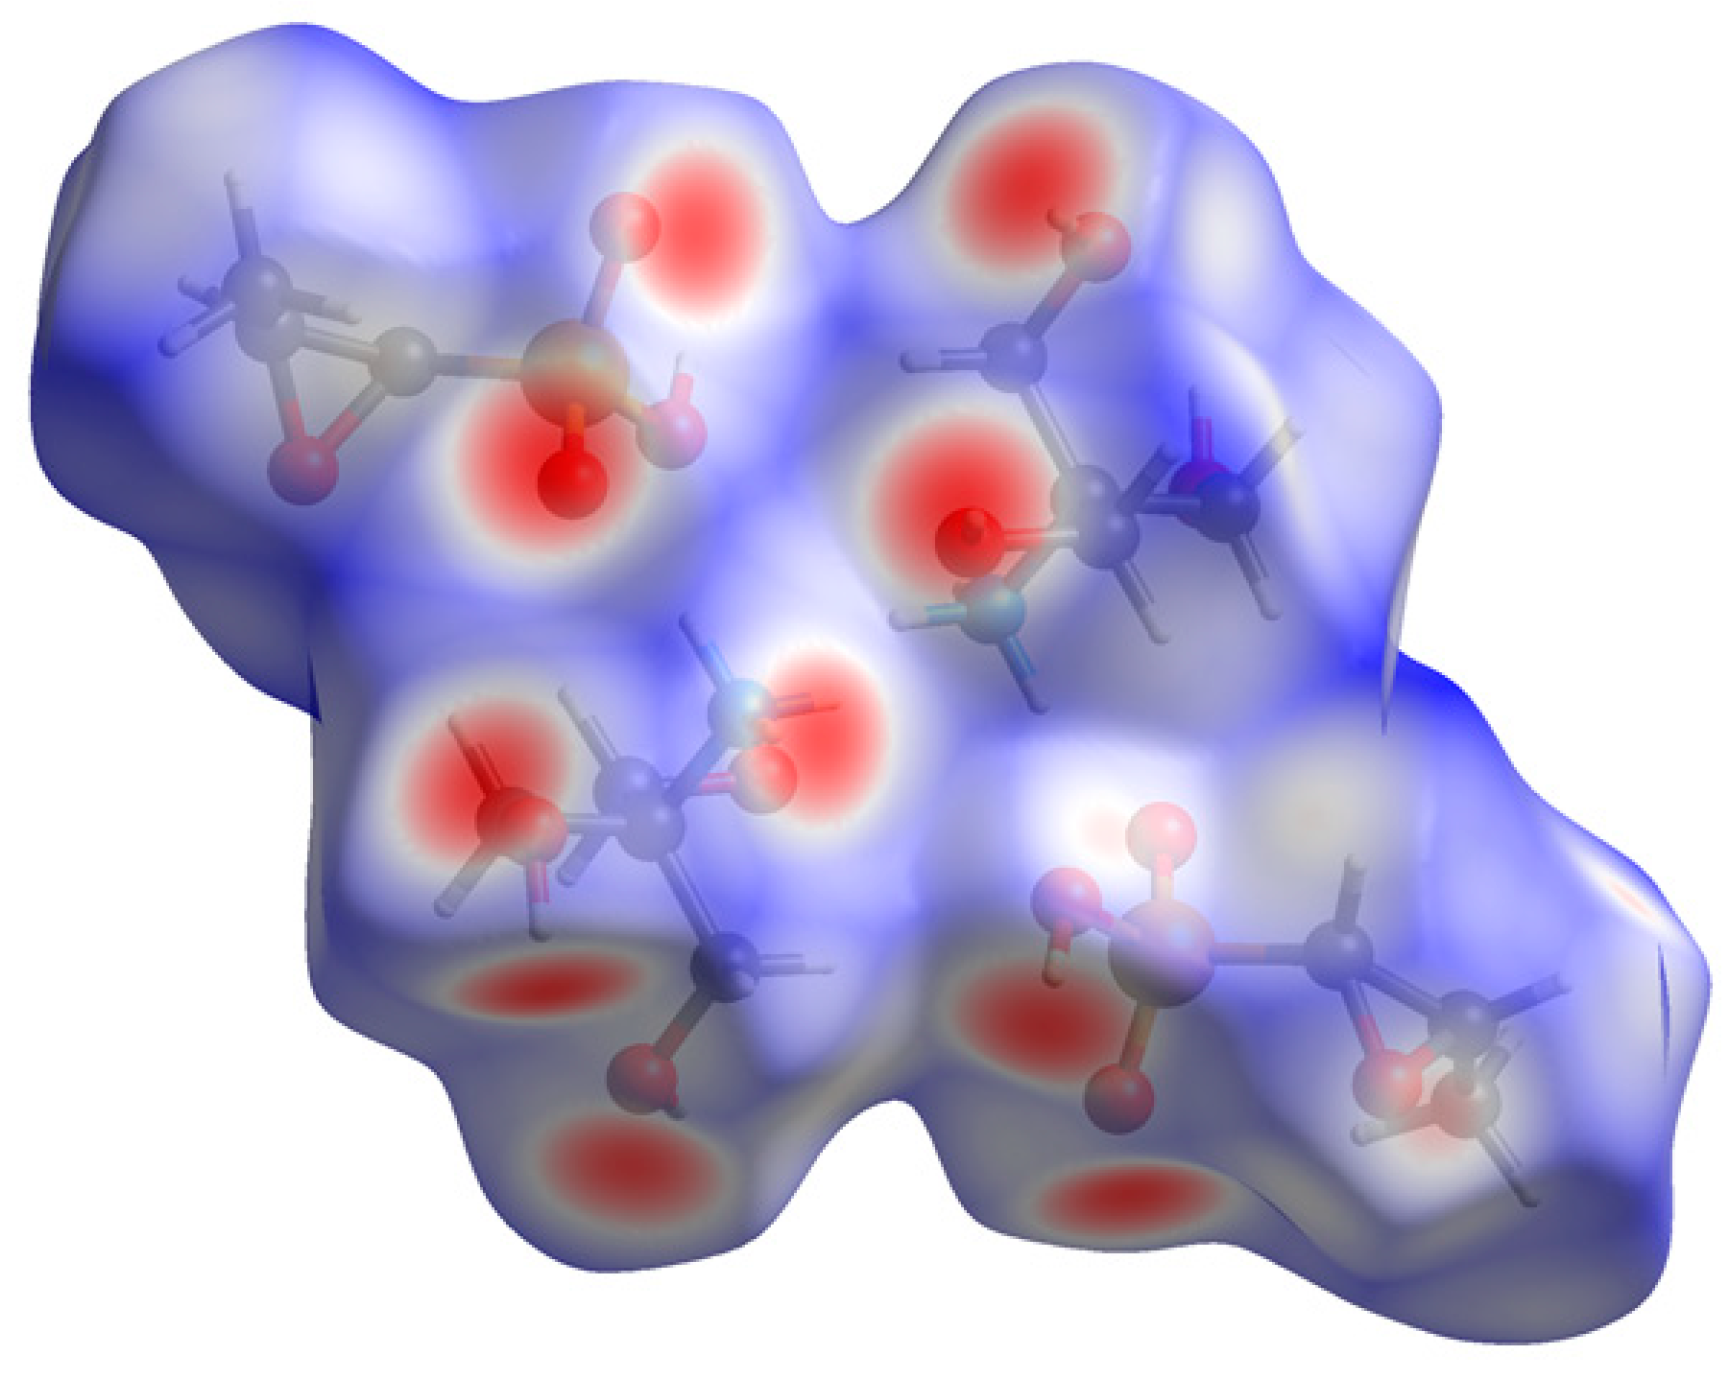
2. Results and Discussion

The synchrotron pattern of this study matches the laboratory pattern of fosfomycin tromethamine reported by Huang et al. [1] sufficiently to conclude that they represent the same material, and that our sample is representative of commercial material (Figure 2). The refined atom coordinates of fosfomycin tromethamine and the coordinates from the density functional theory DFT optimization are reported in the CIFs attached as Supplementary Materials.
The root-mean-square Cartesian displacement of the non-hydrogen atoms of the Rietveld-refined and the DFT-optimized structures of fosfomycin tromethamine are given in Table 1 and Figure 3. The excellent agreement between the refined and optimized structures is evidence that the experimental structure is correct [6]. The rest of this discussion concentrates on the CRYSTAL-optimized structure. The asymmetric unit (with atom numbering) is illustrated in Figure 4, and the crystal structure is presented in Figure 5. The two independent cations and anions are compared in Figure 6.
A network of discrete hydrogen bonds links the cations and anions into layers parallel to the ab-plane. The outer surfaces of the layers are composed of the methyloxirane rings of the anions and the methylene groups of the cations. The displacement coefficients of the atoms of the methyloxirane rings are relatively high, suggesting the possibility of disorder and/or enantiomeric impurity. The difference Fourier map did not suggest any reasonable models for such disorder. The ADDSYM test of checkCIF [7] indicated that 93% of the atoms were consistent with an additional center of symmetry. The difference between the enantiomers of the anion is in the orientation of the oxygen atom of the oxirane ring. The authors expect that a commercial pharmaceutical reference sample has the correct chirality, and thus that the center is only a pseudo operation. As is typical for pharmaceuticals, the peak profiles were dominated by microstrain broadening (modeled using the generalized model), but the broadening was not particularly anisotropic.
All of the bond angles and almost all of the bond distances and torsion angles fall within the normal ranges indicated by a Mercury Mogul Geometry check [8]. The P1-O4 and P9-O11 distances of 1.623 Å and 1.617 Å (average = 1.566(15), Z-score = 3.8, 3.4) are flagged as unusual. These are the distances to the hydroxyl groups in the anions. The torsion angles O4-P1-C5-C6, O10-P9-C13-C14, O10-P9-C13-O15, O11-P9-C13-O15, and O12-P9-C13-C14 are flagged as unusual. Mogul finds few hits for these torsion angles and the hits span a very wide angular range. The fosfomycin anion is indeed unusual.
The quantum chemical geometry optimizations (DFT/B3LYP/6-31G*/water) using Spartan ‘18 [9] indicate that the energies of the observed conformations of the cations are essentially identical, even though the orientations of the hydroxyl groups differ. Anion 2 is 1.8 kcal/mole lower in energy than anion 1, and the only significant difference is in the orientation of the hydroxyl group. It is fair to conclude that the hydrogen bonds play an important role in determining the solid-state conformations, and thus that intermolecular interactions are important in determining the solid-state structure.
The analysis of the contributions to the total crystal energy using the Forcite module of materials studio [10] suggests that the angle distortion terms are significant in the intramolecular deformation energy, as might be expected from an anion with a 3-membered ring. The intermolecular energy is small, and is dominated by van der Waals repulsion and electrostatic attraction, which in this force-field-based analysis includes hydrogen bonds. The hydrogen bonds are better analyzed using the results of the DFT calculation.
The hydrogen bonds are prominent in the crystal structure (Table 2). The energies of the N-H⋅⋅⋅O hydrogen bonds were calculated using the correlation of Wheatley and Kaduk [11], and the energies of the O-H⋅⋅⋅O hydrogen bonds were calculated using the correlation of Rammohan and Kaduk [12]. The ammonium groups of the cations act as donors to both the ionized oxygen atoms of the phosphonate groups of the anions and the hydroxyl groups of the cations. Some of the H-bonds are bifurcated. The two hydroxyl groups of the anions act as donors to hydroxy groups of the cations. The hydroxy groups of the cations act as donors both to ionized oxygens of the phosphonate groups and to other hydroxyl groups of the cations. There is a surprising number of C-H⋅⋅⋅O hydrogen bonds.
The volume enclosed by the Hirshfeld surface (Figure 7 [13,14]) is 640.60 Å3, 98.48% of the unit cell volume. The molecules are thus not tightly packed. All of the significant close contacts (red in Figure 7) involve the hydrogen bonds.
The Bravais-Friedel-Donnay-Harker [15,16,17] morphology suggests that platy morphology for fosfomycin tromethamine, with {001} as the major faces, may be expected. A second-order spherical harmonic preferred orientation model was included in the refinement. The texture index was 1.031, indicating that the preferred orientation was present in this rotated capillary specimen. The powder pattern has been submitted to ICDD for inclusion in the Powder Diffraction File.

3. Materials and Methods

Fosfomycin tromethamine was a commercial reagent, purchased from the United States Pharmacopeial Convention (Lot #R079E0), and was used as-received. The white powder was packed into a 1.5 mm diameter Kapton capillary, and rotated during the measurement at ~50 Hz. The powder pattern was measured at 295K at beam line 11-BM [18,19] of the Advanced Photon Source at Argonne National Laboratory using a wavelength of 0.412826 Å from 0.5–50° 2θ with a step size of 0.001° and a counting time of 0.1 s/step. The beam line staff indicated some changes in the diffraction pattern with beam exposure. Some of the low angle peaks moved by a few millidegrees between the times they were measured by different detectors.
The pattern was initially indexed on a primitive triclinic unit cell with a = 6.20720, b = 8.99949, c = 10.91214 Å, α = 93.472°, β = 101.981°, γ = 99.897°, V = 584.5 Å3, and Z = 2 using N-TREOR [20]. A reduced cell search in the Cambridge Structural Database [21] combined with the chemistry C, H, N, O, and P only yielded no hits. As the volume corresponded to two formula units, the space group was assumed to be P-1. The structure was solved using direct methods using EXPO2014 [20].
The Rietveld refinement was carried out using GSAS II [22]. The weighted profile residual was 19.13%, a surprisingly high value. At this point, the authors realized the anion was chiral and the space group could not be P-1.
The structure was re-solved by direct methods in space group P1 using EXPO2014 [20]. All solutions were explored using the COVMAP option [20]. Only one of the twenty solutions included both three membered rings. The chirality of both anions was opposite to the (2R,3S) expected from the literature. In GSAS-II on the Atoms tab of the phase, the Edit Atoms/On Selected Atoms/Transform Atoms/Choose Inversion/Yes option was used to invert the chirality.
The Rietveld refinement was carried out using GSAS-II [22]. Only the 2.0–30.0° portion of the pattern was included in the refinement (dmin = 0.797 Å). The coordinates of P1 were fixed to define the origin. To establish appropriate values for distance and angle restraints, the cation and the anion were built in Spartan’18 [9], and optimized using DFT techniques using the B3LYP functional, 6–31G* basis sets, and in aqueous medium. Most non-H bond distances and all bond angles were subjected to restraints using the optimized distances and angles. The P-O bond distances were not restrained. After initial refinements, the P1-O4 and P9-O11 distances were longer than the other P-O distances. The analysis of potential hydrogen bonding interactions in Mercury [8] showed that these oxygen atoms hydrogen bonded to oxygen and not nitrogen atoms of the cations. Both features suggest that the active protons in the anions were bonded to O4 and O11, therefore, H55 and H56 were added in approximate positions. The hydrogen atoms were included in calculated positions, which were recalculated during the refinement using Materials Studio [10]. The Uiso were grouped by chemical similarity, and the two independent cations and anions were constrained to have the same displacement coefficients. The background was modeled using a 3-term shifted Chebyshev polynomial.
The final refinement of 109 variables using 28,045 observations and 74 restraints yielded the residuals Rwp = 0.1501 and GOF = 3.16. The largest peak (0.47 Å from C5) and hole (2.06 Å from P1) in the difference Fourier map were 1.09 and -1.02(21) eÅ−3, respectively. The largest errors in the fit (Figure 8) are in the shapes and positions of some of the strong low angle peaks, consistent with the decomposition in the beam. It proved difficult to refine the lattice parameters, so they were fixed in the final cycle of refinement.
A density functional geometry optimization was carried out using CRYSTAL14 [23]. The basis sets for the H, C, N, and O atoms were those of [24] Gatti et al. (1994), and the basis set for P was that of Peintinger [25] (2013). The calculation was run on eight 2.1 GHz Xeon cores (each with 6 Gb RAM) of a 304-core Dell Linux cluster at IIT, using 8 k-points and the B3LYP functional, and took ~79 hours.

Supplementary Materials

The following are available online at https://www.mdpi.com/2073-4352/9/8/384/s1: Fosfomycin_1_Zach_final.cif (Rietveld refined crystal structure), Fosfomycin_1_Zach_DFT.cif (DFToptimized crystal structure).

Author Contributions

Z.R.B. solved and refined the crystal structure. J.A.K. assisted in the solution and refinement, and carried out the DFT calculations. A.M.G. and T.N.B. prepared the specimen for synchrotron data collection, confirmed the powder pattern indexing, and prepared the reference diffraction data for addition to the Powder Diffraction File.

Acknowledgments

Use of the Advanced Photon Source at Argonne National Laboratory was supported by the U.S. Department of Energy, Office of Science, Office of Basic Energy Sciences, under Contract No. DE-AC02-06CH11357. This work was partially supported by the International Centre for Diffraction Data, grant number 09-03. We thank Lynn Ribaud and Saul Lapidus for their assistance in the data collection, and Andrey Rogachev for the use of computing resources at IIT.

Conflicts of Interest

The authors declare no conflicts of interest.

References

  1. Huang, S.; Chen, Y.; Meng, J.; Tang, S. Preparation Method of Fosfomycin Tromethamine. Patent CN104086592A, 8 October 2014. [Google Scholar]
  2. Kaduk, J.A.; Crowder, C.E.; Zhong, K.; Fawcett, T.G.; Suchomel, M.R. Crystal structure of atomoxetine hydrochloride (Strattera), C17H22NOCl. Powder Diffr. 2015, 29, 269–273. [Google Scholar] [CrossRef]
  3. Fawcett, T.G.; Kabekkodu, S.N.; Blanton, J.R.; Blanton, T.N. Chemical analysis by diffraction: The Powder Diffraction File™. Powder Diffr. 2017, 32, 63–71. [Google Scholar] [CrossRef]
  4. Orem, U.T. Silk Scientific, UN-SCAN-IT 7.0; Silk Scientific Corporation: Orem, UT, USA, 2013. [Google Scholar]
  5. MDI. Jade 9.8; Materials Data Inc.: Livermore, CA, USA, 2018. [Google Scholar]
  6. Van de Streek, J.; Neumann, M.A. Validation of molecular crystal structures from powder diffraction data with dispersion-corrected density functional theory (DFT-D). Acta Cryst. Sect. B Struct. Sci. Cryst. Eng. Mater. 2014, 70, 1020–1032. [Google Scholar] [CrossRef] [PubMed]
  7. Spek, A.L. Single-crystal structure validation with the program PLATON. J. Appl. Cryst. 2003, 36, 7–13. [Google Scholar] [CrossRef]
  8. Macrae, C.F.; Bruno, I.J.; Chisholm, J.A.; Edington, P.R.; McCabe, P.; Pidcock, E.; Rodriguez-Monge, L.; Taylor, R.; van de Streek, J.; Wood, P.A. Mercury CSD 2.0—New features for the visualization and investigation of crystal structures. J. Appl. Crystallogr. 2008, 41, 466–470. [Google Scholar] [CrossRef]
  9. Wavefunction, Inc. Spartan ’18 Version 1.3.0; Wavefunction Inc.: Irvine, CA, USA, 2018. [Google Scholar]
  10. Systèmes, D. Materials Studio 2019R1; BIOVIA: San Diego, CA, USA, 2018. [Google Scholar]
  11. Wheatley, A.M.; Kaduk, J.A. Crystal structures of ammonium citrates. Powder Diffr. 2019, 34, 35–43. [Google Scholar] [CrossRef]
  12. Rammohan, A.; Kaduk, J.A. Crystal structures of alkali metal (Group 1) citrate salts. Acta Cryst. Sect. B Cryst. Eng. Mater. 2018, 74, 239–252. [Google Scholar] [CrossRef] [PubMed]
  13. Hirshfeld, F.L. Bonded-atom fragments for describing molecular charge densities. Theor. Chem. Acta 1977, 44, 129–138. [Google Scholar] [CrossRef]
  14. Turner, M.J.; McKinnon, J.J.; Wolff, S.K.; Grimwood, D.J.; Spackman, P.R.; Jayatilaka, D.; Spackman, M.A. CrystalExplorer17; University of Western Australia: Crawley, Australia, 2017; Available online: http://hirshfeldsurface.net (accessed on 30 May 2019).
  15. Bravais, A. Etudes Cristallographiques; Gauthier Villars: Paris, France, 1866. [Google Scholar]
  16. Friedel, G. Etudes sur la loi de Bravais. Bull. Soc. Fr. Mineral. 1907, 30, 326–455. [Google Scholar]
  17. Donnay, J.D.H.; Harker, D. A new law of crystal morphology extending the law of Bravais. Am. Mineral. 1937, 22, 446–447. [Google Scholar]
  18. Lee, P.L.; Shu, D.; Ramanathan, M.; Preissner, C.; Wang, J.; Beno, M.A.; Von Dreele, R.B.; Ribaud, L.; Kurtz, C.; Antao, S.M.; et al. A twelve-analyzer detector system for high-resolution powder diffraction. J. Synch. Rad. 2008, 15, 427–432. [Google Scholar] [CrossRef] [PubMed]
  19. Wang, J.; Toby, B.H.; Lee, P.L.; Ribaud, L.; Antao, S.M.; Kurtz, C.; Ramanathan, M.; Von Dreele, R.B.; Beno, M.A. A dedicated powder diffraction beamline at the Advanced Photon Source: Commissioning and early operational results. Rev. Sci. Inst. 2008, 79, 085105. [Google Scholar] [CrossRef] [PubMed]
  20. Altomare, A.; Cuocci, C.; Giacovazzo, C.; Moliterni, A.; Rizzi, R.; Corriero, N.; Falcicchio, A. EXPO2013: A kit of tools for phasing crystal structures from powder data. J. Appl. Crystallogr. 2013, 46, 1231–1235. [Google Scholar] [CrossRef]
  21. Groom, C.R.; Bruno, I.J.; Lightfoot, M.P.; Ward, S.C. The Cambridge Structural Database. Acta Crystallogr. Sect. B Struct. Sci. Cryst. Eng. Mater. 2016, 72, 171–179. [Google Scholar] [CrossRef] [PubMed]
  22. Toby, B.H.; Von Dreele, R.B. GSAS II: The genesis of a modern open source all purpose crystallography software package. J. Appl. Crystallogr. 2013, 46, 544–549. [Google Scholar] [CrossRef]
  23. Dovesi, R.; Orlando, R.; Erba, A.; Zicovich-Wilson, C.M.; Civalleri, B.; Casassa, S.; Maschio, L.; Ferrabone, M.; De La Pierre, M.; D-Arco, P.; et al. CRYSTAL14: A program for the ab initio investigation of crystalline solids. Int. J. Quantum Chem. 2014, 114, 1287–1317. [Google Scholar] [CrossRef]
  24. Gatti, C.; Saunders, V.R.; Roetti, C. Crystal-field effects on the topological properties of the electron-density in molecular crystals—The case of urea. J. Chem. Phys. 1994, 101, 10686–10696. [Google Scholar] [CrossRef]
  25. Peintinger, M.F.; Vilela Oliveira, D.; Bredow, T. Consistent Gaussian Basis Sets of Triple-Zeta Valence with Polarization quality for Solid-State Calculations. J. Comput. Chem. 2013, 34, 451–459. [Google Scholar] [CrossRef] [PubMed]
Figure 1. The molecular structure of fosfomycin tromethamine.
Crystals 09 00384 g001
Figure 2. Comparison of the synchrotron pattern (red) of fosfomycin tromethamine with the laboratory diffraction pattern from Huang et al., [1]. The literature pattern (measured using Cu Kα radiation) was digitized using UN-SCAN-IT [4] and scaled to the synchrotron wavelength of 0.412826 Å using Jade 9.8 [5].
Crystals 09 00384 g002
Figure 3. (a) Comparison of the Rietveld-refined (red) and CRYSTAL14-optimized (blue) structures of cation 1 of fosfomycin tromethamine. (b) Comparison of the Rietveld-refined (red) and CRYSTAL14-optimized (blue) structures of cation 2 of fosfomycin tromethamine. (c) Comparison of the Rietveld-refined (red) and CRYSTAL14-optimized (blue) structures of anion 1 of fosfomycin tromethamine. (d) Comparison of the Rietveld-refined (red) and CRYSTAL14-optimized (blue) structures of anion 2 of fosfomycin tromethamine.
Crystals 09 00384 g003
Figure 4. The asymmetric unit of fosfomycin tromethamine, with the atom numbering. The atoms are represented by 50% probability spheres.
Crystals 09 00384 g004
Figure 5. The crystal structure of fosfomycin tromethamine viewed down the a-axis.
Crystals 09 00384 g005
Figure 6. (a) Comparison of the two tromethamine cations; cation 1 (green) and cation 2 (orange). (b) Comparison of the two fosfomycin anions; anion 1 (green) and anion 2 (orange).
Crystals 09 00384 g006
Figure 7. The Hirshfeld surface of fosfomycin tromethamine. The intermolecular contacts longer than the sums of the van der Waals radii are colored blue, and contacts shorter than the sums of the radii are colored red. The contacts equal to the sums of radii are white.
Crystals 09 00384 g007
Figure 8. The Rietveld plot for the refinement of fosfomycin tromethamine. The blue crosses represent the observed data points, and the green line is the calculated pattern. The cyan curve is the normalized error plot. The vertical scale has been multiplied by a factor of 10× for 2θ > 11.3, and by a factor of 40× for 2θ > 22.0°.
Crystals 09 00384 g008
Table 1. The root-mean-square Cartesian displacements (Å) between the Rietveld-refined and DFT-optimized fragments in fosfomycin tromethamine.
FragmentRms Δ, ÅMax. Δ, Å
cation 10.0650.100
cation 20.0860.151
anion 10.2230.327
anion 20.1720.258
Table 2. The hydrogen bonds (CRYSTAL14) in fosfomycin tromethamine.
H-BondD-H, ÅH⋅⋅⋅A, ÅD⋅⋅⋅A, ÅD-H⋯A, ̊Overlap, eE, kcal/mol
N26-H61⋅⋅⋅O121.0451.7482.765163.00.0756.3
N26-H60⋅⋅⋅O21.0411.8592.843156.20.0645.8
N18-H58⋅⋅⋅O101.0411.8432.820155.00.0655.9
N18-H57⋅⋅⋅O31.0471.7482.774165.40.0756.3
N26-H62⋅⋅⋅O221.0302.0212.833133.80.0434.8
N26-H62⋅⋅⋅O301.0302.3692.742100.00.0132.6
N26-H60⋅⋅⋅O281.0412.541*2.80793.70.0173.0
N18-H59⋅⋅⋅O301.0311.9962.832136.30.0485.1
N18-H59⋅⋅⋅O221.0312.3572.73199.90.0152.8
N18-H58⋅⋅⋅O241.0412.561*2.80992.60.0162.9
O11-H56⋅⋅⋅O321.0021.6512.652176.60.07615.1
O4-H55⋅⋅⋅O200.9951.7132.701171.80.07114.6
O30-H67⋅⋅⋅O120.9891.6772.648166.50.06814.3
O24-H65⋅⋅⋅O21.0011.6022.600175.00.07515.0
O22-H64⋅⋅⋅O30.9911.6592.634166.80.06714.1
O32-H68⋅⋅⋅O280.9911.6972.678169.30.07114.6
O28-H66⋅⋅⋅O100.9951.6372.623170.20.06714.1
O20-H63⋅⋅⋅O240.9891.7062.683168.50.07014.5
C31-H53⋅⋅⋅O41.0912.4023.346143.90.019
C31-H53⋅⋅⋅O301.0912.532*2.89498.00.011
C29-H51⋅⋅⋅O121.0952.5693.345127.00.011
C27-H50⋅⋅⋅O151.0922.6133.508138.60.010
C27-H49⋅⋅⋅O121.0922.4683.282130.30.015
C23-H48⋅⋅⋅O31.0942.5693.353127.80.012
C21-H46⋅⋅⋅O31.0962.6183.388126.60.010
C19-H43⋅⋅⋅O111.0912.3813.327144.10.019
C19-H43⋅⋅⋅O221.0912.5502.90998.00.011
C16-H40⋅⋅⋅O101.0892.5303.373133.40.017
C6-H34⋅⋅⋅O321.0912.6623.668153.10.014
C5-H33⋅⋅⋅O151.0922.3843.407155.40.021
* = intramolecular.

