Article

Optimization of Vapor Diffusion Conditions for Anti-CD20 Crystallization and Scale-Up to Meso Batch

1
Department of Chemical Engineering, Imperial College London, South Kensington Campus, London SW7 2AZ, UK
2
Istituto di Cristallografia, CNR, via Amendola 122/o, Bari 70126, Italy
3
Istituto per la Tecnologia delle Membrane, CNR, Via P. Bucci Cubo 17C, Rende 87036, Italy
*
Authors to whom correspondence should be addressed.
Crystals 2019, 9(5), 230; https://doi.org/10.3390/cryst9050230
Submission received: 12 March 2019 / Revised: 18 April 2019 / Accepted: 24 April 2019 / Published: 29 April 2019
(This article belongs to the Special Issue Protein Crystallography)

Abstract

:
The crystal form is one of the preferred formulations for biotherapeutics, especially thanks to its ability to ensure high stability of the active ingredient. In addition, crystallization allows the recovery of a very pure drug, thus facilitating the manufacturing process. However, in many cases, crystallization is not trivial, and other formulations, such as the concentrate solution, represent the only choice. This is the case of anti-cluster of differentiation 20 (anti-CD20), which is one of the most sold antibodies for therapeutic uses. Here, we propose a set of optimized crystallization conditions for producing anti-CD20 needle-shaped crystals within 24 h in a very reproducible manner with high yield. High crystallization yield was obtained with high reproducibility using both hanging drop vapor diffusion and meso batch, which is a major step forward toward further scaling up the crystallization of anti-CD20. The influence of anti-CD20 storage conditions and the effect of different ions on the crystallization processes were also assessed. The crystal quality and the high yield allowed the first crystallographic investigation on anti-CD20, which positively confirmed the presence of the antibody in the crystals.

1. Introduction

Monoclonal antibodies (mAbs) were approved as biopharmaceuticals in 1986 and sales of the top antibody drugs reached $80 billion in 2017 [1]. These mAbs can be easily expressed in a large amount; however, a large quantity of protein is lost due to the purification steps [2]. Therefore, the development of new purification strategies able to reduce protein loss and production costs is strongly encouraged by the biopharmaceutical industry [3,4]. Crystallization is a well-proven, robust, and scalable process usually applied to the purification of small molecules [5]. Batch and vapor diffusion represent the most known crystallization methods. The main difference between these two methods is represented by the evolution of precipitant and protein concentrations during the experiment; in the case of batch, these concentrations can be considered constant during each step of the crystallization, while they usually evolve toward higher values in the case of vapor diffusion. For this reason, the batch method is considered more reproducible than vapor diffusion, a feature that, along with the possibility of processing a large quantity of protein, makes batch crystallization the preferred one for large-scale applications. Nevertheless, vapor diffusion still remains an efficient method to screen crystallization conditions using a low quantity of protein. Regardless of the method, crystallization is potentially able to reduce downstream manufacturing costs by improving the efficiency of the protein purification step with respect to conventional chromatographic methods [5,6,7,8,9,10,11]. Moreover, the active ingredient is usually more stable in crystal form than in solution, a feature that is crucial in the case of samples that easily degrade, such as protein molecules. Unfortunately, crystallization is not a trivial process and, in the case of biomacromolecules that are particularly recalcitrant to forming ordinate solid state, it is even more complicated. Particularly, in the case of mAbs, Fab and Fc domains are connected by flexible loops that make the whole antibody structure very flexible and, thus, not suitable for crystallization. Indeed, the few intact mAb crystal structures available in the Protein Data Bank (PDB) show very high thermal factors for the Fab–Fc connecting loops (mAb231 having PDB code 1IGT and mAb61.1.3 having PDB code 1GIY) and, at worst, they are missed due to poor electron density (IgG1b12 having PDB code 1HZH) [12,13,14,15]. Such evidence suggests that these intact mAbs are made by a continuum of conformations sampled by each protein unit in the crystals. The presence of exposed negatively charged residues on the complementarity-determining region [16] or the presence of favored Fc–Fv interactions appear to increase the probability of obtaining crystals [17]; however, unfortunately, only very limited antibodies show such structural features.
Anti-cluster of differentiation 20 (anti-CD20) was the first monoclonal antibody approved for therapeutic use [18,19]. One of the most known marketed anti-CD20 drugs, rituximab, is a chimera protein made of a human immunoglobulin G1 (IgG1) constant region and a murine variable region able to bind to the transmembrane CD20 protein [20]. It is mostly used in autoimmune diseases therapy and it is effective against CD20-expressing non-Hodgkin’s lymphoma, although it is not curative [18]. Similarly to other antibodies, the high production costs of anti-CD20 ($4000/g) [21] are mainly due to the usage of traditional purification methods such as protein-A chromatography, which is very effective in mAb recovery but very expensive due to the high cost of protein-A [22,23]. Conversely, crystallization is more cost-effective because it does not require expensive chemicals, while keeping the same purity level of chromatography [24]. Several conditions and protocols to produce anti-CD20 crystals were already reported [25,26], but an extensive investigation on its crystallization conditions and the effect of the protein storage conditions on the crystallization is yet to be described. In addition, the crystallographic characterization of anti-CD20 crystals remained elusive until now.
Here, we show the first systematic study of anti-CD20 crystallization, through which sulfate emerges as the anion of choice for the precipitation of this mAb. In addition to vapor diffusion mode, crystallization conditions of anti-CD20 were adapted to batch mode. Considering that batch is one of the preferred crystallization methods for large-scale application, our results could significantly contribute to the development of anti-CD20 crystallization for industrial applications. Finally, the diffraction quality of anti-CD20 crystals enabled X-ray diffraction experiments and the first crystallographic characterization of the antibody, an important step toward the unraveling of its full-length crystal structure.

2. Materials and Methods

2.1. Anti-CD20 Crystallization Experiments

Anti-CD20 monoclonal antibody was provided by FUJIFILM Diosynth Biotechnologies (Billingham, UK) in 25 mM sodium citrate at pH 6.5, as well as 154 mM sodium chloride solution at a high level of purity (>98% HPLC, >95% SDS-PAGE). Sodium sulfate anhydrous (purity ≥99.99%), ammonium sulfate (purity ≥99.0%), lithium sulfate (purity ≥99.99%), tetramethyl ammonium sulfate (purity ≥99.0%), aluminum sulfate (purity ≥99.99%), potassium sulfate (purity ≥99.0%), magnesium sulfate (purity ≥99.99%), PEG400, HEPES (purity ≥99.5%), and NaOH (purity ≥98%) from Sigma were used without further purification to prepare crystallization solutions. Distilled water was used. Anti-CD20 was thawed on ice for 2–3 h before buffer exchanging against HEPES 100 mM pH 6.8–8.2 (pH adjusted by NaOH) using an Amicon Ultra centrifugal filter tube (cut-off 30 kDa) at 7000× g and 4 °C. Anti-CD20 concentration was determined by measuring protein absorbance at 280 nm with a Microvolume ultraviolet–visible light (UV–Vis) spectrophotometer NanoDrop One (MW = 144.488 kDa, extinction coefficient at 280 nm = 237,380 M−1∙cm−1). Crystallization solutions were made by dissolving sulfate salts in the buffer solution with PEG400. All solutions used in crystallization tests were filtered through a 0.22-µm Syringe Filter Unit (Sartorius, Germany).
A systematic crystallization optimization was performed based on successful crystallization conditions. Concentrations of protein, precipitant, and PEG were varied by changing the starting condition from 2% to 10%, and various pH and temperature values were tested. Nucleation and crystal growth were recorded under a microscope for the best crystallization conditions.
In hanging drop crystallization experiments, drops made of 2 μL of precipitant solution and 2 μL of protein solution were equilibrated in a sealed well against 0.5 mL of the same precipitant solution used as a reservoir. Then, 24-well XRL plates (100) along with siliconized cover slips from Molecular Dimension were used for these experiments. Drops were manually set.
In the case of the batch method, the final volume solution ranged between 0.4 and 1 mL in a 1–2 mL Eppendorf tube, by keeping constant the protein solution and crystallization cocktail volume ratio. The solution in the Eppendorf tube was shaken on a platform at 100 rpm for 5 min. All crystallization solutions, whether using the hanging drop method or batch method, were put in a vibration-free refrigerator at 20 °C, and all the crystallization experiments were repeated with at least 12 hanging drops.

2.2. Analysis of Anti-CD20 Crystals

Crystals obtained from crystallization experiments were washed to remove protein in solution with a Costar® Spin-X® centrifuge tube filter (0.22-µm pore size). The washing solution was made of HEPES, Na2SO4, and PEG400, whose concentration was optimized to avoid crystal solubilization. Washed crystals were solubilized using 10 mM Tris-HCl, 150 mM NaCl, and pH 8.0, and analyzed by size-exclusion chromatography (SEC) and SDS-PAGE electrophoresis to check the presence of protein. SEC was performed using an Enrich650 BIORAD column equilibrated with three column volumes of elution buffer made of 10 mM Tris-HCl, 150 mM NaCl, and pH 8.0.

2.3. Mass Spectroscopy

SDS-PAGE gel bands of washed crystals obtained in reducing condition were analyzed by mass spectroscopy in MS/MS mode, to get information on the fragment ion spectrum. The digested mixture was separated by chromatography prior to mass spectroscopy. The peptide mass fingerprint was used to identify the protein primary sequence using the Mascot search engine (Supporting Materials).

2.4. X-ray Diffraction Analysis

Anti-CD20 crystals were analyzed by X-ray diffraction at the Diamond Light Source synchrotron (Didcot, UK) at beamline I04 and at the ESRF synchrotron (Grenoble, France) at beamline ID29. As single crystals were not of sufficient size and their density was too high to allow fishing, we collected a part of the sample using a standard cryo-loop, which was mounted on the goniometer and flash-cooled by liquid nitrogen. As crystals did not diffract at high resolution, the experimental set-up was adapted to collect low-resolution signals. Therefore, the smallest-radius beamstop was used, along with a very-low-energy beam (6 keV in the case of Diamond and 7 keV in the case of ESRF) and the highest sample-to-detector distance available at the beamline. Additionally, 100% transmittance and 10 s of exposure time were used to increase ring intensity. By using this set-up, well-separated Debye–Scherrer rings at very low resolution (>40 Å) could be observed. The DAWN program was used to mask and azimuthally integrate diffraction images to produce powder diffraction profiles [27]. For comparison, powder diffraction profiles from existing intact mAb crystal structures were calculated using the program Mercury v.2.9 [28], and compared using the program RootProf [29].

3. Results

3.1. Anti-CD20 Crystallization and Crystal Analysis

Several published anti-CD20 crystallization cocktails were tested, and protein crystallization only occurred with the cocktail containing PEG400, Na2SO4, and HEPES [25,26,30]. In addition to published conditions, screenings from Hampton Research (SaltRX, Index, and PEG/ION1&2) and from Molecular Dimension (Wizard 1&2, Wizard 3&4, JCSG, and PACT) were performed, but no protein crystal was observed.
By systematically optimizing the composition of this crystallization cocktail and the protein concentration, we found that 20–60 mg/mL of anti-CD20, 0.6–1.5 M Na2SO4, and 8–12% (w/v) PEG400 represent the ranges within which anti-CD20 crystallizes via vapor diffusion in the hanging drop set-up. Additionally, 0.1 M HEPES at a pH ranging between 6.8 and 8.1 is required as a buffer for the crystallization cocktail and protein solution. Regardless of the concentrations, this condition allows crystallizing the anti-CD20 protein as a microcrystalline powder. In order to obtain enough microcrystalline powder to characterize the sample, crystallization conditions were adapted to batch mode at the meso scale (see Section 3.6 for details). After exhaustive washing, anti-CD20 crystals were dissolved and analyzed by SEC, which showed a comparable retention time for the main peak obtained from crystals and anti-CD20 pristine solution (Supplementary Materials, Figure S1). SDS-PAGE electrophoresis of the main peak fraction showed a clear band at a molecular weight (MW) close to that expected for the intact anti-CD20 protein (MW = 144 kDa), and tandem mass spectrometry (MS/MS) performed on this band after trypsin digestion confirmed the presence of anti-CD20 (Supplementary Materials, Table S1). Apart from the main peak, SEC showed a small peak around 11 mL; such a peak was also present in the case of the anti-CD20 pristine solution and is likely related to protein aggregation. However, its area was not significant, being less than 7% of the area of the main peak.

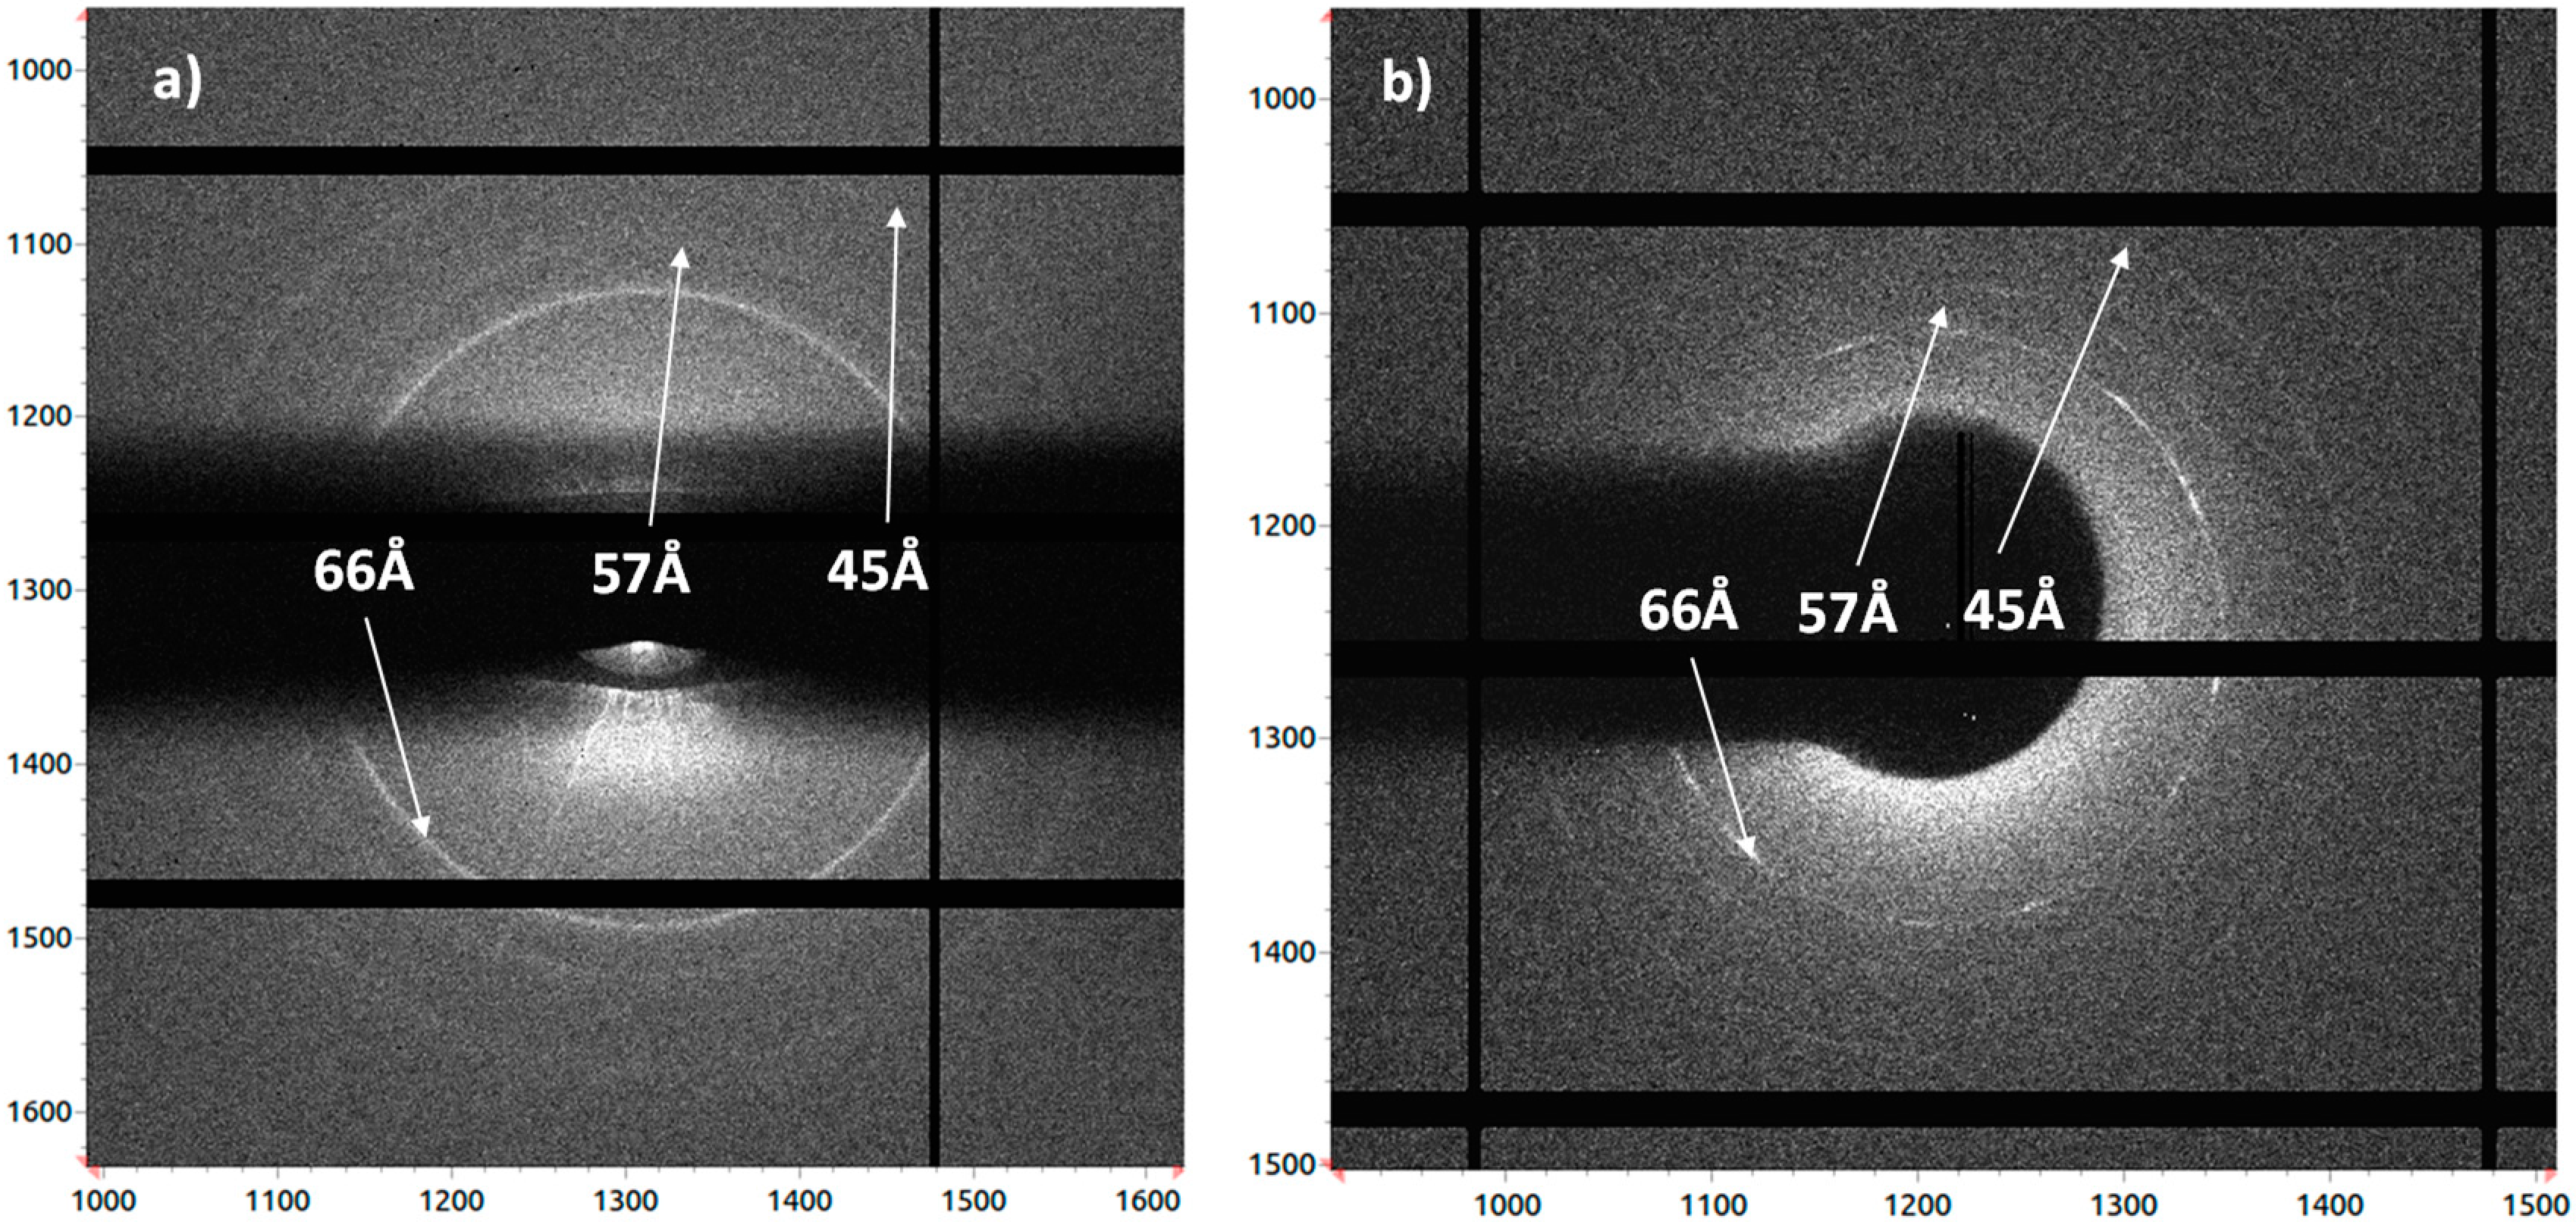
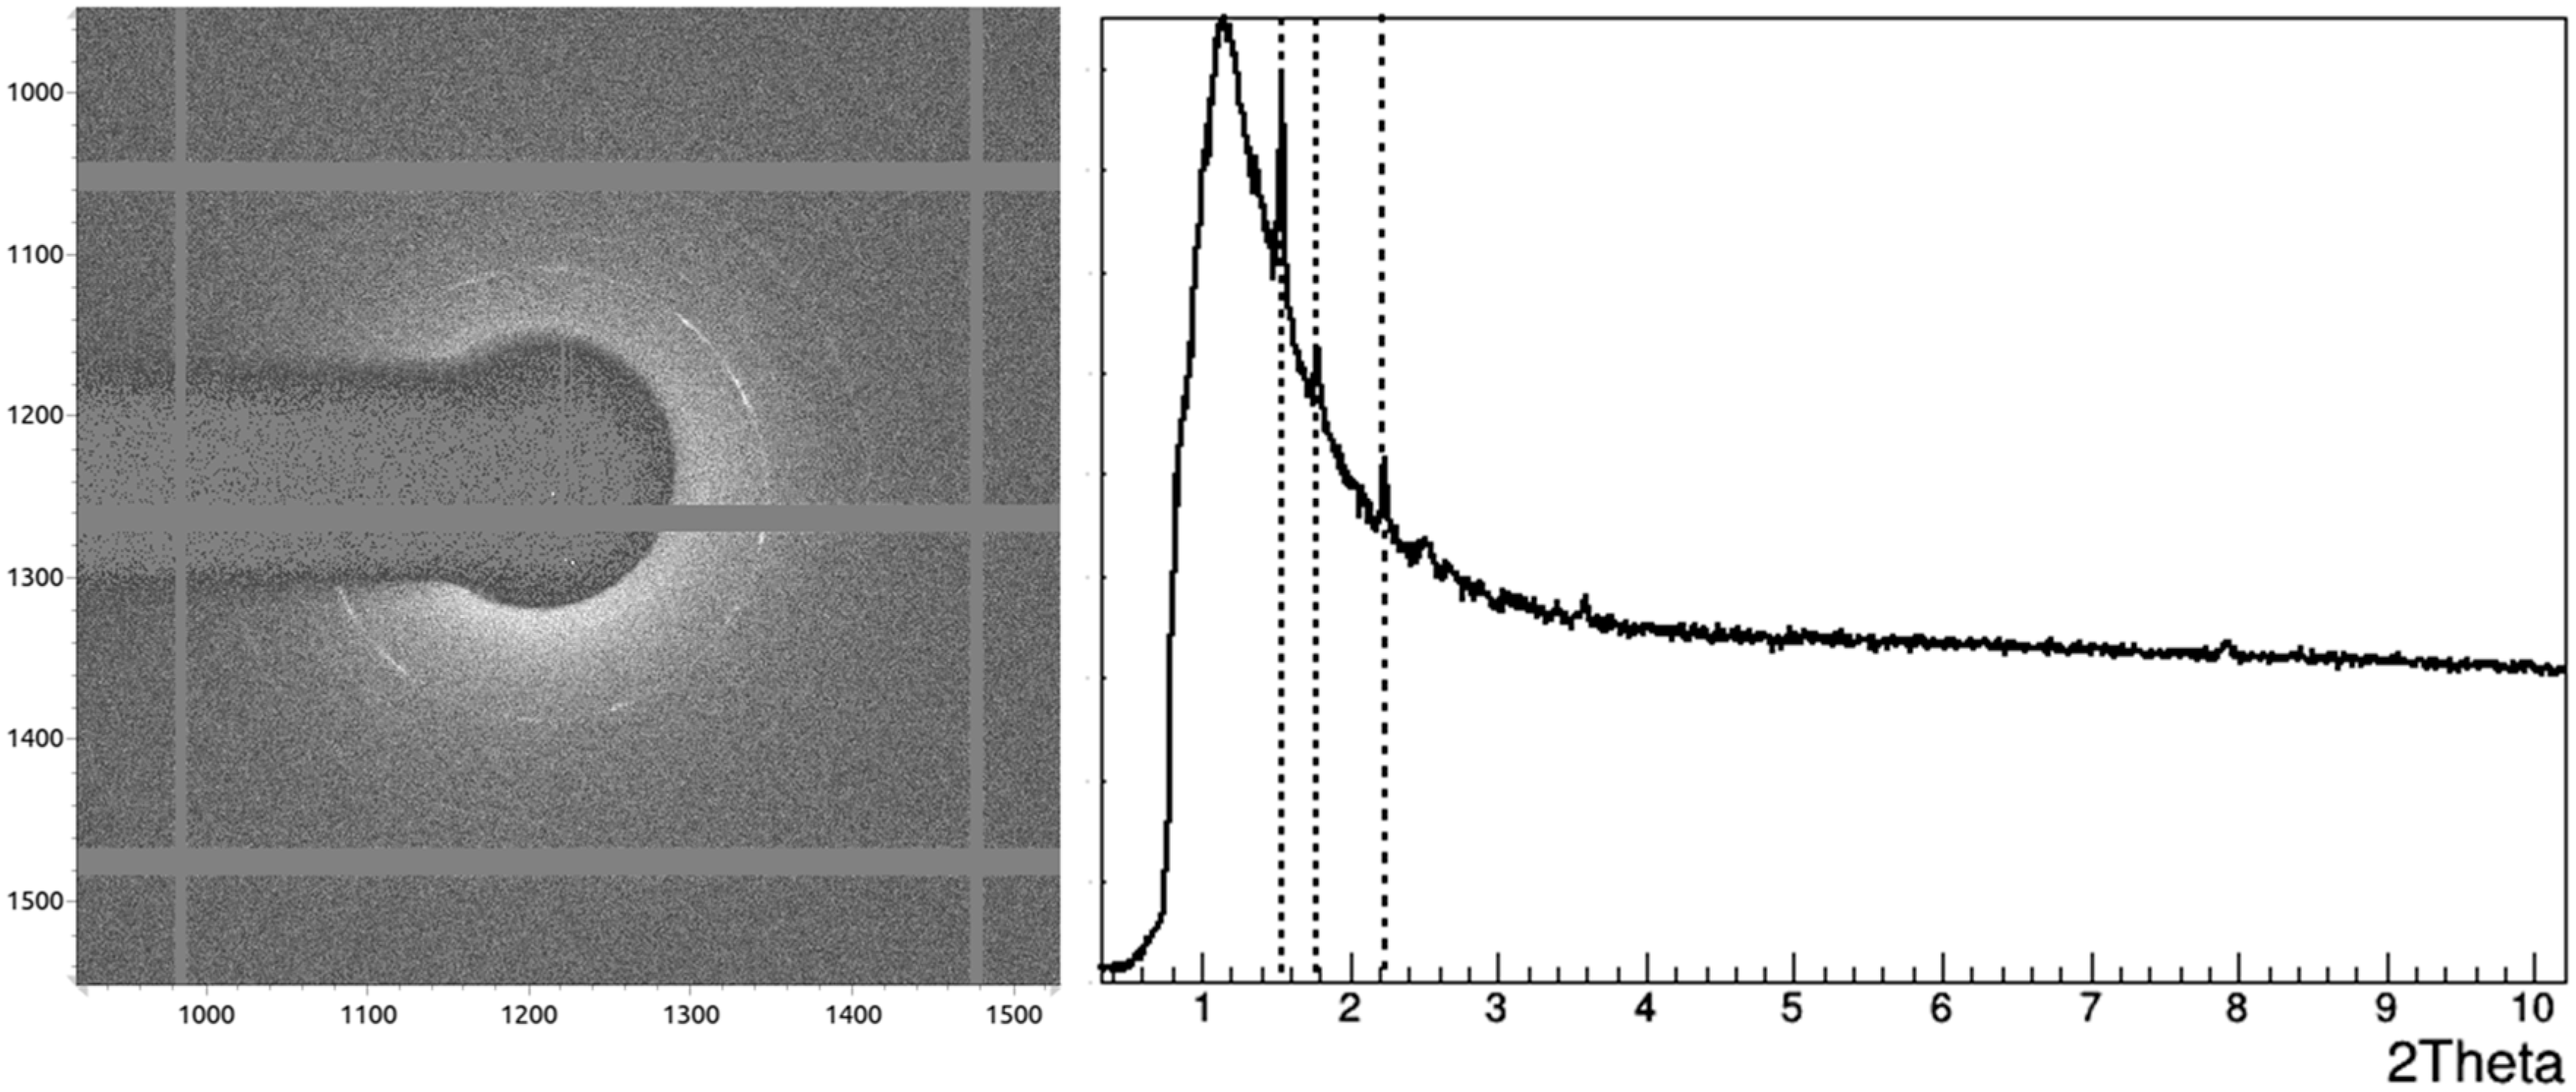
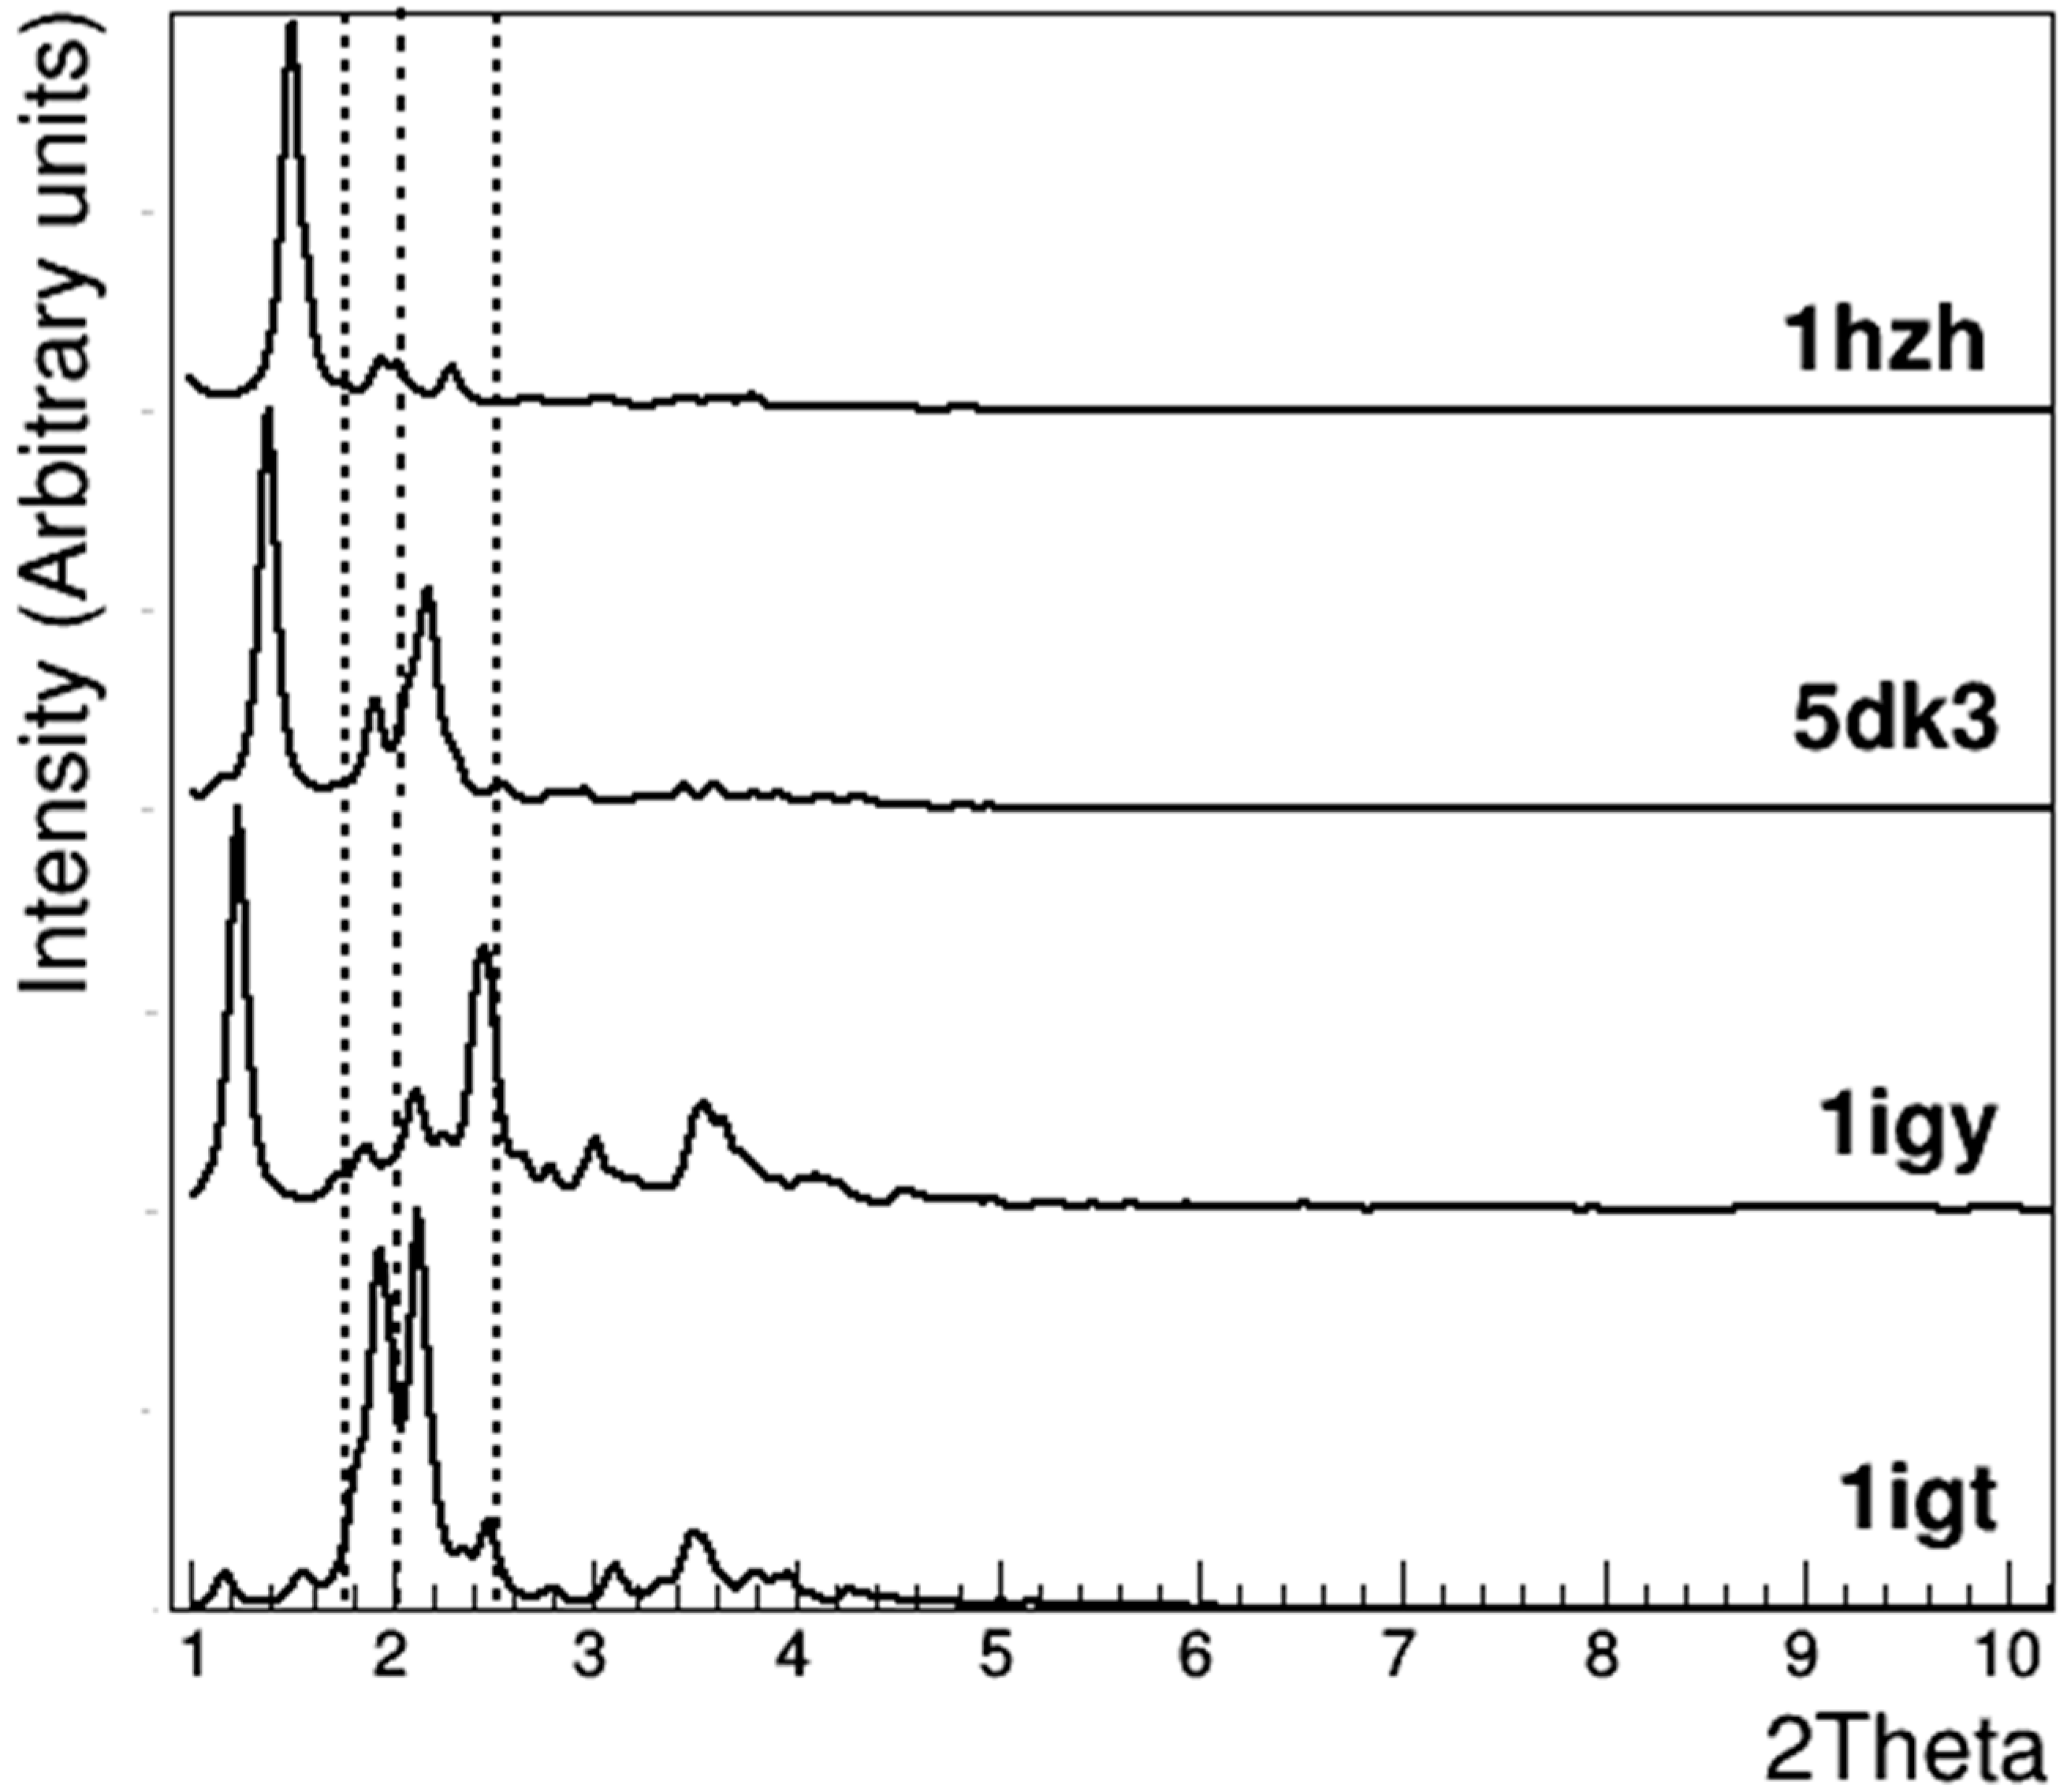
3.2. Crystallographic Analysis of Anti-CD20 Crystals

X-ray diffraction analysis was performed on the optimized anti-CD20 crystals obtained by batch mode (crystallization conditions provided in Section 3.6), to confirm that crystals were not salts, but made by proteins in crystal form. First attempts to obtain single-crystal diffraction patterns from the largest crystals with a micro-focused X-ray beam were unsuccessful. A detectable diffraction signal was instead obtained using many crystals under the X-ray beam, mimicking a microcrystalline powder sample. The simultaneous diffraction of randomly oriented microcrystals produced diffraction rings at 66 Å, 57 Å, and 45 Å (Figure 1), detected by an experimental set-up optimized for very-low-resolution data. We collected diffraction data from several anti-CD20 powder samples obtained using batch mode and a similar crystallization cocktail; interestingly, diffraction images always contained the same diffraction rings, suggesting that they represent the signature of anti-CD20 crystals grown in these conditions.
Even if such diffraction rings were not enough to determine the crystal structure, they could be exploited to assess the presence of macromolecules in the crystal, containing information about the crystal packing. The occurrence of characteristic rings at very low resolution, as in Figure 1, is a peculiar feature of crystal samples having a large unit cell, such as crystals of macromolecules. Another peculiarity of powder samples with a large unit cell is the huge overlap of diffraction peaks along the 2θ axis, which increases at higher resolution (see Supplementary Materials for details). In protein samples, diffraction data resolution is also limited by the atomic thermal motion, which is larger than in small-molecule samples. All these features are consistent with those observed in Figure 1, where no rings appear at a resolution higher than 45 Å, thus confirming that crystals were made by macromolecules.
Experimental diffraction patterns were masked to correct for dead regions and noisy pixels in the detector, and subjected to azimuthal integration, to produce a powder diffraction pattern along the radial direction, as shown in Figure 2. The three rings produced sharp peaks in the powder diffraction profile, which emerged from the background. Their 2θ values, which depend on the X-ray energy used, represent the fingerprinting of our anti-CD20 crystal samples.
The few known crystal structures of whole mAbs are listed in Table 1, together with their crystallographic parameters and sequence identity with anti-CD20. They were used to calculate the powder diffraction profiles at the same wavelength as used in our diffraction analysis (λ = 2.06642 Å), which showed characteristic peaks in the same 2θ region of our samples (Figure 3). Figure 3 clearly shows that the high-resolution limit of the region populated by diffraction peaks was consistently shifted toward lower 2θ values as the cell volume increased (from the bottom to the top). Interestingly, the number and relative intensity of diffraction peaks from our crystals resembled those of the crystal structure 1HZH, which had the highest sequence identity with anti-CD20. This PDB-deposited structure is related to the human antibody IgG1 b12, which recognizes the CD4-binding site of human immunodeficiency virus-1 (HIV-1) gp120 [14,15]. The large volume of its crystal cell is due to the high crystallographic symmetry (space group H 3 2), which is able to accommodate 18 copies of the intact mAb in the unit cell. In the case of 1HZH, diffraction peaks were shifted at lower 2θ with respect to those of anti-CD20, a difference that could arise from the different unit cell parameters of the two crystals. The fact that anti-CD20 and 1HZH have similar powder diffraction profiles (same number of low-resolution peaks with same relative intensities) could suggest that their crystal structures have the same crystal packing and mAb conformation in the asymmetric unit. In this hypothesis, crystal cell parameters compatible with the anti-CD20 experimental powder diffraction pattern could be obtained (details are shown in the Supplementary Materials). Such a calculation showed that the position of the three peaks in the anti-CD20 experimental powder diffraction profile would coincide with those of the profile calculated from 1HZH if anti-CD20 had a hexagonal crystal cell with parameters (229, 229, 171) Å, corresponding to a crystal cell volume of 7,795,923 Å3 and a volume per atom of 40.7 Å3. A comparison with the values reported in Table 1 indicated that these values are fully plausible for an intact mAb crystal structure.

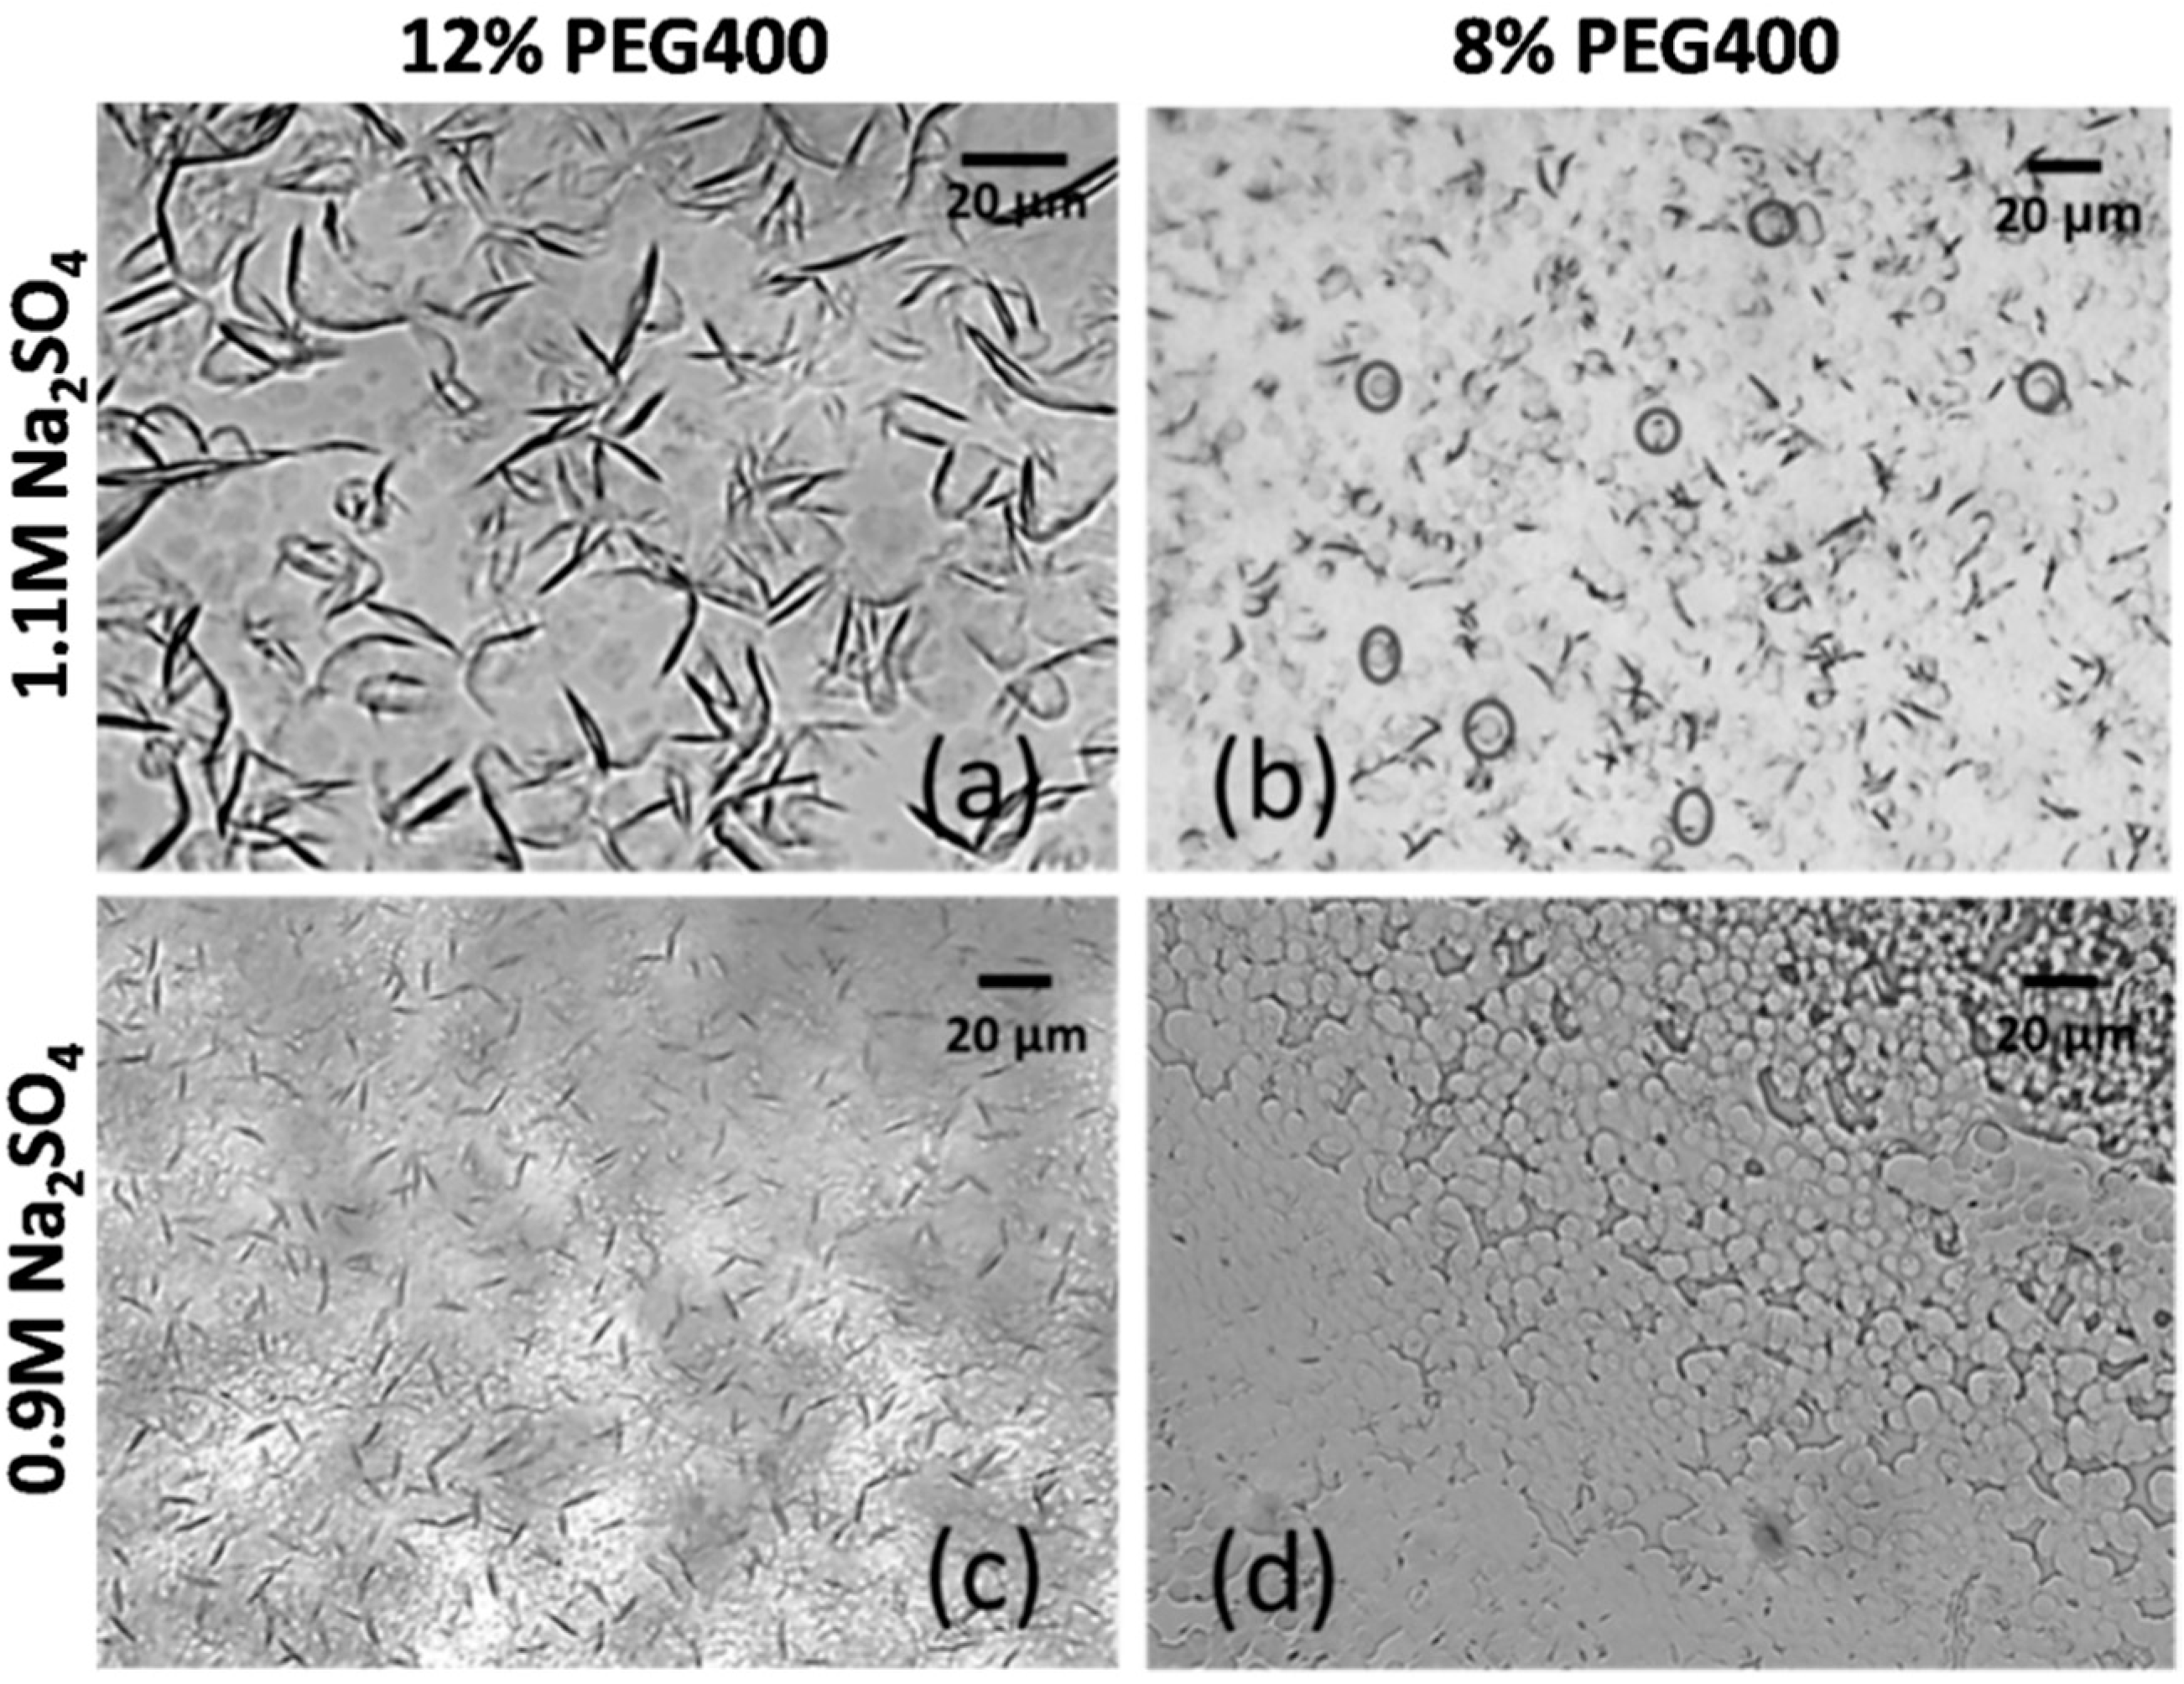
3.3. Crystal Morphological Analysis

Visible light microscopy was used to monitor anti-CD20 crystallization experiments. In the vapor diffusion hanging drop experiment, crystal growth preferentially occurred at the interface between the glass slide and the crystallization solution and resulted in bent needle-shaped crystals 1–2 μm wide and 10–50 μm long (Figure 4). The condition able to produce the largest crystals in the shortest time (1–2 days) along with the highest crystal density (up to 1 crystal/μm2) was represented by 30 mg/mL anti-CD20 in the presence of a crystallization cocktail made of 1.1 M Na2SO4, 12% (w/v) PEG400, and 0.1 M HEPES at pH 7.7 (Figure 4a). Such a condition was able to produce crystals with this morphology with a reproducibility >95%. It should be taken into account that the concentration of each chemical in the crystallization cocktail was nominal, because the solution resulted in liquid–liquid phase separation (LLPS). LLPS disappeared upon mixing the protein and crystallization cocktail and it formed again before or simultaneously with crystal growth (gray circles in Figure 4b). By increasing Na2SO4 and PEG400 to 1.5 M and 15% (w/v), respectively, the crystal size significantly reduced, while lower PEG400 and Na2SO4 concentrations (Figure 4b,c) were detrimental both for crystal density and the time of the appearance of the crystals (crystallization occurred in one week). The lowest concentrations of PEG400 or Na2SO4 at which crystallization was observed were 8% and 0.6 M, respectively. In this case, crystals appeared after two weeks, and the density of the crystals was the lowest observed.

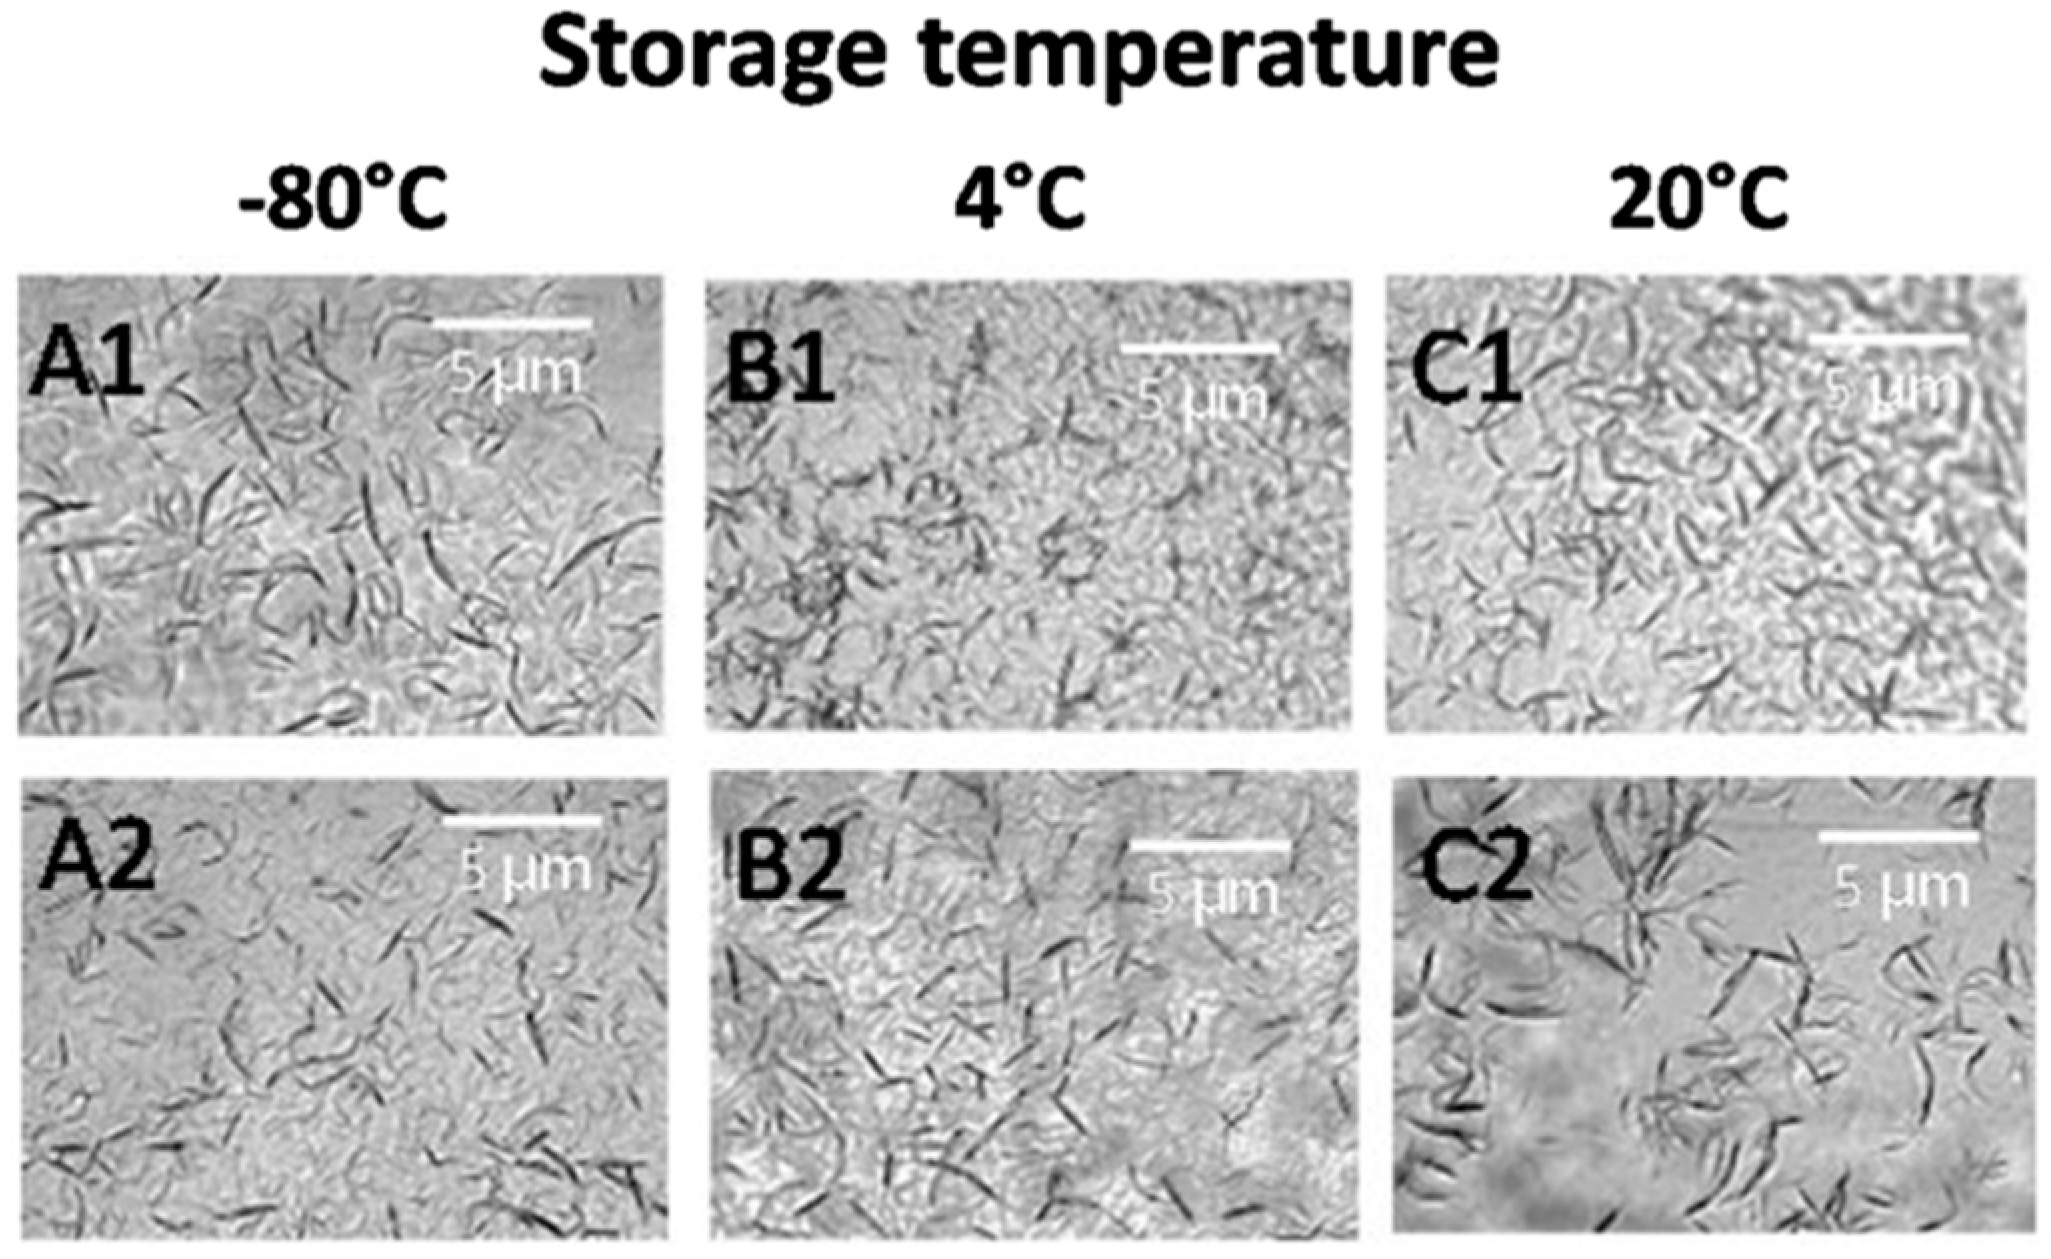
3.4. Effect of Storage Conditions on Anti-CD20 Crystallization

Antibodies were reported to be stable at 4 °C for weeks [32,33,34]. These conditions may not affect antibody functions, but they could alter the protein (particularly with respect to the aggregation or the conformational state) and, thus, the crystallization process [35]. With the aim of investigating the effect of storage conditions (temperature and time) on anti-CD20 crystallization, the protein solution underwent to several thawing/storage cycles before the crystallization experiment: (i) thawing–storage (−80 °C, seven days)–thawing; (ii) thawing–storage (−80 °C, seven days)–thawing–storage (−80 °C, seven days)–thawing; (iii) thawing–storage (4 °C, seven days); (iv) thawing–storage (4 °C, 14 days); (v) thawing–storage (20 °C, seven days); and (vi) thawing–storage (20 °C, 14 days). Crystallization tests were performed using 30 mg/mL anti-CD20 and a crystallization solution made of 0.9 M Na2SO4, 12% (w/v) PEG400, and 0.1 M HEPES at pH 7.7. Regardless of the storage conditions, needle-shaped crystals having similar sizes appeared after two days of equilibration against the reservoir (Figure 5). This indicates that storage conditions had a limited effect on the anti-CD20 crystal morphology. Conversely, a lower density of crystals was observed as time and temperature of storage increased. This result was expected because longer storage time usually has a detrimental effect on protein folding and homogeneity, which results in increased energy to form crystals, thus reducing the chances of crystallization [36,37]. This effect was magnified in the presence of a high storage temperature. Adding glycerol usually allows preserving the protein, particularly in the case of storage at low temperature; however, in our case, no effect on the crystallization results was observed by adding up to 20% glycerol.

3.5. Influence of Ions on mAb Crystallization

Our results point out sodium sulfate as the best precipitant to trigger anti-CD20 crystallization among the tested salts. Ion effectiveness toward protein precipitation increases with ion valence; thus, the sulfate anion is expected to be more important than the sodium cation in the salting-out process of anti-CD20. Nevertheless, the crystallization/precipitation process could significantly benefit from changing the counterion. Sodium, lithium, ammonium, magnesium, potassium, aluminum, and zinc sulfate salts, which represent the sulfate salts commonly used in protein crystallization, were tested as anti-CD20 precipitants in the presence of 12% (w/v) PEG400 and 0.1 M HEPES at pH 7.7. The maximum allowed concentration was very low in the case of potassium and aluminum sulfate due to their poor solubility in the presence of PEG400 and slightly basic pH; therefore, these salts were used at saturated concentration and no scanning of concentration was performed as in the case of other salts.
Results show that needle crystals appeared only in the case of sodium, lithium, and ammonium sulfate (Table 2); lithium and sodium were effective at 1.0 M, while a higher concentration was required in the case of ammonium (1.5 M). This result is not in agreement with the Hofmeister series, where the ammonium cation appears a better precipitant for protein than lithium and sodium. We speculate that such unexpected behavior is related to the different partitioning of these ions in the two forming phases of the LLPS. By using EPIsuite [38], we calculated that ammonium logP was about four units lower than that of sodium and potassium ions (logPNH4+ = −4.37, logPNa+ = logPLi+ = −0.77). These values suggest that salt concentration at equilibrium could be different in the two phases, although the same concentration of each sulfate salt was used to prepare the pristine crystallization cocktail. The Hofmeister series compare ions with the same concentration; thus, its predictive power in such a complicated solution environment is poor.
No crystallization/precipitation was observed using magnesium, zinc, aluminum, and potassium sulfate salts, regardless of concentration. It should be noted that, in the case of potassium, the absence of protein precipitation is most likely related to the low salt concentration rather than its poor ability in protein precipitation, which, according to the Hofmeister series, is second only to ammonium among the tested salts.
Regarding crystallization time, at 1.5 M of salt, crystals appeared at a shorter time in the case of ammonium sulfate (~3 days) than in the case of sodium (~5 days) and lithium (~7 days). Usually, crystal size increases as nucleation time reduces; however, in our case, crystal size decreased from sodium to ammonium and lithium. Moreover, no crystals/precipitate appeared after two months at a lower tested salt concentration (0.5 M).

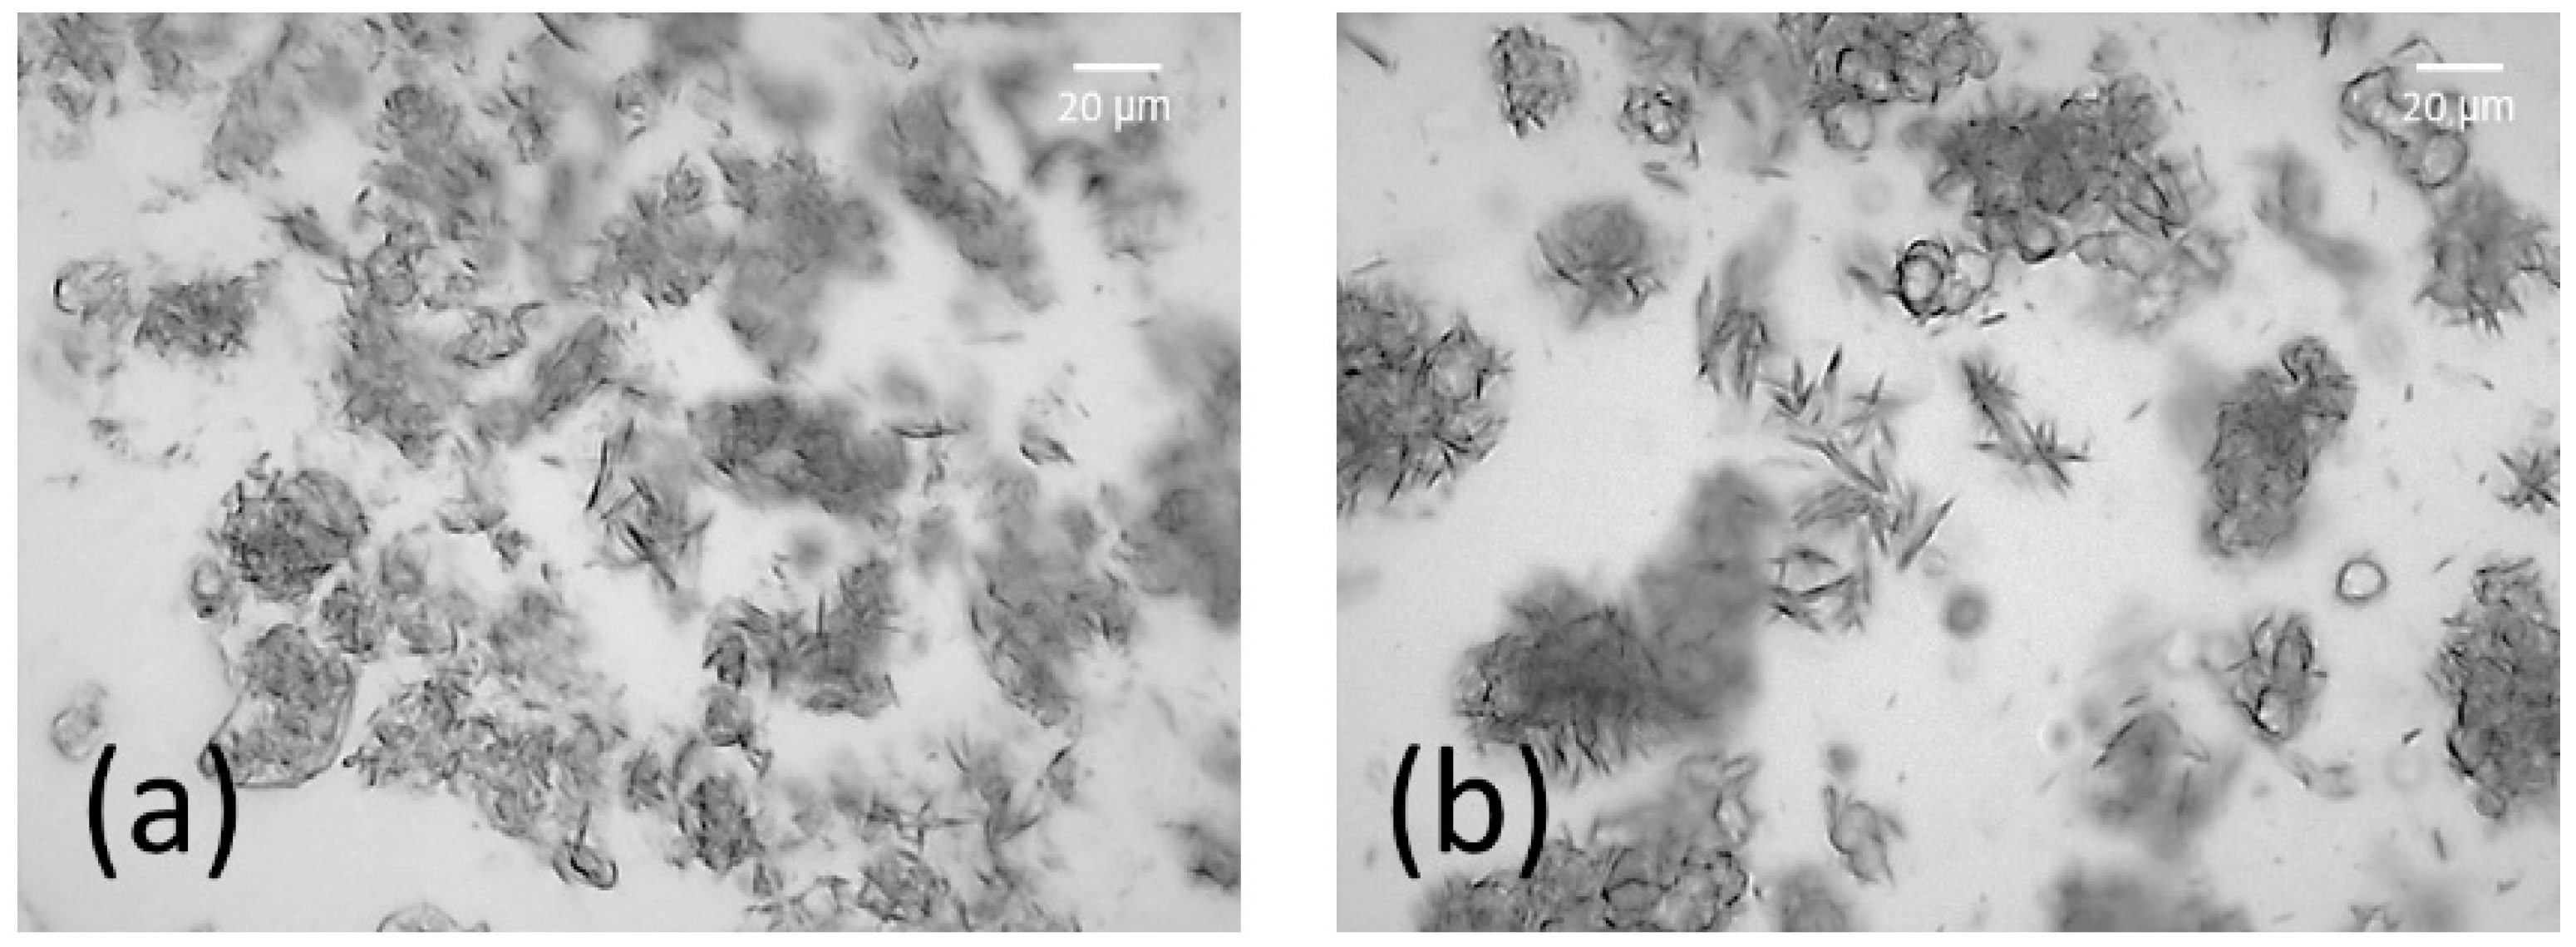
3.6. Meso Batch Crystallization

Our experiments identified a cocktail of chemicals suitable for crystallizing anti-CD20 in a very reproducible way using the vapor diffusion method. Such a result represents a valuable starting point to optimize anti-CD20 crystallization for set-ups that are usually preferred for large-scale processes. Particularly, in the case of batch mode, the concentration of each chemical is constant and instantly reached after mixing the protein and crystallization cocktail [39], unlike vapor diffusion where it continuously changes up to the equilibrium value. In order to optimize the crystallization conditions for batch mode, crystallization experiments of anti-CD20 using a final batch volume ranging from 400 μL to 1 mL were performed. Anti-CD20 crystals appeared using 60 mg/mL antibody, 770 mM sodium sulfate, and 24 wt.% PEG400 in the batch set-up (Figure 6). Such optimized conditions allow significantly reducing the time in which crystals appear (within 12 h) with respect to the vapor diffusion set-up (within 2–3 days). In this case, crystals appeared smaller than when using vapor diffusion and reached the maximum size within 12 h. However, the batch mode appeared detrimental for the density of crystals with respect to vapor diffusion and resulted in more pronounced LLPS than in the case of vapor diffusion. Because interface surface and phase dispersion significantly differ in the case of quiescent and non-quiescent crystallization, we compared the result of crystallization under stirring/shaking and static conditions. We observed that crystallization occurred in a similar manner in both cases, but stirring/shaking resulted in a larger quantity of amorphous precipitation, thus reducing crystallization yield. Such a result suggests that the interface process is important in the precipitation/crystallization of anti-CD20, as already observed using the vapor diffusion set-up. This is in agreement with many crystallization studies of mAbs [40,41,42]. Particularly, conditions close to the critical point of the meta stable LLPS promote crystal nucleation or precipitation because, in these conditions, crystal nuclei are surrounded by a liquid-like layer able to reduce interfacial free energy, thus resulting in faster nucleation [43].

4. Discussion

Among the physical forms in which drugs can be provided for final user use, the crystal form is one of the preferred because it ensures high stability and a high purity level of the active ingredients. However, particularly in the case of protein-based drugs, crystallization is not straightforward, especially at the industrial level. This is the case of anti-CD20, the first antibody sold for clinical use, for which we observed a low reproducibility of the published crystallization condition in our labs. It is worth noting that such a lack of reproducibility of published anti-CD20 crystallization conditions was already observed in literature [44], suggesting that the mechanism is not clear and the crystallization process is very sensitive to small deviations of relevant variables. As an example, we observed that the phosphate salts and phosphate-buffered saline (PBS), suggested in Reference [26] as a precipitant for efficient anti-CD20 crystallization, resulted in a clear drop. Similarly, calcium acetate, along with PEG 1K and imidazole [30] led to salt crystal aggregates. Our experiments also showed that some crystallization cocktails reported in the literature could not be prepared, because concentrations of the cocktail components were over the solubility in that condition (e.g., the cocktail containing sodium sulfate and PEG400 in Reference [30]). Therefore, starting from crystallization cocktails reported in the literature, extensive optimization was required to get anti-CD20 crystals in a reproducible way in our labs. Initially, we focused on the vapor diffusion crystallization method and found that the sulfate anion is required for anti-CD20 crystallization along with PEG400 and a pH between 6.8 and 8.1. This could be the consequence of the very narrow crystallization window we found for anti-CD20 in the presence of such a cocktail, particularly in the case of sodium sulfate. In addition, at the concentration required for crystallization, PEG400 and sodium sulfate resulted in LLPS formation, and, in the presence of such phase separation, it got more difficult defining the true concentration of the chemicals in the phase where crystals appear. Our condition to produce largest crystals in the shortest time and with the highest density (Figure 4a) appears slightly different from that previously reported [30] (sodium sulfate concentrate reduced from 1.36 M to 1.1 M; HEPES 0.1 M at pH 7.7 is used instead of Tris 0.1 M pH 7.5; 30 mg/mL anti-CD20 is used instead of 20); however, very importantly, it allows producing crystals in the absence of the seeding procedure, which was necessary in the reported condition.
Once optimized, the sulfate salt/PEG400 condition provided crystals of needle shape having a width of ~2 μm and a length of up to 50 μm, using the vapor diffusion hanging drop set-up; crystallization occurred only in the presence of sodium, lithium, or ammonium sulfate. The storage time and temperature were found to affect anti-CD20 crystallization; indeed, as storage time increased from seven to 14 days and temperature from −80 °C to 20 °C, a lower number of crystals were obtained by keeping constant the cocktail composition. Finally, the crystallization cocktail able to produce larger crystals in a shorter time through vapor diffusion was optimized for batch at the meso scale. After mixing the protein solution and crystallization cocktail, the final concentrations of PEG400 and protein were 12% (w/v) and 30 mg/mL, respectively. These values are in agreement with those at equilibrium in the case of the vapor diffusion mode. Interestingly, sodium sulfate concentration was much lower than expected, being about three times lower (385 mM) than the concentration at equilibrium in vapor diffusion (1.1 M). Batch crystallization provided crystals having the same morphology as those obtained through vapor diffusion, but in a shorter time (12 h vs. 2–3 days in the case of vapor diffusion) and having a smaller size. In this case, the quantity of powder crystal was large enough to prepare a sample for X-ray powder diffraction analysis. By analyzing the X-ray diffraction patterns, we observed that the resolution of the diffraction rings and their spacing were compatible with protein only and not salt. This result represents the first direct evidence of the presence of anti-CD20 in crystal form, since, until now, anti-CD20 crystals were analyzed only using techniques unable to distinguish between protein in solution, in amorphous or in crystal form [25].

Supplementary Materials

The following are available online at https://www.mdpi.com/2073-4352/9/5/230/s1, Figure S1: Size Exclusion Chromatography for anti-CD20 from washed and dissolved crystals (solid line) and from pristine solution (dashed line) (a). SDS-PAGE electrophoresis performed on-washed and dissolved crystals (b); Figure S2: Powder diffraction profiles calculated at the same wavelength (2.06642 Å) from the crystal structure of (a) sodium citrate (CCDC code 1478189) and (b) Fc fragment of human immunoglobulin G1 (PDB code 3AVE). Molecules are shown in stick-and-ball (a) and cartoon (b) representations. Diffraction reflections are indicated by lines below the 2q axis; Table S1: Mascot analysis of peptide fingerprint of digested band from anti-CD20 crystals. Only the sequence showing the best match with experimental data is shown.

Author Contributions

Conceptualization, R.C., G.D.P and J.Y.Y.H.; methodology, G.D.P., B.D.B., H.Y.; investigation, H.Y., B.D.B., X.L., T.F.M.; data curation, H.Y., B.D.B.; writing—original draft preparation, H.Y., B.D.B., R.C., J.Y.Y.H.; writing—review and editing, H.Y., B.D.B., R.C., J.Y.Y.H., W.C., T.F.M., G.D.P.; supervision, R.C., J.Y.Y.H, G.D.P.; funding acquisition, R.C., J.Y.Y.H, G.D.P.

Funding

This research was funded by the European Union’s Horizon 2020, Future and Emerging Technologies program (FET-OPEN), AMECRYS project (http://www.amecrys-project.eu/) under grant agreement no. 712965, and by the EPSRC (EP/N015916/1).

Acknowledgements

The authors would like to thank the European Synchrotron Radiation Facility for providing access to beamline ID29 (proposal number MX1750), and the Diamond Light Source for access to beamline I04 (proposal number MX15832-1). The authors also thank the BSRC Mass Spectrometry and Proteomics Facility supported by Wellcome Trust (grant number 094476/Z/10/Z) which funded the purchase of the TripleTOF 5600 mass spectrometer at the BSRC Mass Spectrometry and Proteomics Facility, University of St Andrews.

Conflicts of Interest

The authors declare no conflict of interest.

References

  1. Urquhart, L. Market watch: Top drugs and companies by sales in 2017. Nat. Rev. Drug Discovery 2018, 232, 17. [Google Scholar] [CrossRef] [PubMed]
  2. Kelley, B. Industrialization of mAb production technology the bioprocessing industry at a crossroads. Mabs 2009, 1, 443–452. [Google Scholar] [CrossRef] [PubMed]
  3. Hummel, J.; Pagkaliwangan, M.; Gjoka, X.; Davidovits, T.; Stock, R.; Ransohoff, T.; Gantier, R.; Schofield, M. Modeling the Downstream Processing of Monoclonal Antibodies Reveals Cost Advantages for Continuous Methods for a Broad Range of Manufacturing Scales. Biotechnol. J. 2018, 14, 1700665. [Google Scholar] [CrossRef] [PubMed]
  4. Soetaert, W.; Vandamme, E. The impact of industrial biotechnology. Biotechnol. J. 2006, 1, 756–769. [Google Scholar] [CrossRef] [PubMed]
  5. Yang, H.; Rasmuson, Å.C. Investigation of batch cooling crystallization in a liquid–liquid separating system by PAT. Organ. Process Res. Develop. 2012, 16, 1212–1224. [Google Scholar] [CrossRef]
  6. Yang, H.; Chen, W.; Peczulis, P.; Heng, J.Y.Y. Development and Workflow of a Continuous Protein Crystallization Process: A Case of Lysozyme. Cryst. Growth Des. 2019, 19, 983–991. [Google Scholar] [CrossRef]
  7. Govada, L.; Chayen, N.E. Choosing the Method of Crystallization to Obtain Optimal Results. Crystals 2019, 9, 106. [Google Scholar] [CrossRef]
  8. Nanev, C.N. Peculiarities of Protein Crystal Nucleation and Growth. Crystals 2018, 8, 422. [Google Scholar] [CrossRef]
  9. Nanev, C.N. Recent Insights into Protein Crystal Nucleation. Crystals 2018, 8, 219. [Google Scholar] [CrossRef]
  10. Koizumi, H.; Uda, S.; Fujiwara, K.; Okada, J.; Nozawa, J. Effect of an External Electric Field on the Kinetics of Dislocation-Free Growth of Tetragonal Hen Egg White Lysozyme Crystals. Crystals 2017, 7, 170. [Google Scholar] [CrossRef]
  11. Hekmat, D. Large-scale crystallization of proteins for purification and formulation. Bioprocess Biosyst. Eng. 2015, 38, 1209–1231. [Google Scholar] [CrossRef] [PubMed]
  12. Harris, L.J.; Larson, S.B.; Hasel, K.W.; McPherson, A. Refined structure of an intact IgG2a monoclonal antibody. Biochemistry 1997, 36, 1581–1597. [Google Scholar] [CrossRef] [PubMed]
  13. Harris, L.J.; Skaletsky, E.; McPherson, A. Crystallographic structure of an intact IgG1 monoclonal antibody. J. Mol. Biol. 1998, 275, 861–872. [Google Scholar] [CrossRef]
  14. Saphire, E.O.; Parren, P.W.H.I.; Barbas, C.F.; Burton, D.R.; Wilson, I.A. Crystallization and preliminary structure determination of an intact human immunoglobulin, b12: An antibody that broadly neutralizes primary isolates of HIV-1. Acta Crystallogr. D 2001, 57, 168–171. [Google Scholar] [CrossRef] [PubMed]
  15. Saphire, E.O.; Parren, P.W.H.I.; Pantophlet, R.; Zwick, M.B.; Morris, G.M.; Rudd, P.M.; Dwek, R.A.; Stanfield, R.L.; Burton, D.R.; Wilson, I.A. Crystal structure of a neutralizing human IgG against HIV-1: A template for vaccine design. Science 2001, 293, 1155–1159. [Google Scholar] [CrossRef] [PubMed]
  16. Hasegawa, H.; Wendling, J.; He, F.; Trilisky, E.; Stevenson, R.; Franey, H.; Kinderman, F.; Li, G.; Piedmonte, D.M.; Osslund, T.; et al. In Vivo Crystallization of Human IgG in the Endoplasmic Reticulum of Engineered Chinese Hamster Ovary (CHO) Cells. J. Biol. Chem. 2011, 286, 19917–19931. [Google Scholar] [CrossRef] [PubMed] [Green Version]
  17. Smejkal, B.; Agrawal, N.J.; Helk, B.; Schulz, H.; Giffard, M.; Mechelke, M.; Ortner, F.; Heckmeier, P.; Trout, B.L.; Hekmat, D. Fast and Scalable Purification of a Therapeutic Full-Length Antibody Based on Process Crystallization. Biotech. Bioeng. 2013, 110, 2452–2461. [Google Scholar] [CrossRef]
  18. Smith, M.R. Rituximab (monoclonal anti-CD20 antibody): Mechanisms of action and resistance. Oncogene 2003, 22, 7359–7368. [Google Scholar] [CrossRef]
  19. Appelbaum, F. Treatment of aggressive non-Hodgkin’s lymphoma with marrow transplantation. Marrow Transplant. Rev. 1993, 3, 1993–1996. [Google Scholar]
  20. Pescovitz, M.D. Rituximab, an anti-CD20 monoclonal antibody: History and mechanism of action. Am. J. Transplant. 2006, 6, 859–866. [Google Scholar] [CrossRef]
  21. Kelley, B. Very large scale monoclonal antibody purification: The case for conventional unit operations. Biotechnol. Progr. 2007, 23, 995–1008. [Google Scholar] [CrossRef]
  22. Utturkar, A.; Gillette, K.; Sun, C.Y.; Pagkaliwangan, M.; Quesenberry, R.; Schofield, M. A Direct Approach for Process Development Using Single Column Experiments Results in Predictable Streamlined Multi-Column Chromatography Bioprocesses. Biotechnol. J. 2019, 14, 1800243. [Google Scholar] [CrossRef]
  23. Grilo, A.L.; Mateus, M.; Aires-Barros, M.R.; Azevedo, A.M. Monoclonal Antibodies Production Platforms: An Opportunity Study of a Non-Protein-A Chromatographic Platform Based on Process Economics. Biotechnol. J. 2017, 12, 1700260. [Google Scholar] [CrossRef]
  24. Franzreb, M.; Müller, E.; Vajda, J. Cost estimation for protein A chromatography. Bioprocess Int. 2014, 12, 44–52. [Google Scholar]
  25. Yang, M.X.; Shenoy, B.; Disttler, M.; Patel, R.; McGrath, M.; Pechenov, S.; Margolin, A.L. Crystalline monoclonal antibodies for subcutaneous delivery. Proc. Natl. Acad. Sci. USA 2003, 100, 6934–6939. [Google Scholar] [CrossRef] [Green Version]
  26. Wilkins, J.A.; Oshodi, S.A.; Lobo, B.; Breece, T. Crystallization of Anti-cd20 Antibodies. U.S. Patent US20110020322A1, 27 January 2011. [Google Scholar]
  27. Basham, M.; Filik, J.; Wharmby, M.T.; Chang, P.C.; El Kassaby, B.; Gerring, M.; Aishima, J.; Levik, K.; Pulford, B.C.; Sikharulidze, I. Data analysis workbench (DAWN). J. Synchrotron Rad. 2015, 22, 853–858. [Google Scholar] [CrossRef]
  28. Macrae, C.F.; Bruno, I.J.; Chisholm, J.A.; Edgington, P.R.; McCabe, P.; Pidcock, E.; Rodriguez-Monge, L.; Taylor, R.; van de Streek, J.; Wood, P.A. Mercury CSD 2.0-new features for the visualization and investigation of crystal structures. J. Appl. Crystallogr. 2008, 41, 466–470. [Google Scholar] [CrossRef]
  29. Caliandro, R.; Belviso, D.B. RootProf: Software for multivariate analysis of unidimensional profiles. J. Appl. Crystallogr. 2014, 47, 1087–1096. [Google Scholar] [CrossRef]
  30. Shenoy, B.; Govardhan, C.P.; Yang, M.X.; Margolin, A.L. Crystals of whole Antibodies and Fragments Thereof and Methods for Making and Using Them. U.S. Patent US7833525B2, 16 November 2010. [Google Scholar]
  31. Scapin, G.; Yang, X.Y.; Prosise, W.W.; Mccoy, M.; Reichert, P.; Johnston, J.M.; Kashi, R.S.; Strickland, C. Structure of full-length human anti-PD1 therapeutic IgG4 antibody pembrolizumab. Nat. Struct. Mol. Biol. 2015, 22, 953–958. [Google Scholar] [CrossRef]
  32. Voak, D.; Sacks, S.; Alderson, T.; Takei, F.; Lennox, E.; Jarvis, J.; Milstein, C.; Darnborough, J. Monoclonal anti-A from a hybrid-myeloma: evaluation as a blood grouping reagent. Vox Sanguinis 1980, 39, 134–140. [Google Scholar] [CrossRef]
  33. Zheng, J.Y.; Janis, L.J. Influence of pH, buffer species, and storage temperature on physicochemical stability of a humanized monoclonal antibody LA298. Int. J. Pharm. 2006, 308, 46–51. [Google Scholar] [CrossRef]
  34. Wang, W.; Nema, S.; Teagarden, D. Protein aggregation-Pathways and influencing factors. Int. J. Pharm. 2010, 390, 89–99. [Google Scholar] [CrossRef]
  35. Ng, J.D.; Lorber, B.; Witz, J.; TheobaldDietrich, A.; Kern, D.; Giege, R. The crystallization of biological macromolecules from precipitates: Evidence for Ostwald ripening. J. Cryst. Growth 1996, 168, 50–62. [Google Scholar] [CrossRef]
  36. Mullin, J.W. Crystallization; Butterworth Heinemann: Oxford, UK, 2001. [Google Scholar]
  37. Biscans, B.; Laguerie, C. Determination of Induction Time of Lysozyme Crystals by Laser Diffraction. J. Phys. D Appl. Phys. 1993, 26, B118–B122. [Google Scholar] [CrossRef]
  38. EPA. Estimation Programs Interface Suite™ for Microsoft® Windows, V 4.11; United States Environmental Protection Agency: Washington, DC, USA, 2012.
  39. Arakawa, T.; Timasheff, S.N. Mechanism of Poly(Ethylene Glycol) Interaction with Proteins. Biochemistry 1985, 24, 6756–6762. [Google Scholar] [CrossRef]
  40. Timasheff, S.N. Protein-solvent preferential interactions, protein hydration, and the modulation of biochemical reactions by solvent components. Proc. Natl. Acad. Sci. USA 2002, 99, 9721–9726. [Google Scholar] [CrossRef] [Green Version]
  41. Hildebrandt, C.; Mathaes, R.; Saedler, R.; Winter, G. Origin of Aggregate Formation in Antibody Crystal Suspensions Containing PEG. J. Pharm. Sci. 2016, 105, 1059–1065. [Google Scholar] [CrossRef]
  42. Rakel, N.; Galm, L.; Bauer, K.C.; Hubbuch, J. Influence of Macromolecular Precipitants on Phase Behavior of Monoclonal Antibodies. Biotechnol. Progr. 2015, 31, 145–153. [Google Scholar] [CrossRef]
  43. Ten Wolde, P.R.; Frenkel, D. Enhancement of protein crystal nucleation by critical density fluctuations. Science 1997, 277, 1975–1978. [Google Scholar] [CrossRef]
  44. Hagewiesche, A.M.C.; Fukami, J.; Cromwell, M.E.; Dinges, R.B. Crystallization of Antibody or Fragment Thereof. U.S. Patent US8008447B2, 30 August 2011. [Google Scholar]
Figure 1. X-ray diffraction images of optimized anti-cluster of differentiation 20 (CD20) crystal powder obtained in the same crystallization conditions (60 mg/mL of antibody, 770 mM sodium sulfate, and 24 wt.% PEG400 in batch set-up) collected at Diamond Light Source (a) and ESRF (b) synchrotrons, using primary X-ray beams at 6 keV and 7 keV, respectively. The data resolution of the diffraction rings is shown. The uneven ring intensity in Figure 1b can be ascribed to the non-uniform orientation of crystallites.
Crystals 09 00230 g001
Figure 2. Anti-CD20 diffraction image. Noisy and dead detector pixels were masked by choosing proper threshold cut-offs (left), and image intensities were azimuthally integrated to produce a one-dimensional powder diffraction pattern (right).
Crystals 09 00230 g002
Figure 3. Powder diffraction profiles calculated at the same wavelength (2.06642 Å) from the crystal structures of whole monoclonal antibodies (mAb) currently present in the Protein Data Bank, listed in Table 1, which were ordered according to the crystal cell volume, going from bottom (smaller volume) to top (larger volume). Dashed lines indicate the 2θ values of the diffraction peaks found in powder diffraction profiles from anti-CD20 crystals.
Crystals 09 00230 g003
Figure 4. Visible microscopy images of anti-CD20 crystals obtained through hanging drop vapor diffusion after seven days of equilibration. Crystals were obtained using 30 mg/mL anti-CD20 and a crystallization solution containing (a) 1.1 M Na2SO4 and 12% (w/v) PEG400, (b) 1.1 M Na2SO4 and 8% (w/v) PEG400, (c) 0.9 M Na2SO4 and 12% (w/v) PEG400, and (d) 0.9 M Na2SO4 and 8% (w/v) PEG400. Crystallizing solutions were buffered by 0.1 M HEPES at pH 7.7. Phase separation is shown by a gray circle in (b).
Crystals 09 00230 g004
Figure 5. Visible light microscopy images of anti-CD20 crystals obtained through hanging drop vapor diffusion after seven days. (A1,A2) show crystals obtained using protein which underwent to one and two cycles of thawing/storage (−80 °C, seven days), respectively. (B1,B2) are related to crystals obtained using a single cycle of thawing/storage at 4 °C for seven and 14 days, respectively. (C1,C2) differ from (B1,B2) in storage temperature only (20 °C).
Crystals 09 00230 g005
Figure 6. Visible light microscopy images of anti-CD20 crystals obtained using batch mode: (a) after three days under static conditions, and (b) after the seventh day under stirring conditions.
Crystals 09 00230 g006
Table 1. Properties and crystallographic parameters of known crystal structures of intact monoclonal antibodies (mAbs). CD20—cluster of differentiation 20.
1IGT [12]1IGY [13]5DK3 [31]1HZH [14,15]
mAb typeIgG1IgG1IgG4IgG1
OrganismMus musculusMus musculusHumanHuman
Sequence identity with anti-CD20 (%)60648387
Space groupP 1P 21P 212121H 3 2
Crystal cell parameters (Å)65.8, 76.8, 100.666.7, 190.7, 73.163.8, 110.8, 265.0271.3, 271.3, 175.2
Crystal cell volume (Å3)503,852874,7671,874,40111,168,087
Volume per atom (Å3)48.342.743.658.3
Table 2. Results of anti-CD20 crystallization after seven days using several sulfate salts at different concentrations.
SaltSalt Concentration
0.5 M1.0 M1.5 M
Na 2 SO 4 Clear dropNeedle-like crystalsNeedle-like crystals
Li 2 SO 4 Clear dropNeedle-like crystalsNeedle-like crystals
( NH 4 ) 2 SO 4 Clear dropClear dropNeedle-like crystals
MgSO 4 Clear dropClear dropClear drop
ZnSO 4 Clear dropClear dropClear drop

