Abstract
The kinetics of the non-isothermal and isothermal crystallization of the crystalline smectic B phase (soft crystal B, SmBcr) in 4-n-butyloxybenzylidene-4′-n′-octylaniline (BBOA) was studied by a combination of differential scanning calorimetry (DSC), broadband dielectric spectroscopy (BDS) and polarized optical microscopy (POM). On cooling, part of the SmBcr phase undergoes conversion to a crystalline phase and the remainder forms a glassy state; after the glass softens, crystallization is completed during subsequent heating. By analyzing the area of the crystal growing in the texture of SmBcr as a function of time, the evolution of degree of crystallinity, D(t), was estimated. It was demonstrated that upon heating, D(t) follows the same Avrami curve as the crystallization during cooling. Non-isothermal crystallization observed during slow cooling rates (3K/min ≤ ϕ ≤ 5K/min) is a thermodynamically-controlled process with the energy barrier Ea ≈ 175 kJ/mol; however, the crystallization occurring during fast cooling (5 K/min > ϕ ≥ 30K/min) is driven by a diffusion mechanism, and is characterized by Ea ≈ 305 kJ/mol. The isothermal crystallization taking place in the temperature range 274 K and 281 K is determined by nucleus formation.
1. Introduction
Crystallization is defined as the formation of a solid phase with a long-range order composed of repeated units called unit cells. This intriguing phenomenon is commonly observed for various organic [1,2] and inorganic [3,4,5] systems upon cooling below their melting temperature (melt crystallization), which is in line with thermodynamics, i.e., Gibbs free energy is higher for the isotropic liquid than for a crystal. There is also a large group of materials which can be easily supercooled into a glassy state, from which so-called “cold” crystallization can be observed during heating, after softening of the glass. Despite intensive research efforts, the process of crystallization is a complex one and little is understood of its nature and control. Crystallization occurs through two inseparable steps [6], nucleation and crystal growth, and it is governed by the interplay between thermodynamic driving force and molecular mobility [7,8,9,10]. Transformation into the macroscopic crystal is possible only if its constituent nuclei overcome the activation energy associated with their critical size [11]. This can be achieved by maintaining the sample within the optimal temperature range for nucleation and crystal growth (isothermal crystallization) or cooling it slowly enough to form a new phase (non-isothermal crystallization). The latter is of great importance in industrial processes, which often take place under non-isothermal conditions. Investigations of non-isothermal processes allow the temperature range of studies to be extended beyond that accessible to isothermal measurements. Both kinds of experiments are necessary to elucidate the full crystallization pattern of a material.
Crystallization is also observed for liquid crystals (LCs), which are characterized by a variety of mesophases with different degrees of ordering, and some demonstrate rich solid-state polymorphism [12]. It was found that the crystallization process in LCs is influenced by structure of the initial phase and thermal history of the sample. Although there are several scientific studies concerning the formation of three-dimensional (3D) crystalline solids from the nematic phase (N) [13,14,15,16,17,18], little attention is paid to crystallization from highly-ordered crystal-like smectic phases. An interesting example in this regard is the crystallization of the smectic B (SmB) phase in 4-n-butyloxybenzylidene-4′-n′-octylaniline (BBOA, also abbreviated as 4O.8). Calorimetric measurements found BBOA to possess a rich mesomorphism on heating [19]: Cr -310.5K - SmB -321.1K - SmA -335.3K - N-351.0K-I. Interestingly, upon cooling, an additional phase transition from the SmBhex to the SmBCr phase (also called “soft crystal” [20]) was observed at 287 K [21]. X-ray experiments demonstrate that while both phases show a hexagonal arrangement of molecules within the smectic layer, they differ with regard to their molecular correlation length [22]. Broadband dielectric spectroscopy (BDS) studies indicate that the SmBhex to the SmBCr transition is also characterized by retardation of the flip-flop rotation of molecules around their short axis accompanied by an increase of activation energy. Moreover, the SmBCr phase can vitrified if the substance is quenched or crystallized during very slow cooling.
The present paper describes a detailed study of the crystallization behaviour of SmBcr of 4-n-butyloxybenzylidene-4′-n′-octylaniline (BBOA) under isothermal and non-isothermal conditions using a combination of broadband dielectric spectroscopy (BDS), differential scanning calorimetry (DSC) and polarized optical microscopy (POM). To determine the mechanism of the crystallization process, the DSC data were analysed according to approaches proposed by Ozawa and Mo. The findings for the non-isothermal process were compared with those regarding isothermal crystallization obtained from BDS studies.
2. Materials and Methods
2.1. Material
The BBOA material was supplied from the Institute of Chemistry, Military University of Technology, Warsaw, Poland and used as received. The substance was synthesized according to the procedure outlined elsewhere [23]. The purity was determined to be better than 99.5% using the ASTM E928 Standard Test Method for Determining Purity by differential scanning calorimetry [24]. At the beginning of every measurement, the substance was heated up above melting temperature and was kept for 3 min to ensure complete melting.
2.2. Broadband Dielectric Spectroscopy (BDS)
To carry out BDS measurements, BBOA powder was heated to the isotropic phase between two circular electrodes with a diameter of 10 mm, which were separated by Teflon spacers to avoid a short circuit. The complex dielectric functions were measured at the frequency range 0.1−107 Hz by means of a high-precision dielectric analyzer (ALPHA analyzer; Novocontrol Technologies, Montabaur, Germany) at the selected temperatures. The sample temperature was stabilized with an accuracy better than 0.1 K by a Novocool temperature controller. Pure nitrogen gas was used as the heating agent.
2.3. Differential Scanning Calorimetry (DSC)
DSC measurements were performed for several cooling/heating rates for a 7.17 mg sample using a DSC 2500 Differential Scanning Calorimeter (TA Instruments, New Castle, Delaware, USA). Temperature modulated DSC (MDSC) measurements were taken with the DSC 2500 under a nitrogen atmosphere at a heating rate of 3 K min−1 with a temperature modulation amplitude of 0.5 K and modulation period of 60 s.
2.4. Polarizing Optical Microscopy (POM)
The temperature evolutions of the textures were observed using a Biolar PI polarizing light microscope (PZO, Warsaw, Poland) in combination with a Linkam THM600 heating stage (Linkam Scientific Instruments, Tadworth, UK). The temperature of the sample was controlled with a high degree of accuracy (± 0.1 K) using a flow of liquid nitrogen. The thickness of the layer was about 50 µm. The degree of crystallinity D(t) was determined by the graphical analysis of textures by means of GIMP graphics application software (open source). The growing crystalline phase regions were marked in black, whereas the remaining parts of the SmBcr phase were marked in white using the color curves tool in GIMP. The percentage cover of the whole texture layer by the crystalline area is provided in a colored histogram. The value of D(t) is given by:
where SCr(t) is the area of the texture related to the new Cr phase and S is the total surface area of the texture.
3. Results and Discussion
3.1. Non-Isothermal Crystallization Processes as Followed Using DSC and POM
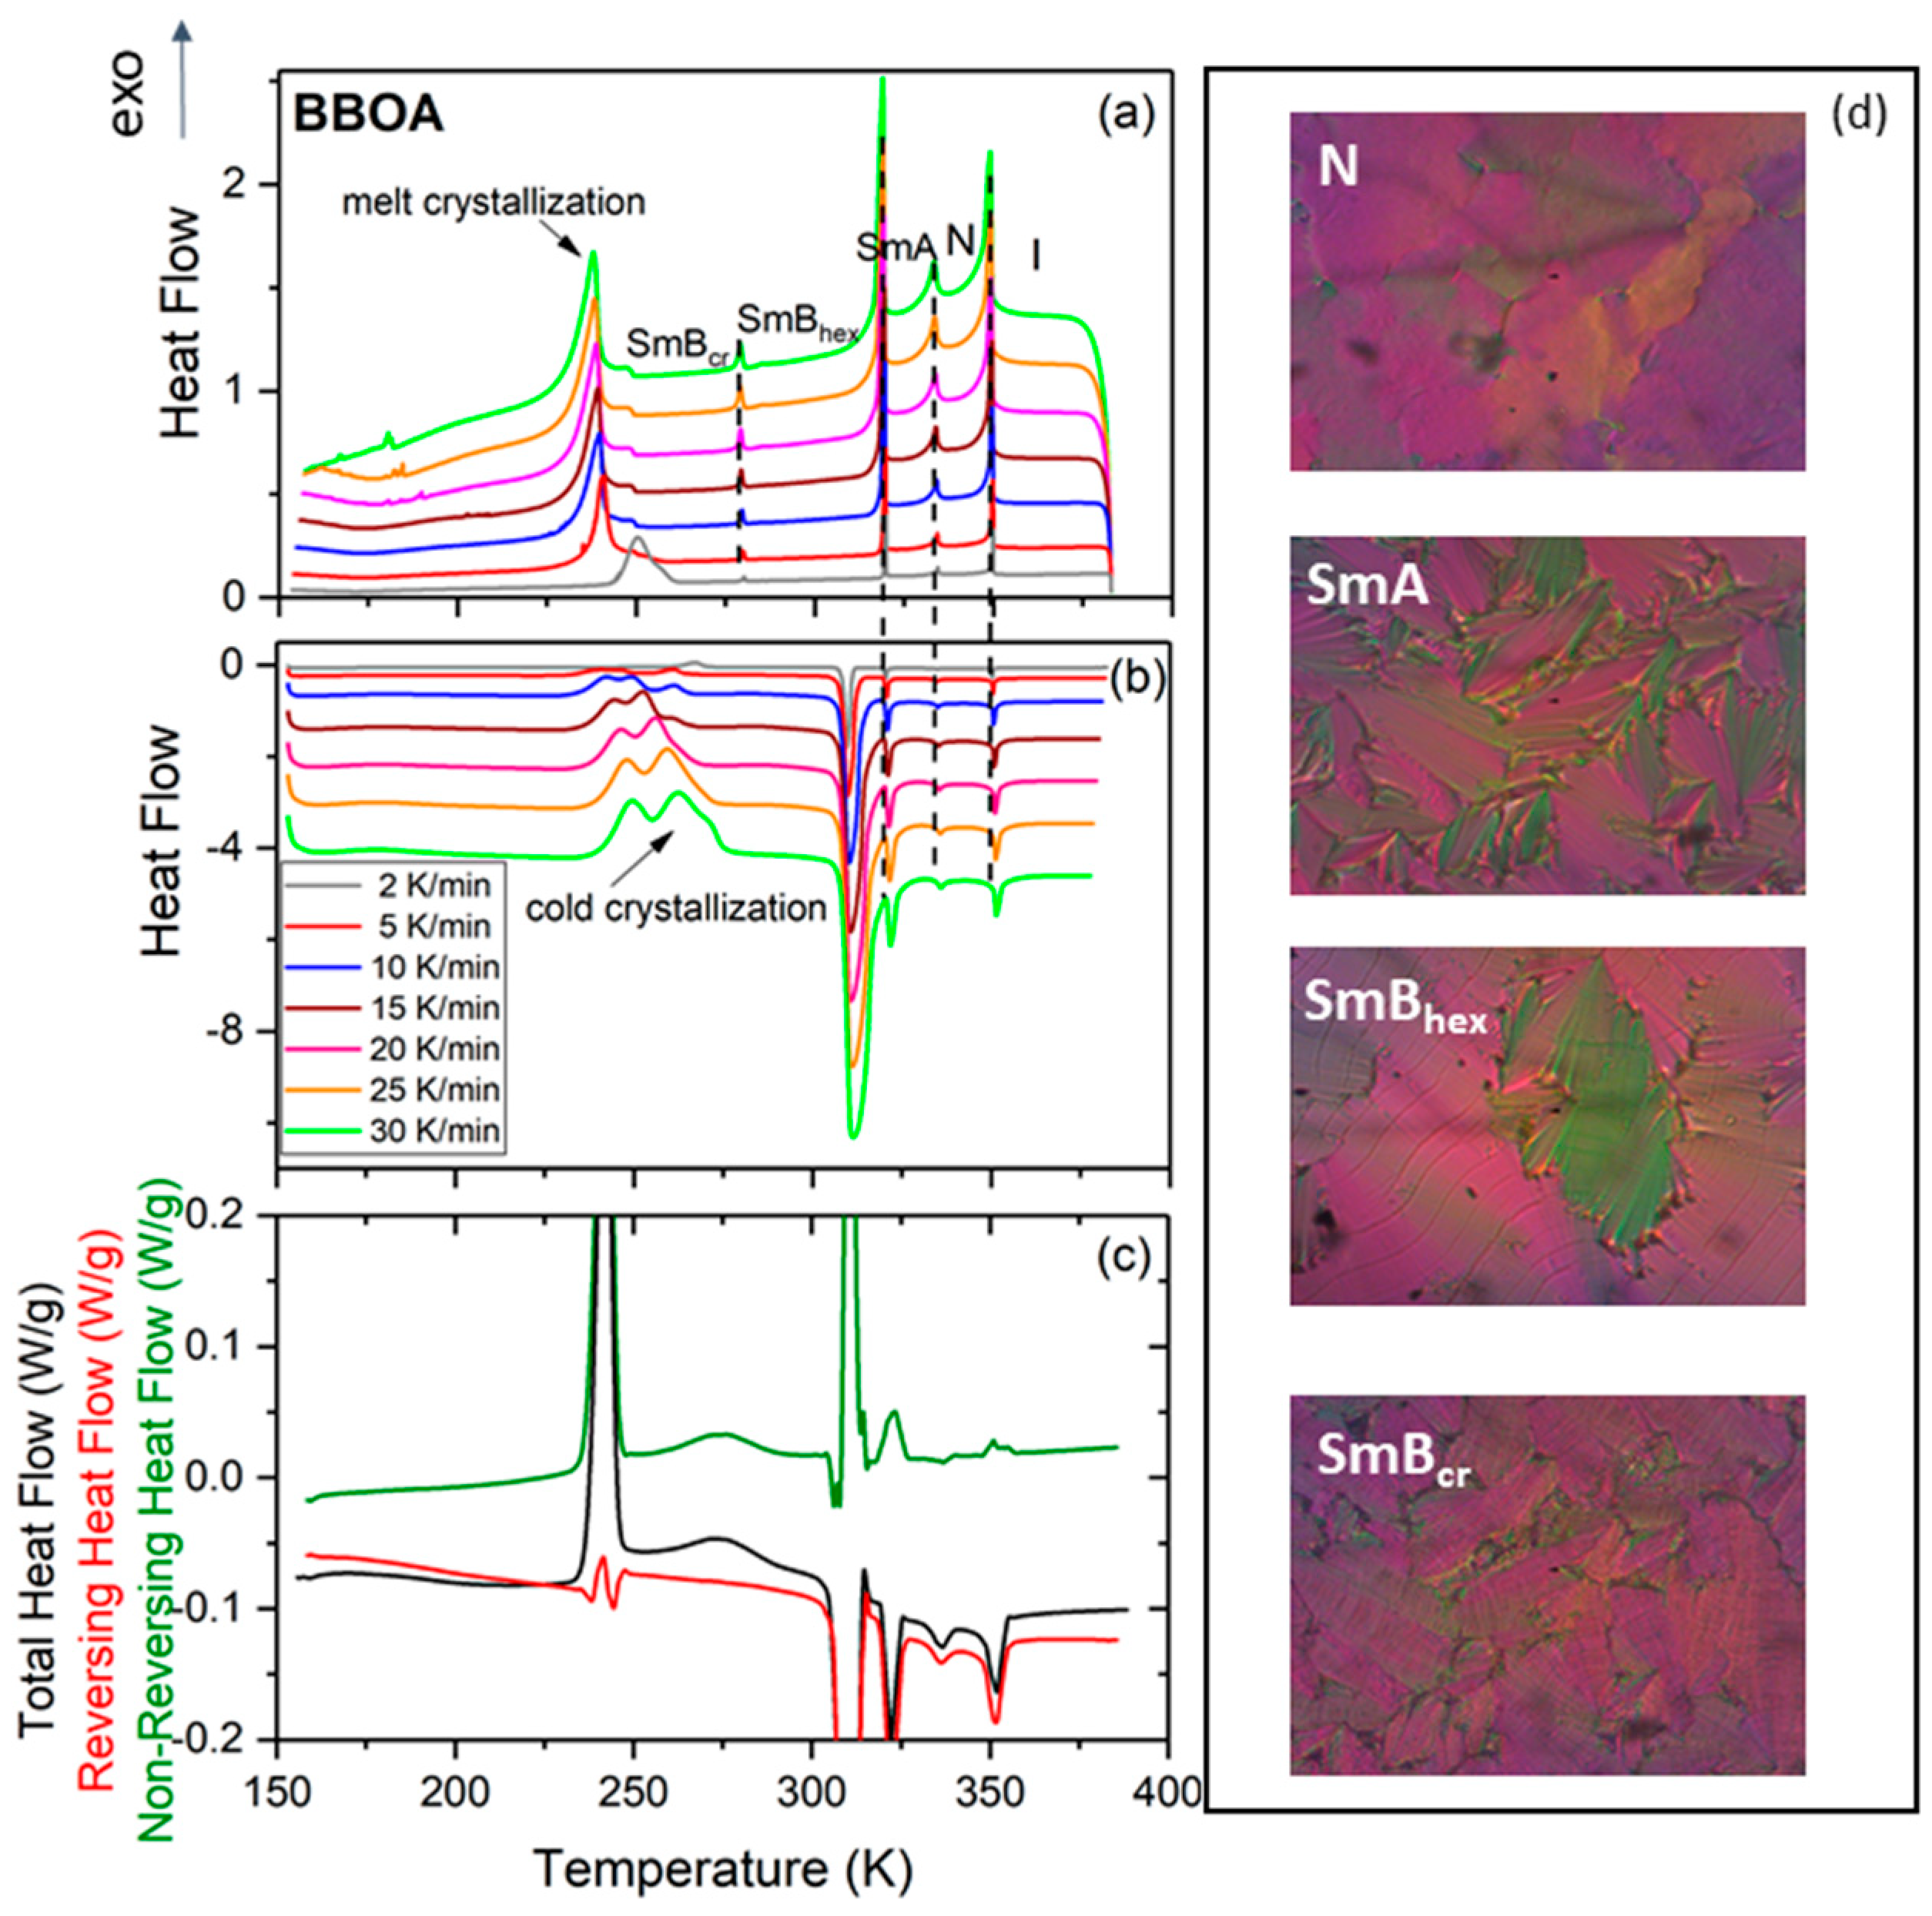
To elucidate the tendency of BBOA to crystallize upon cooling under various conditions, the study first examined the kinetics of non-isothermal crystallization by means of DSC measurements at various cooling rates (see Figure 1a). Upon cooling, BBOA shows four mesophases with increasing degrees of molecular order: N-SmA-SmBhex-SmBcr as confirmed by the texture analysis (Figure 1). Following this, the SmBcr phase undergoes partial crystallization while the remaining volume of the sample vitrifies. Upon subsequent heating at a rate of 5 K/min, a complex cold crystallization consisting of a broad exothermal peak with three maxima at around 241 K, 249 K and 261 K was observed in the metastable SmBcr; this shifted towards higher temperatures as the heating rate increased.
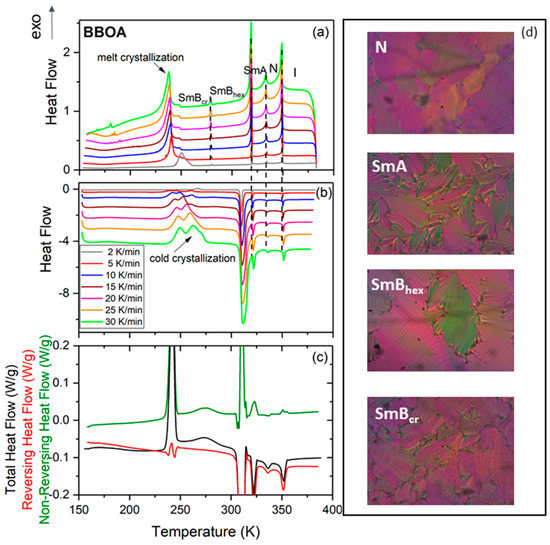
Figure 1.
Differential scanning calorimetry (DSC) thermograms of 4-n-butyloxybenzylidene-4′-n′-octylaniline (BBOA) obtained at various rates of cooling (a) and heating (b). (c) MDSC thermogram of BBOA obtained for a heating rate 3 K min−1 with a modulation amplitude of 0.5 K for a period of 60 s. (d) Exemplary textures of BBOA in various mesophases as indicated.
This finding supports those of earlier adiabatic calorimetry studies, which found that two metastable crystalline phases become transformed to a stable crystalline phase [19]. To obtain data equivalent to these adiabatic calorimetric findings, BBOA was measured in the modulated DSC mode (MDSC), which provides more information than conventional DSC experiments [25]. MDSC benefits from the fact that it calculates the kinetic component from the total heat flow and its heat capacity component. The total signal is equivalent to standard DSC; the reversing signal provides information on heat capacity and melting, while the non-reversing signal shows cold crystallization and crystal perfection. The non-reversing heat flow, illustrated by the green curve in Figure 1c, shows two well-separated anomalies at 241 K and 273 K, associated with cold crystallization, as well as a complex melting of the ordered crystal phase at about 310 K. The curve also shows less intense anomalies describing phase transitions between the SmA, N and I phases.
In contrast to the DSC measurements, the cold crystallization Figure 1b,c is a well-separated two-step process with a very intense and sharp peak at 241 K and a broader one at 273 K. The latter peak most likely describes an additional ordering of molecules. The anomaly at about 310 K, demonstrating an SmB-SmA phase transition, appears to be a separated two-step process (according to the non-reversing heat flow curve), while DSC measurements indicate an unresolved pair of anomalies in the form of a single broad peak. The higher-temperature anomalies associated with the non-reversing heat flow, i.e., above 310 K, are not very intensive, in contrast to the analogous anomalies observed on the total heat flow. These anomalies correspond to phase transitions between mesophases with a characteristic ordering of SmA, N and I phases; the SmA and N phases show lack of any crystal ordering, i.e., they possess only orientational ordering, while the I phase does not display any ordering.
By integrating the crystallization peak of the DSC thermograms presented in Figure 1a, the relative degree of the non-isothermal crystallization (D) for each cooling rate can be determined as a temperature function [26]:
Here, T0 and T∞ are temperatures at which the crystallization process respectively begins and ends, whereas dH/dT represents the heat flow at a given temperature T. To take into account the fact that only partial crystallization occurs upon cooling, and that the recrystallization of supercooled SmBcr (cold crystallization) is then observed upon heating, the value determined from Equation (2) was multiplied by the ratio of the peak area obtained on cooling and heating. The temperature dependences of D are presented in Figure 2c. The degree of crystallization that was achieved upon cooling decreases with increasing cooling rate, from D = 89% (ϕ = 2 K/min) to D = 13% (ϕ = 30 K/min).
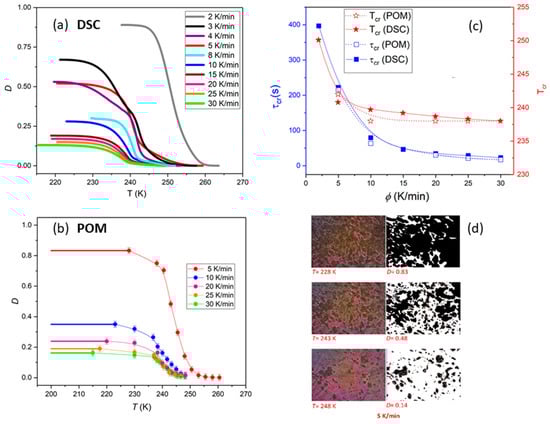
Figure 2.
(a) Temperature dependences of the crystallization degree D(T) determined from DSC measurements with different cooling rates ϕ. (b) Increase of degree of crystallinity with decreasing temperature obtained from the graphical analysis of the BBOA textures for various cooling rates. (c) Comparison of the crystallization temperature Tc and crystallization characteristic time τcr determined by DSC and polarized optical microscopy (POM) studies. τcr was assumed as time needed to achieve 63% of maximal crystallinity degree that was found upon cooling. (d) Evolution of textures during non-isothermal crystallization of the sample cooled down with the rate 5 K/min. The error bars are smaller than the symbols, if not explicitly stated otherwise.
The growth of the crystal Cr from SmBcr upon cooling was also monitored by polarized microscopy (POM) observations of the texture evolution as described in the experimental section. It is evident in Figure 2b,d that the crystalline centers grow equally in all directions and their number increases with decreasing temperature. The crystallization temperature Tc and crystallization characteristic time τcr determined using POM are in good agreement with the values obtained by DSC (Figure 2c).
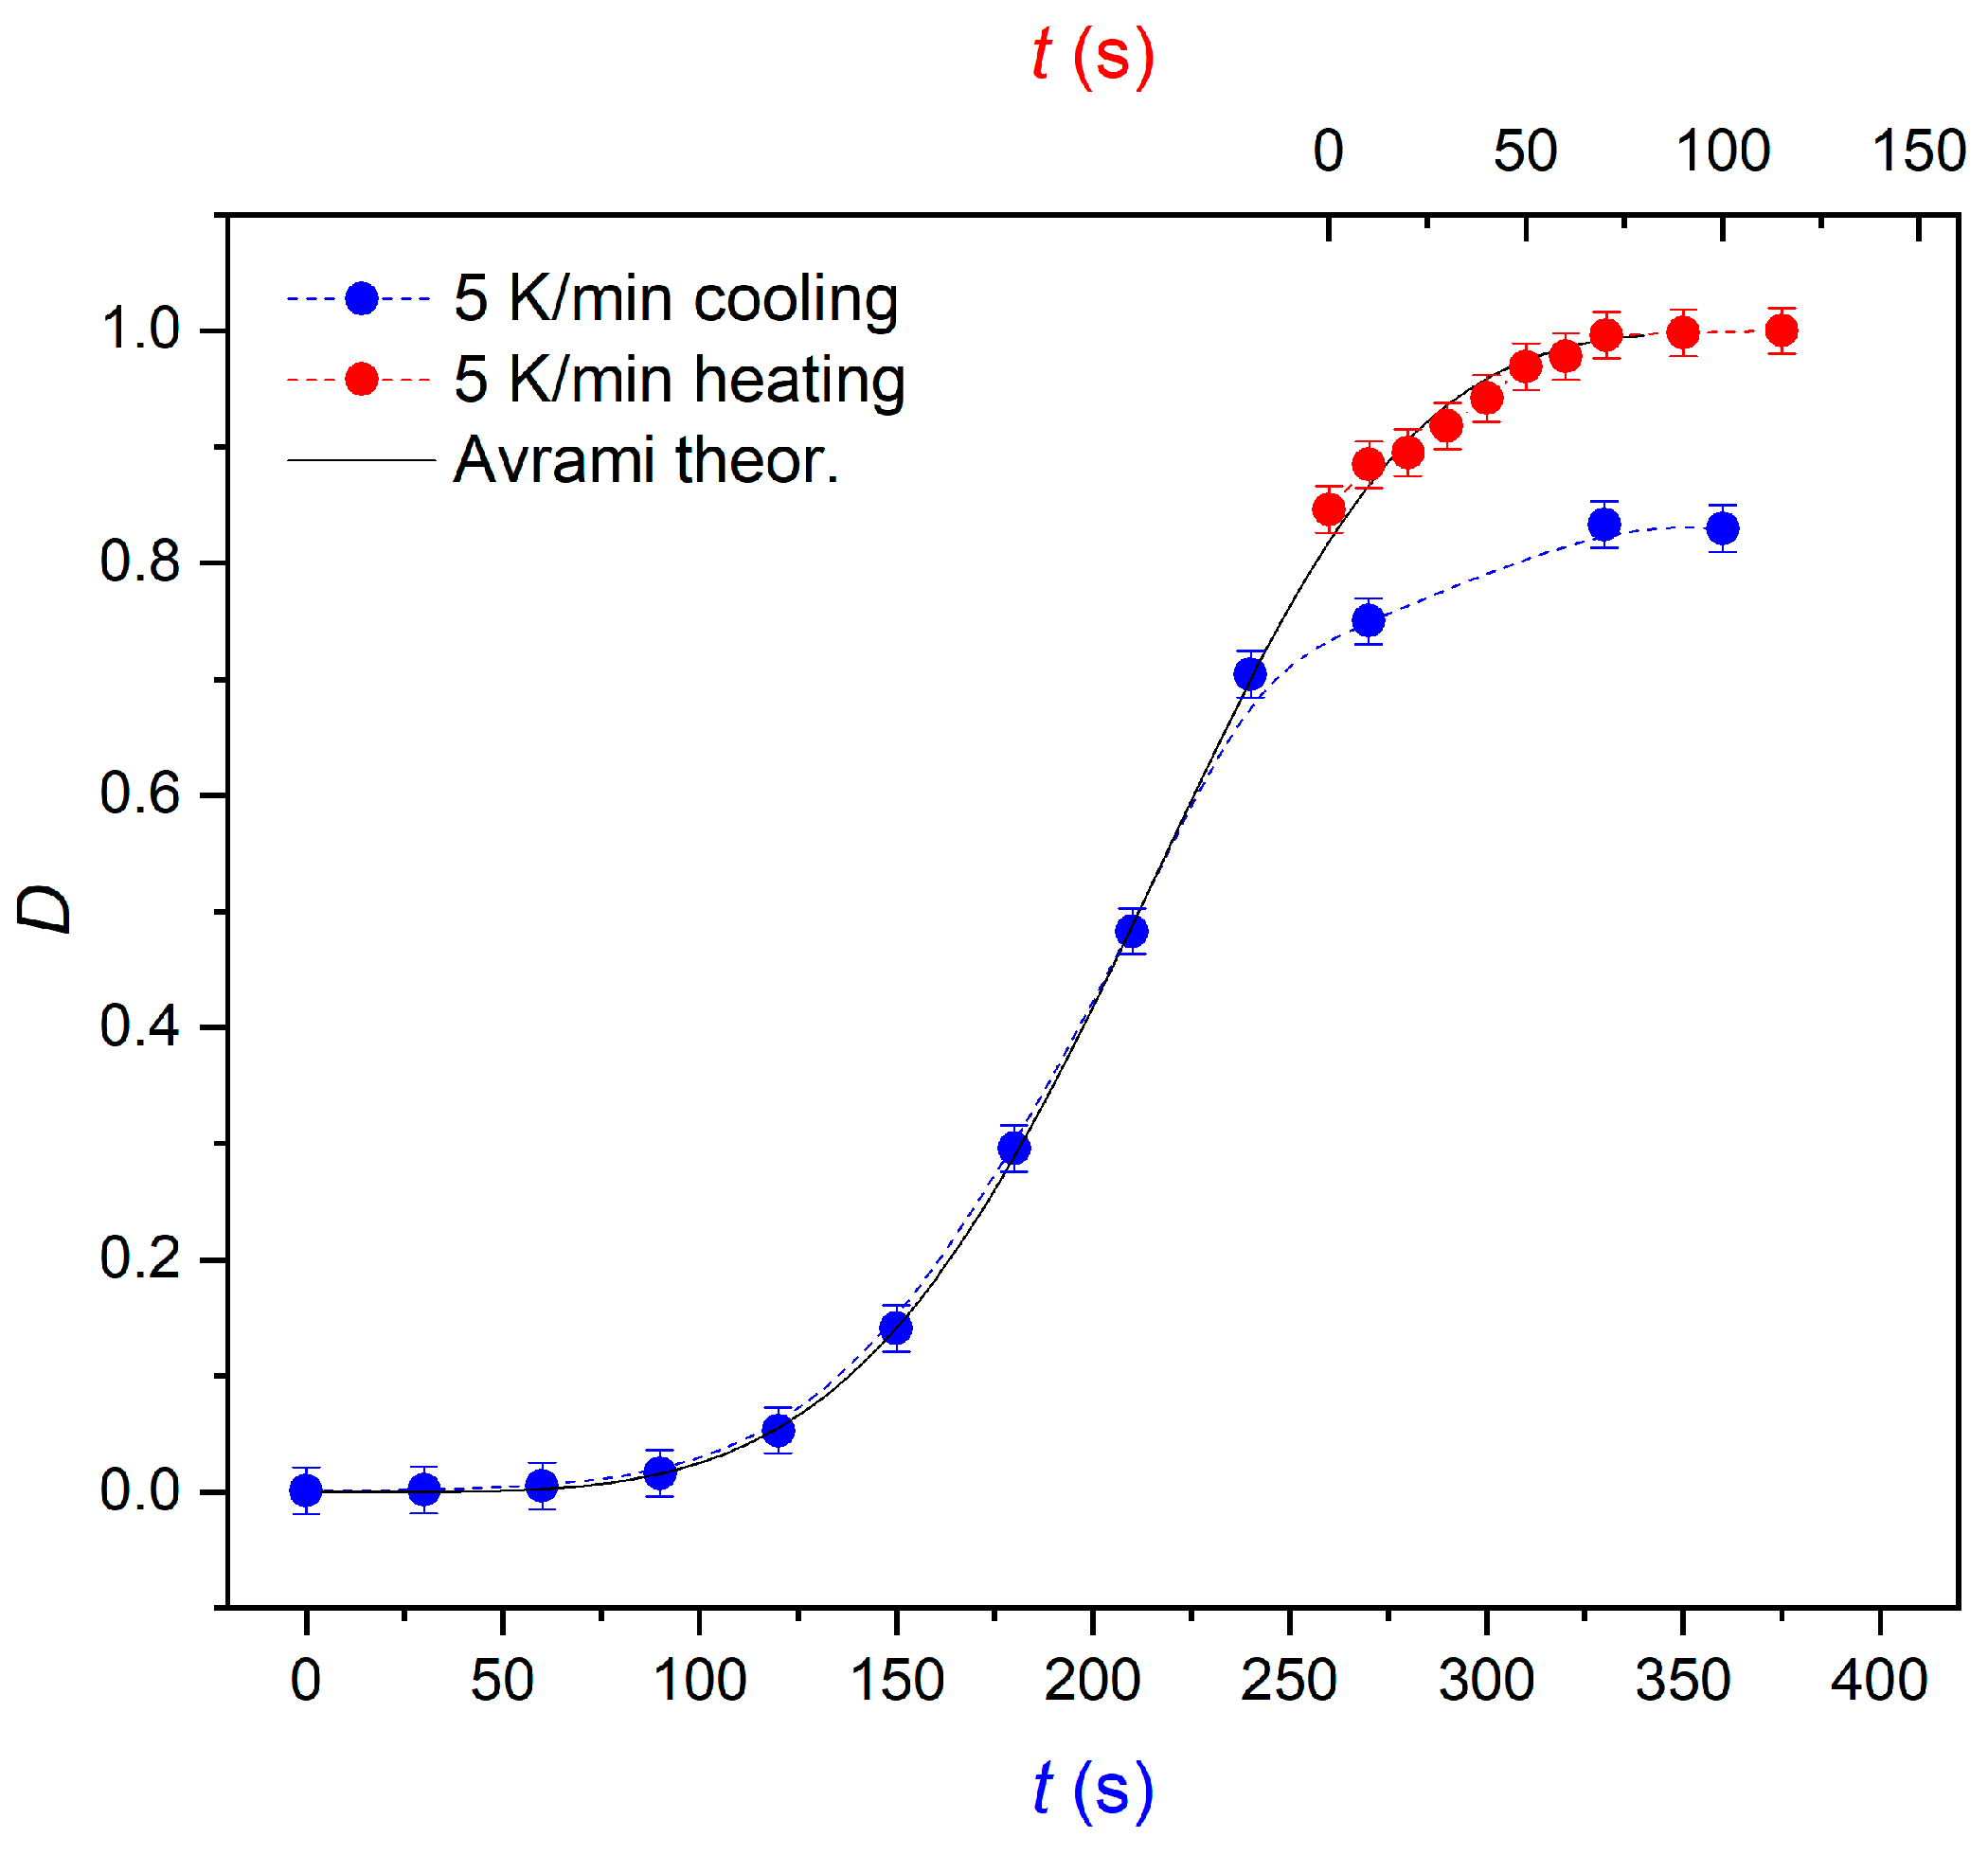
Polarized microscopy was also used to study how the crystallization process is completed upon heating. The crystalline fraction can be seen to increase during cooling and then on subsequent heating (Figure 3). Interestingly, the change in the degree of crystallinity observed over time during heating follows the same Avrami curve as for the crystallization process occurring during cooling. It follows that total crystallization, not being restricted by the partial vitrification of the sample, would take the same time as the incomplete crystallization during cooling. Then, further changes in microscopic textures of the crystalline phase were observed, which indicated a transformation to a better ordered phase.
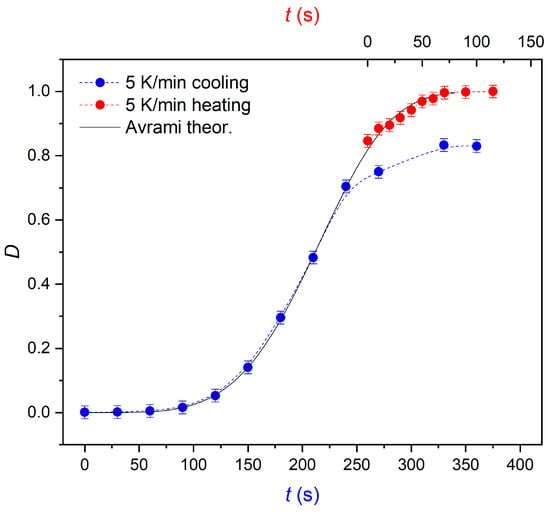
Figure 3.
Time evolution of the crystallinity degree D(t) observed by POM on cooling (partial crystallization) and heating at the rate of 5 K/min. The black line denotes the theoretically-predicted Avrami curve.
3.2. Analysis of Non-Isothermal Melt Crystallization Kinetics Observed by DSC
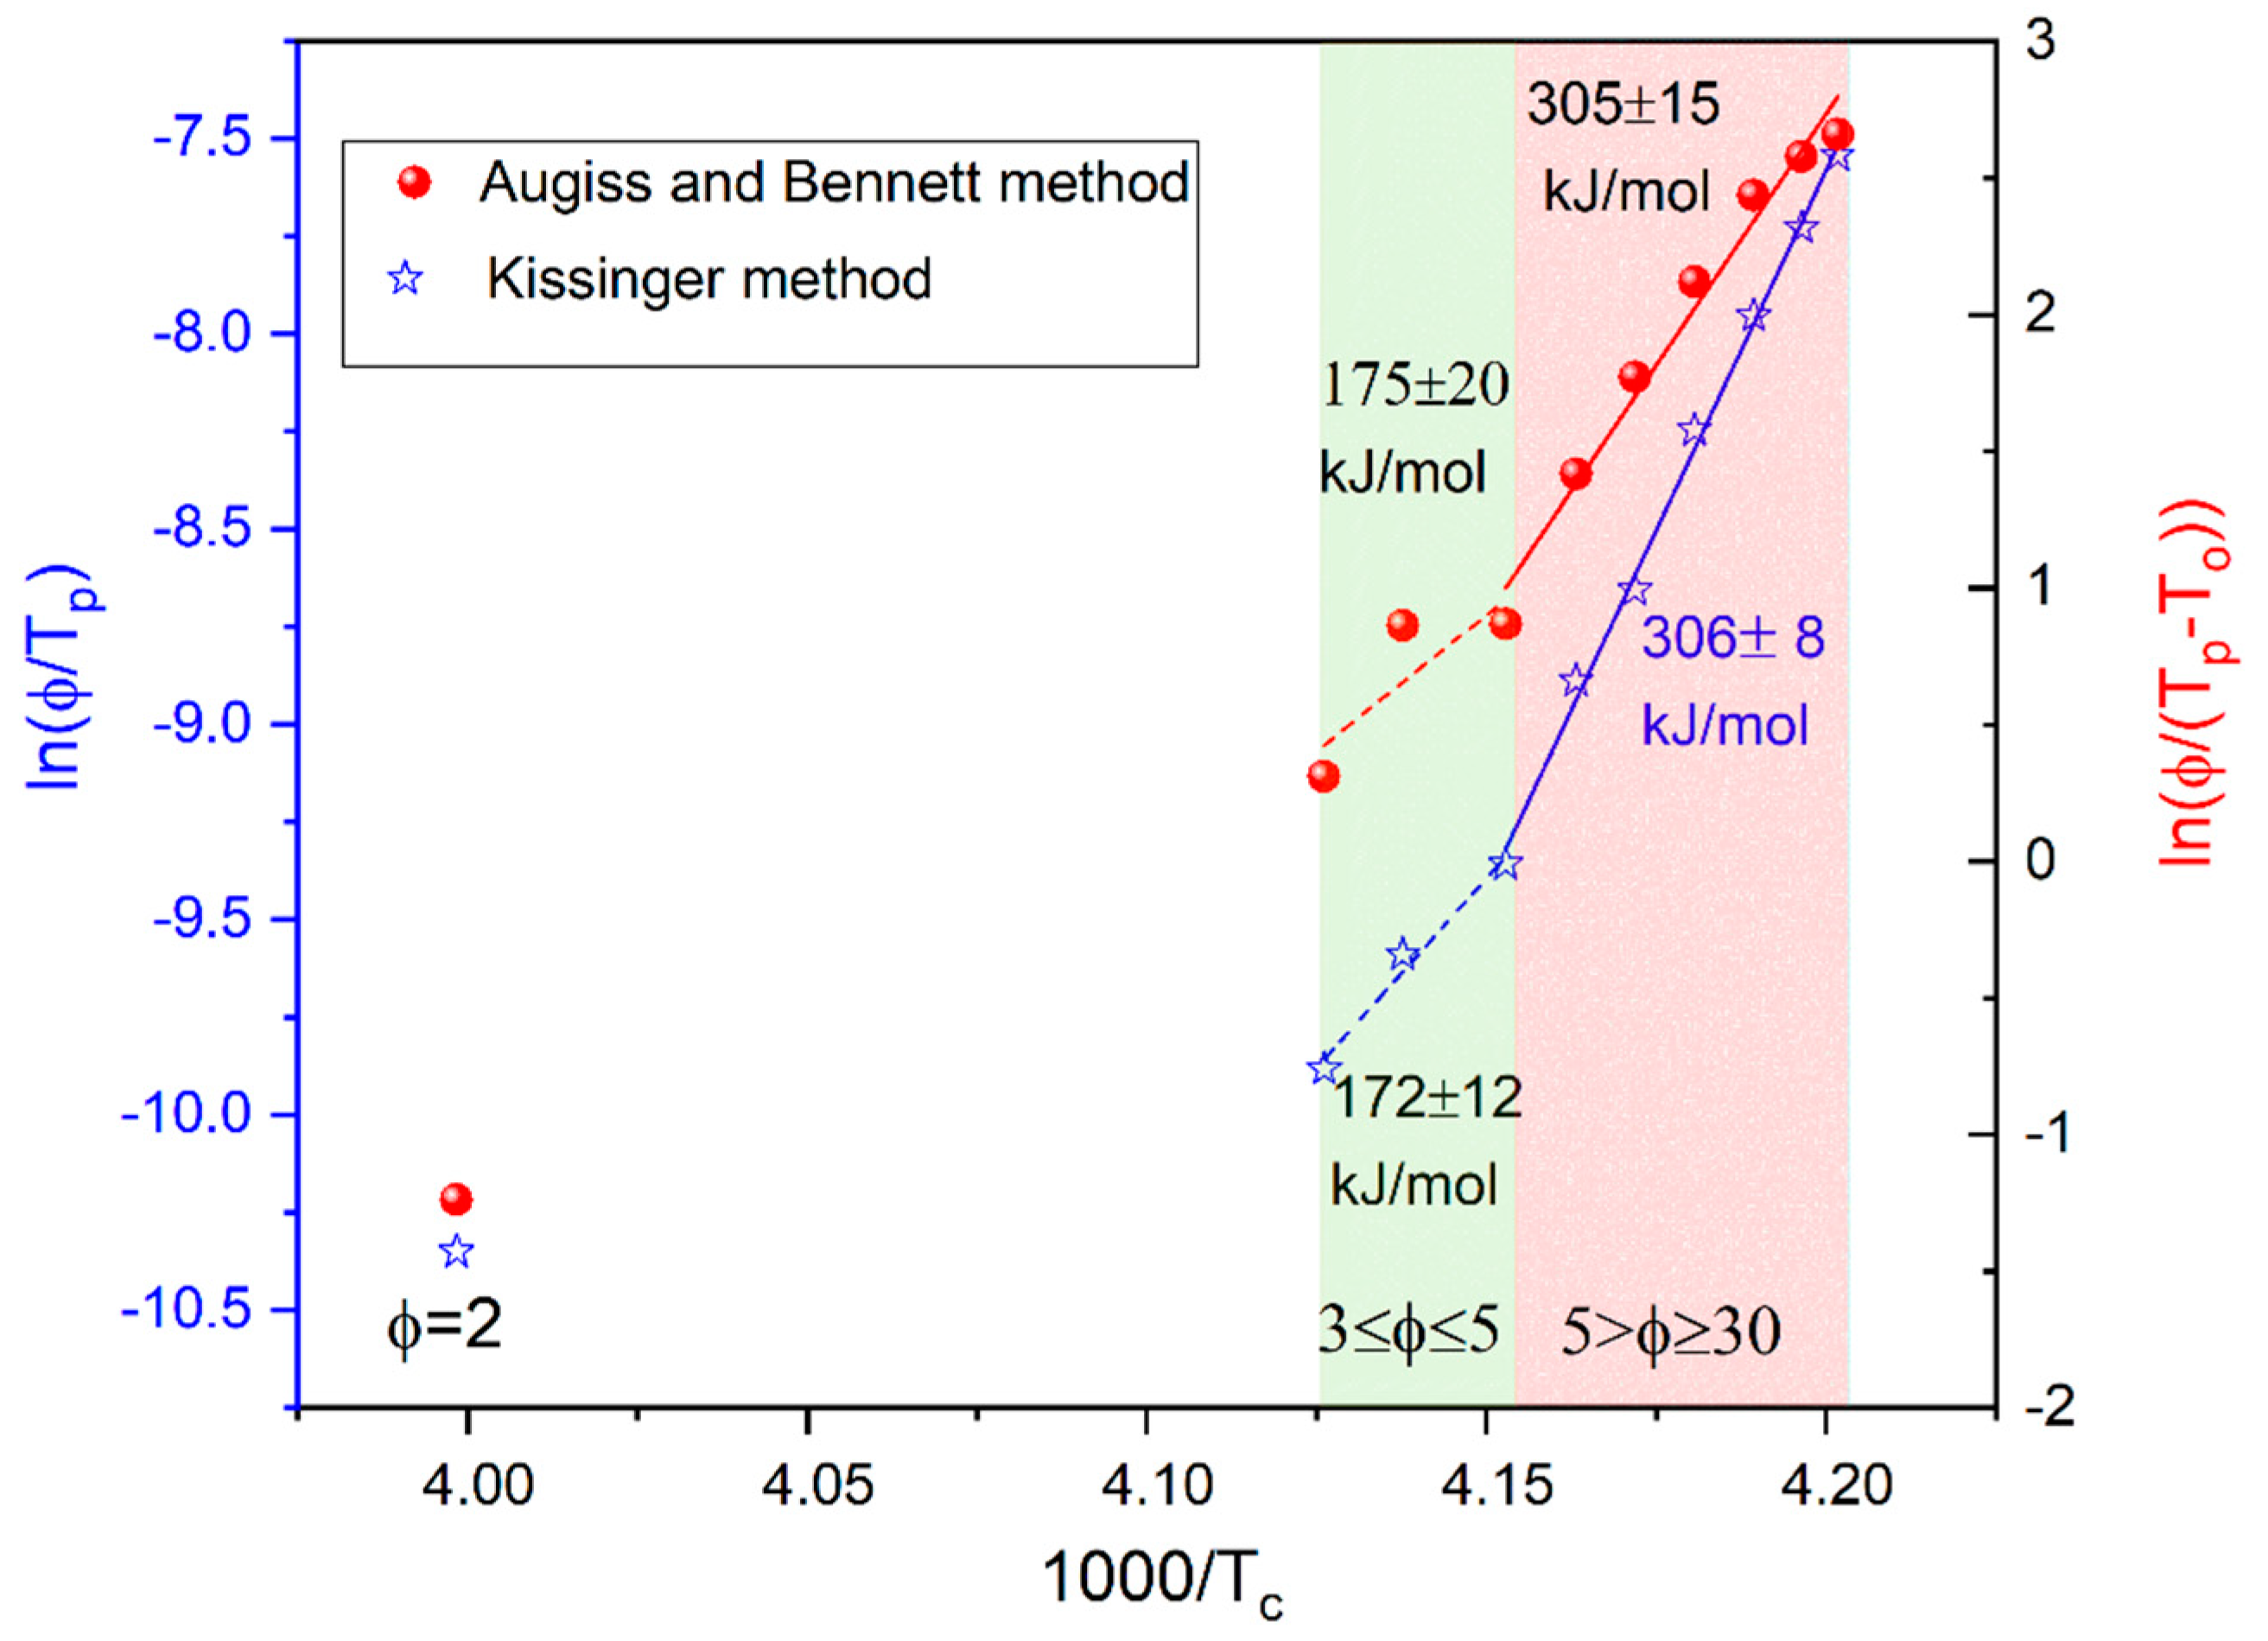
Activation energy Ec for the non-isothermal crystallization process was estimated using an equation proposed by Kissinger [27]:
and by Augis and Bennett [28]:
where C and CAB are fitting parameters, ϕ means a cooling/heating rate, Tp indicates the maximum crystallization peak and T0 is the onset temperature of crystallization. Two different linear dependences were found for K/min and , indicating two different mechanisms of crystallization for slow and fast cooling (see Figure 4). The values of Ec estimated using both methods coincide and are approximately equal to 175 kJ/mol and 305 kJ/mol for the slow and fast cooling, respectively.
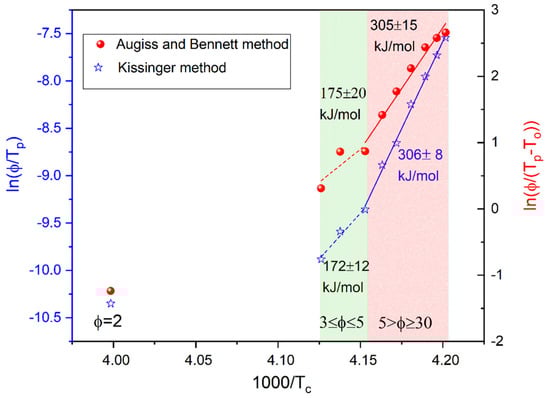
Figure 4.
Kissinger (empty symbols) and Augiss and Bennett (solid symbols) plots for the crystallization process observed for BBOA upon cooling.
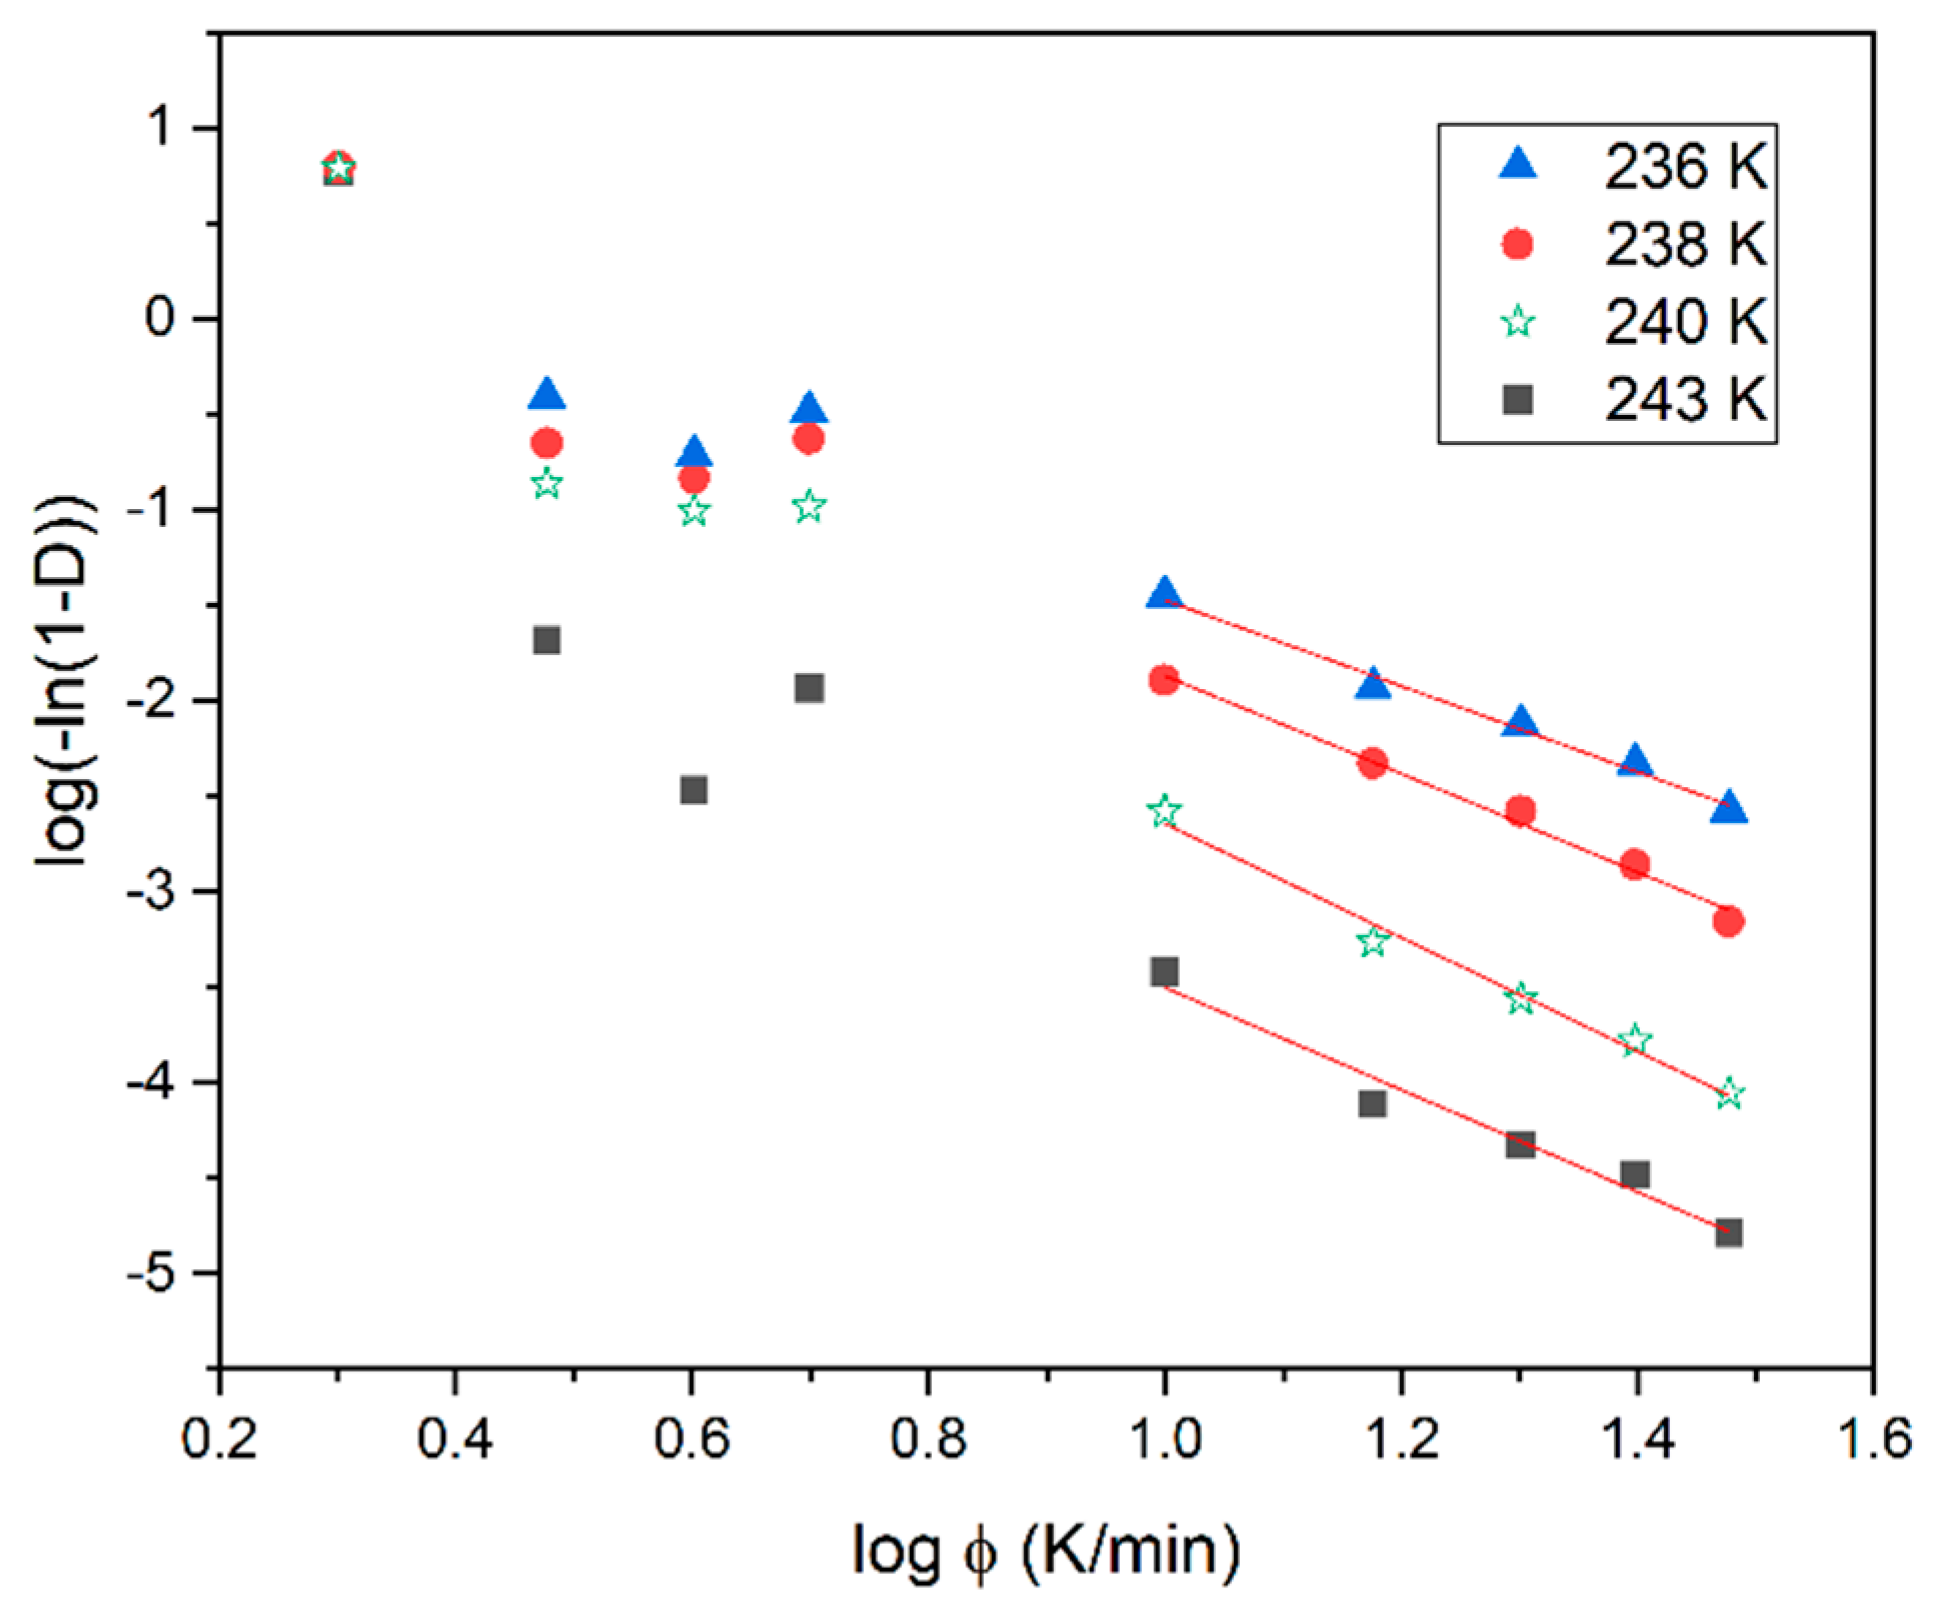
In the first step, the mechanism of non-isothermal crystallization is studied according to Ozawa [29]. Assuming that the non-isothermal crystallization process consists of infinitesimally small isothermal crystallization steps, the time variable t in the Avrami model can be replaced with the quotient of temperature and heating rate T/ϕ, resulting in the following equation:
where D is the relative degree of non-isothermal crystallization, nO is the Ozawa exponent depending on the dimensionality of the crystal and Z(T) is the Ozawa crystallization rate. It is evident in Figure 5 that the Ozawa analysis provides a good description of the non-isothermal crystallization of the BBOA SmBcr phase only during cooling, with ϕ ≥ 10 K/min. For fast cooling the plots of log(−ln(1−D)) versus log(ϕ) yield a straight line with nO being the slope and log(Z(T)) the intercept with the y-axis. The value of log(Z(T)) decreases with increasing temperature (Table 1), indicating that non-isothermal crystallization for fast cooling occurs in the diffusion-controlled region.
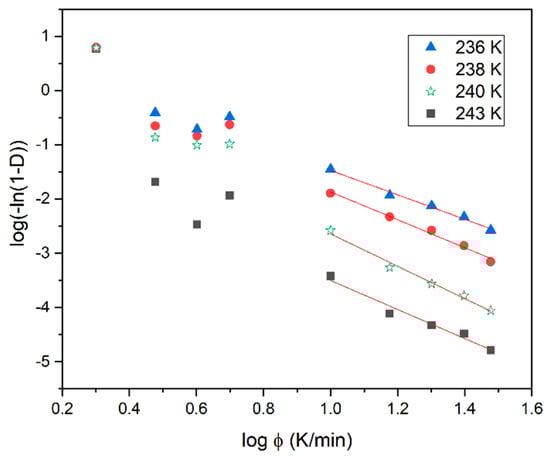
Figure 5.
Ozawa plots based on the non-isothermal crystallization DSC data obtained for BBOA.

Table 1.
Parameters of non-isothermal melt crystallization kinetics of BBOA obtained from the Ozawa analyses.
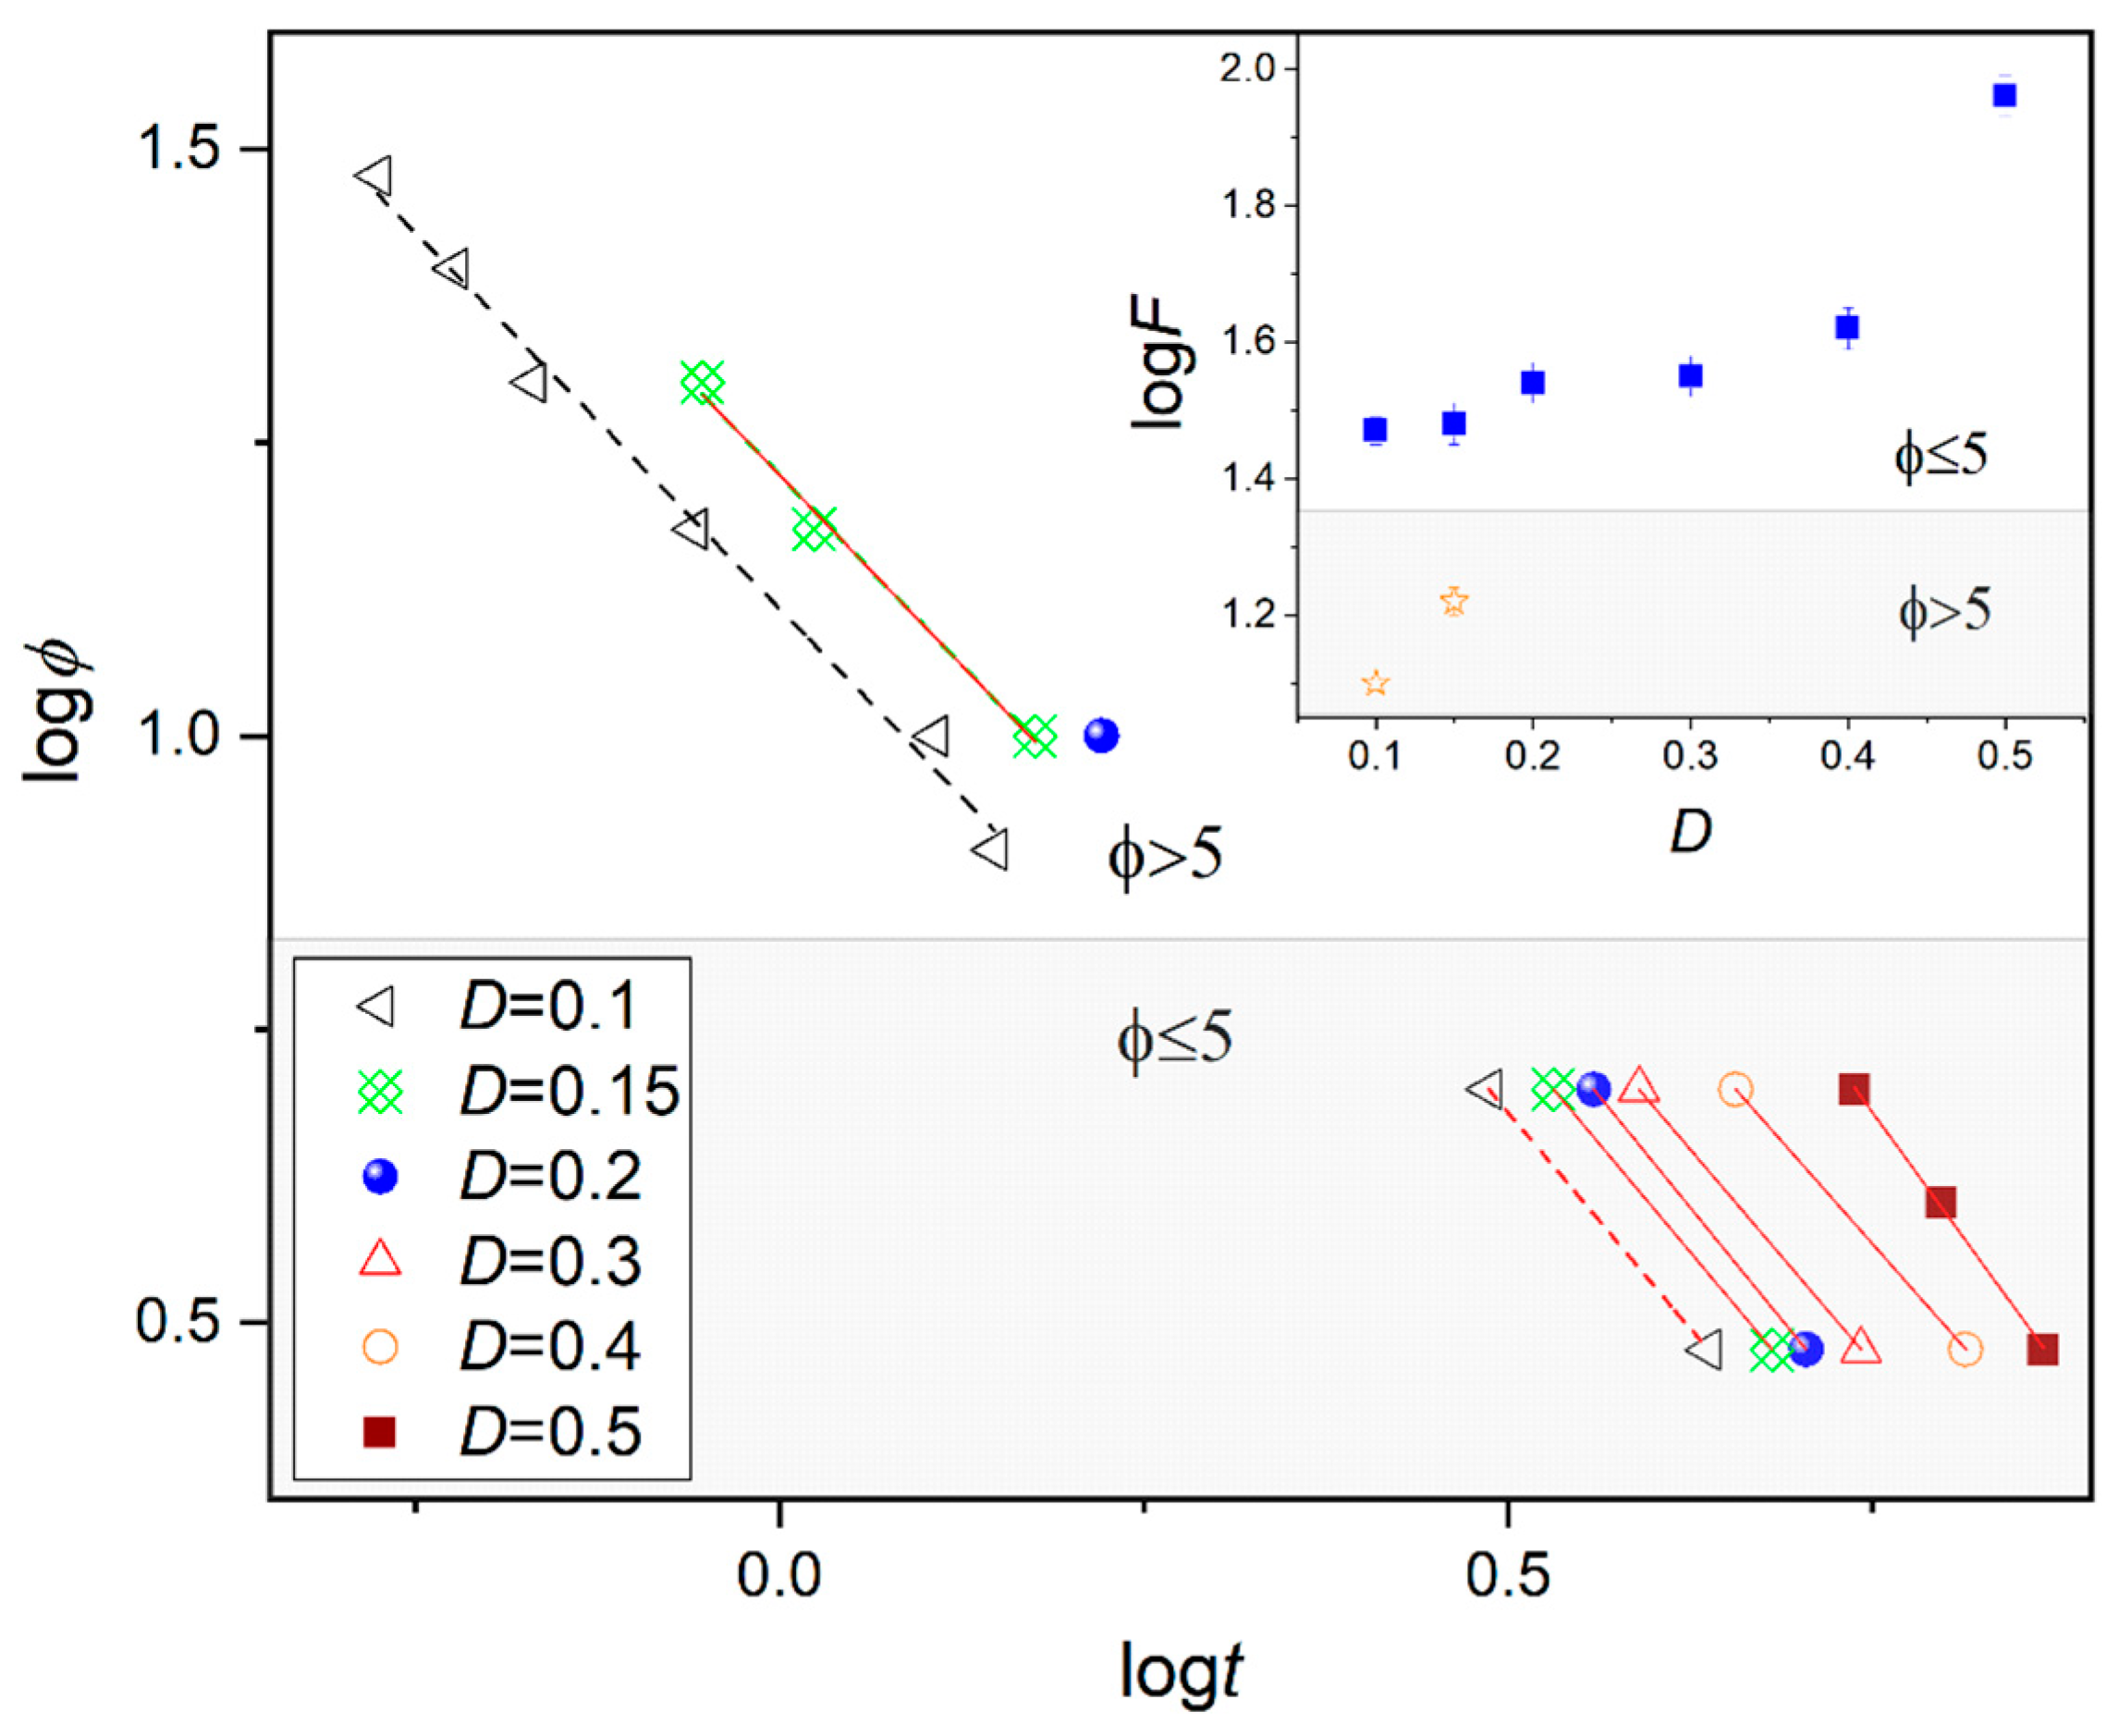
Additionally, the non-isothermal crystallization process was analyzed by the approach proposed by Mo et al. [30,31], which combines the Ozawa and Avrami equations as below:
where a is the ratio of the Avrami exponent nA (providing information on the type of nucleation and the dimensionality of crystal growth during isothermal experiment) to the Ozawa nO exponent, is related to the cooling/heating rate. Figure 6 presents the relationship between cooling rate and crystallization time for the fixed degree of crystallinity D. The dependence of logt (logφ) below 5 K/min is different to that above, as indicated by the slope. The log Z values increase as the fraction of the new phase (D) grows. Together, these findings support the idea that slow and fast cooling rates are associated with different mechanisms of crystallization; a similar pattern was previously observed for the crystallization of the nematic phase of 4-Cyano-3-fluorophenyl 4-Butylbenzoate (4CFPB) [15].
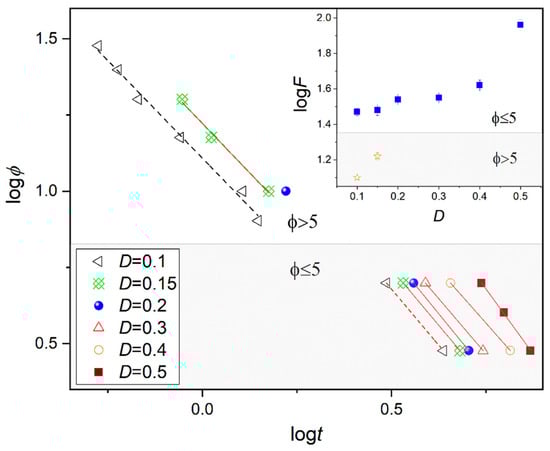
Figure 6.
Plots of logϕ versus logt for a selected degree of crystallinity D during non-isothermal crystallization in the SmB phase of BBOA. The inset shows the dependence of logF on the crystallinity D.
3.3. Isothermal Melt Crystallization Kinetics of SmBcr Studied by BDS
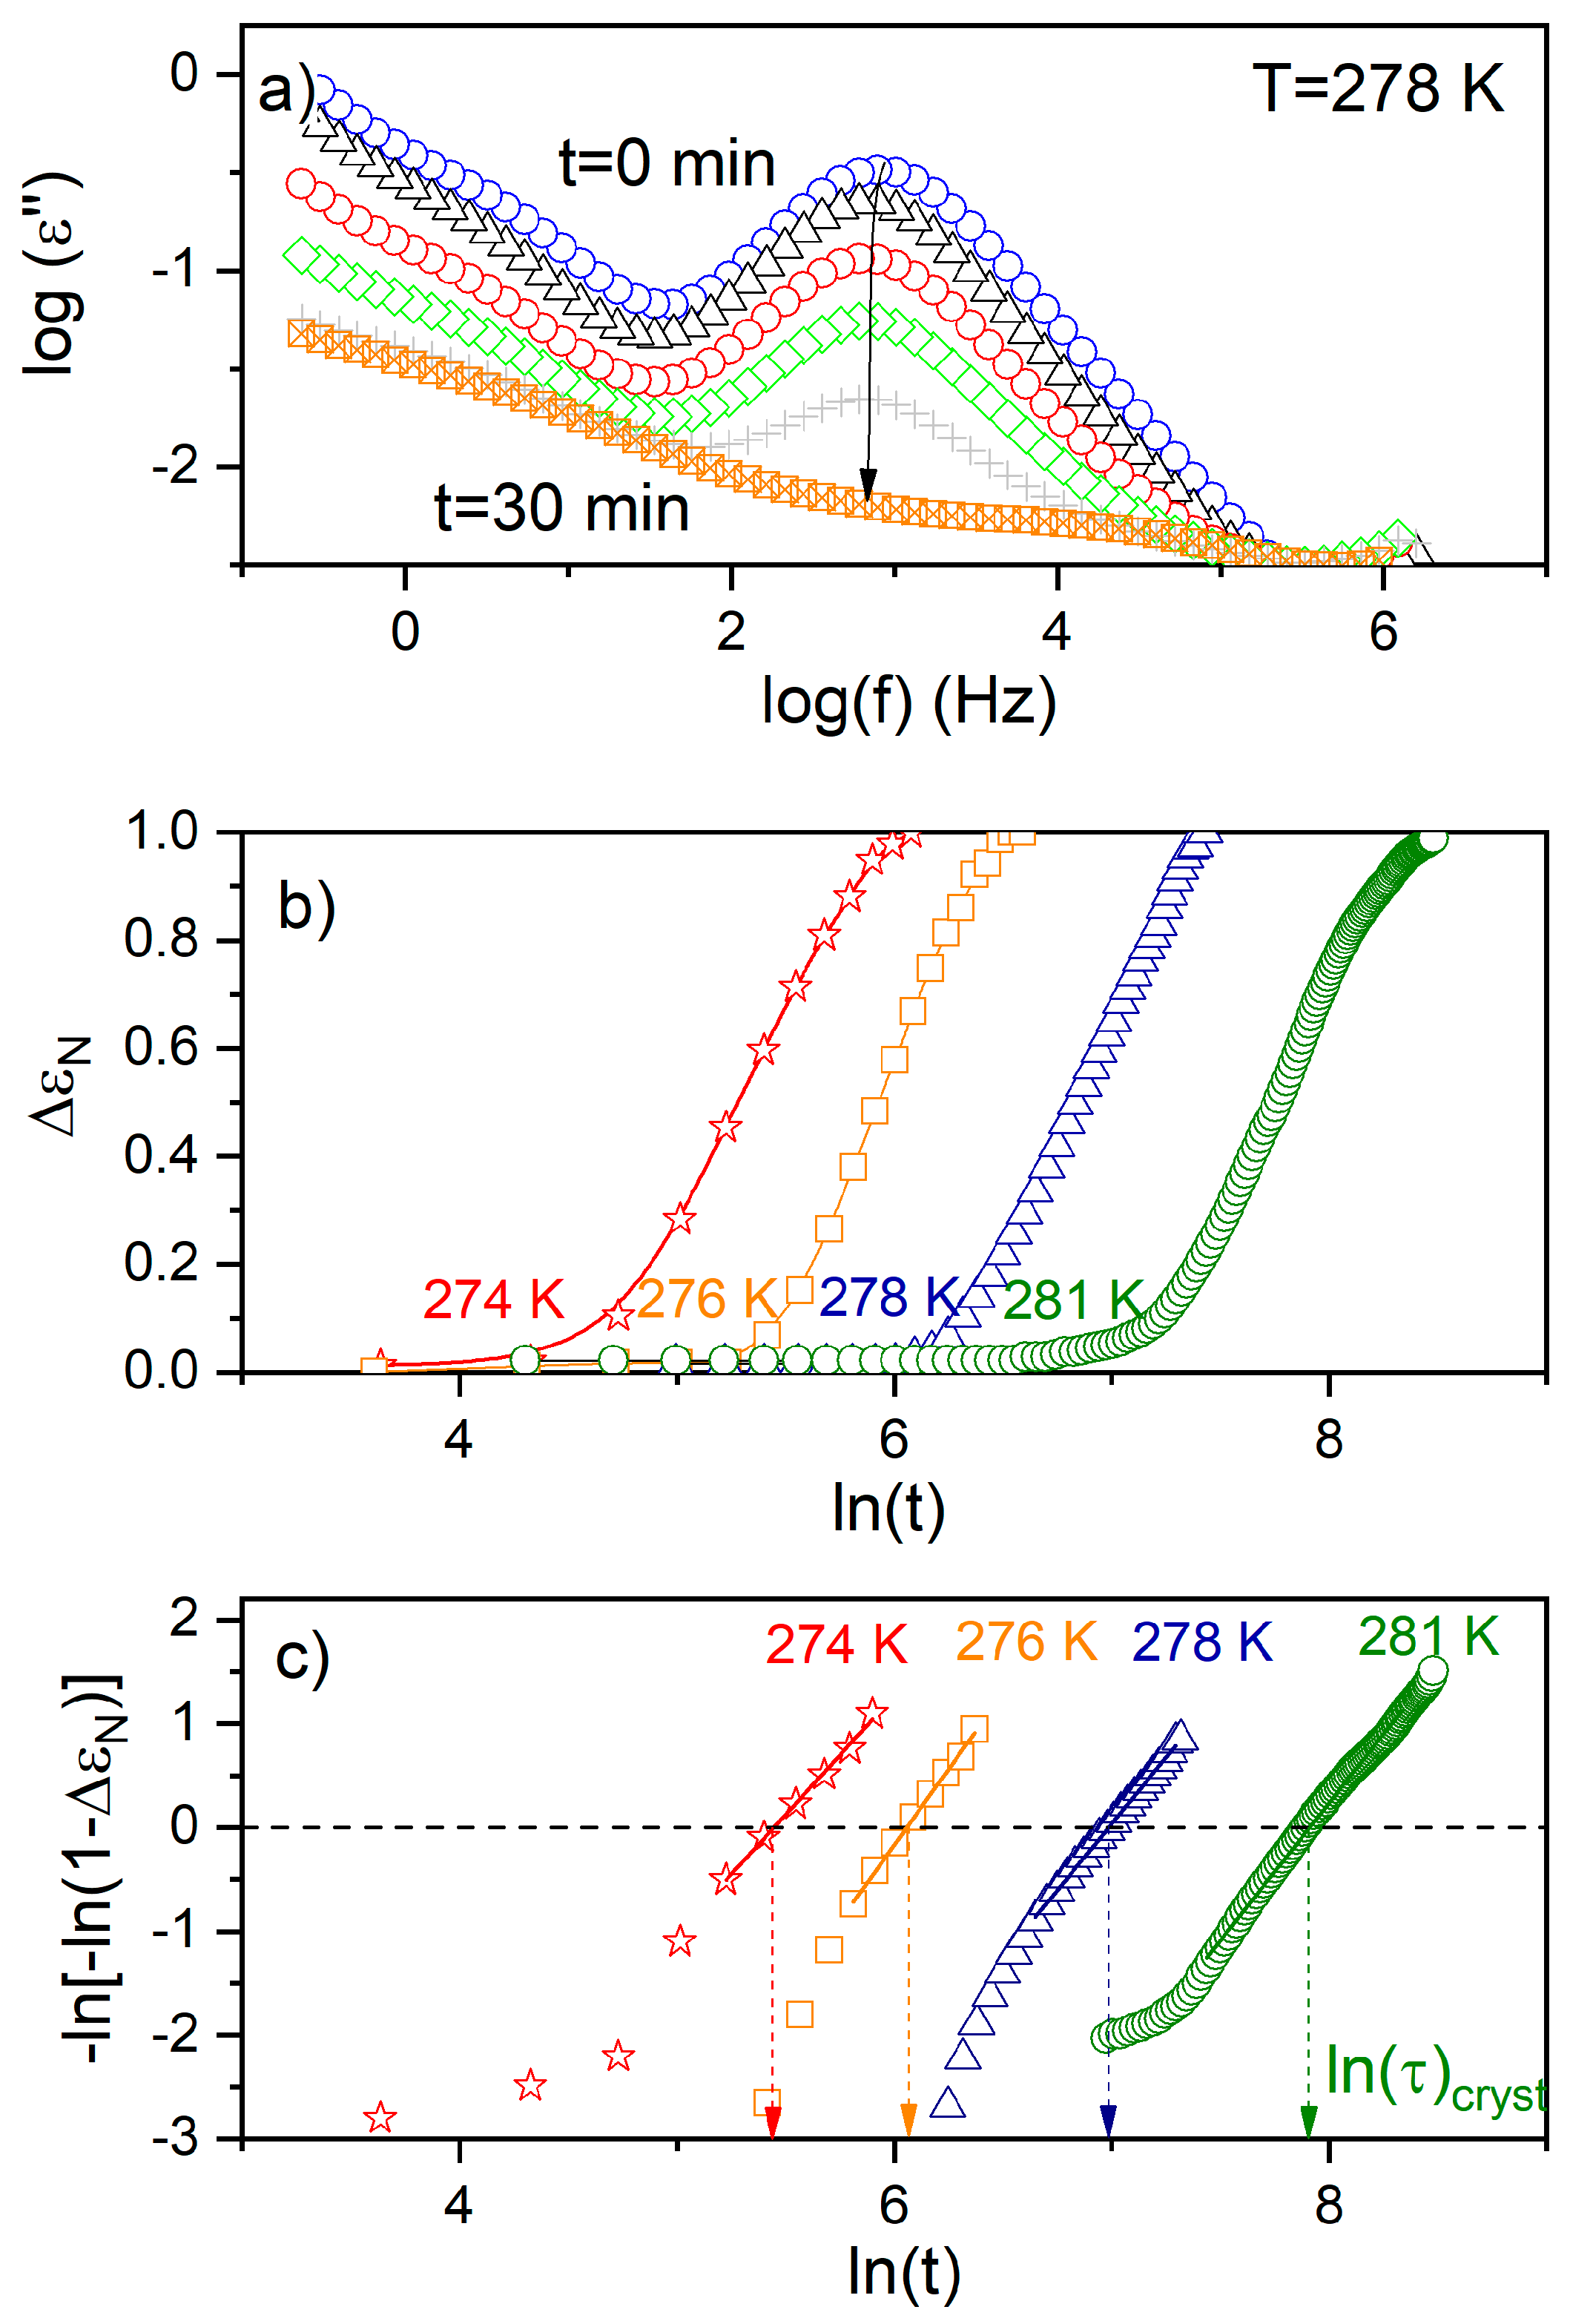
BDS is primarily intended to probe the response of polar substances to an external variable electric field. During the crystallization process, the number of fluctuating dipoles in a substance is gradually reduced, which is reflected as a decrease of the amplitude of the dielectric loss spectra ε’’(f) (see Figure 7a) and the dielectric strength (, where and are values of the real part ε’ in the limit of low and high frequency, respectively). The evolution of the degree of crystallinity with time can be related to the change in normalized dielectric strength ΔεN as follows:
where (0), (t) and (∞) are the values of the dielectric strength at, respectively, the beginning, the time t and at the end of the observation. The increase of a new crystalline fraction during the crystallization process can be described by Avrami model:
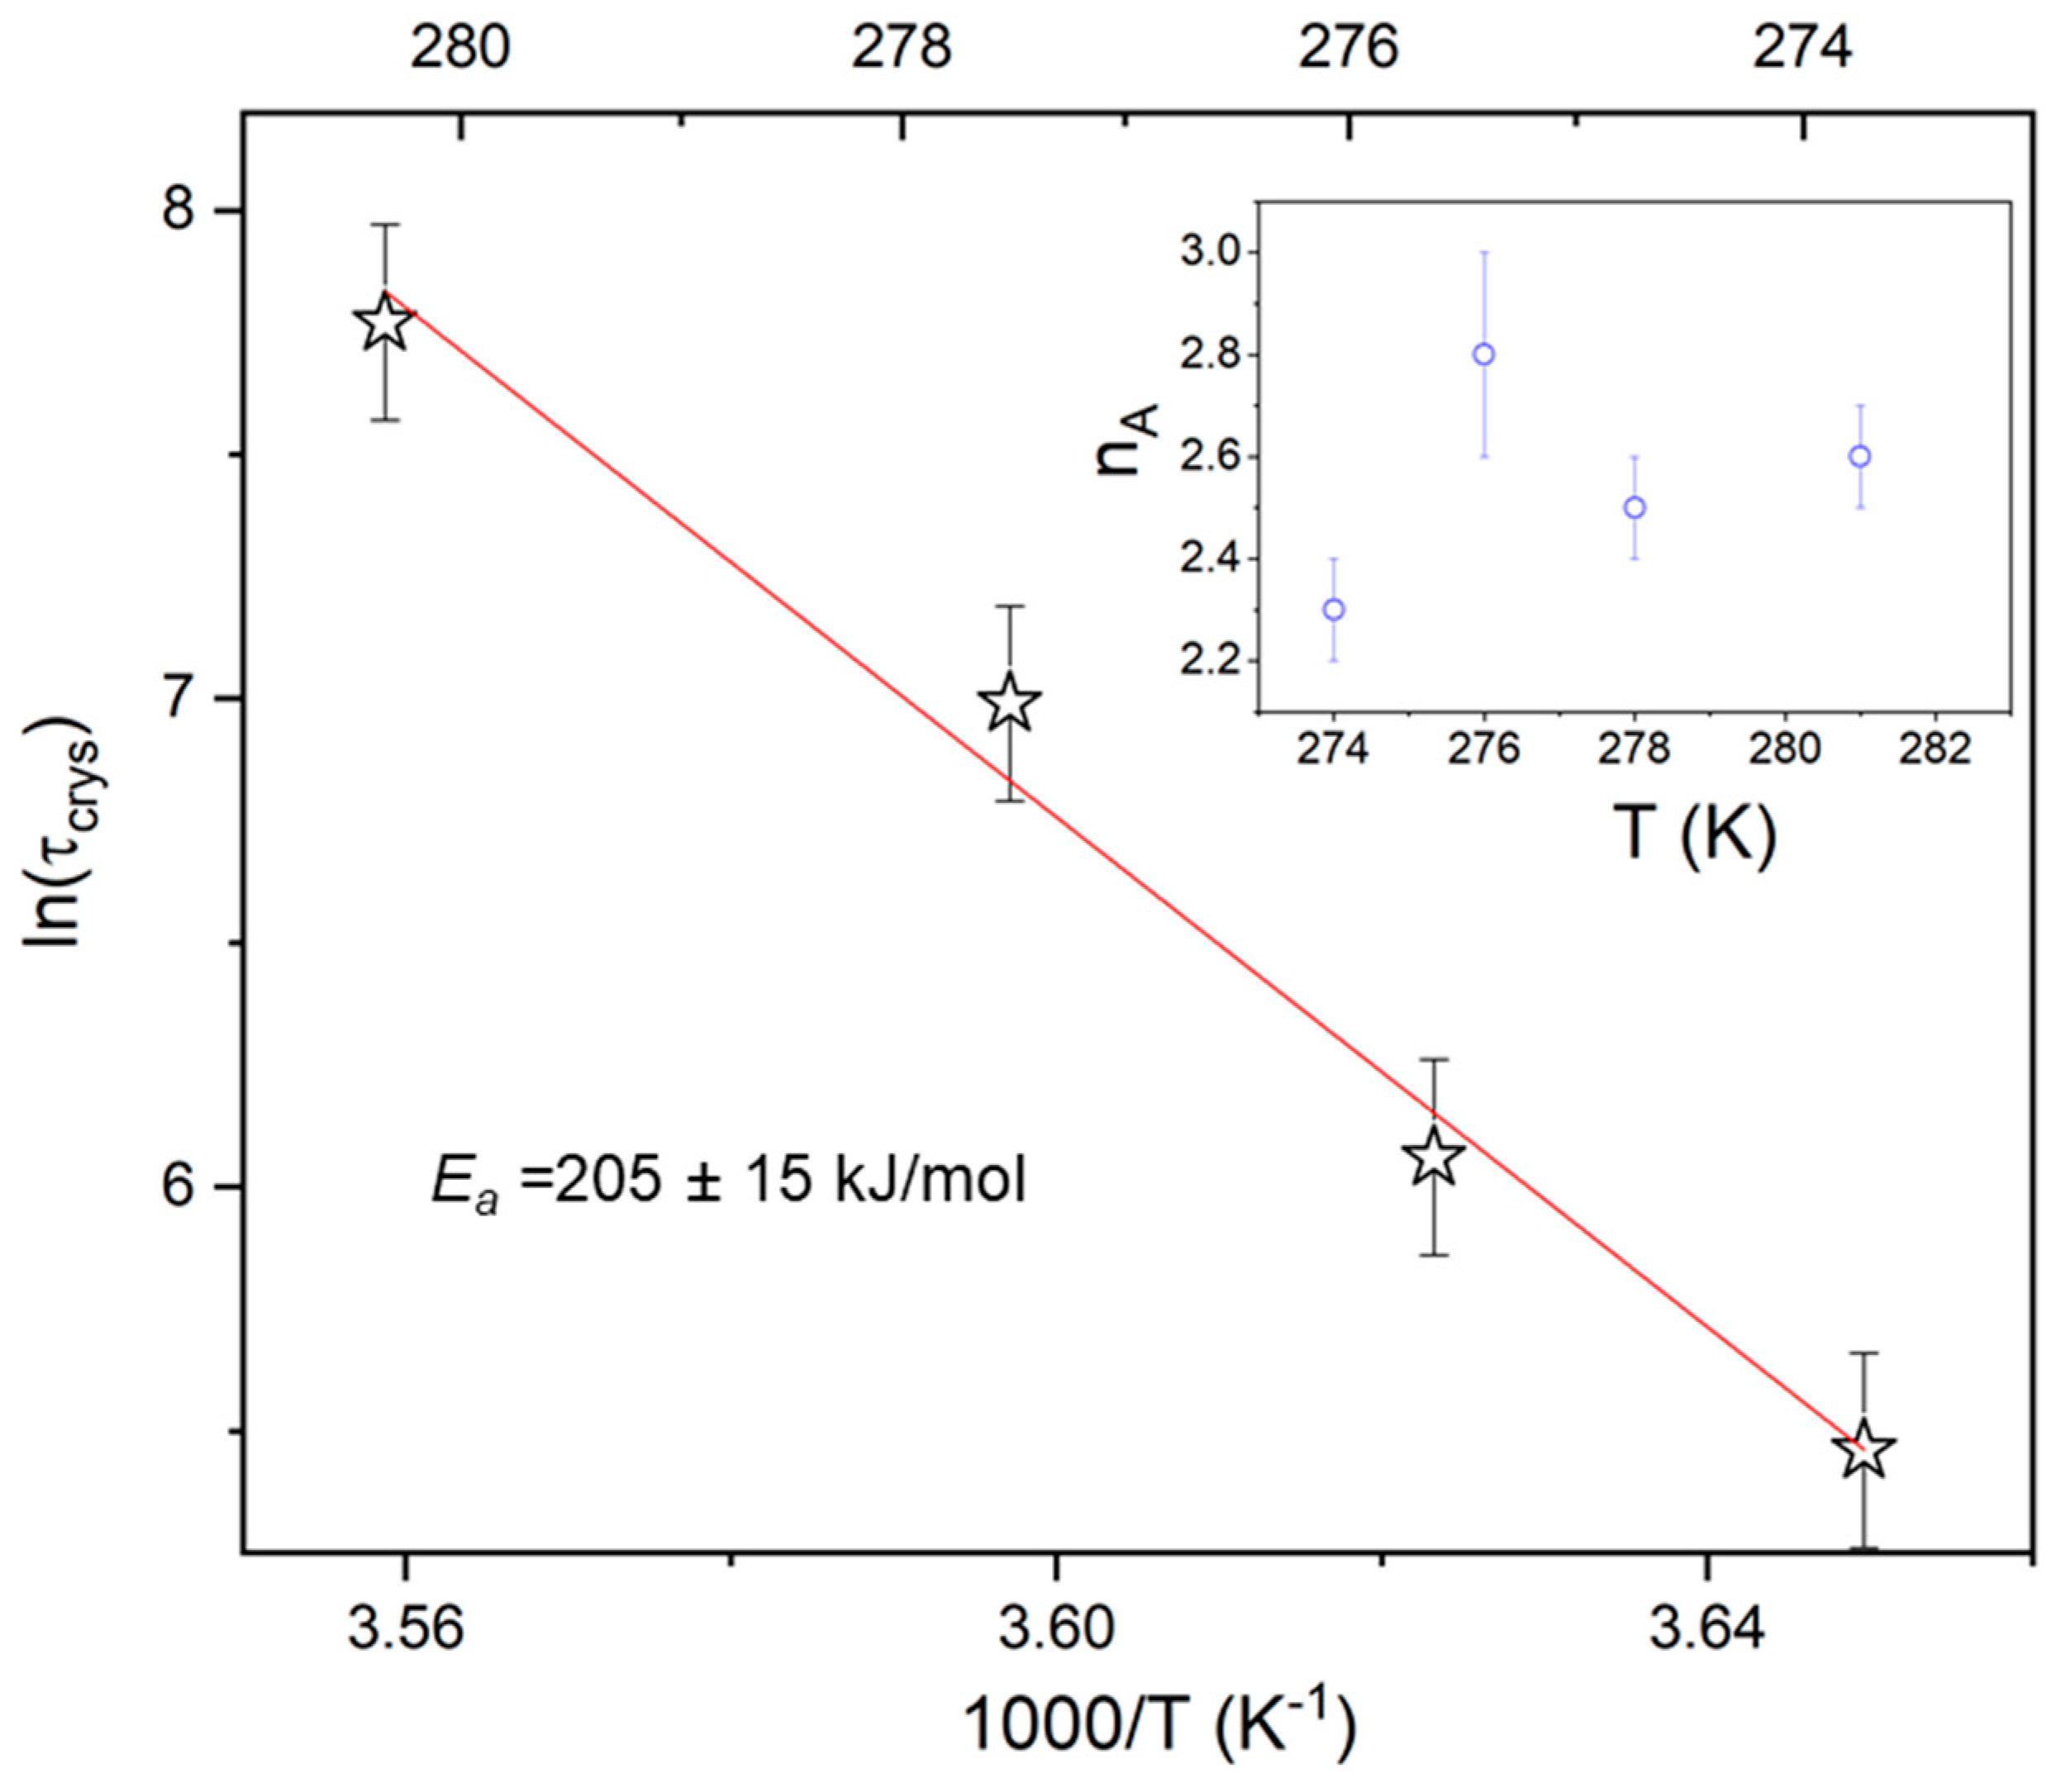
where is a constant depending on the crystallization temperature and geometry of the sample, t0 is the induction time, and nA is the Avrami exponent. To determine the characteristic time of crystallization , defined as the time needed to achieve 63 % of the final crystallinity, Equation (9) was presented in the logarithmic form i.e., ln[−ln(1−ΔεN)] versus ln(t); the result yielded a straight line, with nA being the slope and lnK the intercept with the y-axis (Figure 7). The values of τcryst was designated from ln[−ln(1−ΔεN)] = 0 (see Figure 7c). The characteristic crystallization time (τcryst) increases with rising temperature (Figure 8), which suggests that the crystallization process is limited by the formation of nuclei. The activation energy (Ea ≈ 205 kJ/mol) obtained for the isothermal experiment is consistent with that observed for a non-isothermal process with ϕ ≤ 5, accounting for experimental error; this suggests a continuous nucleation mechanism [10], which was also confirmed by POM studies. Hence, both isothermal crystallization in the temperature range 274 K to 281 K and non-isothermal process for φ ≤ 5 K/min is underpinned by a thermodynamic driving force. The nA parameter (see Table 2), ranging from 2.8 to 2.3 with decreasing temperature, is reduced with respect to the value expected for the homogeneous growth of the spherulitic nuclei (n = 3). Presumably, the reduction of crystal growth dimensionality observed for the non-isothermal experiment (2.24 ≤ no ≤ 2.67) is caused by a confinement effect, which is related to fact that the factions of the layered SmBcr are restricted by crystalline domains [21]. This effect was also found for crystallization of other materials in nanopores (two-dimensional confinement) [32] and for thin polymeric films (one-dimensional confinement) [33].
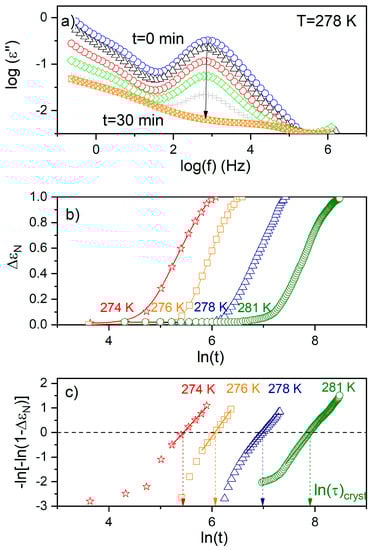
Figure 7.
(a) The imaginary parts of the complex dielectric functions obtained upon isothermal crystallization of BBOA at 278 K. The arrow indicates the direction of changes in the loss spectra during the crystallization process. (b) Time evolution of the normalized dielectric strength (ΔεN) during isothermal crystallization of BBOA at 274 K, 276 K, 278 K and 276 K. (c) Avrami plot of ΔεN(t) for the data presented in the panel (b).

Figure 8.
Temperature dependence of the characteristic crystallization time (τcryt) for the isothermal melt crystallization form (SmBcryt) of BBOA. The inset presents the Avrami exponent nA versus temperature.
Table 2.
Parameters of isothermal melt crystallization kinetics of BBOA estimated by the Avrami model at different temperatures.
4. Conclusions
The present study examined the kinetics of the non-isothermal and isothermal melt crystallization processes of SmBcr in 4-n-butyloxybenzylidene-4′-n′-octylaniline (BBOA) by broadband dielectric spectroscopy, differential scanning calorimetry and polarized optical microscopy. Upon cooling, the SmBcr phase of BBOA partially crystallizes and partially vitrifies; upon subsequent heating, the crystallization process is completed by cold crystallization. POM studies revealed that on heating, the degree of crystallinity changes according to the same Avrami curve observed for crystallization on cooling. Two crystallization mechanisms were revealed: (i) one based on thermodynamic forces at lower cooling rates (), with the energy barrier Ea ≈ 175 kJ/mol and (ii) another controlled by diffusion which is associated with higher cooling rates (), with Ea ≈ 305 kJ/mol.
This statement is supported by the results of analyses based on the Ozawa model and the approach proposed by Mo, which identified different parameters for the low and high cooling rates. The isothermal crystallization studied in the temperature range 274 K to 281 K is limited by the formation of nuclei. The activation energy (Ea ≈ 205 kJ/mol) calculated for isothermal crystallization is comparable with that determined for the non-isothermal process taking place at ϕ ≤ 5 K/min, which suggests that both processes share the same mechanism. The parameters of crystal growth observed under isothermal (2.3 ≤ nA ≤ 2.8) and non-isothermal conditions (2.24 ≤ no ≤ 2.67) show less dimensionality than that of the three-dimensional process. This is caused by the confinement of SmBcr fractions in the layered sample by crystalline domains.
Author Contributions
M.J.-D.: conception of studies, BDS measurements and analysis of BDS data, analysis of kinetics of non-isothermal crystallization process based on DSC data and writing the manuscript. T.R.: POM measurements and analysis of POM data. E.J.-G.: DSC measurements and analysis of thermograms. All authors discussed the results and approved the final version of the manuscript.
Funding
M.J.-D. acknowledges the National Science Centre (Grant SONATA11: UMO-2016/21/D/ST3/01299) for financial support. E.J.G. acknowledges funding from the JINR research group and centers in Poland. (Studies of selected soft materials and compounds for hydrogen storage. Investigation of condensed matter by neutron scattering methods. Subject no: 04-4-1121-2015-2020.)
Conflicts of Interest
The authors declare no conflict of interest.
References
- Ediger, M.D.; Harrowell, P.; Yu, L. Crystal growth kinetics exhibit a fragility-dependent decoupling from viscosity. J. Chem. Phys. 2008, 128, 034709. [Google Scholar] [CrossRef] [PubMed]
- Tung, H.H.; Paul, E.L.; Midler, M.; McCauley, J.A. Crystallization of Organic Compounds: An Industrial Perspective; John Wiley & Sons, Inc.: Hoboken, New Jersey, USA, 2009; ISBN 978-0-471-46780-9. [Google Scholar]
- Xue, D.; Li, K.; Liu, J.; Sun, C.; Chen, K. Crystallization and functionality of inorganic materials. Mater. Res. Bull. 2012, 47, 2838–2842. [Google Scholar] [CrossRef]
- Gutzow, I.S.; Schmelzer, J.W.P. The Vitreous State: Thermodynamics, Structure, Rheology, and Crystallization, 2nd ed.; Springer: Berlin/Heidelberg, Germany, 1995; ISBN 978-3-642-34633-0. [Google Scholar]
- Jackson, K.A. Kinetic Processes; Wiley-VCH Verlag GmbH & Co. KGaA: Weinheim, Germany, 2004; ISBN 9783527603893. [Google Scholar]
- Szklarz, G.; Adrjanowicz, K.; Paluch, M. Cooling-Rate versus Compression-Rate Dependence of the Crystallization in the Glass-Forming Liquid, Propylene Carbonate. Cryst. Growth Des. 2018, 18, 2538–2544. [Google Scholar] [CrossRef]
- Sanz, A.; Niss, K. Coupling between Molecular Mobility and Kinetics of Crystal Growth in a Hydrogen-Bonded Liquid. Cryst. Growth Des. 2017, 17, 4628–4636. [Google Scholar] [CrossRef]
- Swallen, S.F.; Ediger, M.D. Self-diffusion of the amorphous pharmaceutical indomethacin near Tg. Soft Matter 2011, 7, 10339–10344. [Google Scholar] [CrossRef]
- Descamps, M.; Dudognon, E. Crystallization from the amorphous state: Nucleation-growth decoupling, polymorphism interplay, and the role of interfaces. J. Pharm. Sci. 2014, 103, 2615–2628. [Google Scholar] [CrossRef]
- Zhou, D.; Zhang, G.G.Z.; Law, D.; Grant, D.J.W.; Schmitt, E.A. Thermodynamics, molecular mobility and crystallization kinetics of amorphous griseofulvin. Mol. Pharm. 2008, 5, 927–936. [Google Scholar] [CrossRef]
- Schmelzer, J.W.P.; Abyzov, A.S. Crystallization of glass-forming liquids: Specific surface energy. J. Chem. Phys. 2016, 145, 064512. [Google Scholar] [CrossRef]
- Pełka, R.; Yamamura, Y.; Jasiurkowska, M.; Massalska-Arodź, M.; Saito, K. Rich polymorphism in 4-propyl-4′-thiocyanato-1,1′-biphenyl (3TCB) revealed by adiabatic calorimetry. Liq. Cryst. 2008, 35, 179–186. [Google Scholar] [CrossRef]
- Massalska-Arodź, M.; Williams, G.; Smith, I.K.; Conolly, C.; Anthony Aldridge, G.; Dabrowski, R. Molecular dynamics and crystallization behaviour of isopentyl cyanobiphenyl as studied by dielectric relaxation spectroscopy. J. Chem. Soc. Faraday Trans. 1998, 94, 387–394. [Google Scholar] [CrossRef]
- Massalska-Arodź, M.; Williams, G.; Thomas, D.K.; Jones, W.J.; Dabrowski, R. Molecular Dynamics and Crystallization Behavior of Chiral Isooctyloxycyanobiphenyl as Studied by Dielectric Relaxation Spectroscopy. J. Phys. Chem. B 1999, 103, 4197–4205. [Google Scholar] [CrossRef]
- Rozwadowski, T.; Massalska-Arodź, M.; Kolek, Ł.; Grzybowska, K.; Bąk, A.; Chłędowska, K. Kinetics of Cold Crystallization of 4-Cyano-3-fluorophenyl 4-Butylbenzoate (4CFPB) Glass Forming Liquid Crystal. I. Nonisothermal Process As Studied by Microscopic, Calorimetric, and Dielectric Methods. Cryst. Growth Des. 2015, 15, 2891–2900. [Google Scholar] [CrossRef]
- Jasiurkowska-Delaporte, M.; Rozwadowski, T.; Dmochowska, E.; Juszyńska-Gałązka, E.; Kula, P.; Massalska-Arodź, M. Interplay between Crystallization and Glass Transition in Nematic Liquid Crystal 2,7-Bis(4-pentylphenyl)-9,9-diethyl-9H-fluorene. J. Phys. Chem. B 2018, 122, 10627–10636. [Google Scholar] [CrossRef]
- Georgopoulos, D.; Kripotou, S.; Argyraki, E.; Kyritsis, A.; Pissis, P. Study of Isothermal Crystallization Kinetics of 5CB with Differential Scanning Calorimetry and Broadband Dielectric Spectroscopy. Mol. Cryst. Liq. Cryst. 2015, 611, 197–207. [Google Scholar] [CrossRef]
- Mastrangelo, J.C.; Blanton, T.N.; Chen, S.H. Crystallization upon thermal annealing of a glass-forming liquid crystal in the nematic regime. Appl. Phys. Lett. 1995, 66, 2212–2214. [Google Scholar] [CrossRef]
- Juszyńska, E.; Jasiurkowska, M.; Massalska-Arodź, M.; Takajo, D.; Inaba, A. Phase Transition and Structure Studies of a Liquid Crystalline Schiff-Base Compound (4O.8). Mol. Cryst. Liq. Cryst. 2011, 540, 127–134. [Google Scholar] [CrossRef]
- Dierking, I. Textures of Liquid Crystals; Wiley-VCH Verlag GmbH & Co. KGaA: Weinheim, Germany, 2003; ISBN 3527307257. [Google Scholar]
- Jasiurkowska-Delaporte, M.; Napolitano, S.; Leys, J.; Juszyńska-Gałązka, E.; Wübbenhorst, M.; Massalska-Arodź, M. Glass Transition Dynamics and Crystallization Kinetics in the Smectic Liquid Crystal 4-n-Butyloxybenzylidene-4′-n′-octylaniline (BBOA). J. Phys. Chem. B 2016, 120, 12160–12167. [Google Scholar] [CrossRef] [PubMed]
- Górecka, E.; Chen, L.; Pyżuk, W.; Krówczyński, A.; Kumar, S. X-ray studies of the hexatic phase in liquid crystals with a crystal-B–hexatic-B–smectic-A phase sequence. Phys. Rev. E 1994, 50, 2863–2867. [Google Scholar] [CrossRef]
- Rao, N.V.S.; Potukuchi, D.M.; Pisipati, V.G.K.M. Phase Transitions in N(p-n-Bu toxybenzylidene) p-n-Alkyl Anilines: Density and Refractive Index Studies. Mol. Cryst. Liq. Cryst. 1991, 196, 71–87. [Google Scholar] [CrossRef]
- Haines, P.J. Thermal Methods of Analysis: Principles, Applications and Problems; Springer: Dordrecht, Netherlands, 1995; ISBN 978-0751400502. [Google Scholar]
- Suzuki, Y.; Yamamura, Y.; Sumita, M.; Yasuzuka, S.; Saito, K. Neat Liquid Consisting of Hydrogen-Bonded Tetramers: Dicyclohexylmethanol. J. Phys. Chem. B 2009, 113, 10077–10080. [Google Scholar] [CrossRef]
- Henderson, D.W. Thermal analysis of non-isothermal crystallization kinetics in glass forming liquids. J. Non-Cryst. Solids 1979, 30, 301–315. [Google Scholar] [CrossRef]
- Kissinger, H.E. Variation of Peak Temperature With Heating Rate In Differential Thermal Analysis. J. Res. Natl. Bur. Stand. (1934) 1956, 57, 217–221. [Google Scholar] [CrossRef]
- Augis, J.A.; Bennett, J.E. Calculation of the Avrami parameters for heterogeneous solid state reactions using a modification of the Kissinger method. J. Therm. Anal. Calorim. 1978, 13, 283–292. [Google Scholar] [CrossRef]
- Ozawa, T. Kinetics of non-isothermal crystallization. Polymer 1971, 12, 150–158. [Google Scholar] [CrossRef]
- Liu, Y.; Wang, L.; He, Y.; Li, S. Nonisothermal Crystallization Kinetics of Poly(b-hydroxybutyrate). J. Polym. Sci. Part B Polym. Phys. 1998, 36, 1305–1312. [Google Scholar]
- Liu, T.; Mo, Z.; Wang, S.; Zhang, H. Nonisothermal Melt and Cold Crystallization Kinetics of Poly(Ary1 Ether Ether Ketone Ketone). Polym. Eng. Sci. 1997, 33, 568–575. [Google Scholar] [CrossRef]
- Kołodziejczyk, K.; Tarnacka, M.; Kamińska, E.; Dulski, M.; Kamiński, K.; Paluch, M. Crystallization Kinetics under Confinement. Manipulation of the Crystalline Form of Salol by Varying Pore Diameter. Cryst. Growth Des. 2016, 16, 1218–1227. [Google Scholar] [CrossRef]
- Napolitano, S.; Wübbenhorst, M. Slowing Down of the Crystallization Kinetics in Ultrathin Polymer Films: A Size or an Interface Effect? Macromolecules 2006, 39, 5967–5970. [Google Scholar] [CrossRef]

© 2019 by the authors. Licensee MDPI, Basel, Switzerland. This article is an open access article distributed under the terms and conditions of the Creative Commons Attribution (CC BY) license (http://creativecommons.org/licenses/by/4.0/).