3. Results and Discussion
The samples of the studied materials prepared for compression (4.5 mm thick plates) and tensile experiments (0.5 mm thick sheets) were characterized with DSC, DMA, SAXS and SALS. The results are presented in
Table 2. Samples were stored at least two months prior to use to facilitate the transformation of the crystalline phase from the metastable Form II to the stable Form I. It is known that, upon storage at room temperature, Form II spontaneously transforms into the Form I. The transformation is typically completed within about 10 days [
10]. X-ray examination revealed that the aged samples contained from 96–97% (homopolymers B1 and B2) to 100% (copolymers C4 and C10) of the stable Form I. The residual fraction of crystals of the Form II remained stable even after long shelf storage (up to two years).
All samples were prepared according to the same protocol, including a rapid cooling of the compression molded plates, however, due to different heat transfer rate in thick and thin plates, they differed in quantity and size of crystals: tensile samples that crystallized faster demonstrated slightly lower crystallinity, lower melting point, hence thinner crystals and shorter long period than thick samples designed for compression. The differences were, however small enough to consider the structure of tensile and compression samples nearly the same. On the other hand, when comparing samples of various contents of the ethylene comonomer, a gradual significant reduction of the melting temperature (thus, crystal thickness), and crystallinity degree, long period as well as the average spherulite size, all with increasing content of ethylene co-units were observed. As demonstrated by di Lorenzo et al. [
37], who studied the same set of polymers, increasing comonomer content results also in an increase in the so-called rigid-amorphous fraction in the amorphous component, located near the crystal-amorphous interface: from approximately 20 wt.% in B1 homopolymer to above 30 wt.% in C10 copolymer. This implies only moderate increase of the mobile-amorphous phase fraction from approximately 30 wt.% in homopolymer to about 40–45 wt.% in C10 copolymer, despite a significant reduction in crystallinity (from X
c ≈ 54 wt.% to 28 wt.%, respectively). Comparing to the crystal thickness, the rigid-amorphous layer thickness in a homopolymer was only 20–30% of the crystal thickness. However, the rigid-amorphous layer thickness drastically increased in copolymers to attain a thickness of 50–75% of the thickness of the crystals, due to the presence of 5–10 mol% ethylene co-units in the butene-1 chain [
37].
DSC heating scans revealed that, in addition to the main melting peak, samples of C4 and C10 copolymers exhibited an additional, small melting peak at about 33–35 °C in freshly molded samples that shifted to approximately 45 °C after the shelf storage. In samples of B1 and B2 homopolymers as well as C1 copolymer of low ethylene content, this other peak was not observed. The WAXS measurements excluded the existence of different crystal forms in aged C4 and C10 samples. As demonstrated by Azzurri et al. [
42], this secondary peak is related to the melting of extremely small and imperfect iPB-1 crystals of reduced thermodynamic stability. Formation of such imperfect crystallites is likely in random copolymers of higher ethylene content, such as C4 and C10. Only to get a rough idea about their approximate size, the discussed crystals can be compared to crystals of C
xH
2x + 2 paraffins, for which T
m = 45 °C corresponds to the length of the paraffin chains of merely x = 23 [
43] (p. 27).
As expected, the glass transition temperature also shifted towards lower values with increasing ethylene comonomer content, although not very much—only about −10 °C for copolymer containing 10.5 mol% of ethylene—possibly due to the presence of a significant fraction of the rigid-amorphous phase.
In the first deformation experiment, the samples were deformed in the plane-strain compression at room temperature and the constant true strain rate, using the channel-die fixture. Channel-die compression is kinematically very similar to plane-strain tension [
35]. The deformation in plane-strain compression is macroscopically homogeneous and proceeds without any instabilities, e.g., necking or cavitation.
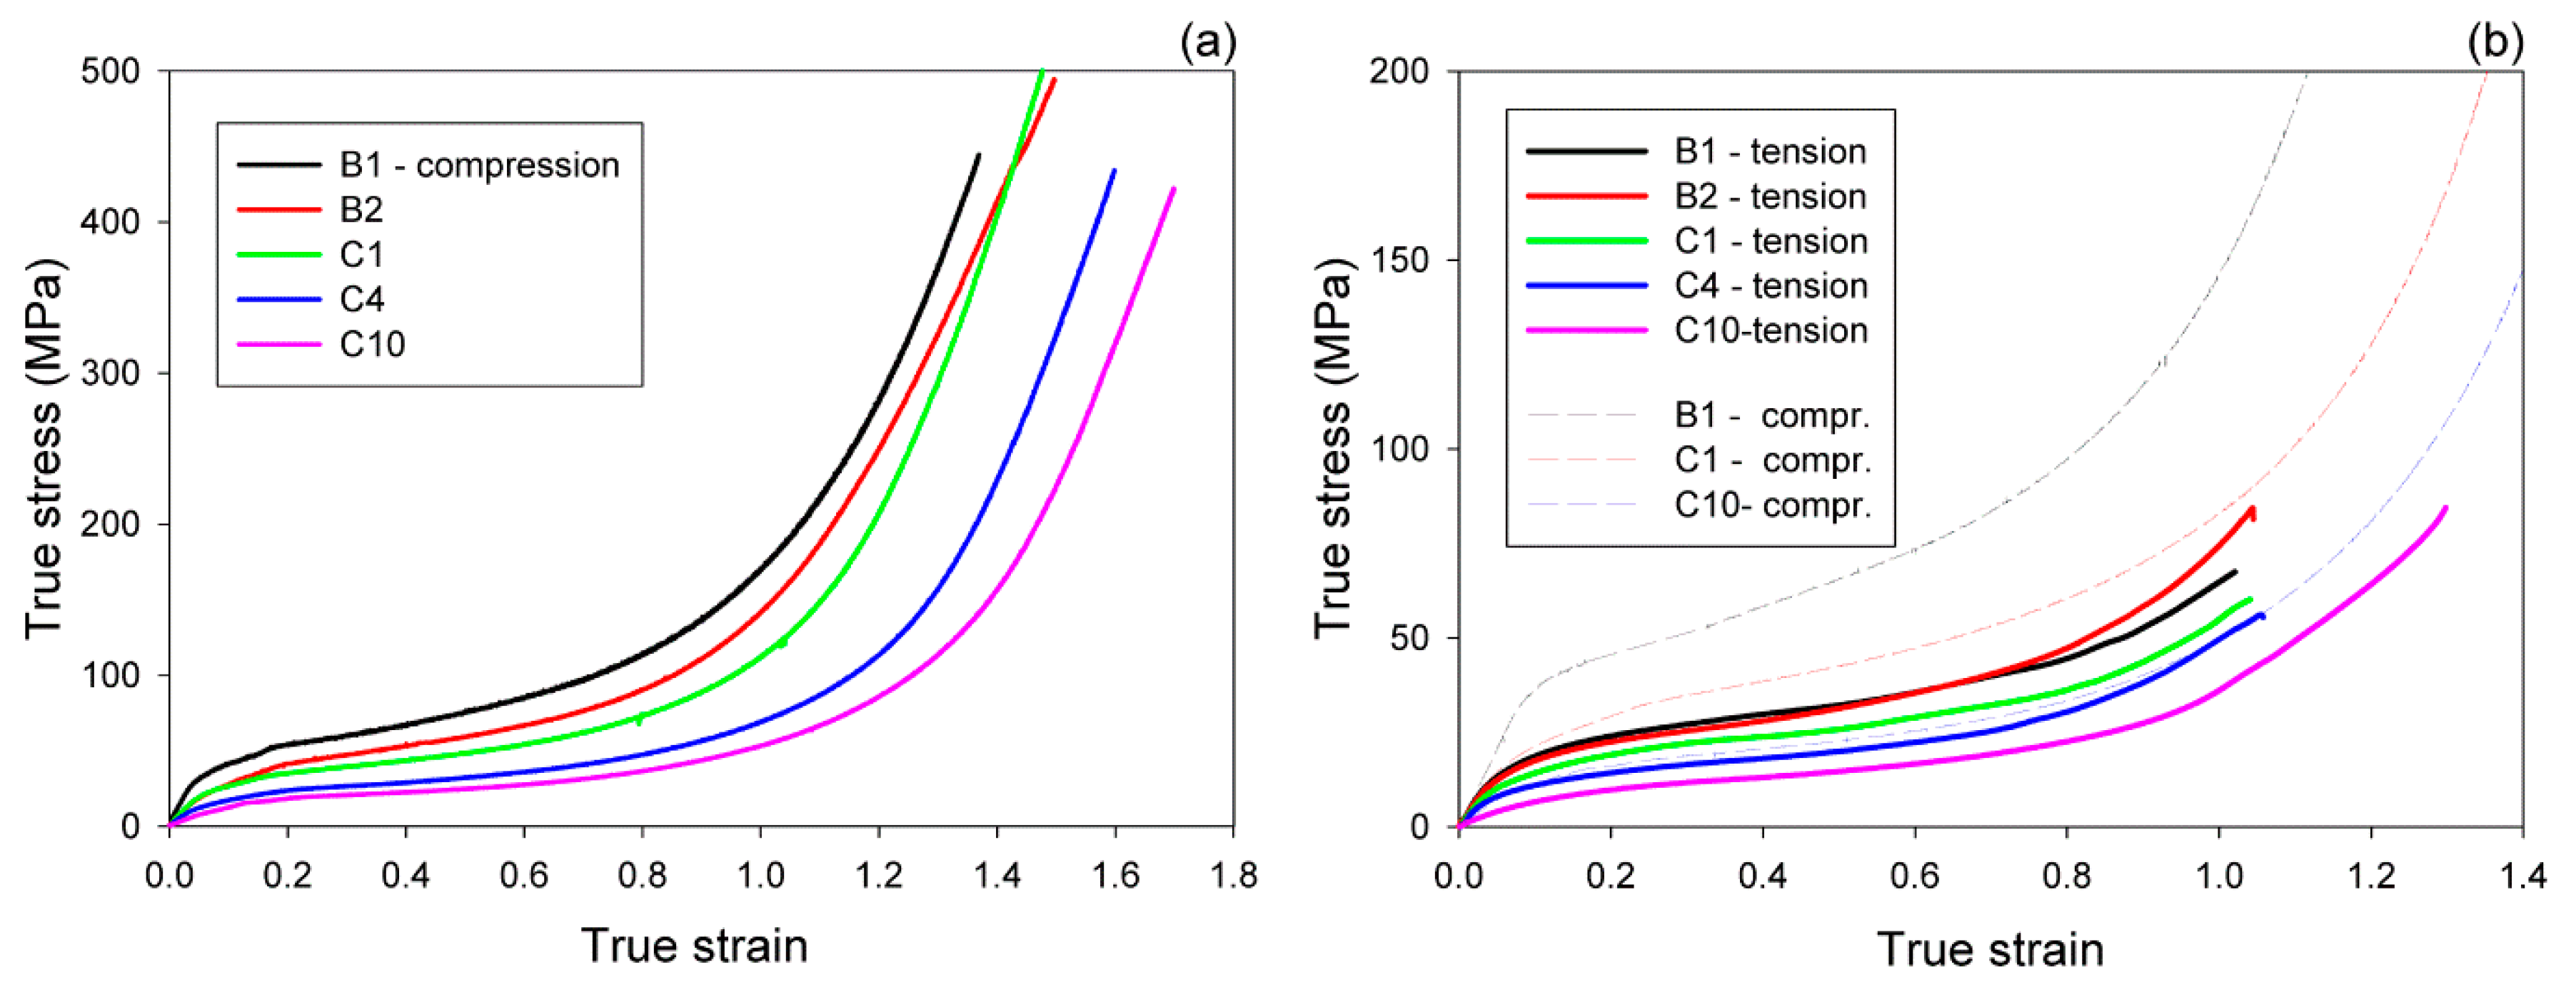
Figure 1a shows a representative set of true stress–true strain curves determined for studied samples compressed at room temperature. All obtained curves had a smooth shape typical for the plane-strain compression of a semicrystalline polymer [
44], with a clear elastic and then plastic flow range, followed by the strong stress hardening stage that led to extremely high stresses at high strain. Similar to other semicrystalline polymers, the yield stress increased with increasing lamella thickness [
45], i.e., C10→C4→C1→B2→B1, which coincided with a decreasing content of the comonomer. For B1 and B2 homopolymers, the lower molecular weight of B1 resulted in formation of thicker crystals than in B2, which in turn, led to the higher yield of B1. On the other hand, the strain hardening, controlled by the properties of the molecular network [
46,
47,
48], seemed to be equally intense in all samples (similar slope of all curves in the high strain range), although its beginning shifted towards higher strains with increasing ethylene content. This shift, as well as the slope of the stress–strain curve decreasing with ethylene content in the mid-strain range, was attributed to an increasing amount of the amorphous component in copolymers, resulting in a probably lower concentration of the active so-called “stress transmitters” (ST)—the chain segments that can transmit the load between neighboring lamellae, e.g., tie-molecules or entangled loops—due to chain entanglements and chain segments immobilized at the crystal-amorphous interfaces.
Figure 1b presents the representative true stress–true strain curves obtained in the second experiment, for samples deformed in uniaxial tension, also at room temperature. These curves were calculated from the load–displacement data combined with actual sample cross-section and the local extension (determined from increasing distance between ink marks), both determined from sample images recorded during stretching in function of the displacement. True stress–true strain curves of similar shape were obtained for iPB-1 by Weynant et al. [
11] and Al-Hussein et al. [
19]. The homo- and copolymer samples yielded with the formation of a distinct neck upon drawing, which was relatively sharp in homopolymers and diffuse in copolymers of high ethylene content. As the neck was formed, a whitening of the deforming section of the sample was also observed, very strong in B1 homopolymer, notably weaker in B2 and nearly absent in C1 copolymer. Deformation of C4 and C10 proceeded without any whitening. Sample whitening is an indication of an extensive cavitation of the material occurring during yielding, especially in homopolymer samples [
34,
49]. As a result of yielding and neck formation, the raw load–extension curves exhibited a common yield tooth (a distinct local maximum separating elastic and plastic stages of deformation), sharp in homopolymers and progressively broadening and lowering in copolymers with increasing ethylene content. However, this maximum disappeared when the load–displacement curves were transformed into the true stress–true strain curves, demonstrating that the maximum observed in the tensile load–displacement curve of iPB-1 was apparently related entirely to the reduction of the sample cross-section when the neck was formed, similar to many other polymers [
46]. The tensile curves converted to the true stress and true strain units (marked with thick solid lines in
Figure 1b) took a shape similar to the respective compression curves (marked with thin dashed lines). The stress in tension was, however, much lower than in compression of the respective material at any stage of the deformation process. One of the reasons was the friction of the deforming sample against the walls of the channel-die, which increased the load in compression. The second was the dependence of the plastic resistance of polymer crystals on the normal stress component acting perpendicular to the slip plane [
50], which resulted in an increase of the macroscopic yield and plastic flow stresses in compression, while in their reduction in tensile deformation mode [
51]. The third—and in our opinion the most significant one—was the dilatation of the amorphous phase during deformation, including cavitation phenomena, which could notably reduce the stress calculated from the load, since the real cross-section area of the sample was actually smaller than calculated from its external dimensions [
34]. Another feature of tensile deformation was that samples demonstrated strain hardening similar to that observed in compression, manifesting in similar slopes at high strains, yet usually fractured much earlier, at lower strain and much lower stress than samples deformed in plane-strain compression. Specimens of the low aspect ratio (width of the specimen in the narrow section being close to the length of this section) used primarily in this study fractured below the true strain of e = 1.1, although other specimens, with larger aspect ratio of 5 (GL = 25 mm, w = 5 mm), used in a few additional tensile experiments, were able to deform to the true strain above 1.3 before break. Another interesting observation is that the B1 homopolymer demonstrated in tension the stress similar to or even lower than B2 at large strains, in contrast to compression, where B1 demonstrated higher stress than B2 in the entire strain range. Such behavior in tension can be related to significantly stronger cavitation observed in B1 than in B2.
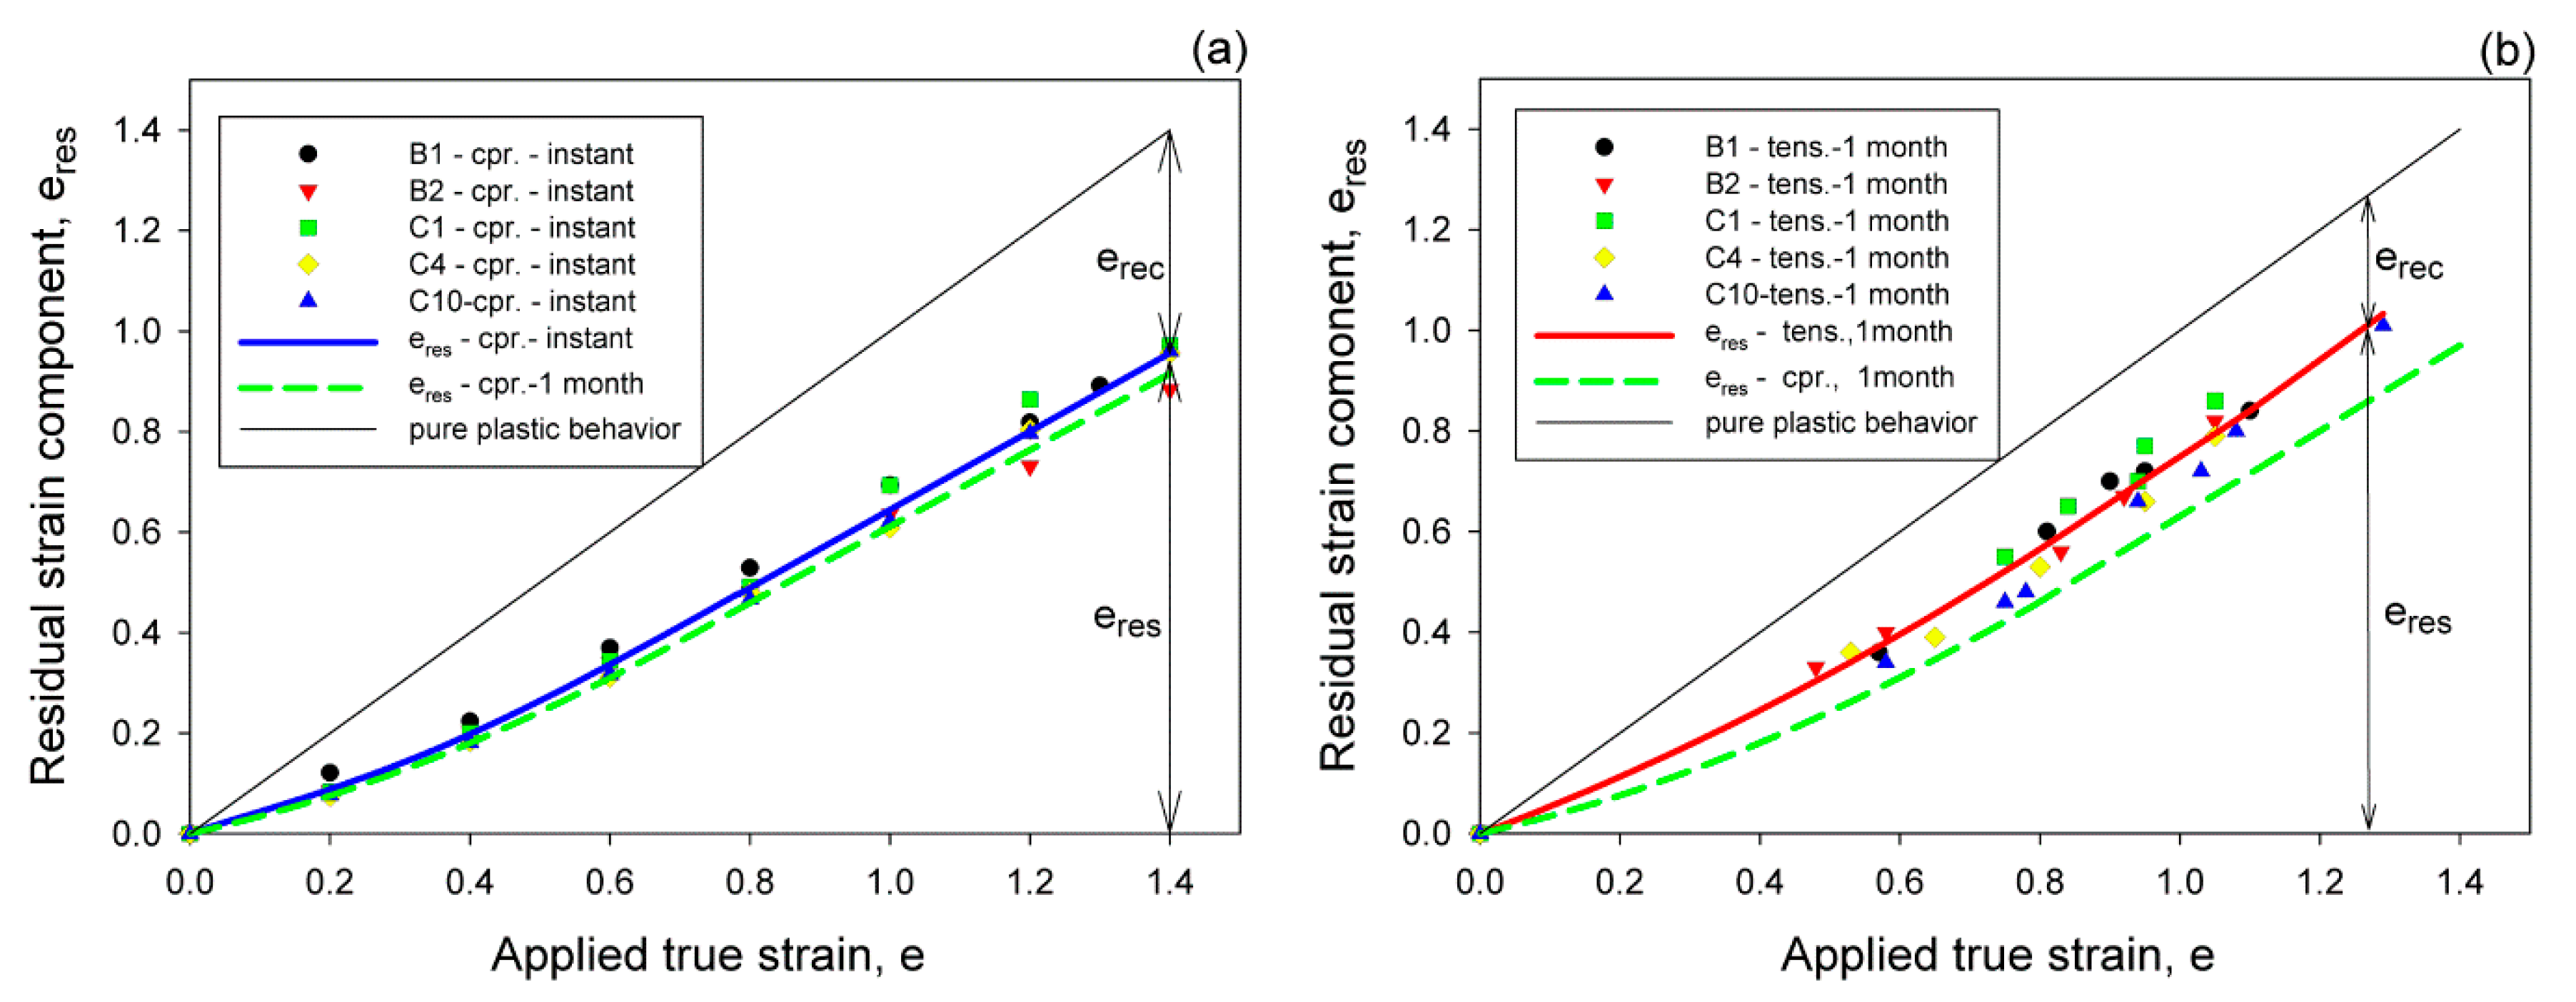
Samples deformed to a given strain, either in compression or tension, and then unloaded demonstrated a strong strain recovery, related primarily to the elasticity of the molecular network within amorphous phase [
46,
47]. Generally, the recovery behavior of iPB-1 deformed at room temperature observed here was similar to that found in other polymers, although it appeared stronger than recovery of polymers of higher crystallinity, e.g., linear polyethylene [
46,
47]. Most of the recovery is almost immediate, although several weeks were required to complete the recovery process—cf.
Figure 2a, where the lines representing the instant and one-month-recovery after compression are plotted. The points in this figure represent the instant recovery of samples of various comonomer content, characterized by different crystallinity. It appeared that for all compositions the recovery was substantial and there were only minor differences among the samples. Generally, the residual strain left in the sample after a given recovery period decreased slightly with increasing content of the comonomer, thus with decreasing crystallinity.
Figure 2b presents the recovery behavior of tensile samples. This recovery was similar to that observed after compression, except that the residual strain left in the sample after tensile deformation was larger than the respective residual strain after compression, i.e., the recovery after drawing appears weaker than after compression. This difference was related to the much stronger constraints imposed on the material when compressed in the plane-strain conditions than in uniaxial tension. As it demonstrated below, the weaker constraints in tension did not prevent a partial destruction of the initial structure, including the molecular network of the amorphous phase. Its partial destruction facilitated reduction of the recoverable rubbery-elastic contribution to the strain and consequently led to greater permanent strain left after tensile deformation.
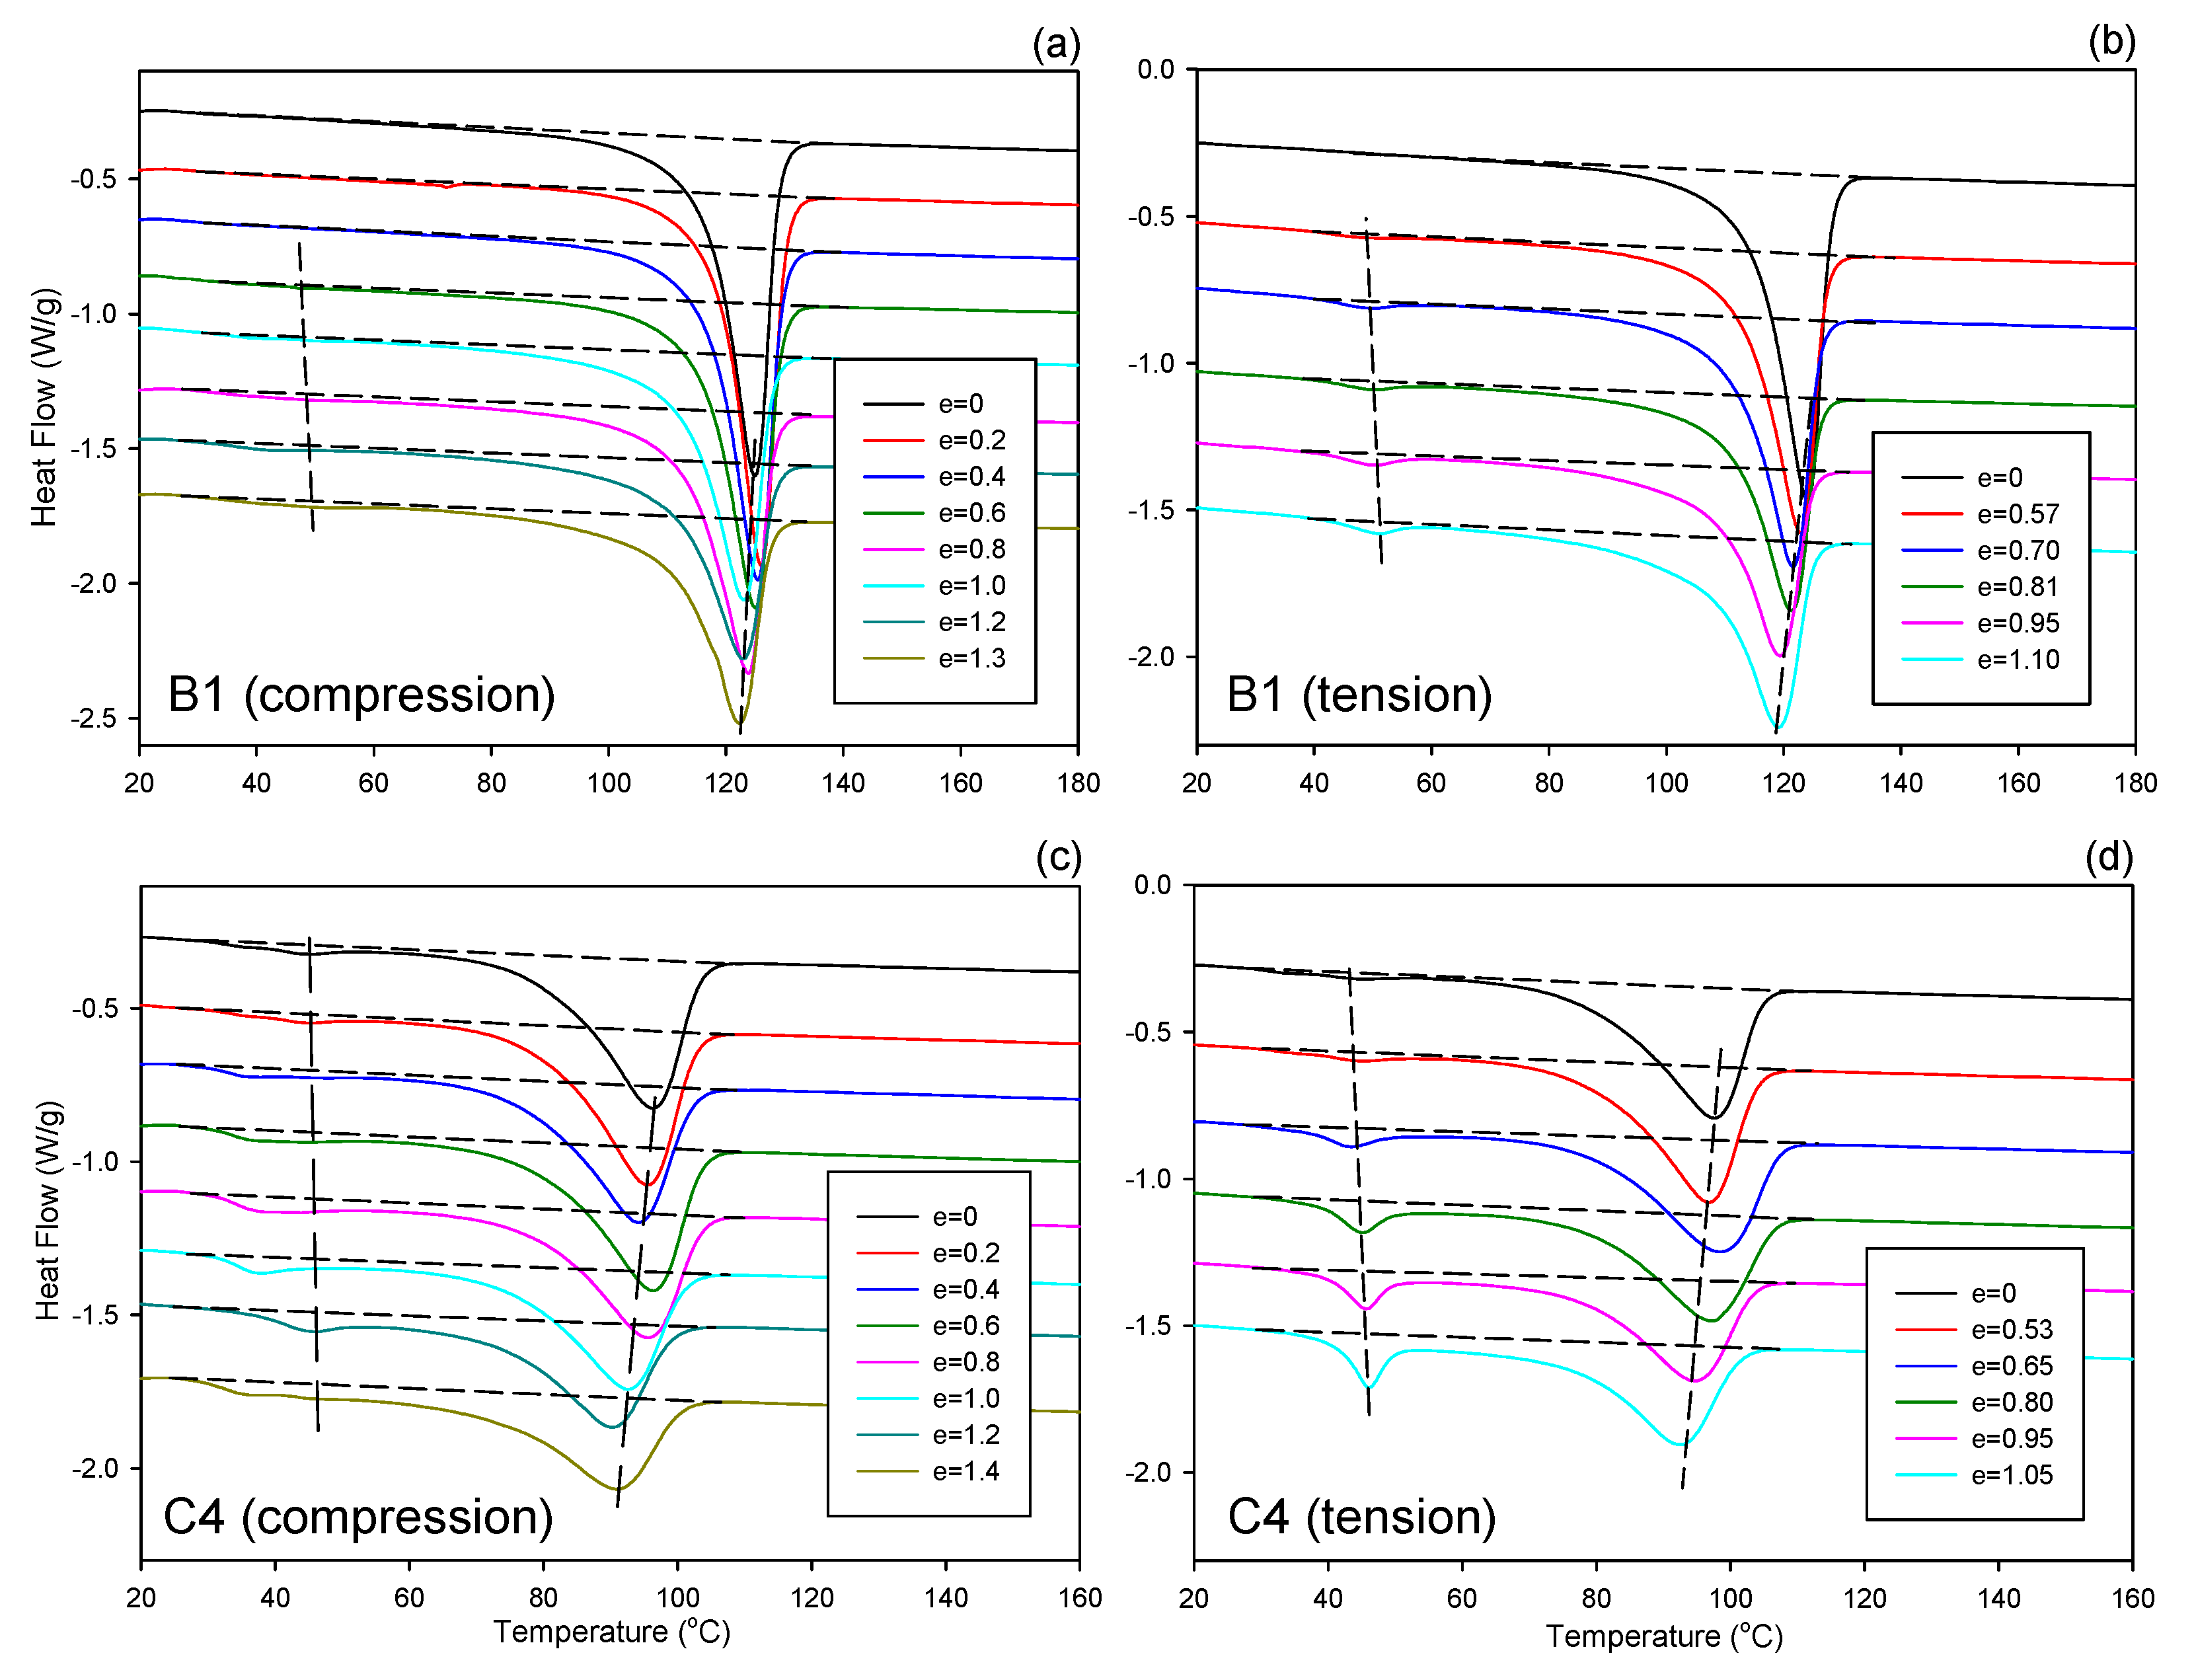
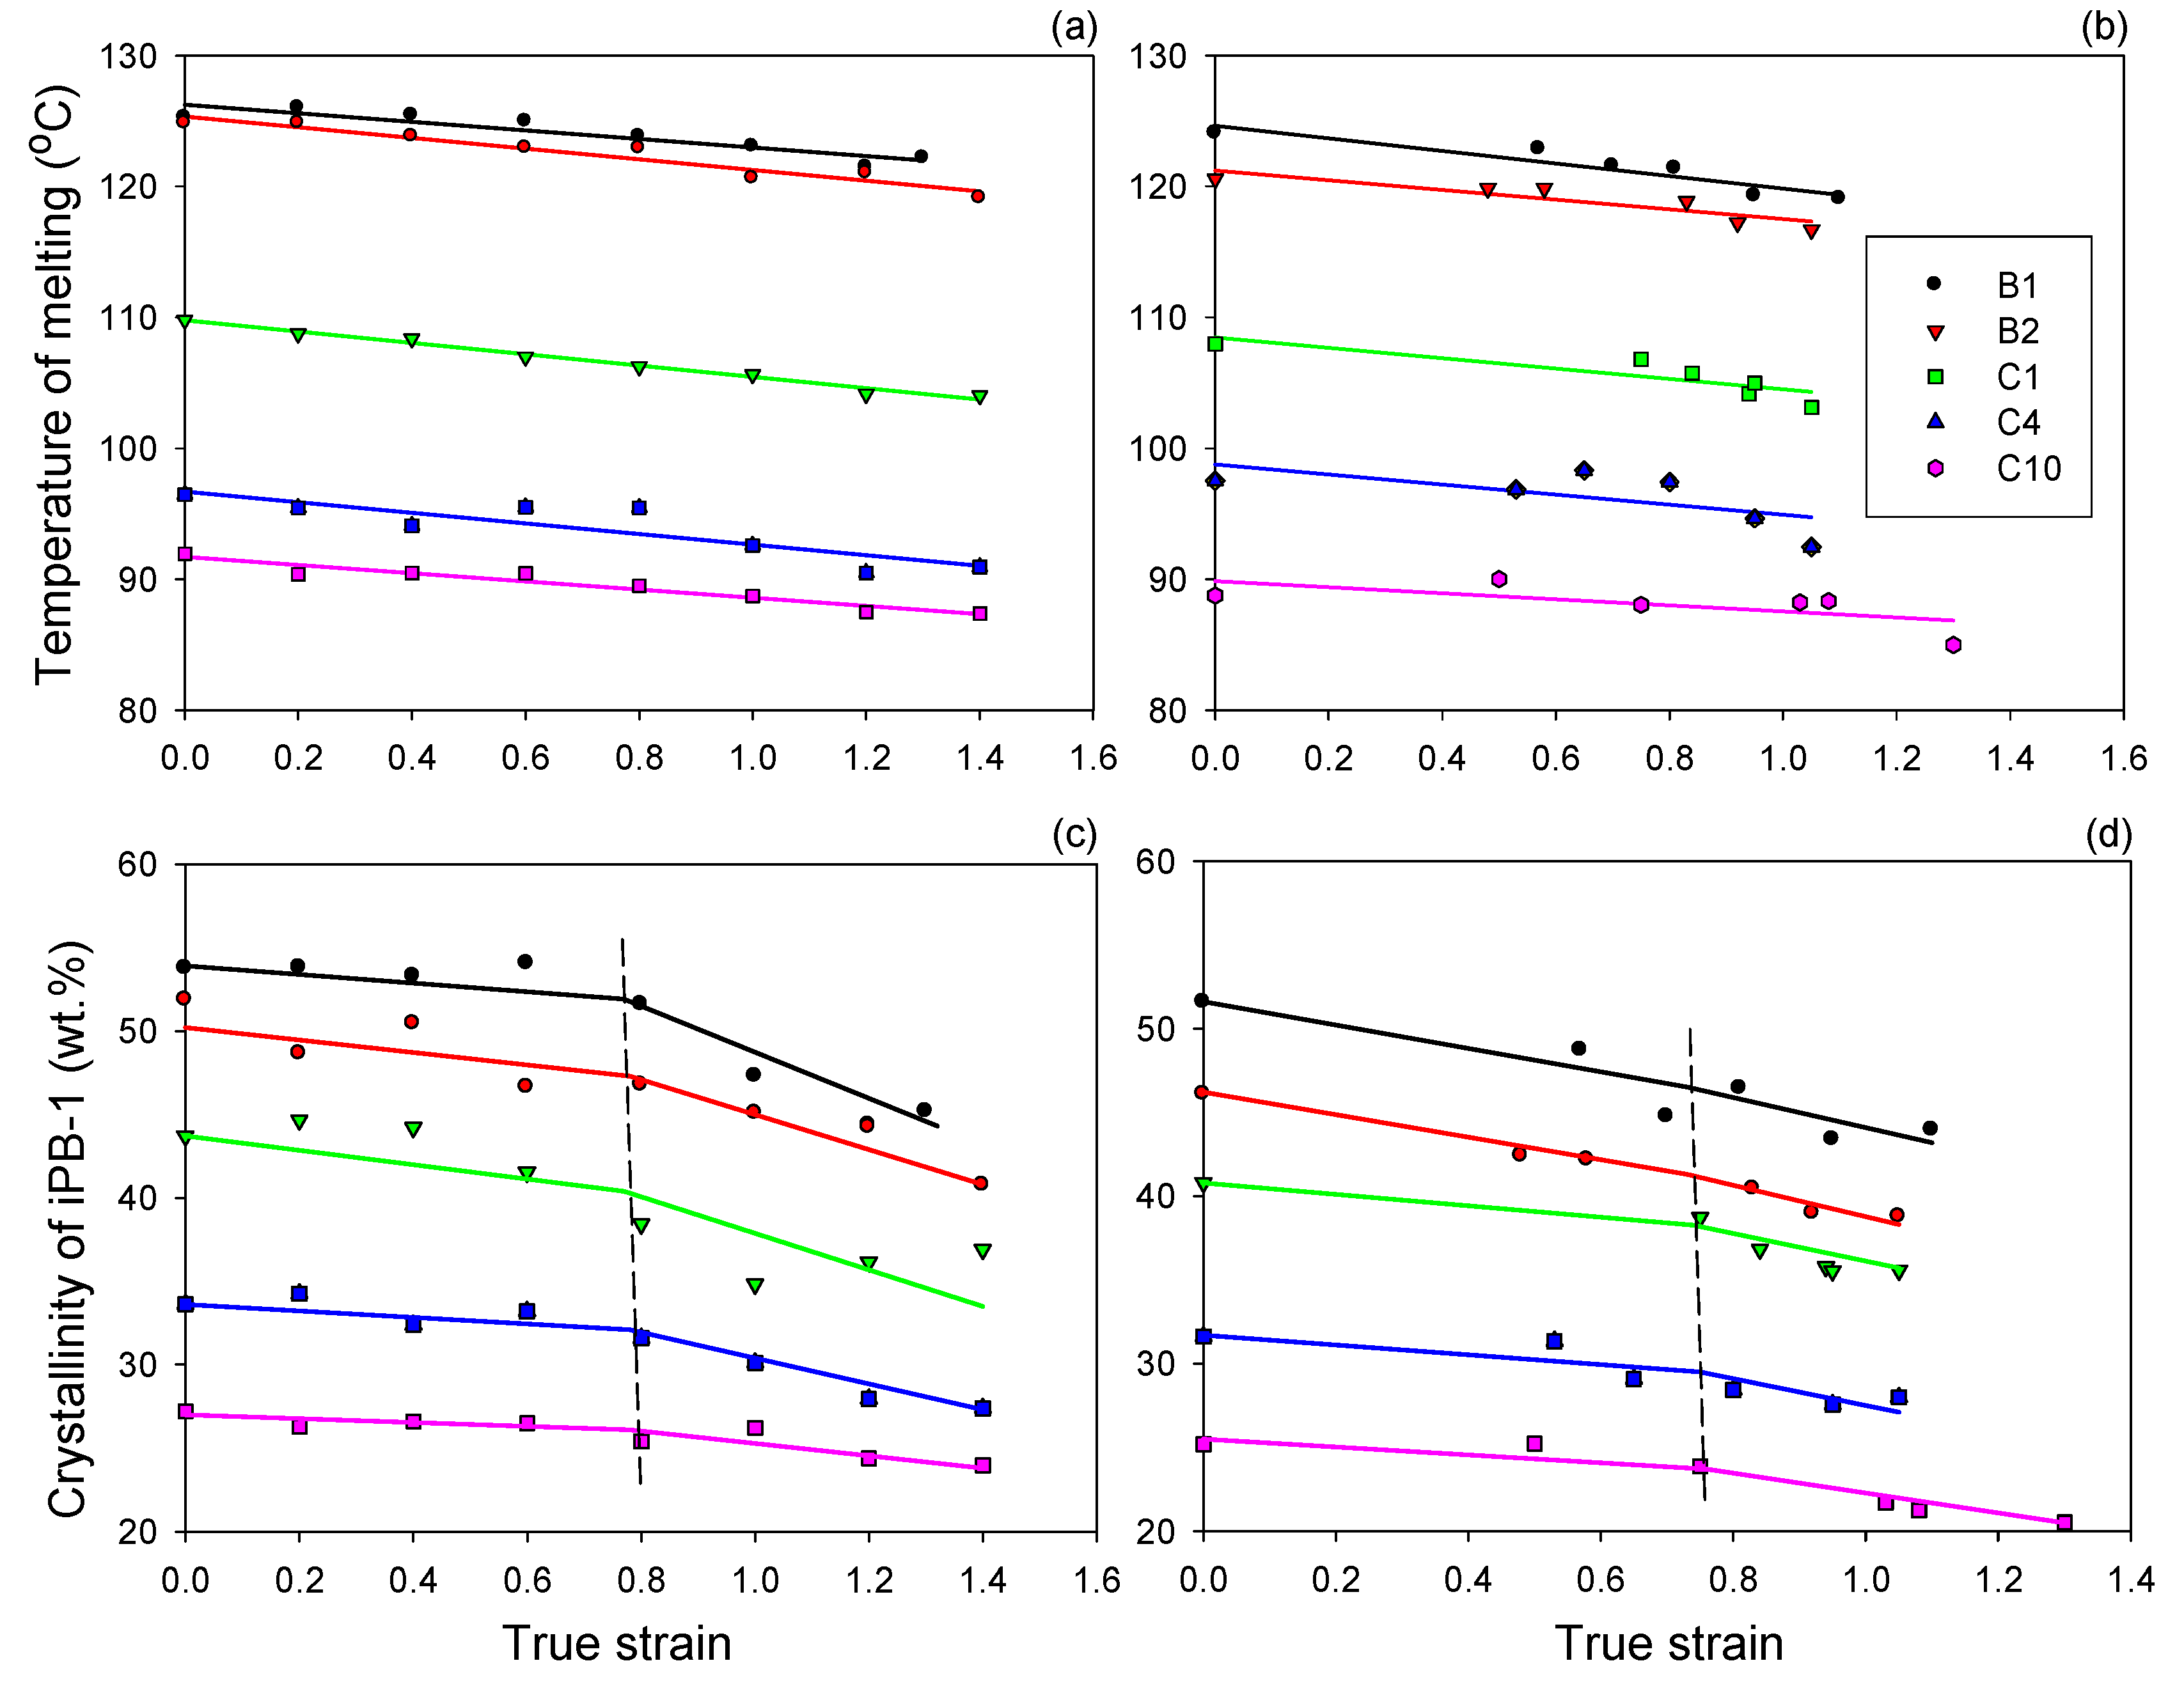
Thermal analysis of samples deformed to various strains (exemplary DSC melting thermograms are presented in
Figure 3) revealed a progressive decrease of the melting temperature and crystallinity with increasing strain, in both compression and tension. Moreover, a small low-melting peak near 45 °C developed progressively with strain increasing from approximately e ≈ 0.6–0.8 on, in both compression and tension. While this peak was not observed in undeformed B1, B2 and C1 samples, it was easily recognized in these materials at high strains (see
Figure 3a,b). For C4 and C10 copolymers, this peak was observed already in initial, undeformed material, yet it increased significantly in deformed samples (see
Figure 3c,d). Similar, small melting peak was observed at approximately 50 °C in drawn iPB-1 samples by Yang and Geil [
12]. As already discussed, this peak was presumably related to the melting of extremely small and highly imperfect crystals of a reduced thermodynamic stability [
42]. Its development with increasing strain indicated a fraction of small and defected crystallites was formed, at the expense of the regular lamellar crystals of the main population—the surface area under the main melting peak decreased with strain in all samples, especially above e ≈ 0.7. Most probably, these imperfect crystals of low thermodynamic stability appeared as a result of partial destruction of the lamellae occurring during their break-up and fragmentation at the strain above 0.6–0.8. They were probably only small residues of partially destroyed pre-existing lamellar crystallites, not new crystallites formed by the strain-induced crystallization.
Figure 4 shows the changes in the melting temperature (represented by the maximum of the main melting peak) and iPB-1 crystallinity (calculated from the area of that peak in relation to the weight fraction of the crystallizing iPB-1 species in the sample) with increasing strain. It can be noted that the temperature of melting decreased slowly with strain for all samples (cf.
Figure 4a,b). That decreasing temperature of the melting peak maximum indicated that the average thickness of crystallites decreased slowly with increasing strain, which was a result of a limited destruction of the thickest crystallites [
35]. On the other hand, the crystallinity derived from the main melting peak showed slightly different behavior: it decreased slowly with strain in the low strain range, however began to decrease somewhat faster at large strains. The change of the slope was more prominent in compressed samples than in tensile ones. The deflection point was located below e = 0.8 for both series (cf.
Figure 4c,d). These results confirm the fragmentation of lamellae and partial destruction of the crystallites postulated above. This process apparently intensified at the strain around 0.8 in both compression and tension. Widespread lamellae fragmentation in iPB-1 materials similar to those studied here, occurring near e ≈ 0.7, was also postulated by Al-Hussein et al. [
19] on the basis of thorough study of deformation and strain recovery. Such a deformation habit, including an extensive break-up of lamellae and eventual destruction of the original lamellar structure, which is frequently replaced by the new microfibrillar structure, especially when deformed in tension, is a general feature of deformation of semicrystalline polymers, broadly evidenced [
4].
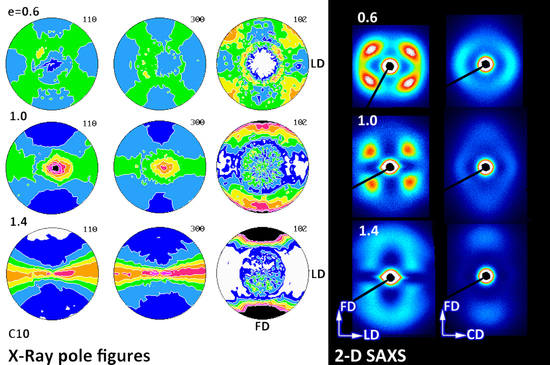
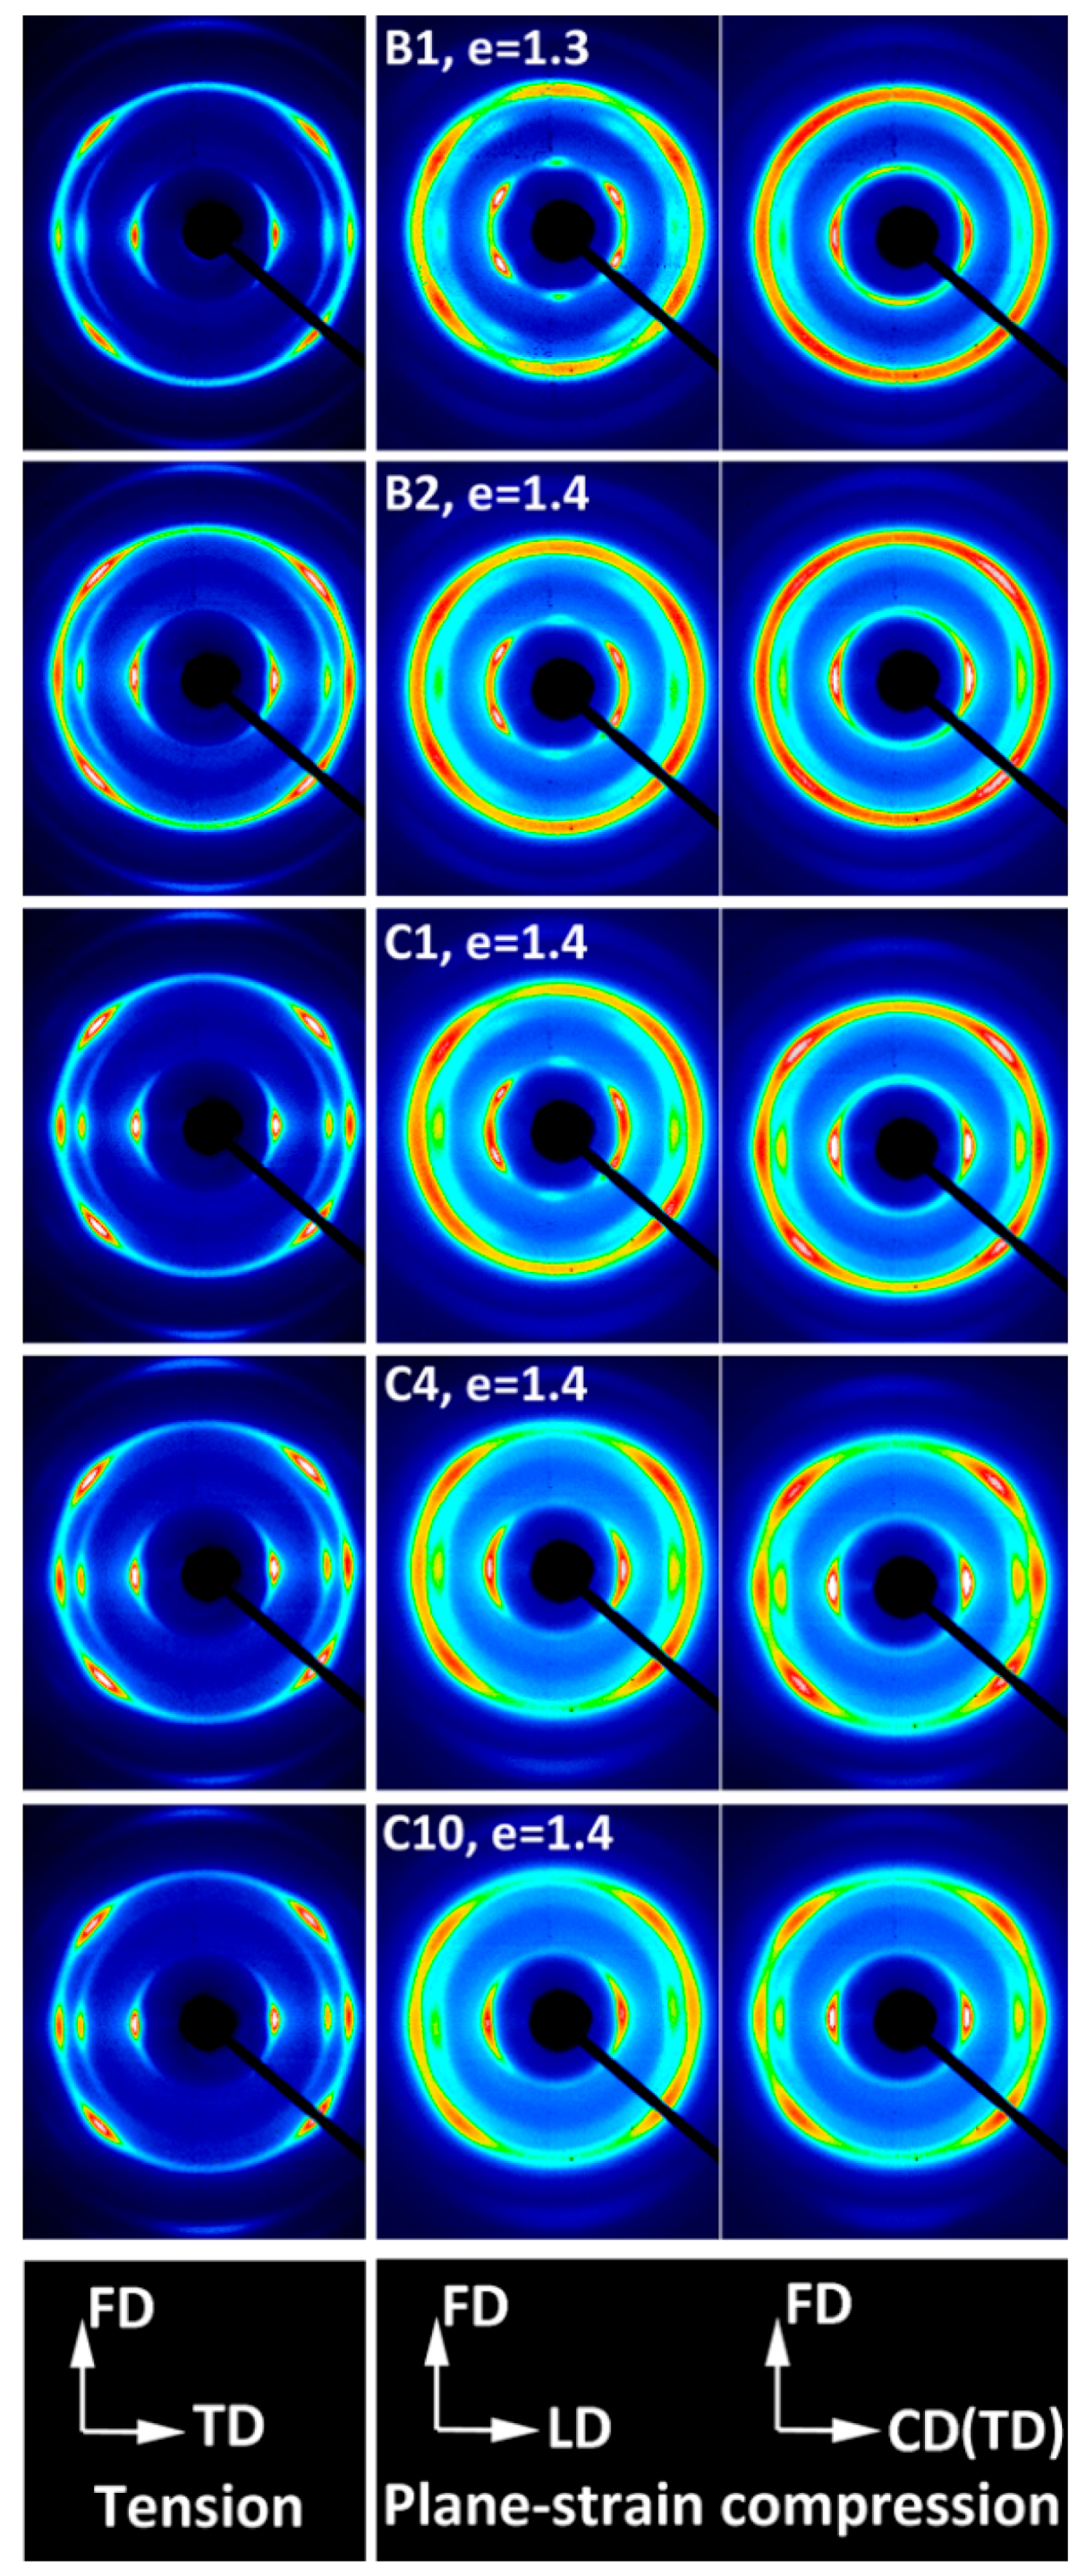
The orientation of the crystalline phase induced by deformation was probed with X-Ray diffraction. To gain a crude idea on crystalline texture developed upon deformation, the 2-D WAXS patterns of samples of high orientation were collected first.
Figure 5 presents exemplary 2-D diffraction images recorded in transmission geometry for compressed and tensile samples, all deformed do the maximum strain (e = 1.3–1.4). Since uniaxial tension resulted in the axial texture along the draw (flow) direction FD, the patterns recorded with the X-Ray beam normal to the specimen plane proved to be sufficient to illustrate the orientation of the crystals. The respective patterns are displayed in the left column. In contrast, textures produced by plane-strain compression usually do not reveal the axial symmetry along the flow direction [
35]. Therefore, two patterns recorded with the primary beam along the loading direction (LD) and along the constrained (transverse) direction (CD and TD) are presented for each compressed sample (in the middle and right columns, respectively).
All highly deformed tensile samples demonstrated similar diffraction patterns, regardless of composition, with the reflections from the (110), (300) and (220) planes of the Form I concentrated in the equatorial region. Additionally, the (211) reflection on the (hk1) first layer was observed, which corresponded to almost the same diffraction angle as (220) reflection and appeared to be located on the same diffraction ring. No reflections related to the Form II were observed. In the polar region, a weaker diffraction arc due to diffraction on (102) planes was also recognized (2Θ = 28.17°). Normal to (102) plane was close to the [001] direction, representing the chain direction in crystals of Form I—they were only 12° apart from each other—and in absence of the (001) reflection it offered the best possible measure of the actual chain direction. The observed features confirmed the fiber texture in highly drawn samples, with the [001] direction (i.e., the chain direction) oriented preferentially along the drawing (flow) direction FD, while the normal of any (hk0) plane being distributed randomly in the equatorial plane, perpendicular to FD. The crystal orientation observed in tensile samples seemed weaker than observed in other highly crystalline polymers, e.g., PE or iPP stretched to similar strain.
Samples of homo- and copolymers deformed in plane-strain compression demonstrated a more complicated and diversified texture—samples of high comonomer content, C4 and C10, showed the texture resembling the fiber texture, similar to tensile samples, although slightly weaker. Samples of B1 and B2 homopolymer and C1 copolymer demonstrated, in turn, a two-component texture consisting of the fiber-like component and additionally a tilted component, recognized in the CD-view patterns as additional diffraction arcs of (110) and (300) planes, away from LD. The orientation in all compressed samples seemed slightly weaker than in the respective tensile samples.
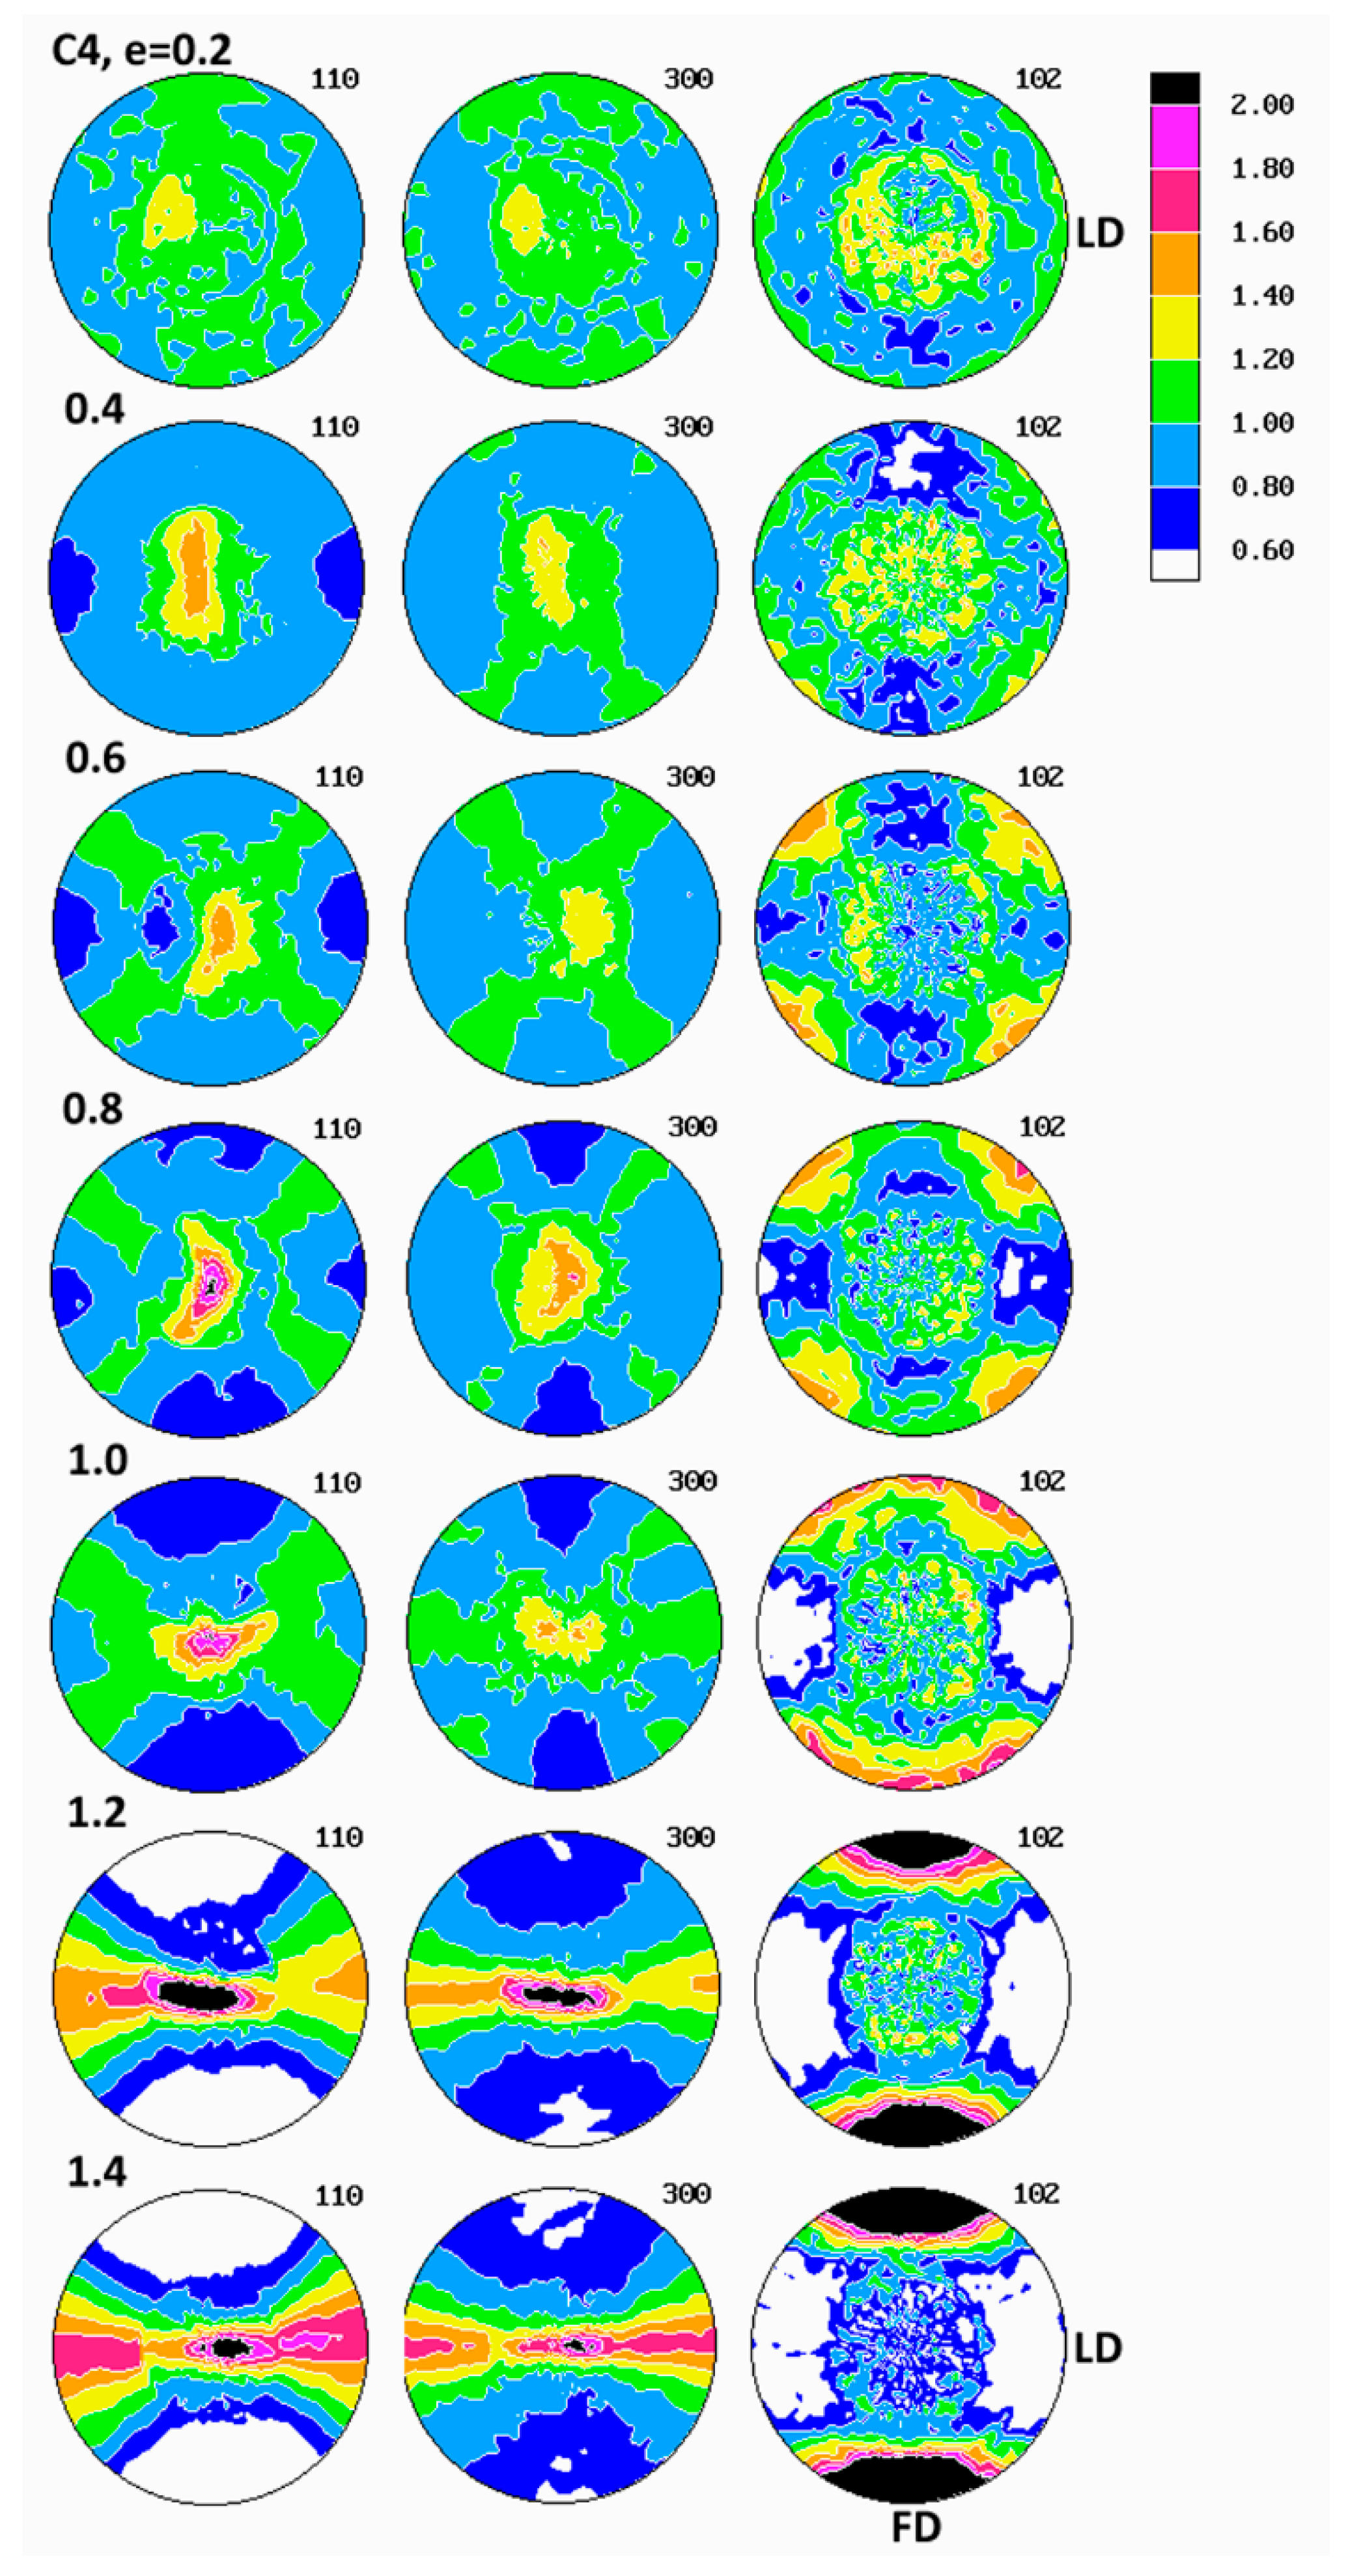
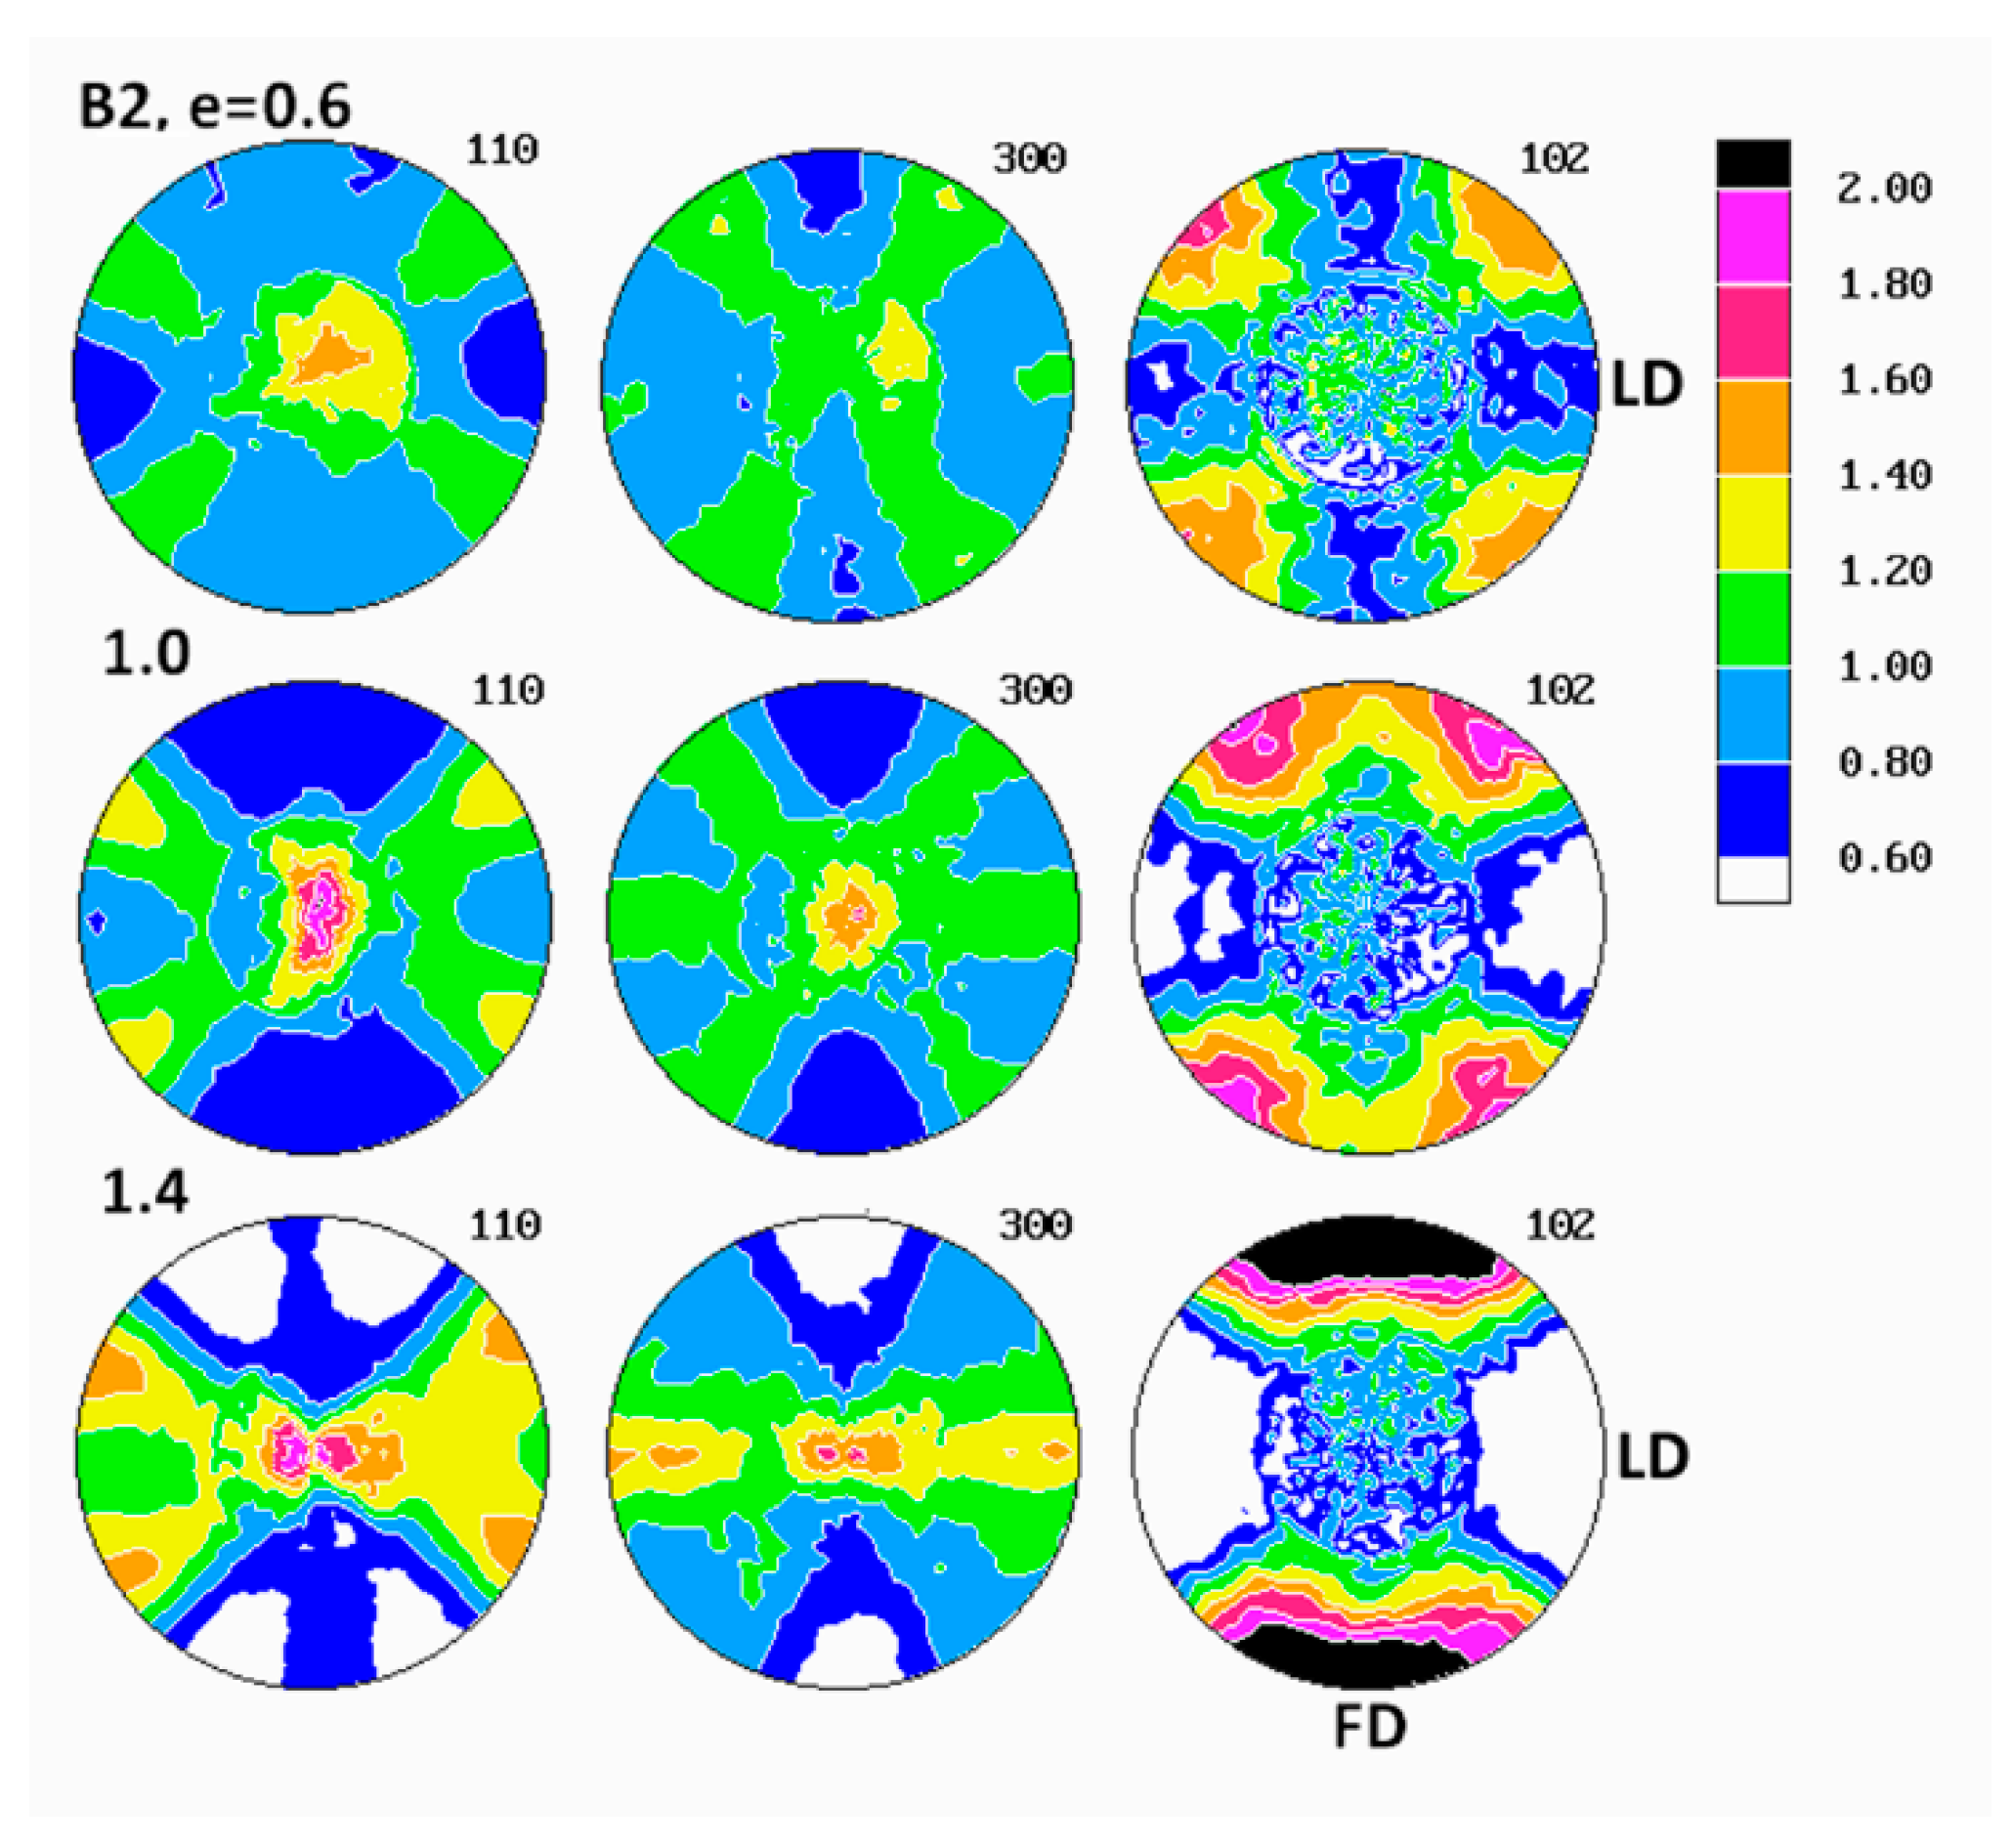
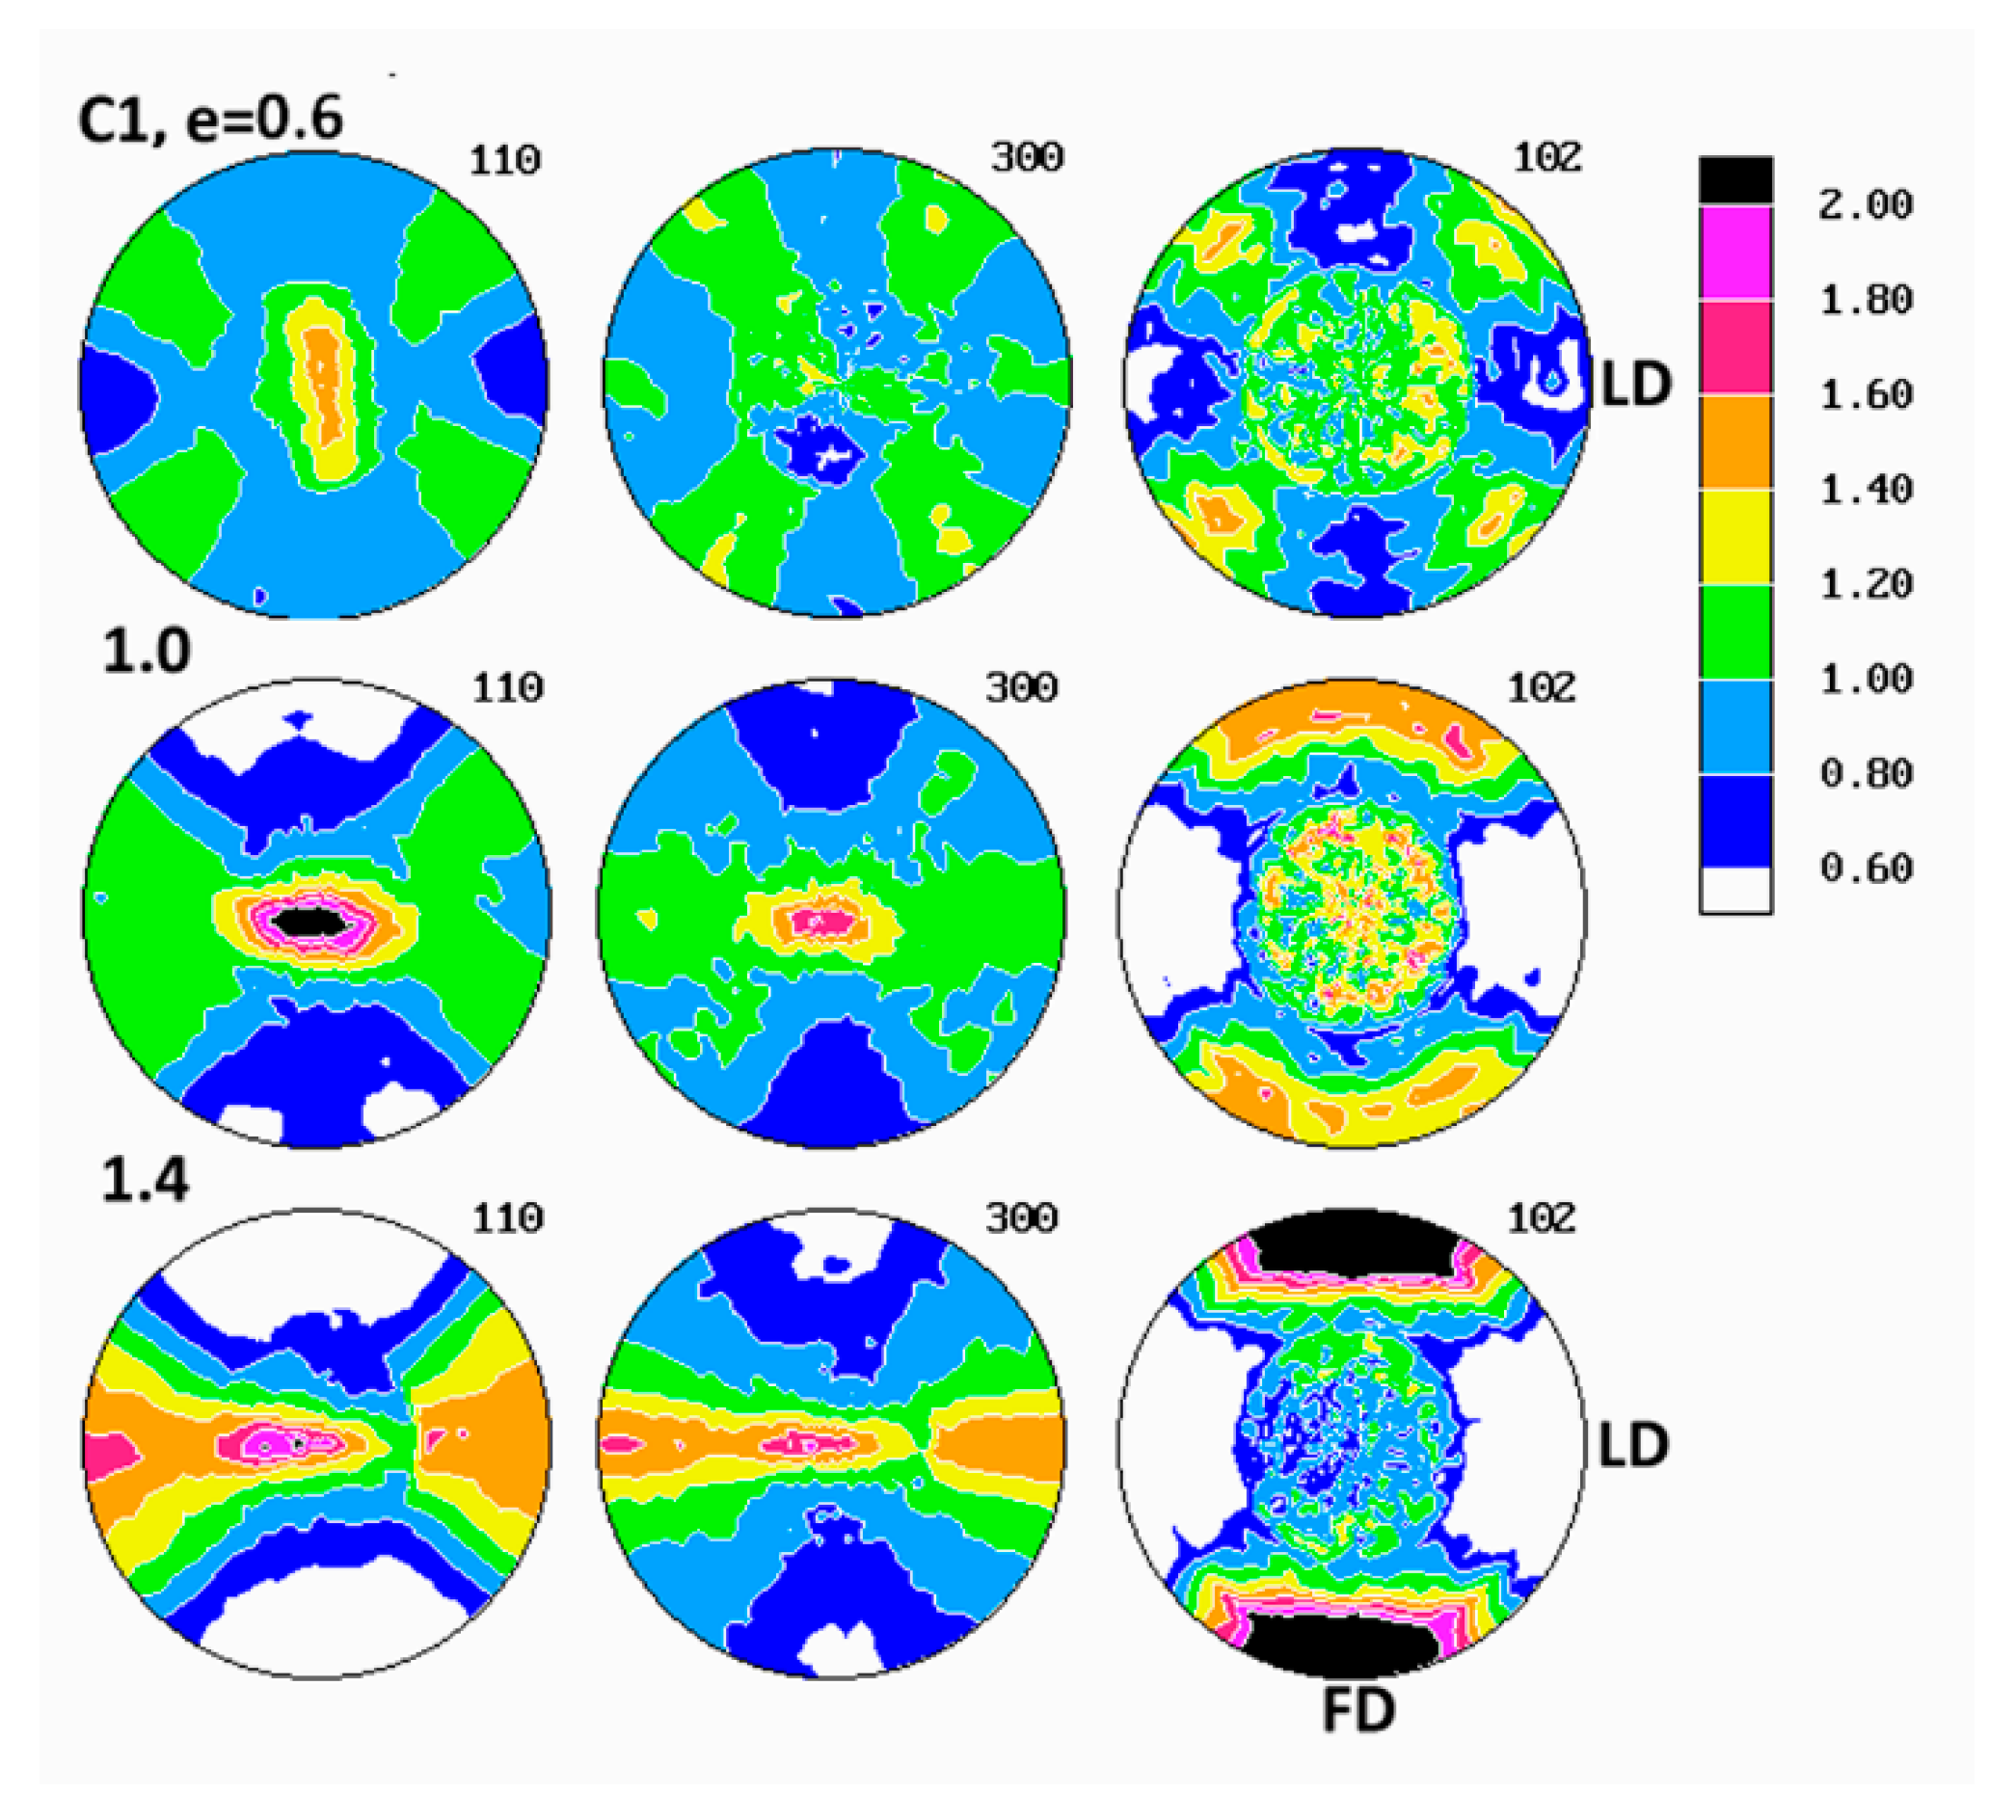
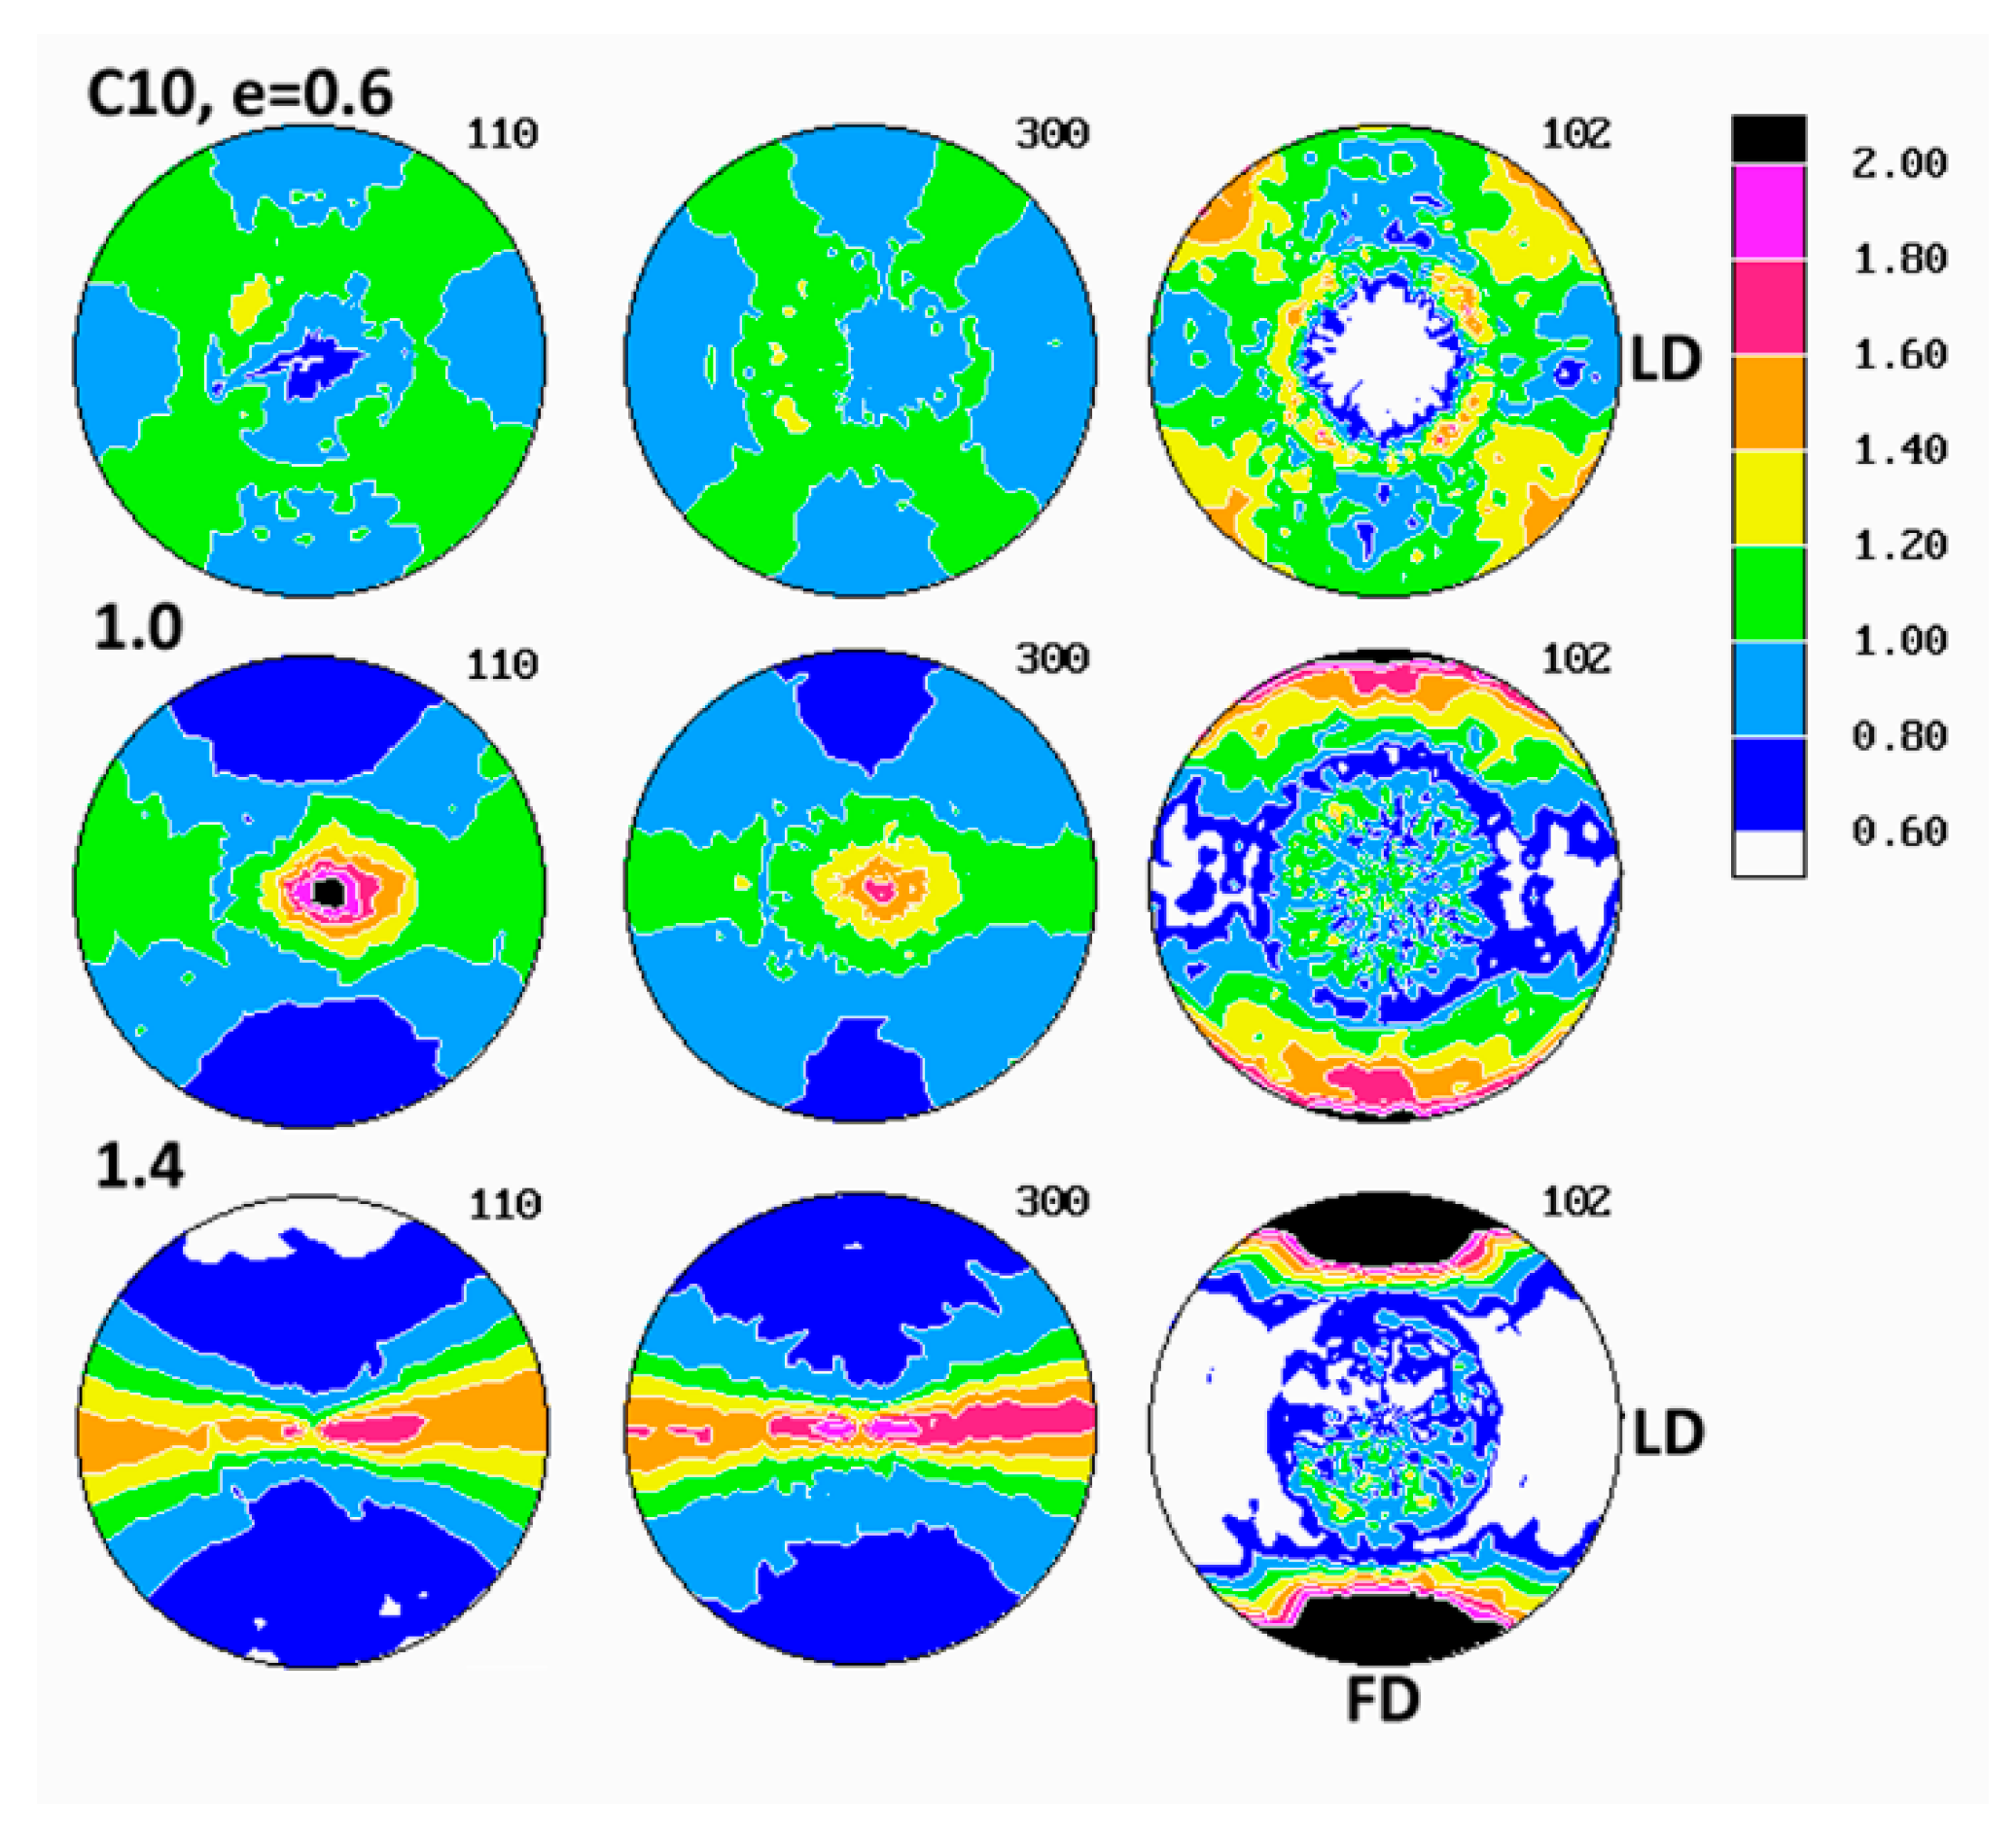
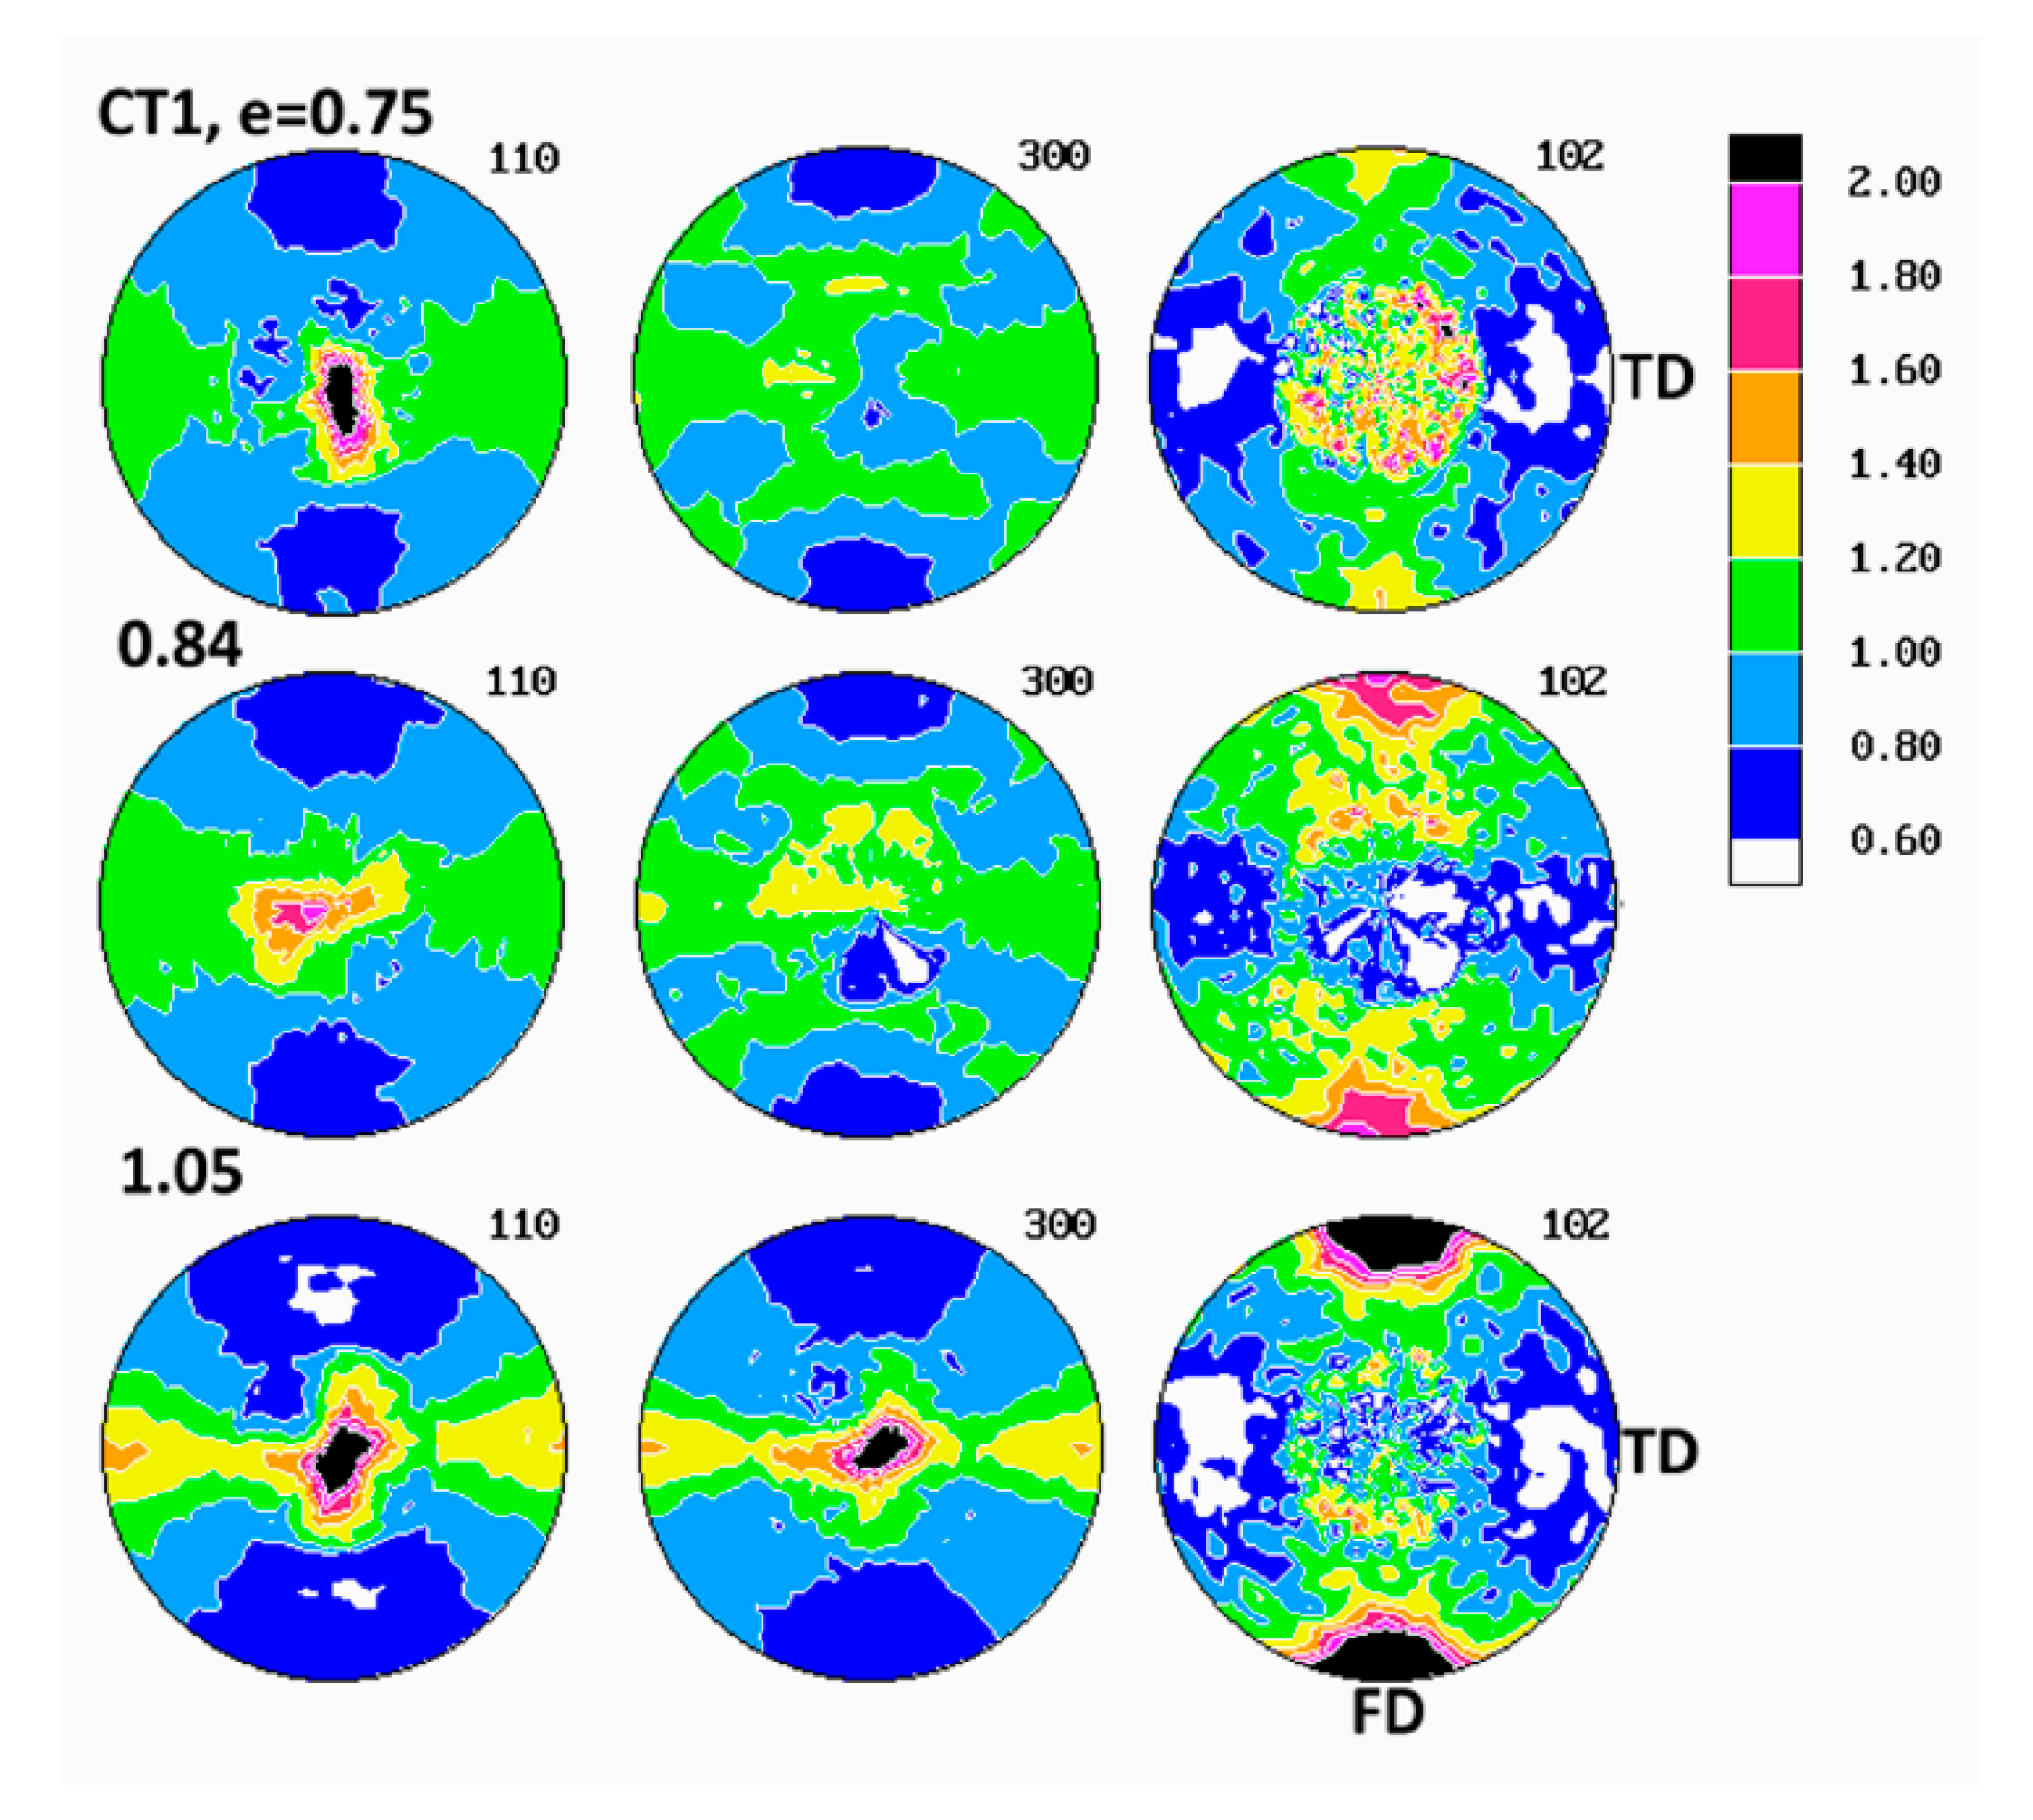
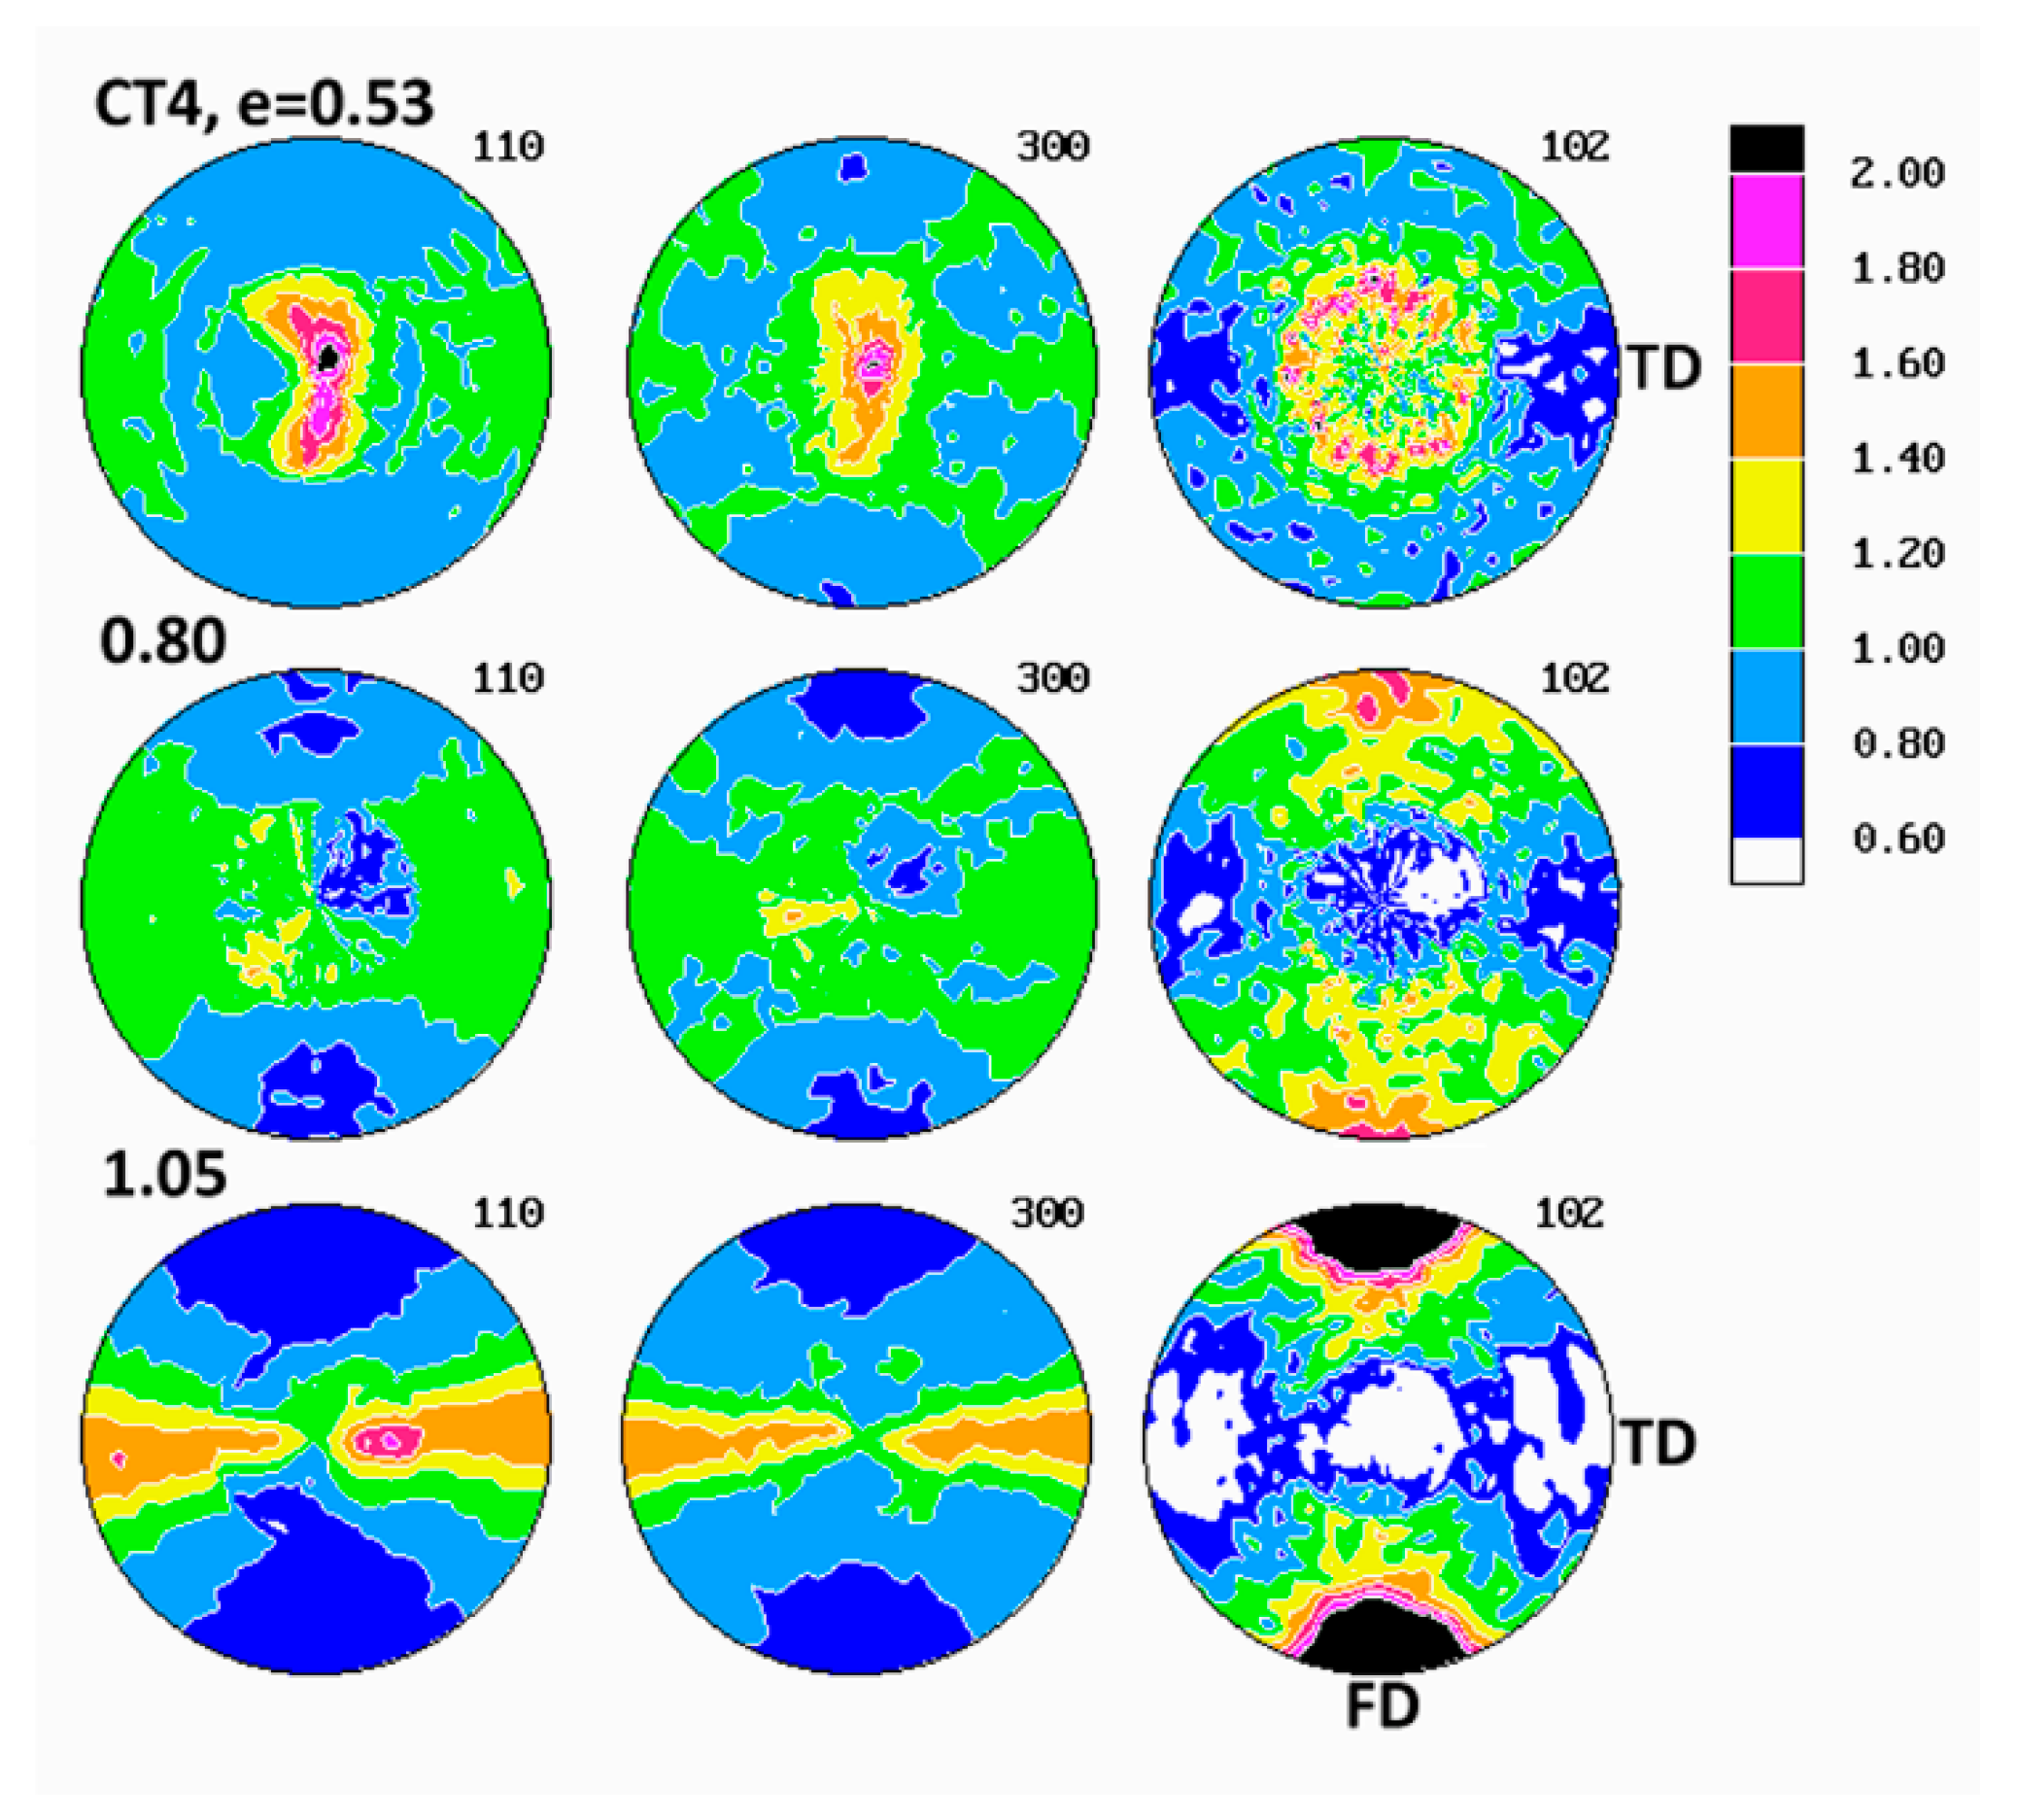
For more details on crystal texture and its development during deformation, as well as to deduce active deformation mechanisms, the orientation of crystallites was examined with the pole figure technique. For each sample, the pole figures of the following crystallographic planes were determined: (110), (300), and (102) of the iPB-1, Form I (2Θ = 10.09°, 17.56° and 28.17°, respectively). Additionally, the pole figures were constructed for the peak located around 2Θ = 20.5°, which was a convolution of the overlapping diffraction peaks of (220) and (211) planes (2Θ = 20.23° and 20.66°, respectively). These (220)/(211) pole figures were used solely for validation of the (110) pole figures, since (220) and (110) reflections corresponded to different orders of diffraction on the same family of crystallographic planes. Indeed, it turned out that for all samples the figures constructed for (220)/(211) included the same features as seen in the respective (110) figures, which confirmed the correctness of the determined pole figures.
It should be mentioned here that all pole figures of compressed samples as well as tensile samples discussed below in this section (presented in
Figure 6,
Figure 7,
Figure 8,
Figure 9 and
Figure 10 and
Figure 11,
Figure 12,
Figure 13,
Figure 14 and
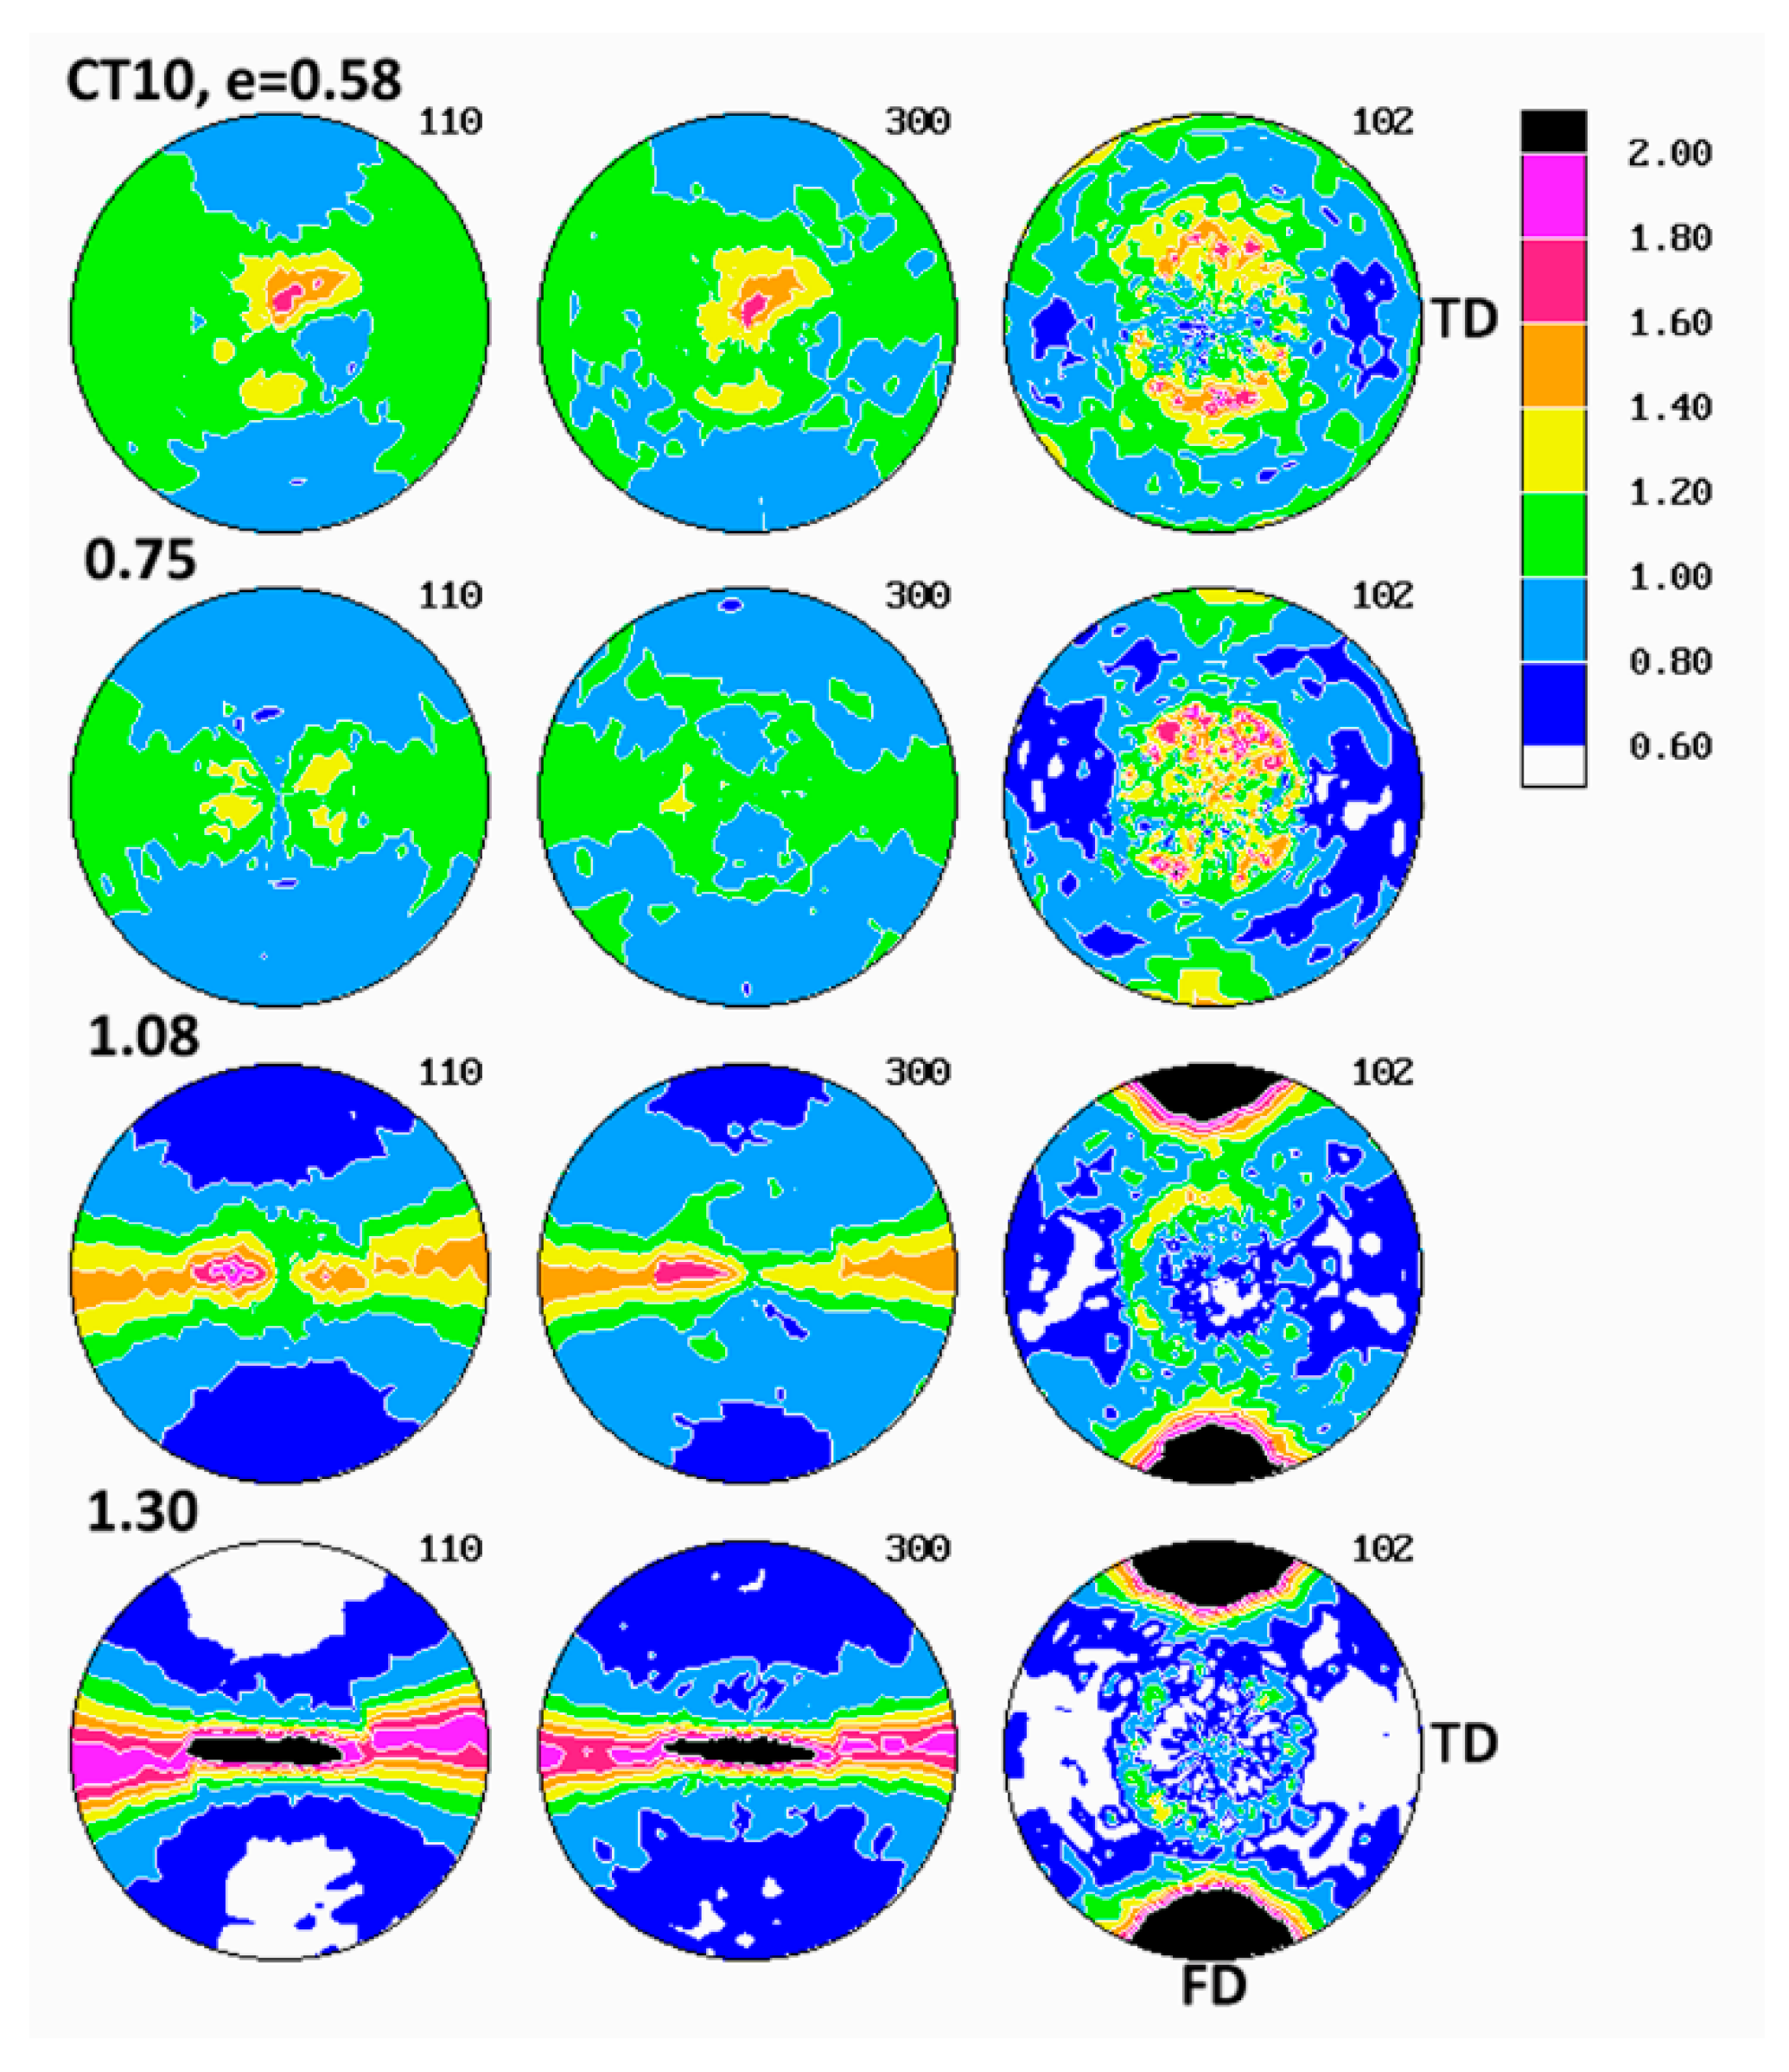
Figure 15, respectively) were normalized and plotted in stereographical projection with the same linear scale, covering the range from 0 to 2 m.r.d. (multiples of random distribution), where 1 means the concentration of poles in a given direction equals that in a randomly oriented sample. In the colors assigned to this scale, white and blue colors denote a lower pole concentration than in an unoriented (random) sample, while green, yellow, red and black indicate pole concentration increasing above the random distribution. The pole density rarely exceeded 2 m.r.d. in any sample, which confirmed the previous observation based on 2-D WAXS patterns that all observed crystalline textures were relatively weak. They actually appeared significantly weaker than the textures determined in other semicrystalline polymers, e.g., in polyethylene, deformed at similar conditions [
35,
38].
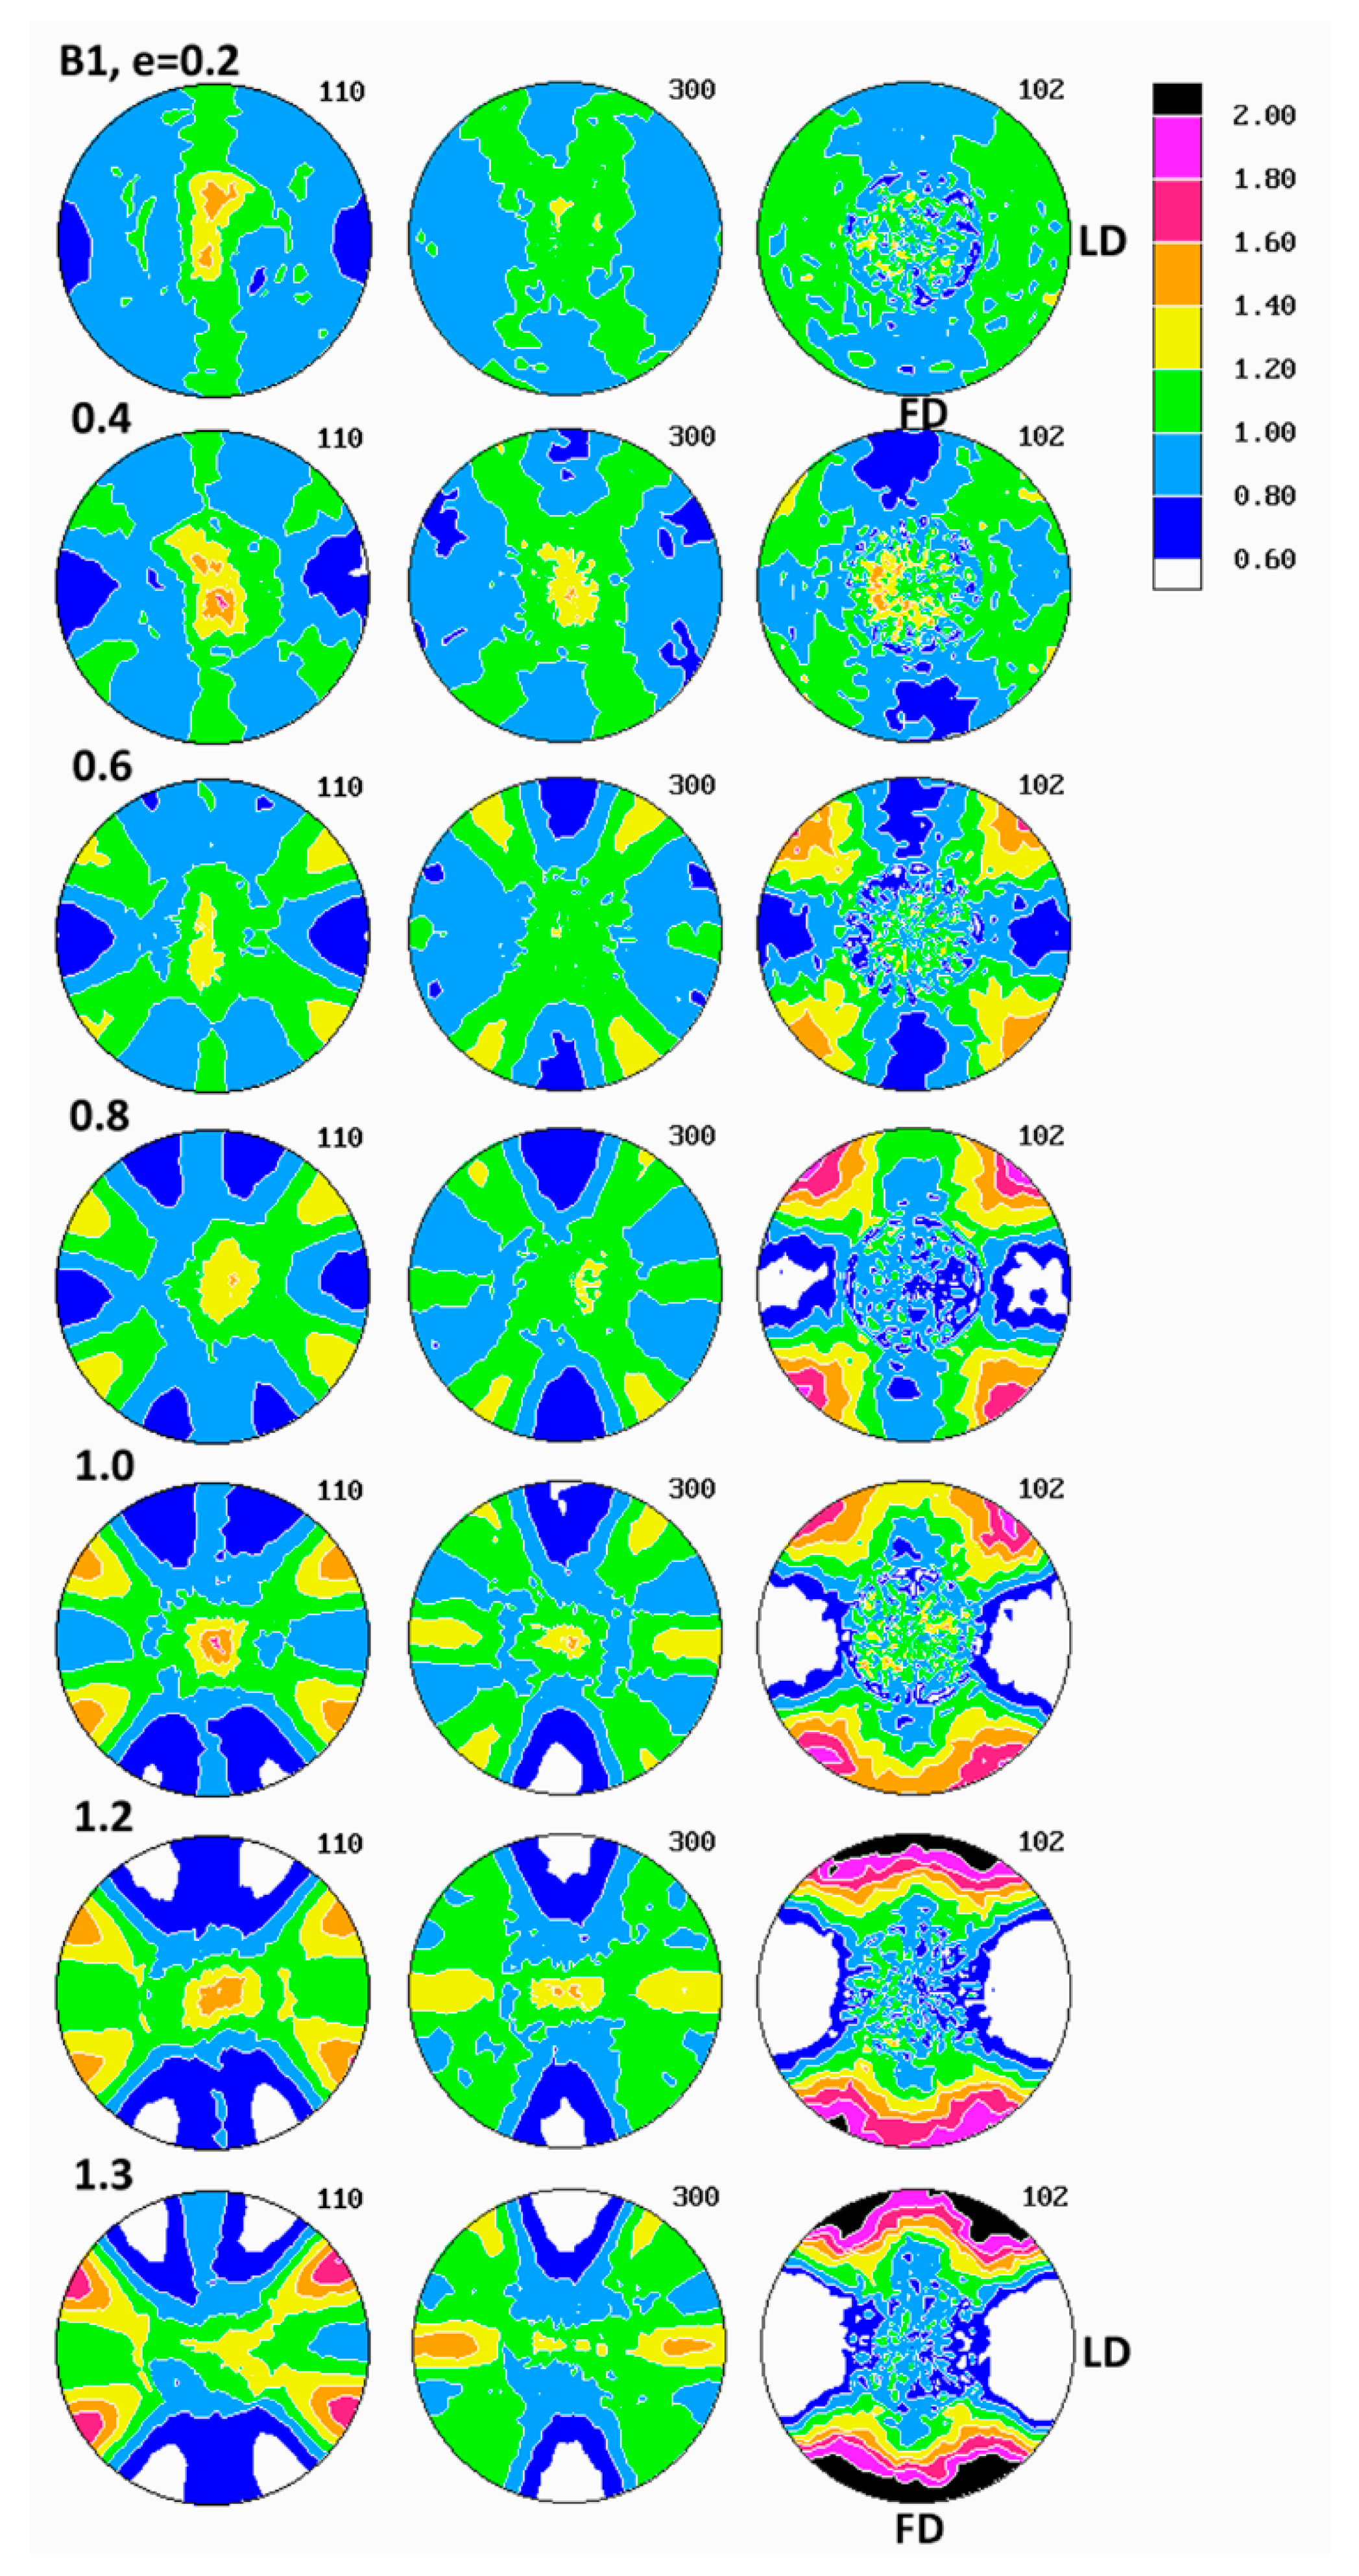
Figure 6 presents the set of pole figures determined for the B1 homopolymer deformed by the plane-strain compression to increasing true strains in the range of e = 0.2–1.3, whereas
Figure 7 shows a similar set determined for copolymer C4, also deformed in plane-strain compression to the true strain ranging from 0.2 to 1.4. Comparing these pole figures of B1 (
Figure 6) and C4 (
Figure 7) with the respective pole figures determined for B2, C1 and C10 samples (selected pole figures presented in
Figure 8,
Figure 9 and
Figure 10, respectively) one can find that the pole figures determined for B2 homopolymer are very similar to and show practically the same features as the respective figures obtained for B1 homopolymer, while the set of C4 pole figures can be considered as a good representative for the whole series of copolymers (C1, C4 and C10).
In polymer crystals of hexagonal symmetry, such as iPB-1 (Form I) or POM and PTFE, the allowed crystallographic deformation micromechanisms are only the prismatic slips along and transverse to the chain direction, e.g., the first-order slips (10
0)[0001] and (10
0)[11
0] or the second-order slips (11
0)[0001] and (11
0)[
100] (i.e., (100)[001] and (100)[010] or (110)[001] and (110)[1
0], respectively, when described with conventional three-digit Miller indices). The basal slip in the (0001) plane, pyramidal slips in any (
hk l) plane as well as any twinning modes, which operate effectively in crystals of low-molecular weight materials, are excluded in polymer crystals since their slip planes cross the chain direction [0001], thus operation of such mechanisms would require the breaking of chemical bonds along the chain and therefore is not allowed in polymer crystals [
2].
Examination of pole figures of compressed samples of the B1 homopolymer revealed that the crystalline texture started to develop early and could be detected already at the low strain of e = 0.2. At this strain, in the pole figure of the (300) plane, two weak arcs of elevated pole density, oriented vertically and curved in the direction of LD, were observed. Traces of similar arcs were distinguished in the (110) pole figure, along with a vertical strip of increased pole concentration, i.e., in the plane perpendicular to the LD direction. Concurrently, the poles of (102) planes tended to gather broadly around the LD direction and also in the center of the figure, i.e., around CD. The arcs in (300) and (110) figures indicated that the (300) planes began orientating preferentially in space with their normal along a double cone with its axis parallel to the loading direction LD and the apex angle of about 65–70°, while the (110) planes orientated roughly with normal in a double cone around LD with the apex angle of approximately 35–40° and additionally in the FD-CD plane (normal perpendicular to LD). Broad concentration of (102) poles near the LD direction and perhaps near CD suggested an emerging orientation of the chain direction axis [001] very widely around LD and probably also near CD (as already mentioned, the angle between normal of the (102) plane and the chain direction [001] is only 12°). The features described above suggested a very weak fiber-like texture with the fiber axis oriented broadly around LD, developing at low strain. Such a texture could be produced either by activity of crystallographic slip operating in the (001) basal plane of the hexagonal iPB-1 crystals or by the interlamellar slip, i.e., the shear in interlamellar amorphous layers, which are actually parallel to the (001) basal plane. However, as already discussed, the slip in the (001) basal plane must be ruled out, since in polymer crystals slip in any plane crossing the chain direction cannot operate and the only allowed slip systems are those operating in the planes that contain the chain direction [
2]. Consequently, the possible principal deformation mechanism responsible for this early texture component seemed to be the interlamellar shear in amorphous layers. That interlamellar shear can proceed in any direction within the (100) plane. It is known to result in rotation of both lamella normal and the chain direction towards the loading direction in compression [
2,
4,
6], therefore the fiber-like texture observed at e = 0.2 was consistent with activity of this mechanism. The other deformation mechanisms, operating in crystalline phase, e.g., prismatic slip in (100) or (110) planes either in direction of chain or transverse to it, could also be active as supporting mechanisms, yet they were not advanced enough to deliver a visible contribution to the observed texture. On the other hand, it must be noted that the deformation by interlamellar shear was partially reversible because of rubber-like elasticity of the amorphous component. In fact, it would be completely reversible in absence of permanent plastic strain of neighboring crystals, which prevented the full recovery of the amorphous phase that was tightly connected to crystals by covalent bonds [
52]. As suggested by the strain recovery results, reported above in this section, such reversibility of the interlamellar shear was probably quite substantial, although limited, in the case of iPB-1 materials investigated here. Only a partial recovery on unloading indicated that certain permanent strain component was present, obviously originating from plastic deformation of the crystalline skeleton. Therefore, some slip systems had to be active as a deformation mechanism of the crystalline phase and supported the interlamellar shear, even at this early deformation stage. Results of the recovery and structural study of similar samples, reported by Al-Hussein et al. [
19], support this conclusion. Another point is that the substantial strain recovery in iPB-1 suggests that the orientation of lamellae under load was probably stronger and the angle between normal of the (300) or (110) plane and the FD had to be significantly larger in sample still under load than that observed in pole figures, which were determined for unloaded and relaxed sample. This important remark holds true equally for other samples that were deformed to higher strain, especially those deformed by compression, where recovery was higher than in tension (cf. the strain recovery data).
Alternatively, the simultaneous transverse slip on a pair of (110) planes of the hexagonal crystal can be postulated as a possible mechanism leading to the texture observed at e = 0.2. In hexagonal structure, as in crystals of Form I of iPB-1, there were three equivalent (100) slip planes at 120° to each other and, similarly, three equivalent (110) slip planes. Gezovich and Geil [
53] investigated the complex textures of cold-rolled POM that demonstrated features resembling these discussed here. They explained those textures assuming that transverse slip can be relatively easy and because of hexagonal symmetry it may operate simultaneously on a pair of the (100) planes. In such a case, there are two crystallographically equivalent intersecting slip systems with the slip direction in each slip plane perpendicular to the line of intersection of the slip planes. If the crystal is in a general orientation, only one slip system will operate until the crystal has rotated to a symmetrical position with respect to the applied stress. At this point, the resolved shear stress is the same on both systems, therefore both systems begin to operate jointly and the vector sum of the slip directions in the acute angle of slip planes rotates towards the direction of maximum extension (here FD) [
2] and consequently the pair of (100) slip planes should become oriented at ±60° to the FD-CD plane and perpendicular to the flow direction [
53]. Here, for compression of iPB-1, we could assume activity of the (110)[110] transverse slip operating on a pair of (110) planes. In such a case, the normal of the (110) slip planes should orientate at ±30° from LD and perpendicular to LD, while normal of the (100) planes at ±60° from LD. The pole figures observed at low strain, e < 0.6, seemed to be reasonably consistent with that prediction (the respective angles were about ±35–40° and ±65–70° from LD in the relaxed and recovered sample, but they were probably noticeably lower in the sample under load, prior to strain recovery). Regrettably, the textures observed at low strain were too weak to distinguish which of the two proposed mechanisms—interlamellar shear, two equivalent transverse slips operating together or both operating simultaneously—was the active deformation mechanism at low strain.
At higher strain, e = 0.4–0.6 the poles of the (102) planes progressively changed their orientation distribution from a broad and low concentrations around LD and CD into four maxima, discernible in the FD-LD plane, about 50° away from FD, which next tended to rotate towards FD with further strain increase—at e = 1.3, these maxima were located only approximately 25° away from FD. At the same time, the arcs of stronger orientation of (300) and (110) poles gradually tightened and moved closer to LD (the apex angle of the cone changed from approximately 65–70° at e = 0.2 to about 60° at e = 0.6 and further to approximately 55° at e = 1.3, as can be seen in the (300) figure). Additionally, some low maxima began developing near the FD-LD plane within these arcs. Formation of maxima in (102) and a tightening the arcs of increased intensity towards LD in the (300) and (110) figures could be interpreted as a signature of a crystallographic slip system that was activated in the crystalline lamellae and operating along the chain direction, likely the first- or second-order prismatic slip systems, namely (100)[001] or (110)[001], which are expected to result in a progressive rotation of the chain direction, thus also normal of (102) planes, towards the flow direction FD, while normal of (300) or (110) planes, respectively, preferentially towards LD.
At the strain below e = 0.8, a new texture component emerged in the (300) figure in the form of an equatorial streak, stronger near the LD direction. Its intensity increased appreciably with increasing strain, ultimately becoming the most intense texture component at high strain, e = 1.3. Traces of a similar equatorial streak were detected also in the (110) pole figure, although that streak here was somewhat hidden and obscured by the arcs representing the first component of the texture, as discussed above. These equatorial streaks indicated the preferred orientation of crystallites with normal of (
hk0) planes concentrated in the LD-CD plane, especially with poles of (100) near LD, while the [001] direction becoming orientated close to the flow direction (as deduced from position of (102) poles). Such a rapidly developing orientation was probably the result of an intense chain slip operating in the (100) or (110) plane. Taking into account the general rule applying to the deformation of all crystalline materials that the slip tends to operate on the most closely packed crystallographic planes and in the most closely packed direction in these planes [
2], one could anticipate that the (100)[001] slip system was preferred as the primary mechanism. Concentration of the poles of the (300) plane observed near LD positively verified this hypothesis. This active slip system was the same as that operating earlier, at lower strains, but now appeared much more intense, presumably because of lamellae fragmentation, occurring at this strain range, which would reduce significantly constraints imposed on crystalline structure and facilitate more intense deformation of already fragmented crystals.
The final texture of the B1 homopolymer, observed at e = 1.3, consisted of two main components: the weaker one—represented by two arcs around LD, seen in pole figures of (300) and (110) planes and suggesting a fiber-like orientation of chains parallel to LD, produced either by interlamellar shear supported by some weaker crystallographic slips or by a pair of transverse slips of the (110)[110] mode operating jointly—and the stronger second component, manifesting in equatorial streaks in (300) and (110) with the maximum of (100) near LD and implying the preferred orientation of the chain direction around FD. This latter orientation was probably a result of an intense (100)[001] slip along the chain direction that appeared to be the primary deformation mechanism. The (102) pole figure exhibited four strong maxima near FD, approximately 25° away from it, which confirmed the preferred orientation of the chain direction close to FD. Considering the back rotations of poles due to partial recovery upon sample unloading, one could guess that the direction of the preferred orientation of [001] was aligned with FD much closer when samples were under load.
Evolution of crystalline texture of other samples compressed in plane-strain conditions proceeded in a similar way to the described above (see
Figure 7,
Figure 8,
Figure 9 and
Figure 10). In fact, the B2 homopolymer responded to compression with texture nearly identical to B1 (cf.
Figure 8). The deformation of copolymers, as illustrated in detail by figures collected for C4 copolymer (cf.
Figure 7), also involved the same two main stages of deformation with dominating interlamellar shear and/or transverse slip and dominating (100)[001] chain slip, respectively. On the other hand, the slip systems active in the last stage of deformation seemed to operate more intensively than in homopolymers and consequently led to a sharper, but simultaneously more uniaxial texture with the preferred orientation of the chain direction parallel to FD. These features reflected weaker constraints imposed on crystalline lamellae in copolymer samples that demonstrated lower crystallinity and thicker amorphous layers than homopolymers. It possibly indicated also a further reduction of constraints due to more intense lamellae fragmentation in copolymers than in homopolymers. Concurrently, the first texture component, related to interlamellar shear and/or transverse slip, although clearly observed at low strains, was barely seen in texture at high strain around e = 1.4. The other copolymers (C1 and C10) demonstrated similar deformation behavior and developed texture resembling greatly that of C4.
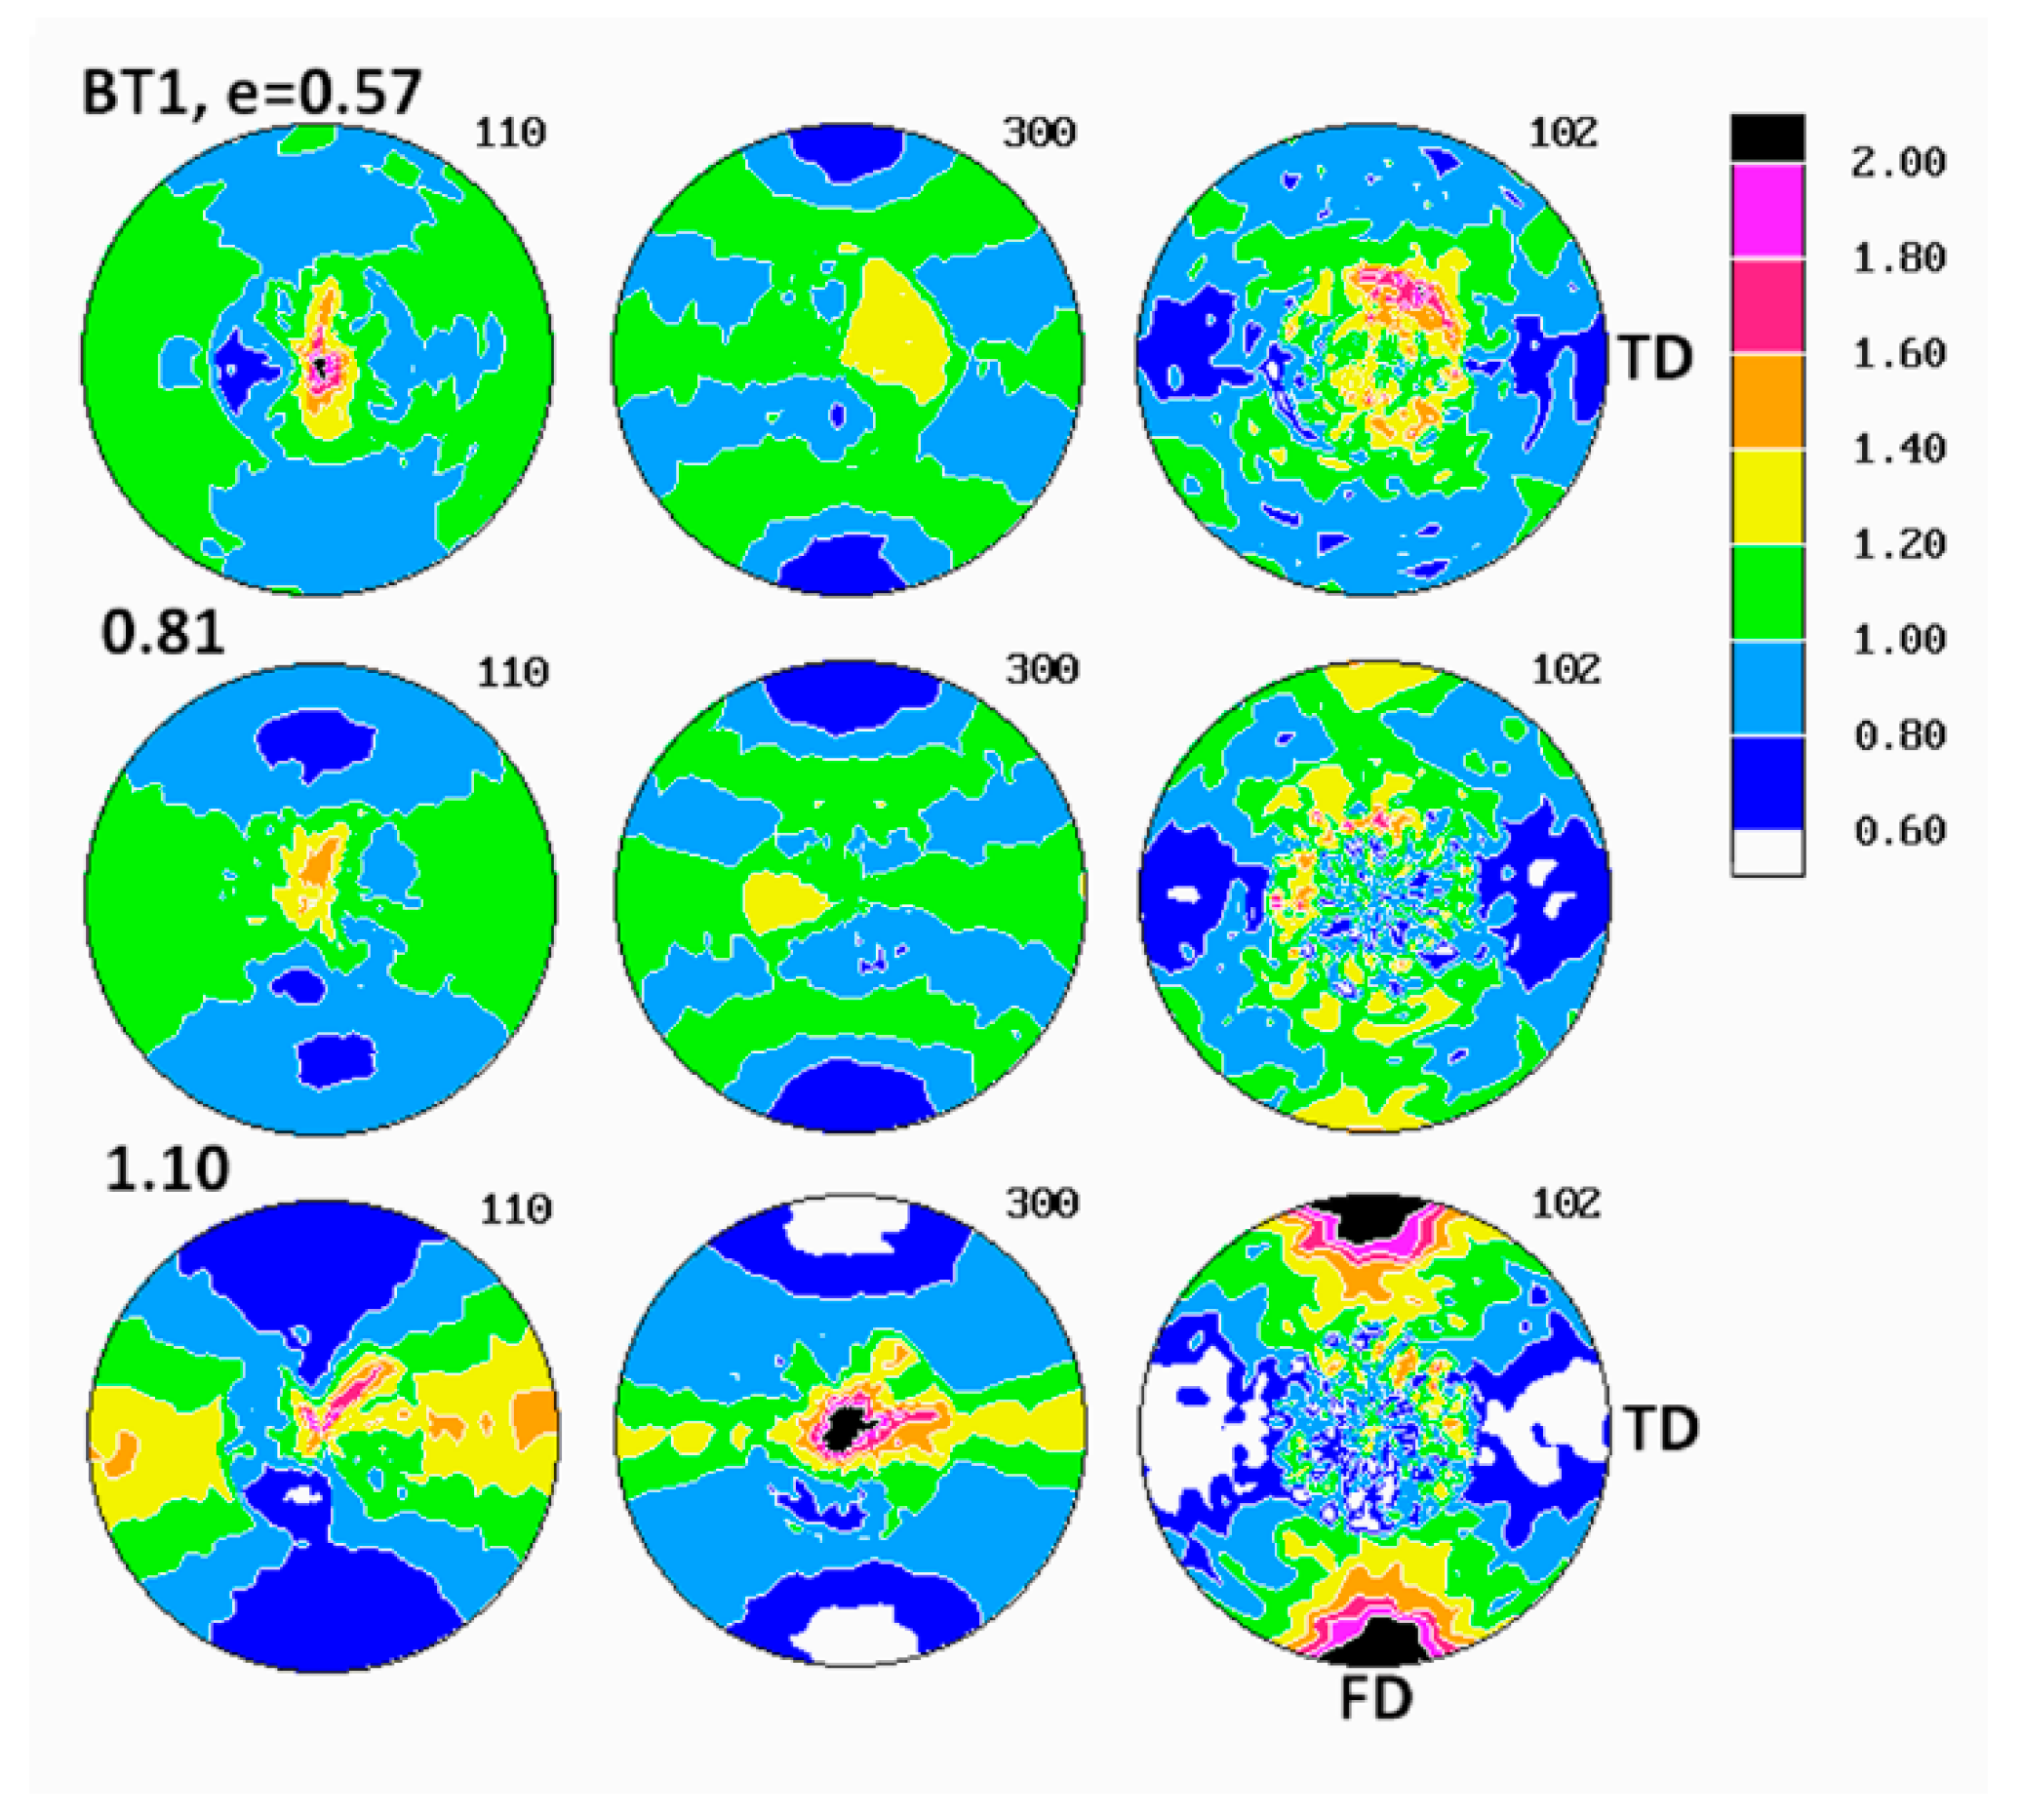
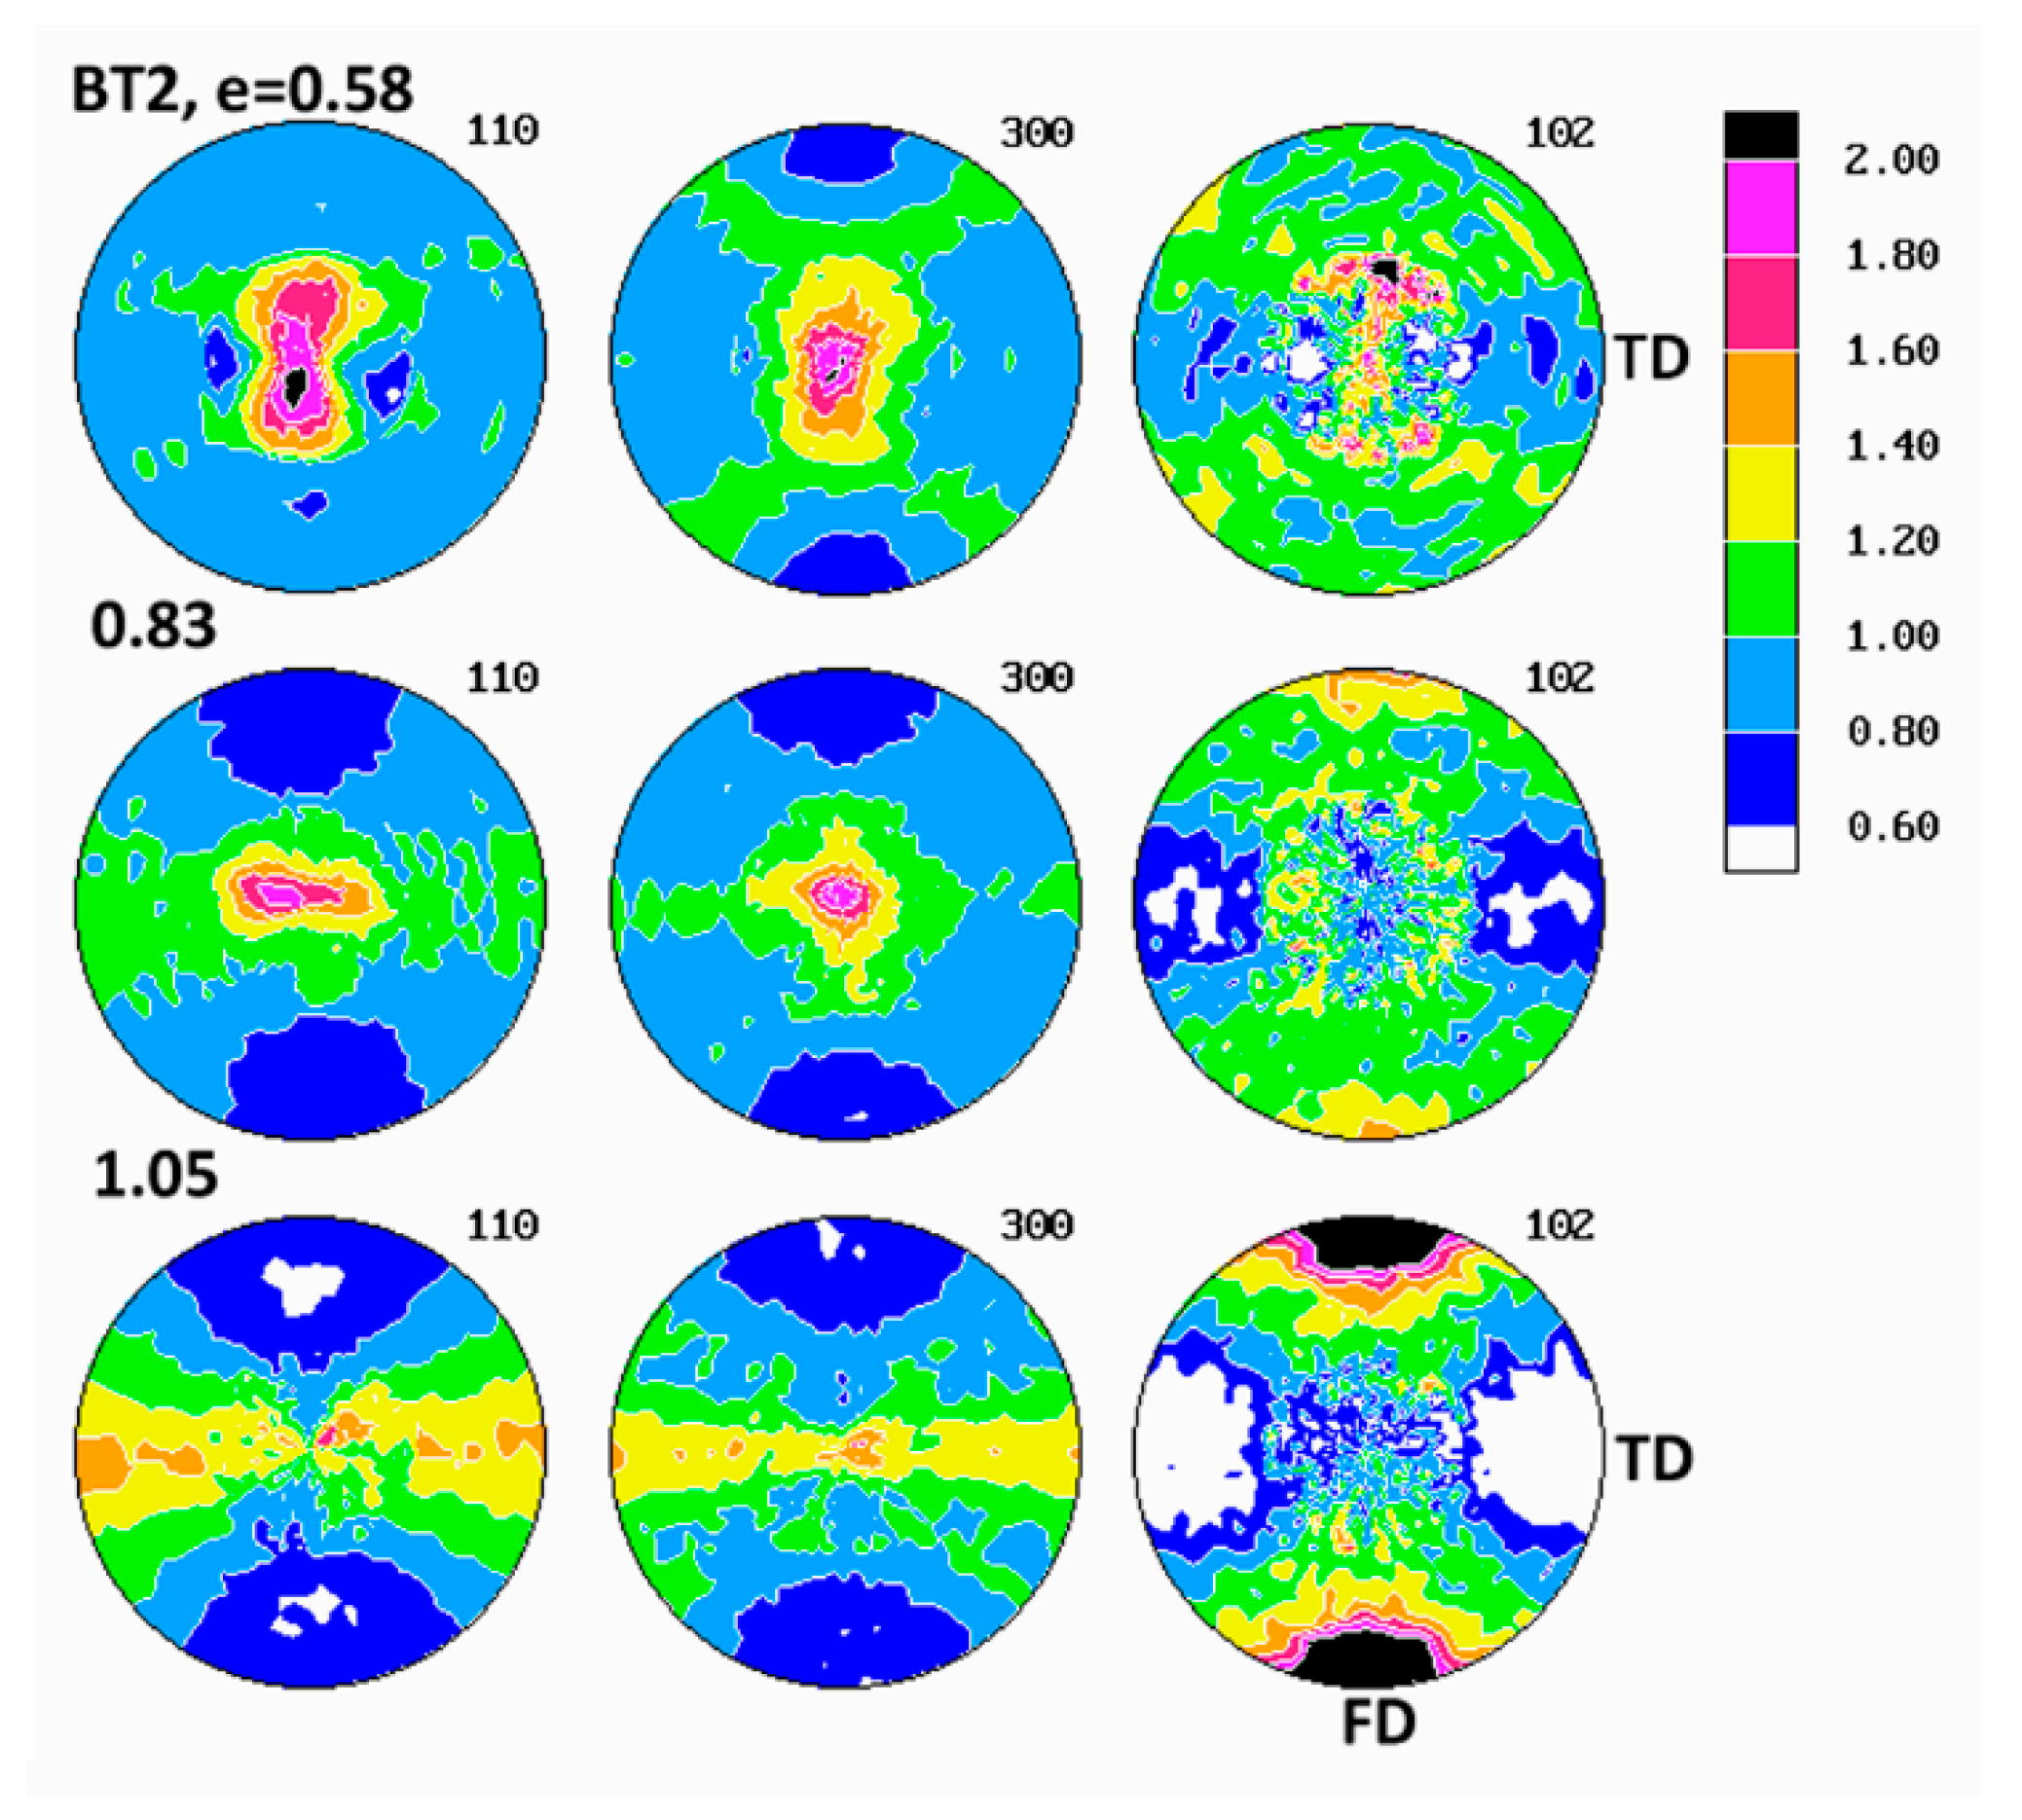
The pole figures determined for samples deformed in tension are presented in
Figure 11,
Figure 12,
Figure 13,
Figure 14 and
Figure 15. Here, in drawn samples, it was possible to collect the diffraction data and construct pole figures only for samples deformed to a relative high strain, above e = 0.58, due to the neck developing in tensile samples at lower strain. Consequently, it was difficult to find in the specimen drawn to a low strain an area of uniform deformation large enough for pole figure measurements, during which a specimen must be highly tilted and rotated—the specimens at least 1 × 1 cm
2, required for pole figure determination with our diffractometer, had to be selected from the necked uniform part of tensile specimens, away from the non-uniform neck shoulders. Comparing the pole figures of various tensile samples, it was found that the texture development in the studied applied strain range of e ≈ 0.6–1.1, proceeded in a remarkably similar fashion in all materials, regardless of their composition, yet it was noticeably different in the same materials deformed by plane-strain compression.
At the strain around e = 0.6, the (300) pole figures of tensile samples demonstrated two latitudinal arcs of elevated pole density—centered around the drawing direction, FD and tilted about 40° away from it—and additionally the equatorial belt of increased pole concentration. Similarly oriented arcs, although weaker, were distinguished also in the (110) pole figures. The pole figures of the (102) plane also showed such latitudinal arcs, developing approximately 45–50° away from FD. Such a distribution of poles of (110), (300) and (102) planes suggested the main texture component in the form of a relatively weak uniaxial tilted texture with the chain axis tilted about 40–50° away from FD, which developed in tensile samples at low strains up to e = 0.6. As the strain increased above 0.8, this texture component was still visible, yet the second component emerged clearly, with the (110) and (300) poles oriented preferentially in the plane perpendicular to FD (seen as equatorial belt in respective pole figures) and poles of (102) gathering around FD. This second texture component represented the crystallites oriented preferentially in a uniaxial fashion, with their [001] axis aligned along FD and normal of (hk0) planes distributed randomly in the plane perpendicular to FD, i.e., the [001] fiber texture. When the strain increased further, above e = 1, this second component developed rapidly and strengthened to become the dominant in the textures observed at the true strain of e = 1.05. The first texture component (tilted orientation) progressively diminished with increasing strain and practically was no longer observed at high strain above 1.0. It was expected that both uniaxial texture components resulted from operation of the crystallographic slip along the direction of the chain, most probably the (100)[001], found the primary deformation mechanism in compression. The first component was related to deformation of initial long lamellae, constrained by their neighborhood and hence proceeding relatively slowly, while the second was a result of operation of the slip in small blocks produced by lamellae fragmentation and destruction of the initial structure. That deformation was much less constrained and perhaps proceeded significantly more quickly than deformation of undamaged lamellae, which eventually led to domination of the axial component in the texture observed at high strains.
The path of development of the preferred orientation in tensile deformation, described above, differed slightly from that observed in the plane-strain compression, discussed above. The main difference was that no interlamellar shear activity was observed in tensile samples at any strain, in contrast to compression samples, where its activity was clear, especially in the low strain range (note, however, that, due to limitations of the experimental setup, we were not able to examine texture of tensile samples deformed to low strain, below e = 0.58). Instead, two processes of crystallographic slip within crystalline phase were evidenced. Both were probably of the same type of the chain slip, presumably the (100)[001] slip system, yet had notably different kinetic and were probably activated in a different way. It was guessed that the first component was related to deformation of lamellae of the initial structure, while the second component, activated above e = 0.8 and developing more quickly, was related to the slip systems operating in the less constrained highly fragmented crystal structure, which was quite similar behavior to that observed in compression. The final texture of tensile samples at high strain did not differ much from that observed in samples deformed to similar strain by compression—textures of both were dominated by the component of the preferred orientation of crystallites with the chain axis oriented along FD, although the textures developed in tension seemed slightly stronger and sharper. The other, minor differences between textures of compression and tensile samples reflected the triaxiality of the stress field in the plane-strain compression (resulting in concentration of (100) poles developing near LD in the equatorial plane LD-CD) and its axial symmetry in tensile deformation mode (more uniform distribution of (100) and (110) poles in the equatorial plane).
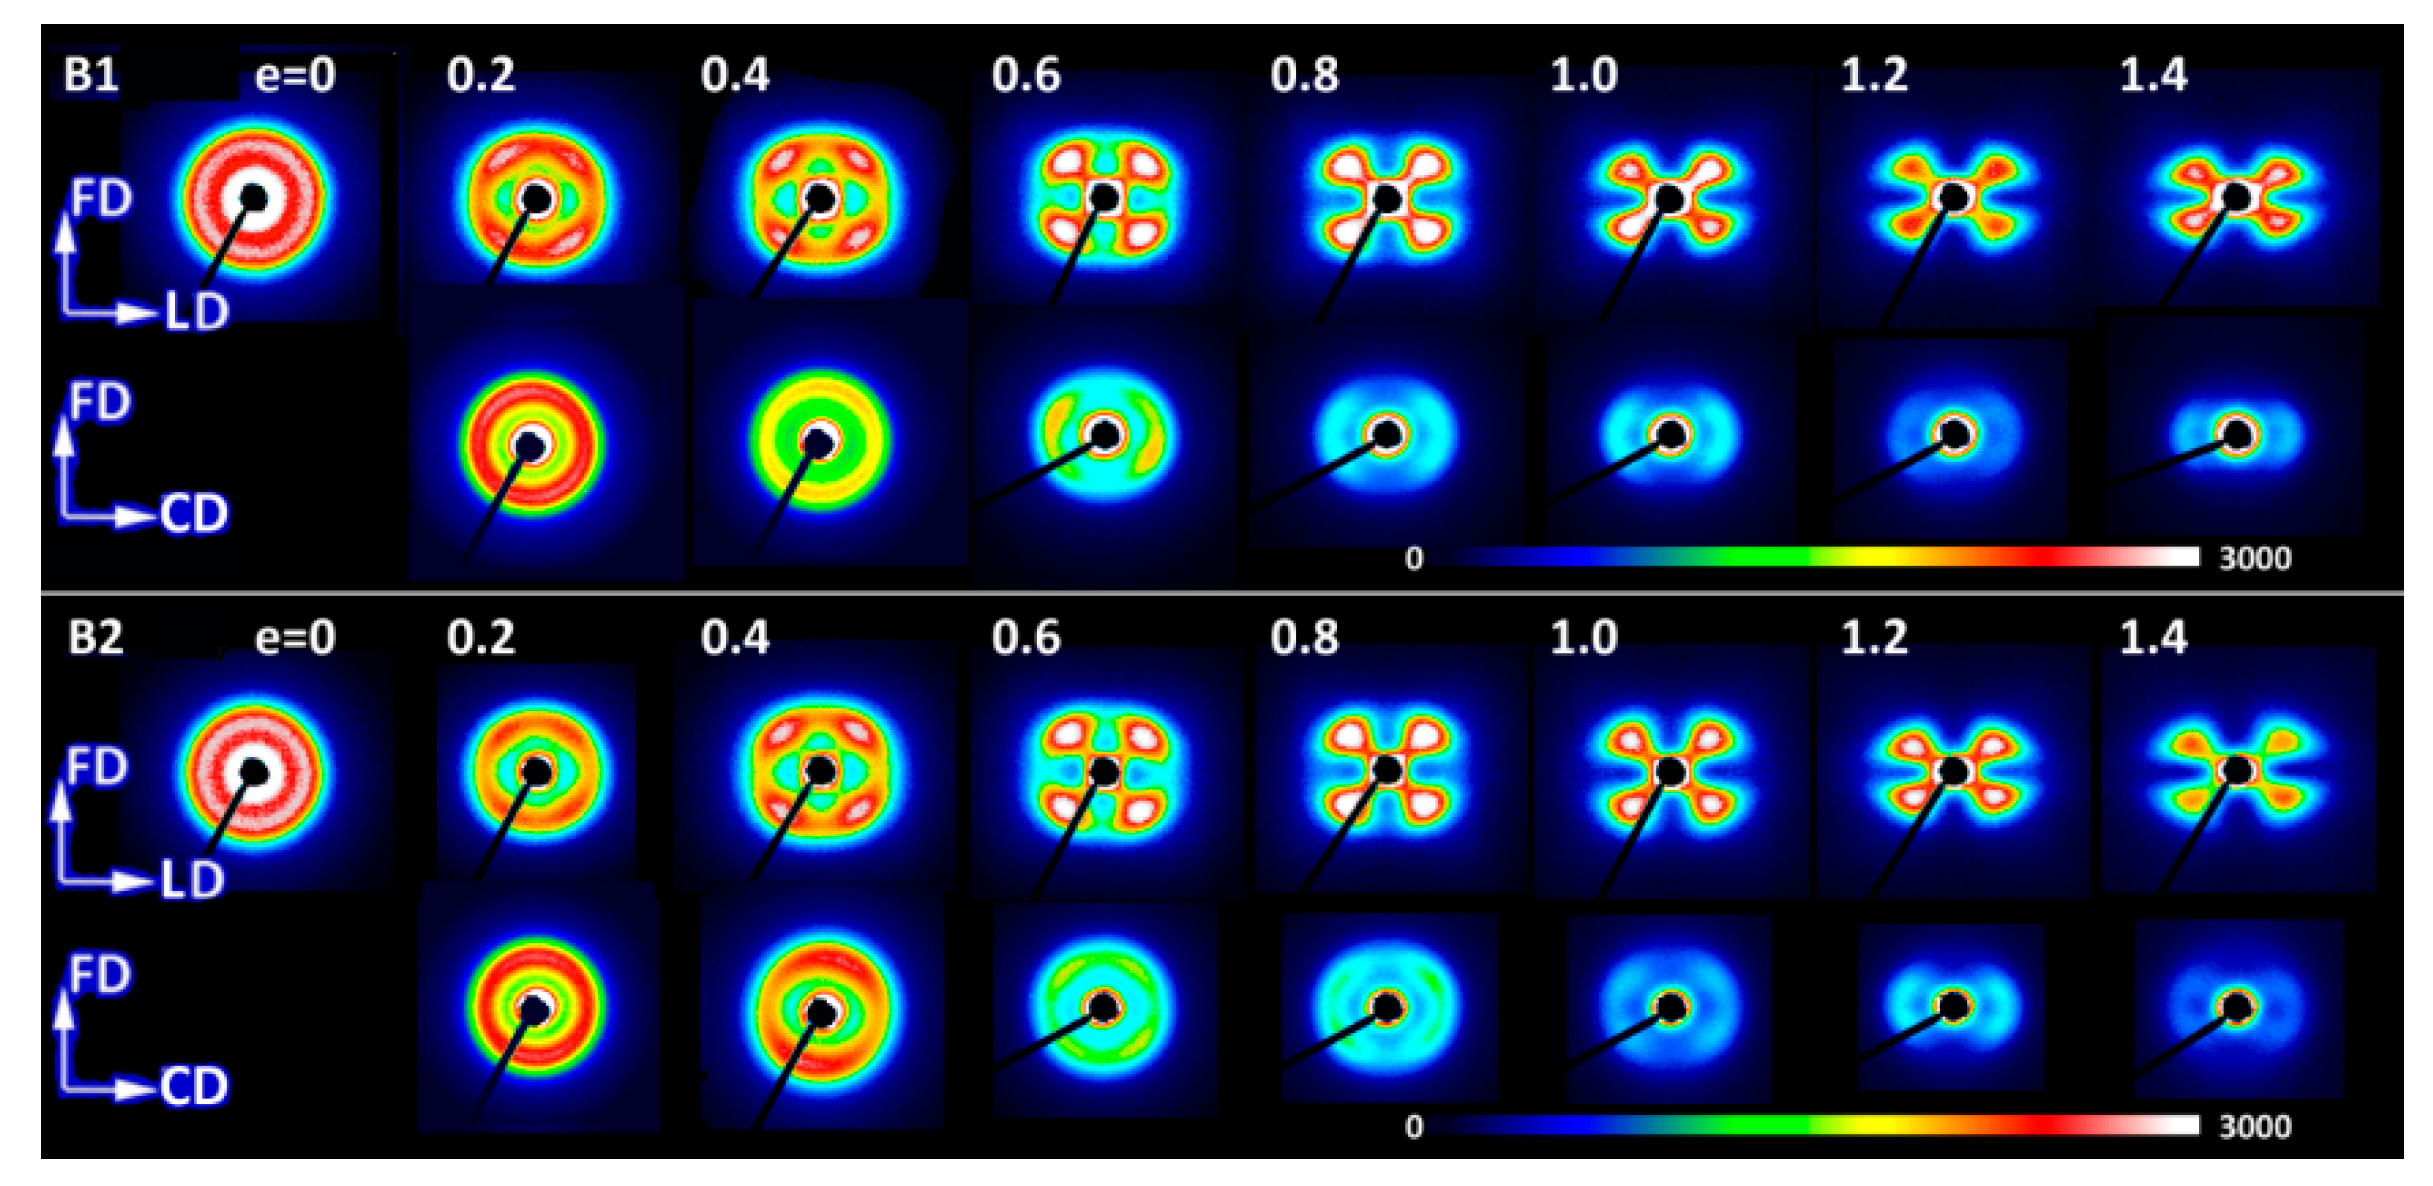
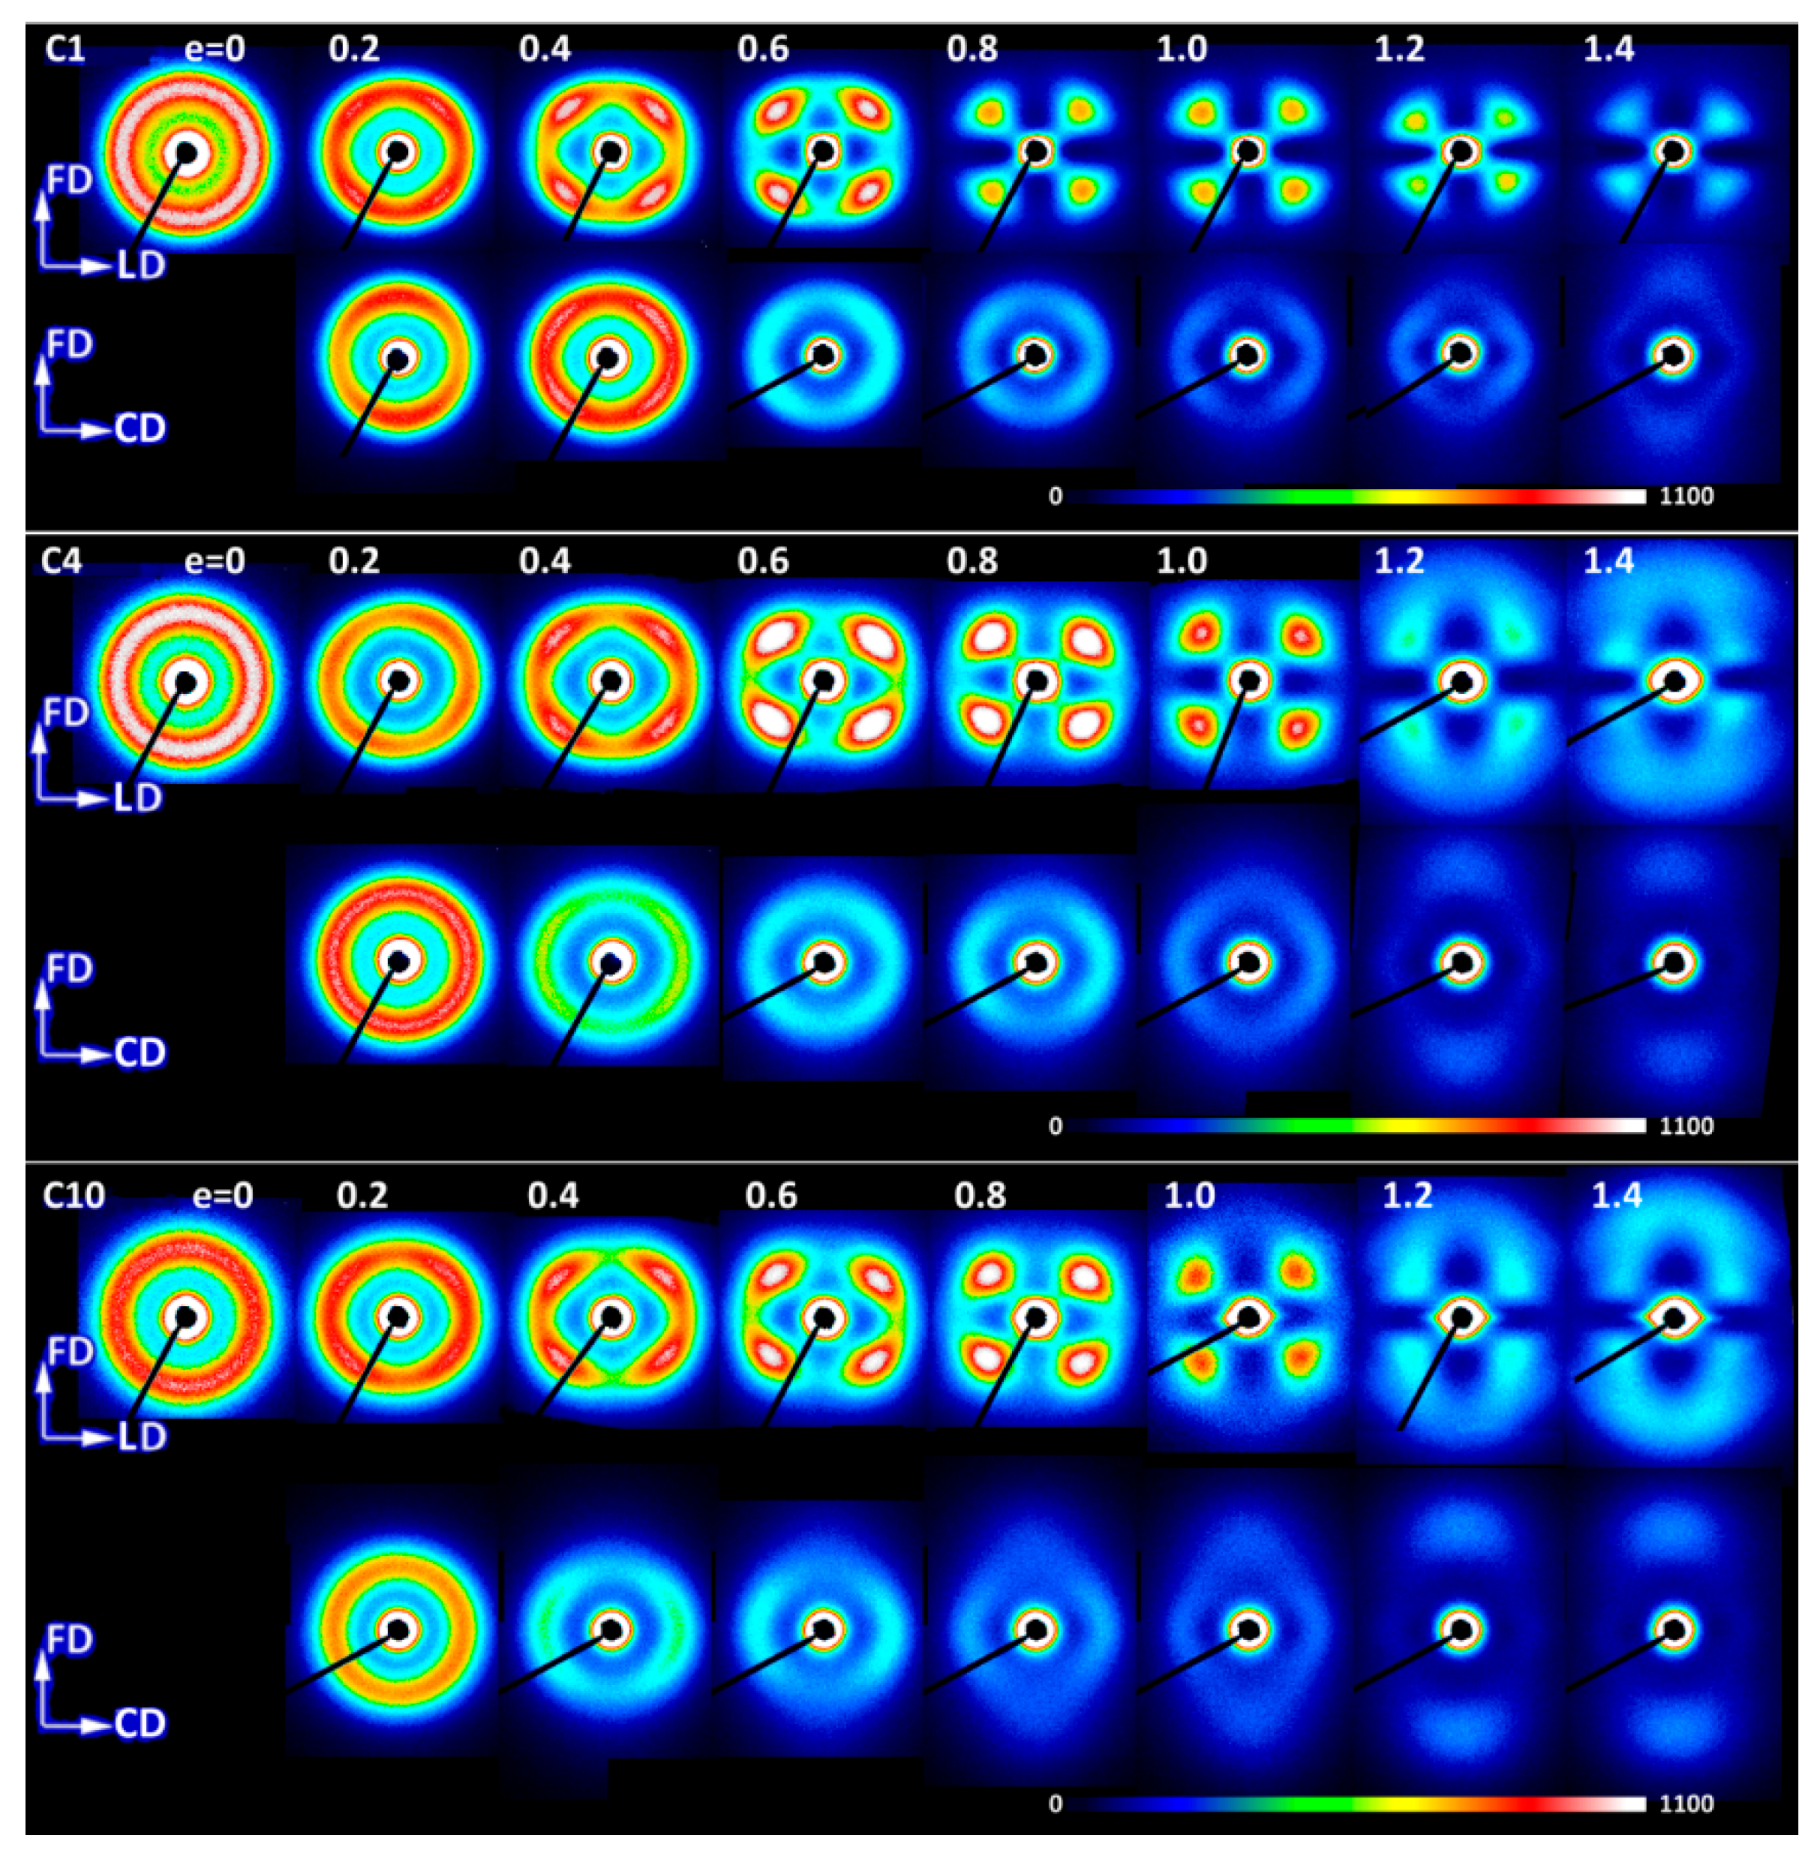
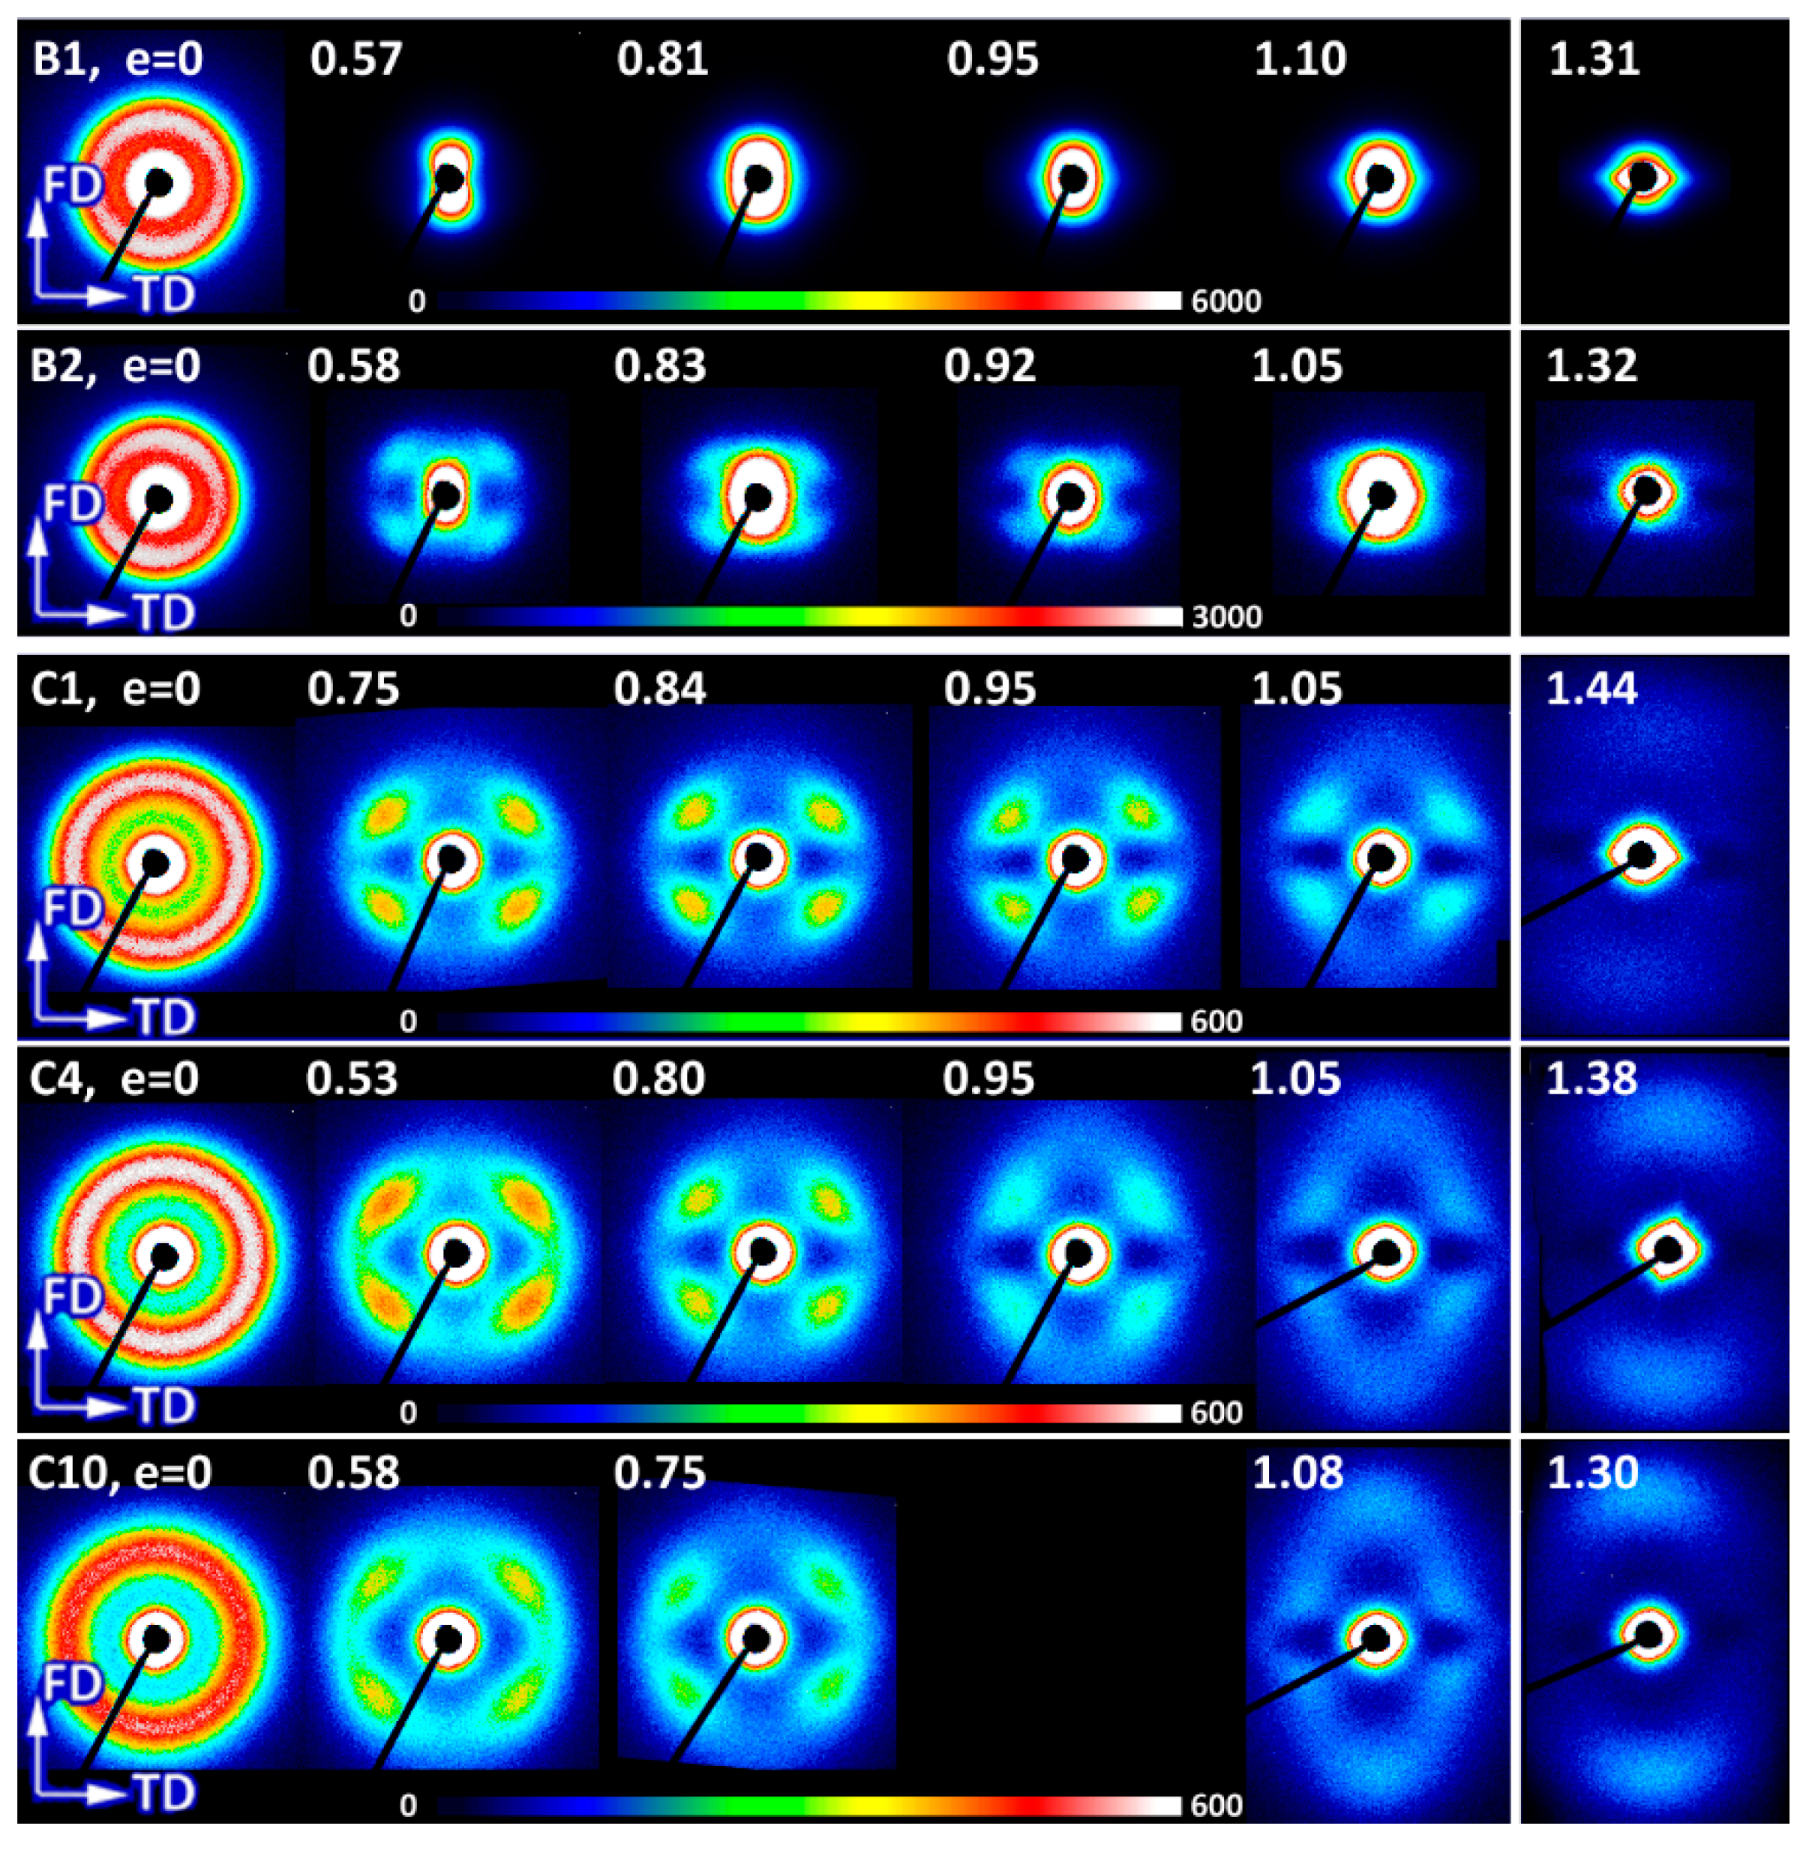
Figure 16,
Figure 17 and
Figure 18 present the 2-D SAXS images that illustrate the lamellar structure and its orientation changing with increasing strain. The images of deformed samples were collected after their unloading. The compressed samples (
Figure 16 and
Figure 17) were probed in two orthogonal directions, with the primary beam illuminating the sample along the CD or LD direction, while those deformed by uniaxial tension were observed only along one direction normal to FD (TD, equivalent to CD in compression; see
Figure 18), because tensile samples generally feature the axisymmetric scattering. All samples probed prior to deformation demonstrated a uniform scattering ring, which evidenced the lamella arranged in stacks with no preferred orientation, as expected for materials with spherulitic morphology. When deformed by plane-strain compression, the samples of homopolymers (B1 and B2) and copolymer of low ethylene content (C1) developed the four-point SAXS pattern, visible in both CD- and LD-view images up to the highest strain of e = 1.4 (cf.
Figure 16 and
Figure 17), although the pattern observed in the LD-view was weak and its four-point signature was barely seen when using the common scale for all images. The four-point pattern developed earlier (already at e = 0.2) and was significantly stronger in the CD-view images than in the LD-view images (e > 0.4), which demonstrated that more lamellae obtained an orientation that contributed to scattering seen in the CD-view image than in LD-view image due to significantly higher compressive stress acting along LD than CD, which resulted in swiftly decreasing population of lamellae that contributed to the LD-view image by their reorientation with normal rotating out of the FD-CD plane. The four-point signature of SAXS images reflected the development of the preferred orientation of lamellae—formation of two populations of stacked lamellae, each with lamella normal tilted at some acute angle with respect to the flow direction. This angle determined the angular position of maxima in the respective pattern. Comparing the CD- and LD-view images, it was observed that the lamellae probed with the beam along the CD direction demonstrated lower tilt of their normal than those probed with the beam along LD. The tilt angle of lamella normal with respect to FD increased gradually with strain—in the CD-view patterns it increased from about 40–45° at e = 0.2 to above 60° at e = 1.4 (it went above 70° in LD-view patterns), meaning a progressive rotation of normal out of the FD, thus rotation of lamellae plane towards FD with increasing strain. Development of the preferred orientation evidenced by rotation of lamella normal out of FD resulted either from fine (homogeneous) chain slip within lamellar crystals or interlamellar shear operating in amorphous interlamellar layers [
2]. Examination of pole figures reported above suggested the interlamellar shear as the possible primary deformation mechanism at low strain, supported and then gradually replaced by crystallographic slip systems at higher strains. The four-point pattern developed earlier, already at e = 0.2, in lamellae seen in the CD-view pattern than in the LD-view because of deformation of the lamellae that were initially oriented specifically with their planes along the loading direction. These lamellae responded to loading relatively early with microbuckling followed by a cooperative kinking that led to formation of a local chevron-like arrangement [
54,
55] and consequently gave rise to an earlier appearance of the four-point pattern in the CD-view image. The four-point pattern remained visible in samples of both homopolymers and C1 copolymer practically up to the maximum strain of e = 1.4 with a fairy good intensity (with only one exception of the LD-view image of C1 at e = 1.4, where the four-point signature was barely recognized and virtually replaced by a new two-point feature, similar to other copolymers). This meant that the lamellar structure consisting of stacks of tilted lamellae was preserved, and lamellae did not undergo any extensive fragmentation during the deformation process up to the true strain of e = 1.4. This indicated that the fragmentation and partial destruction of the lamellae structure, suggested by DSC and WAXS data, was probably limited in compressed homopolymers.
The evolution of lamellae structure in compressed copolymers of higher ethylene concentration (C4 and C10) demonstrated a more complicated behavior than homopolymers, discussed above. As shown in
Figure 17, their behavior at strains up to e = 0.8–1.0 was nearly the same as homopolymers, with formation of a distinct four-point pattern in CD-view images, although the LD-view images showed patterns consisting of two broad arcs oriented along CD rather than separate four spots, as was observed in homopolymers. However, at the strain of e = 0.8 and above, a new feature emerged in the LD-view image of C10 in the form of the two-point signature oriented along FD and with the long period notable shorter than in the pre-existing structure. A similar two-point feature was recognized in the respective images of C4 from e = 1.0 on as well as in the image of C1 at e = 1.4. These two-point features were initially weak, but intensified slightly with strain, while the four-point signature of the primary structure progressively faded away. Eventually, at e = 1.4, only this new ordering was seen in the LD-view SAXS images of C4 and C10. Meanwhile, at e = 1.2–1.4, similar two-point signature appeared also in the CD-view images (C4 and C10), in addition to the still visible four-point feature. The rise of the new two-point pattern along FD evidenced formation of a new ordering in the form of stacks of some new lamellae, thinner than the pre-existing, which beaome oriented preferentially with their normal along FD. These lamellae originated from a heavy fragmentation of the native lamellar structure and were probably some remnants of the destroyed parts of original lamellae. The strain-induced melting-recrystallization transformation is frequently postulated as the mechanism responsible for that phenomenon (see [
5] and the references therein), yet their formation is also explained as a result of deformation (slip) instabilities leading to heavy localization of crystallographic slip and consequently severe lamellae fragmentation followed by restructuration and reorientation of the resultant small crystalline blocks [
35,
55]. In our recent paper [
55], we demonstrated that such instabilities are triggered by stress concentrations at the crystal-amorphous interface produced by the ST (chain segments crossing the crystal-amorphous interface and able to transmit the load between adjacent lamellae). Such stress concentrations were stronger and consequently a heavy fragmentation of lamellae occurs earlier—i.e., at smaller strain—when the concentration of ST was lower. A lower ST concentration in copolymers was expected than in homopolymers because of lower crystallinity and thicker amorphous phase layers than in homopolymers. Lower ST concentration in copolymers was suggested by the lower strain hardening modulus and the shift of the strong stress hardening towards higher strain observed in copolymers and discussed above in this section. Thus, a heavier lamellae fragmentation was anticipated in iPB-1 copolymers than in homopolymers.
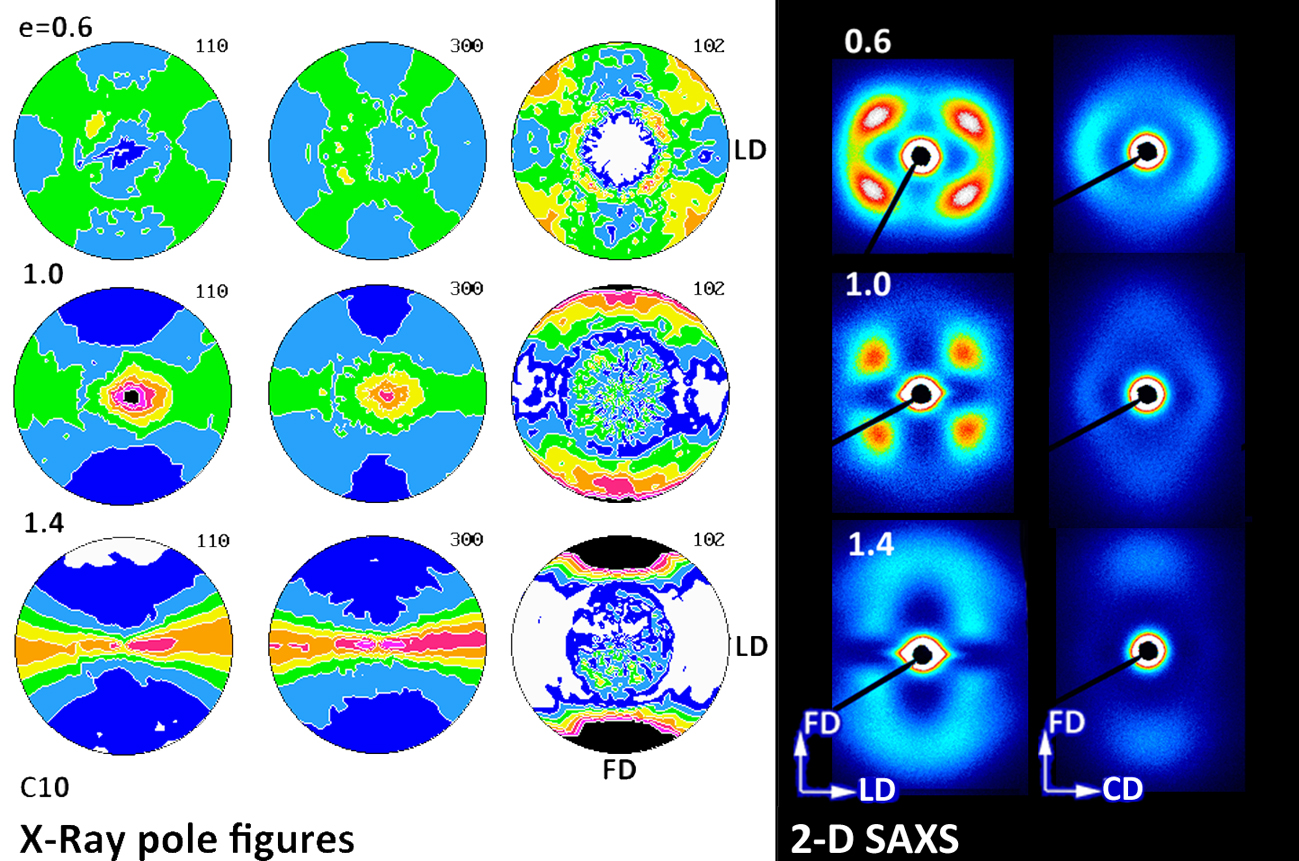
Figure 18 presents the 2-D SAXS images obtained in the TD-illumination for samples deformed in tensile mode. Images of the B1 homopolymer did not reveal any scattering characteristic for lamellar structure due to strong scattering by cavities created during necking that obscures a weaker lamellar scattering. In images of B2, cavitation also produced the strong scattering near the beam stop, but fortunately the scattering by lamellae was also recognized in the form of a four-point pattern, similar to that observed in compressed samples. That pattern remained visible up to high strain above e = 1. Deformed copolymers (no cavitation observed) also developed the four-point signature in SAXS images at low strain below 0.8–0.9, which, however, transformed gradually into two-point signature oriented along FD at higher strains. Similar to compressed samples, the long period of this new ordering, calculated from the two-point pattern, was shorter than the long period of the initial as well as the deformed lamellar structure contributing to the four-point pattern. It can be concluded that images of deformed tensile samples were generally quite similar to CD-view images of compressed samples at the respective true strain, which indicated similar evolution path of lamellar structure in both compression and tensile samples.
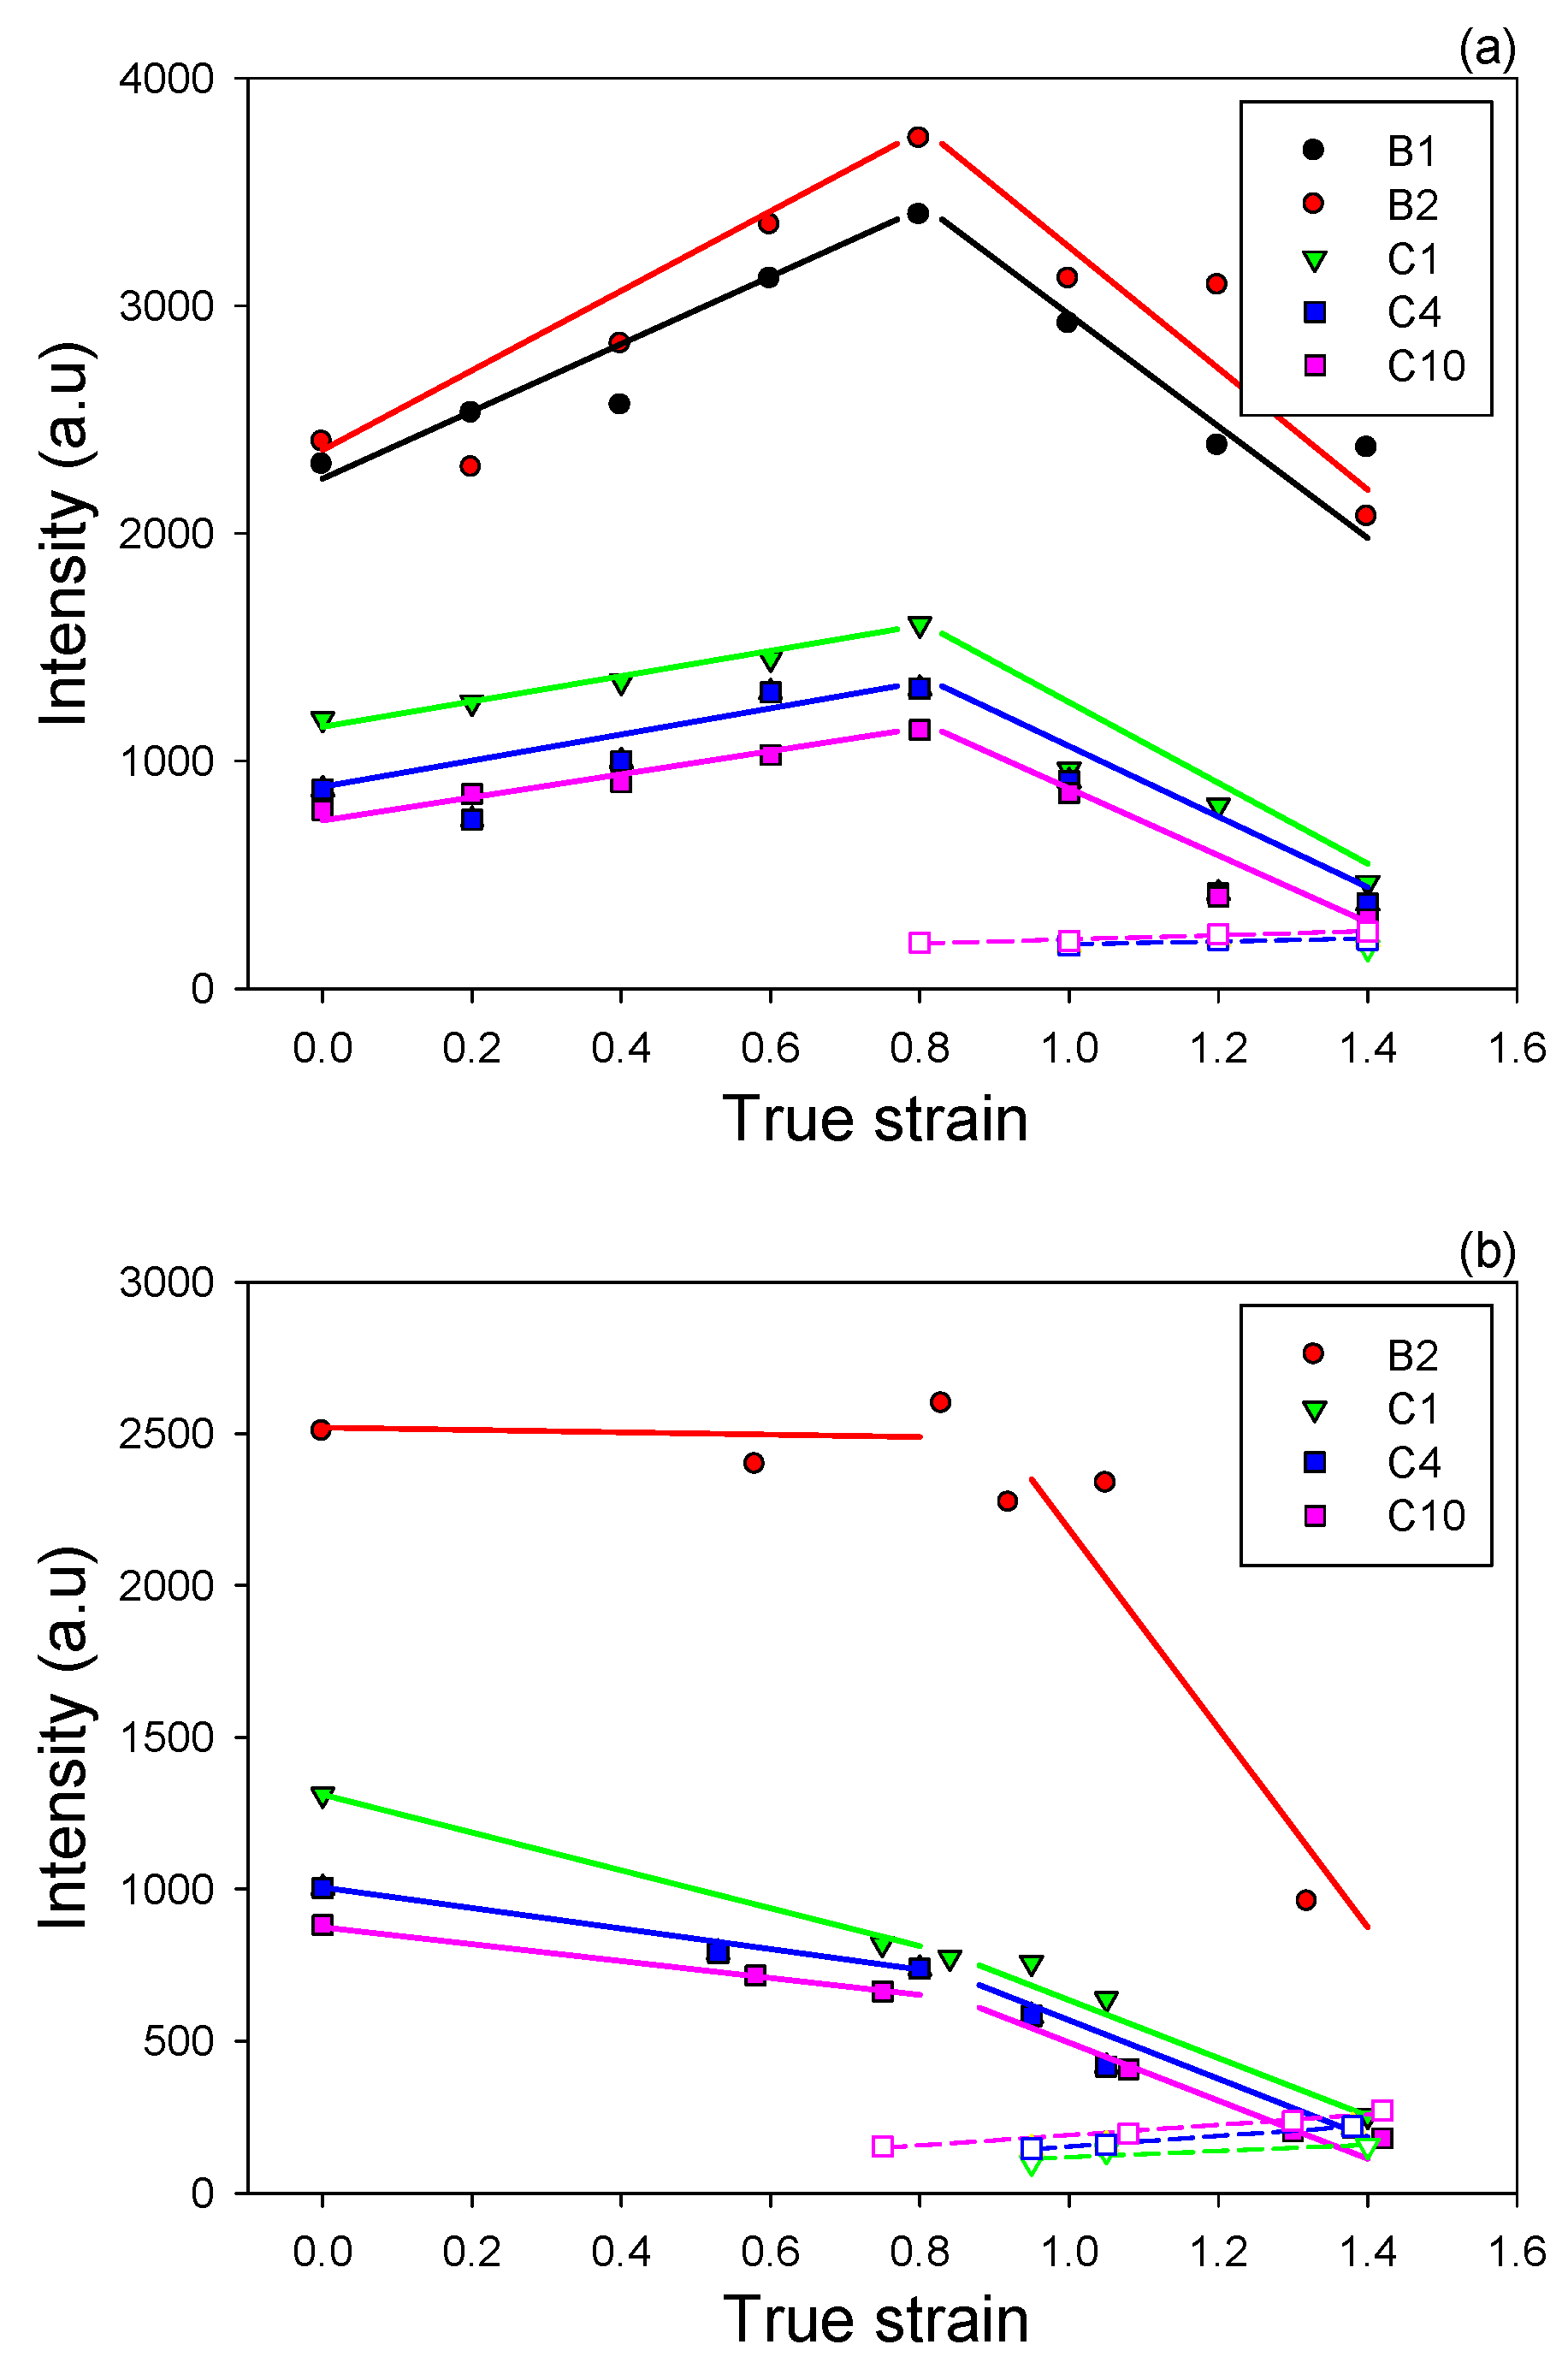
More information about postulated lamellae fragmentation can be obtained from analysis of the intensity of the scattering changing with strain.
Figure 19a compares intensities observed at maxima in the four-point pattern of CD-view images in samples compressed to various strains. Although no absolute intensity was measured, such comparison was justified since all samples had exactly the same thickness (equal to the width of the channel-die), very similar structure, including the degree of crystallinity, while the images were collected at practically the same beam intensity and acquisition time. It was observed that for all compositions the maximum intensity initially increased with strain, up to approximately e = 0.8 and then began to decrease significantly with further advance of the strain. The initial increase of intensity reflected the growing population of lamellae that were rotated to the specific tilt and contributed to the maxima in intensity of the scattering, due to operation of the active deformation mechanisms (interlamellar shear supported by crystallographic slip systems). The crossover point seen near e = 0.8 indicated that the number of lamellae of such orientation began to decrease at this strain in all materials studied. As the scattering intensity observed in other sample views decreased all the way with increasing strain (see the respective LD-view images), the reduction of the maximum intensity in the CD-view images cannot be related to the change of lamellae orientation. It was interpreted rather as a result of reduction of the global population of lamellae, probably due to their extensive fragmentation, beginning at this range of strain. This result suggests that the postulated lamellae fragmentation in fact occurred not only in copolymers, in which formation of new lamellar crystals from partially damaged and fragmented original ones was evidenced by the two-point signature emerging at high strain, but also in homopolymers, which did not show such additional scattering with a new long period. This notion was consistent with the conclusions derived from the DSC data reported above in this section and was also supported by results of Al-Hussein et al. [
19] who concluded, on the basis of detailed studies of deformation and strain recovery in similar samples, that a widespread fragmentation of lamellae into smaller blocks started in iPB-1 materials near e ≈ 0.7. Most probably, however, the small crystalline blocks presumably left after lamella break-up in homopolymers did not rotate and restructure enough to form regular stacks that would produce a detectable scattering along FD in SAXS images. Very likely, the severe constraints imposed on deforming crystals by their neighborhood in materials of higher overall crystallinity and thinner interlamellar layers, such as in studied homopolymers, prevent such restructuration. In copolymers demonstrating crystallinity noticeably lower than homopolymers, the remnants of fragmented lamellae in the form of small separated crystalline blocks embedded in the amorphous phase probably have more freedom to rotate and restructure to form ultimately a new stacking along the FD. This was illustrated by the maximum intensity of scattering related to the new ordering along FD appearing in highly deformed copolymer samples, also plotted in
Figure 19. That intensity appeared low compared to the intensity of scattering by the initial lamellar structure even in copolymers. Once it appeared, it remained nearly constant with increasing strain, which indicated that nearly all of these small crystallites were formed in a relatively narrow strain range, when the pre-existing lamellae underwent fragmentation. Their total population did not increase more appreciably with strain increase or they could not further arrange into regular stacks that would produce a stronger scattering.
Figure 19b presents similar dependencies of the maximum intensity of the scattering of the native lamellar structure as well as of the new ordering on applied strain, determined for tensile samples after their unloading. In this experiment, the specimens had various thickness, therefore the measured intensities were corrected for specimen thickness and absorption prior to comparison. The B1 homopolymer sample was not evaluated because of high scattering due to cavities that completely obscured the lamellar scattering. The presented results demonstrate that also in the case of tensile samples the inflection point in the intensity curves could be distinguished at the true strain around e = 0.8. The strongly decreasing intensity at strains above e = 0.8 suggested again the heavy fragmentation of lamellae, beginning in this strain range in tensile samples, similar to materials compressed in the plane-strain. The only minor difference between compression and tensile deformation was observed in the range of low strains—the maximum intensity increased in compression up to the critical strain for lamellae fragmentation around e = 0.8, while in tensile samples the intensity in the maxima of the four-point pattern always remained lower than in unoriented samples and decreased with strain increase not only above e = 0.8, but also tended to decrease at low strains below this critical point. This suggested that some limited damage of lamellae, resulting in a slow decrease of scattering intensity, could occur in tensile samples also at strain lower than the critical, yet that fragmentation became much more intense above that strain. Such easier lamellae fragmentation seen in tension could be an effect of significantly weaker constraints imposed on lamellar structure in the tensile stress field than in the compressive. The tensile stress components acting perpendicularly to chain direction as well as the tensile stress across interlamellar layers reduced stresses necessary to activate slip mechanisms and ease the interlamellar shear, respectively [
50]. At the same moment, the stress concentrations at the interface produced by the fully stretched ST molecules were higher than in compression deformation mode. All this could locally trigger earlier some deformation instabilities and consequently led to a limited fragmentation of the lamellar structure, possibly occurring even prior to the onset of a widespread fragmentation near e = 0.8.


