Article

Radio-, Thermo- and Photoluminescence Properties of Lu2O3:Eu and Lu2O3:Tb Nanopowder and Film Scintillators

1
Institute of Physics of Kazimierz Wielki University in Bydgoszcz, 85-090 Bydgoszcz, Poland
2
Faculty of Chemistry, University of Wroclaw, 50-383 Wroclaw, Poland
*
Authors to whom correspondence should be addressed.
Crystals 2019, 9(3), 148; https://doi.org/10.3390/cryst9030148
Submission received: 22 February 2019 / Revised: 7 March 2019 / Accepted: 8 March 2019 / Published: 13 March 2019
(This article belongs to the Special Issue Crystals, Films and Nanocomposite Scintillators)

Abstract

:
This work is dedicated to the preparation and characterization of the radio-, thermo-, and photoluminescent properties of Lu2O3:Eu and Lu2O3:Tb nanopowder (NPs) scintillators, prepared by means of hydrothermal processing, and their film analogues made of these NPs by the spin coating method. The luminescent properties of NPs and films were characterized by cathodoluminescence (CL), photoluminescence (PL), X-ray excited radioluminescence (RL), and thermoluminescence (TL) at low and high temperatures. In Lu2O3:Eu NPs and films, mostly the luminescence of Eu3+ ions occupying the C2 site of the host, with the most intensive peaks at 611.6 nm and a decay time of 1.5 ms, was observed. On the contrary, two types of Tb3+ centers in the C2 and C3i sites with the main emission lines at 542.4 and 544.0 nm and the corresponding 4f→5d excitation bands at 270 and 305 nm and decay times of t1/e = 2.17 and 3.96 ms were observed in the case of Lu2O3:Tb NPs and films. Indications were noted that Tb3+ in the C3i symmetry position was most active in the CL spectra of Lu2O3:Tb NPs and a respective film. Thermoluminescent peaks at 110 °C and 170 °C for Lu2O3:Eu NPs and at 75 °C and 120 °C in Lu2O3:Tb NPs were observed corresponding to the hole and electron traps, respectively. Significantly different onsets of temperature quenching of Eu3+ and Tb3+ luminescence in Lu2O3:Eu and Lu2O3:Tb NPs were found at ~90 °C and ~320 °C, respectively.

1. Introduction

Lu2O3 (lutetia) is a structural analog of Y2O3 sesquioxide. Both are well-known hosts for rare-earth doped phosphors and scintillators. Eu3+ and Tb3+ doped Lu2O3 oxides are mostly researched as sintered ceramics and nanocrystalline powder (NP) X-ray phosphors [1,2,3]. Due to its extremely high density of 9.42 g/cm3 (one of the densest inorganic compounds) and high effective Z-number Zeff = 67.3, Lu2O3-based phosphors attract attention as film scintillating screens for 2D/3D microimaging using X-ray or synchrotron radiation [4,5]. However, the properties of these materials in the various crystalline forms were found to be influenced by the differences in the methods and conditions of their preparation [6]. Understanding of these dependencies is important for deliberate management of phosphors properties according to the application needs.
Apart from the liquid phase epitaxy (LPE), which enables receiving Lu2O3:Eu single crystalline films from a few to tens of microns thick [5,6], other methods of film preparation, such as magnetron sputtering [7], pulse laser deposing [8,9], spin coating [10,11], etc., can be utilized for the fabrication of films of reasonable thicknesses. Most interesting are the methods of Lu2O3 film preparation, with thicknesses in the range of tens of nm to one micron, e.g., in the range where LPE cannot be used. This can be realized in the case of film preparation from the respective Lu2O3 based NPs using spin coating (SC) technology [10,11].
The aim of our work is the preparation and characterization of the luminescent properties of Lu2O3:Eu and Lu2O3:Tb NPs as well as their thin film counterparts with thicknesses in the submicron range, prepared by the SC method using the mentioned NPs. Such a study is especially important for producing scintillating screens for microimaging with high special resolution in the micron scale. For characterization of the luminescent properties of NP and films, data from complementary spectroscopic methods, such as cathodoluminescence, photoluminescence, radioluminescence, and thermoluminescence, were used.

2. Sample Preparation and Experimental Techniques

The Lu2O3:3%Eu and Lu2O3:1%Tb NPs were sintered by means of hydrothermal processing [2]. For preparation of these NP phosphors, appropriate amounts of Lu2O3 and/or Eu2O3 and Tb4O7 oxides were dissolved in diluted HNO3 at 80 °C. Then solid KOH was added until pH = 12. The immediately-formed suspension was cooled to room temperature (RT) and poured into an autoclave with a Teflon liner. The autoclave was heated at 230 °C for 10 h. After cooling, the precipitate was separated and washed several times with a water–ethanol mixture and dried. Finally, the powder was heat-treated at 900 °C for 5 h and then for 2 h at 950 °C in air.
The Lu2O3:Eu and Lu2O3:Tb thin NP films were prepared on quartz substrates using the SC method. Zinc acetate 2-hydrate (Zn(CH3COO)2*2H2O, 99.5%) was dissolved at RT in isopropanol. Afterwards the ethanolamine (NH2CH2CH2OH, MEA 98.0%) was added to the solution as a sol stabilizer. The molar ratio of ethanolamine to zinc acetate in solution was adjusted to 1:1 and the concentration of zinc acetate was 1.0 mol/L. The prepared mixtures were stirred at 333 K using a magnetic stirrer for about 1 h to obtain a clear homogeneous solution. Then 0.003 g of Lu2O3:Eu or Lu2O3:Tb NPs was added to the respective solutions. The thin NP film was deposited onto quartz substrates by the SC method with a speed rotation of 2000 r/min for 20 s. Each coated layer was dried at 353 K for 30 min to evaporate the solvent. The thickness of each dry layer was about 50 nm. The process was repeated to obtain a desired thickness of films in the 100–300 nm range. Finally, the thin NP films were heated in ambient atmosphere at the temperature of 823K for 1 h [12,13].
A D8 Advance diffractometer from Bruker (Billerica, MA, USA) with Cu Kα1 radiation of 1.54060 Å wavelength was used for X-ray diffractometry to determine the phase purity of samples. The morphology of the nanoparticles and films were studied using Hitachi S-3400N (Hitachi High-Technologies, Tokyo, Japan) and JEOL JSM 820 (JEOL, Tokio, Japan) scanning electron microscopes, respectively. Cathodoluminescence (CL) spectra of Lu2O3:Eu and Lu2O3:Tb NPs and films with 1.0 nm resolution were measured at RT using the JEOL JSM-820 electron microscope, additionally equipped with a high-sensitivity spectrometer Steller Net Silver Nova with a grating monochromator, respective software, and an electronically-cooled CCD detector (StellarNet, Tampa, USA) working in the 200–1200 nm range. The photoluminescence (PL) emission and excitation spectra as well as PL decay kinetics of Lu2O3:Eu and Lu2O3:Tb NPs at RT were investigated using a FLS 980 Edinburg Instruments spectrometer (Edinburgh Instruments Ltd., Livingston Scotland) Thermally stimulated luminescence (TSL) glow curves, TSL luminescence spectra, and radioluminescence (RL) spectra were recorded using a Lexsygresearch Fully Automated TL/OSL Reader from Freiberg Instruments GmbH, (Freiberg, Germany). The source of white X-rays was a Varian VF-50J RTG X-ray tube with a W-anode. The TSL glow curves were collected with a 9235QB-type photomultiplier from ET Enterprises (Uxbridge, UK). TSL emission spectra were recorded with an Andor DU420A-OE CCD camera and were not corrected for the system sensitivity. All modules were operated by means of LexStudio 2 software and resultant data were processed under LexEva 2 analytical software dedicated to the TL/OSL Reader and supplied by the manufacturer (Freiberg Instruments GmbH, Freiberg, Germany).

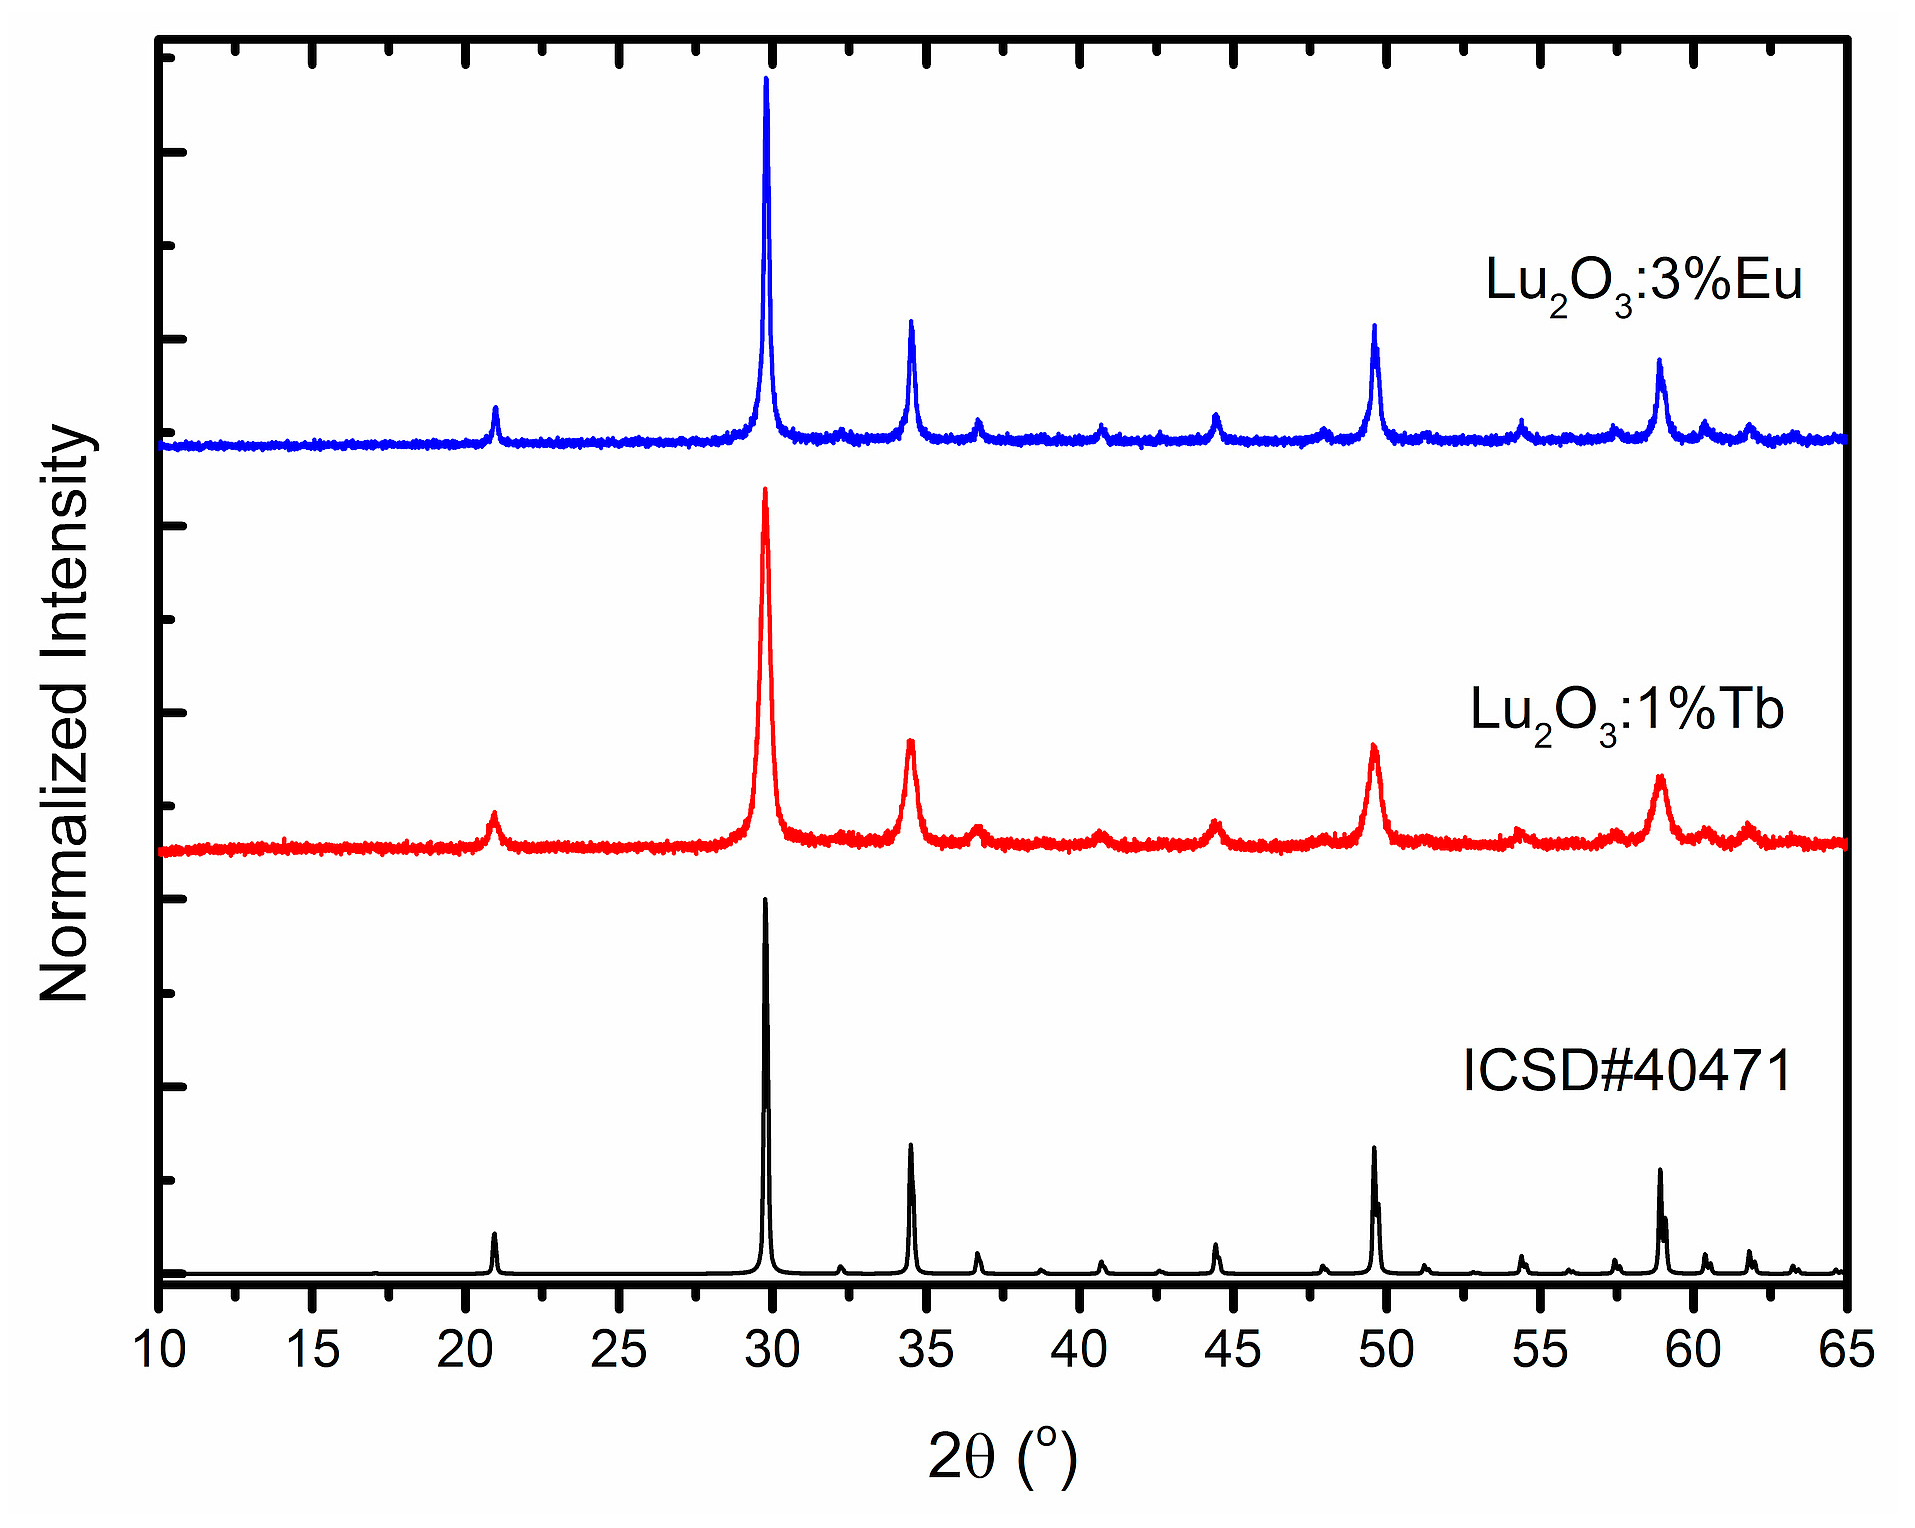
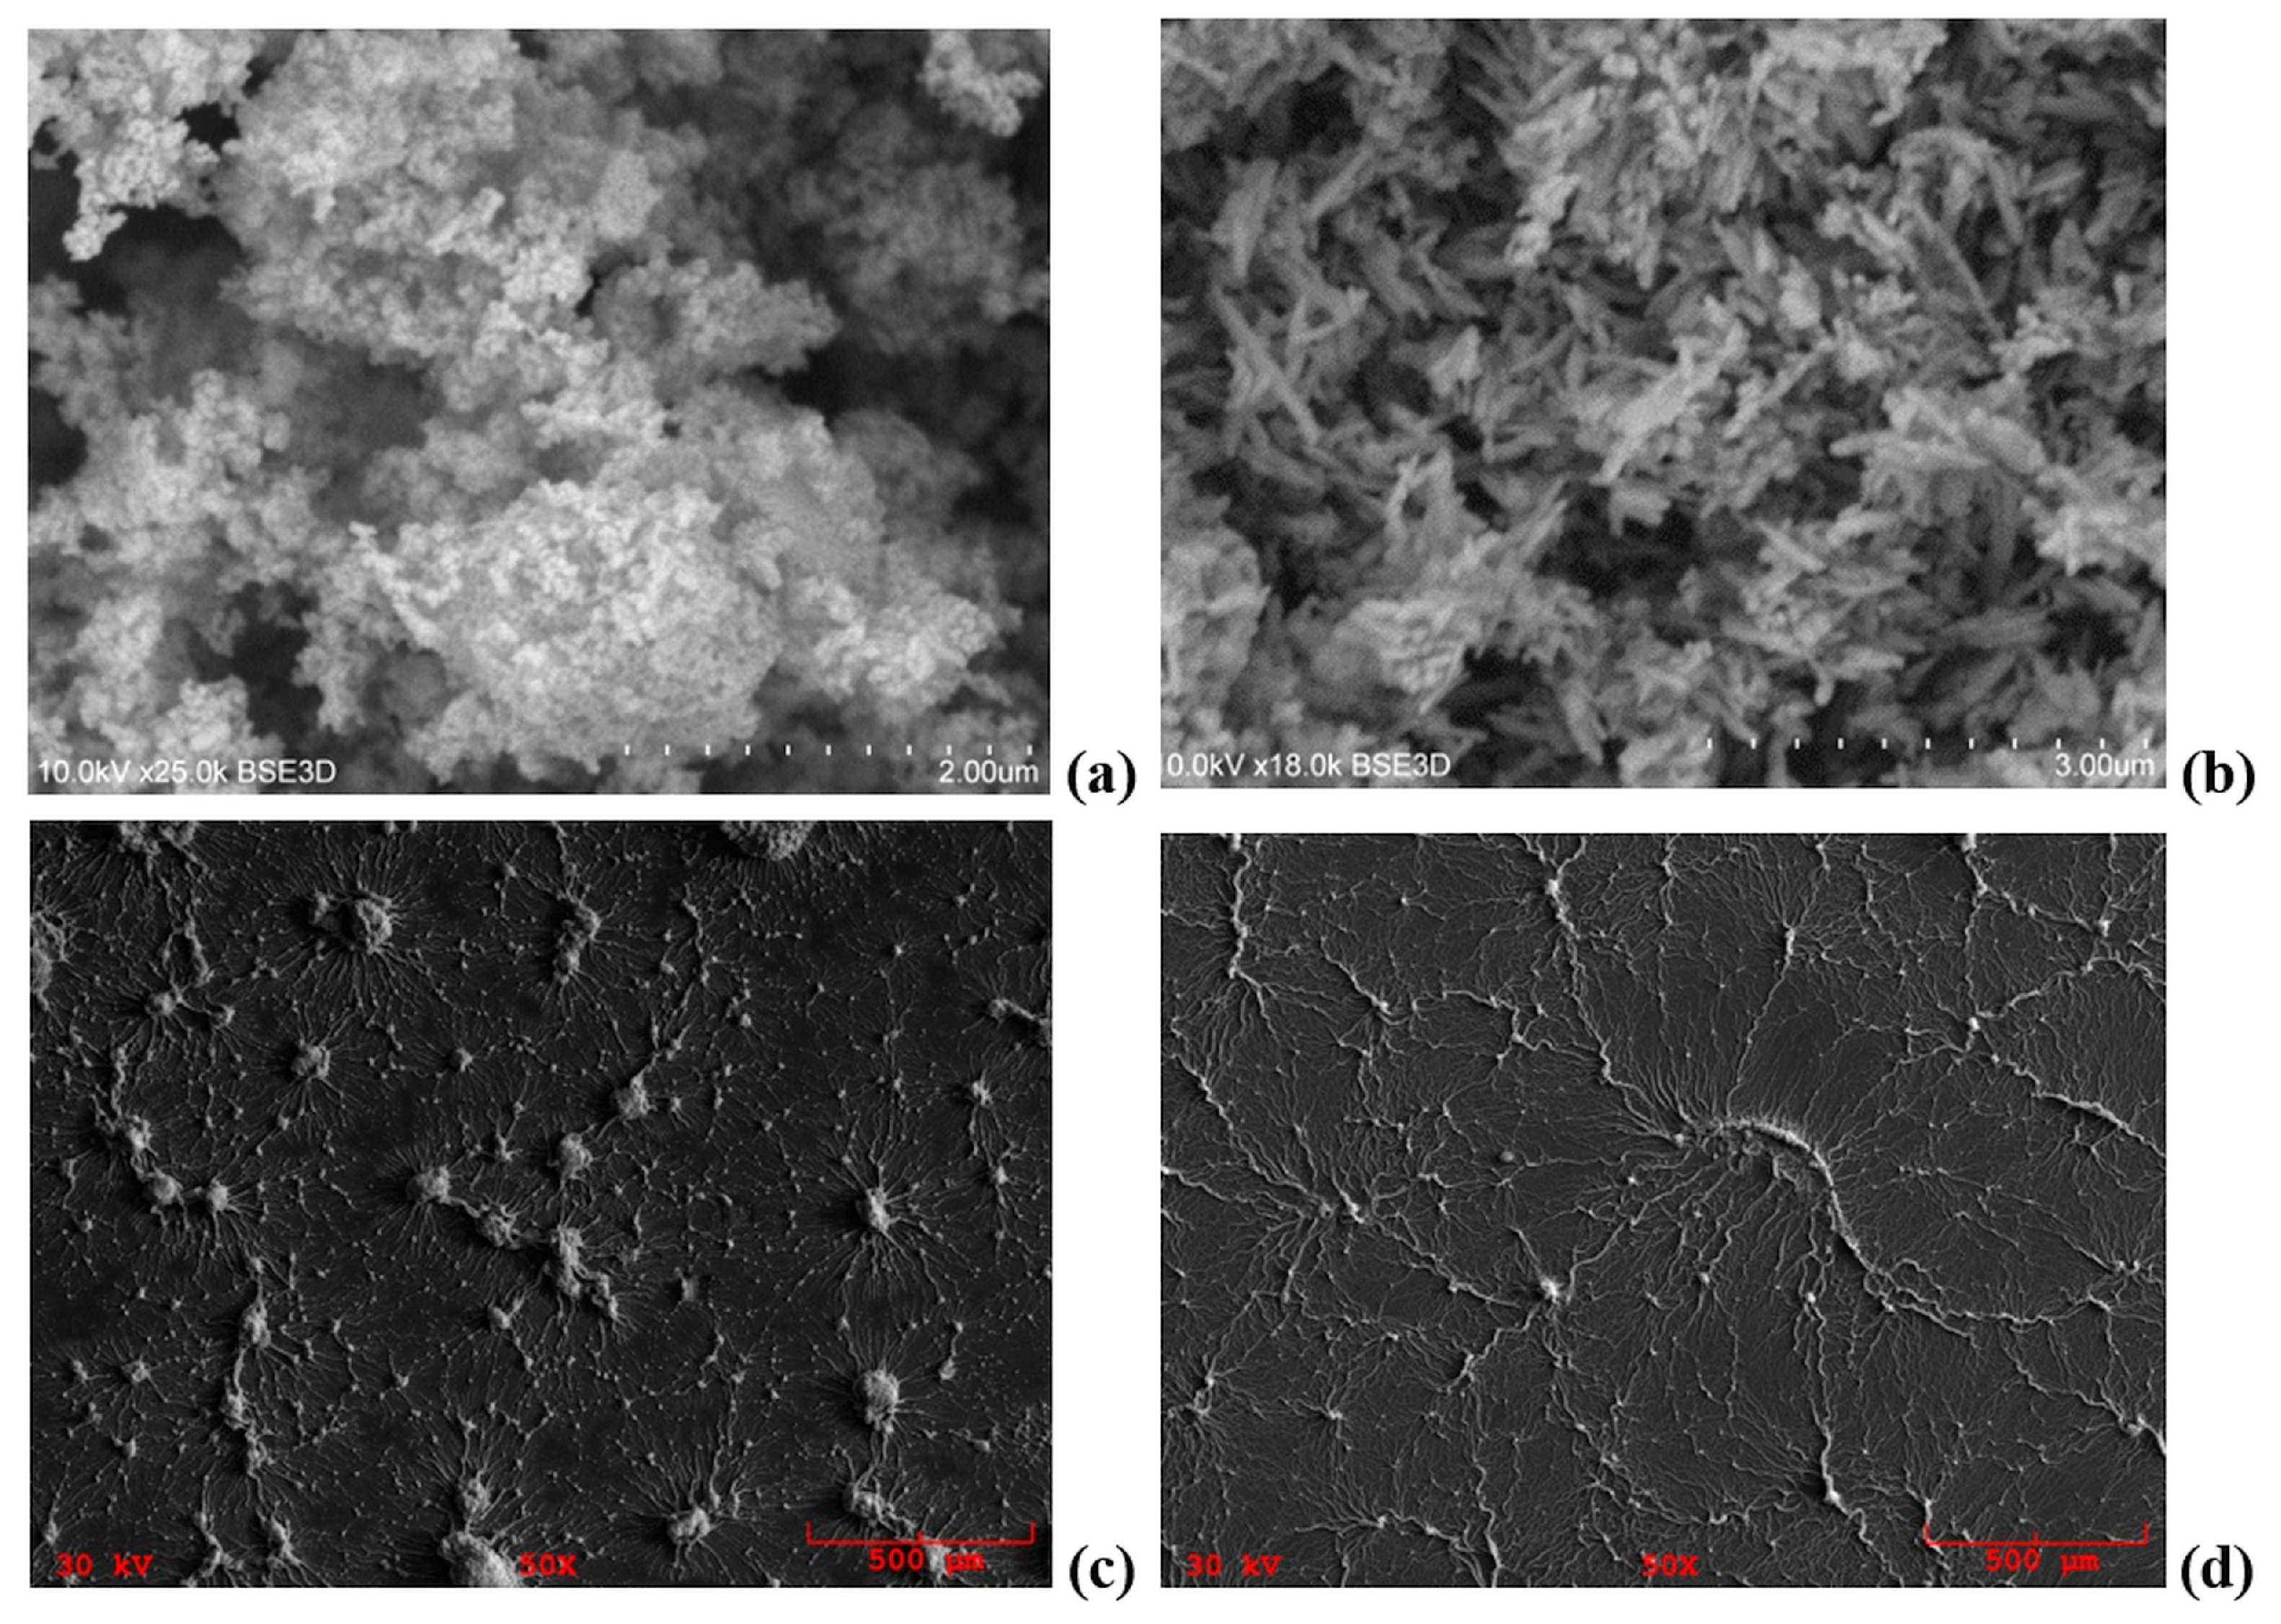
3. Structural and Morphological Properties of Lu2O3:Eu and Lu2O3:Tb NPs and Films

The structure and morphology of NPs and films were studied using X-ray diffraction (XRD) and scanning electron microscopy (SEM), respectively. Measured XRD patterns of the Lu2O3:Eu and Lu2O3:Tb powders are presented in Figure 1 together with a simulated pattern ICSD#40471 of Lu2O3 [3]. Analogous data were collected for films. As expected, they did not differ from the powders despite small background from the amorphous substrate. Therefore they are not separately presented here.
It is clear that, to the level of the detection limit of the technique, no foreign phases were observed in any of the phosphors. In both cases the diffraction lines were broadened signifying that they were composed of nanosized crystallites which was proven by means of the high resolution SEM images presented below. Furthermore, no broad band underlying the regular XRD pattern was seen for any of the powders which implied that the amorphous fraction was not present or its amount was insignificant. This is advantageous for spectroscopic properties.
However, as shown in Figure 2, the morphology of the samples was noticeably different in the case of Lu2O3:Eu (Figure 2a) and Lu2O3:Tb (Figure 2b) powders despite the apparently identical conditions of preparation of the phosphors. Ball-like particles were formed in the case of Lu2O3:Eu whereas dendrite-like structures appeared in the case of Lu2O3:Tb (Figure 2a,b, respectively). The reasons for such a significant difference are not clear and will be further investigated. One can presume that the unavoidable presence of Tb4+ during the formation of the Lu2O3:Tb particles may play a crucial role here. The SEM images prove that both powders are nanocrystalline with crystallites smaller than 100 nm. Particles tended to agglomerate but no hard aggregates were exposed.
The morphology of Eu- and Tb-doped Lu2O3 films is shown in Figure 2c,d, respectively. The respective Lu2O3:Eu and Lu2O3:Tb NPs were embedded in the specific needle-like nets onto the quartz substrate surface. Thus, in the case of Lu2O3:Tb, more uniform phosphor was netted onto substrate surface with a small quantity of the large-dimensional conglomerates observed. For Lu2O3:Eu films, the quantity and size of such conglomerates were significantly larger. Apparently, differences in the morphology of Lu2O3:Eu and Lu2O3:Tb NPs (Figure 2a,b) led to the difference in the surface morphology of the respective films, formed by means of the SC method. In the future a significant effort should be made towards improvement of the film morphology.
The difference in the uniformity of the Lu2O3:Eu and Lu2O3:Tb NPs films was also confirmed by the respective absorption spectra of these films with thicknesses in the 100–300 nm range. Namely, the background level significantly increased with the thickness for Lu2O3:Eu films (Figure 3a) while in the case of Lu2O3:Tb films, only insignificant differences were seen (Figure 3b). It is thus expected that optimization of film fabrication (necessarily combined with optimization of the NPs preparation) may create high levels of film uniformity and consequently homogeneity of their spectroscopic properties.

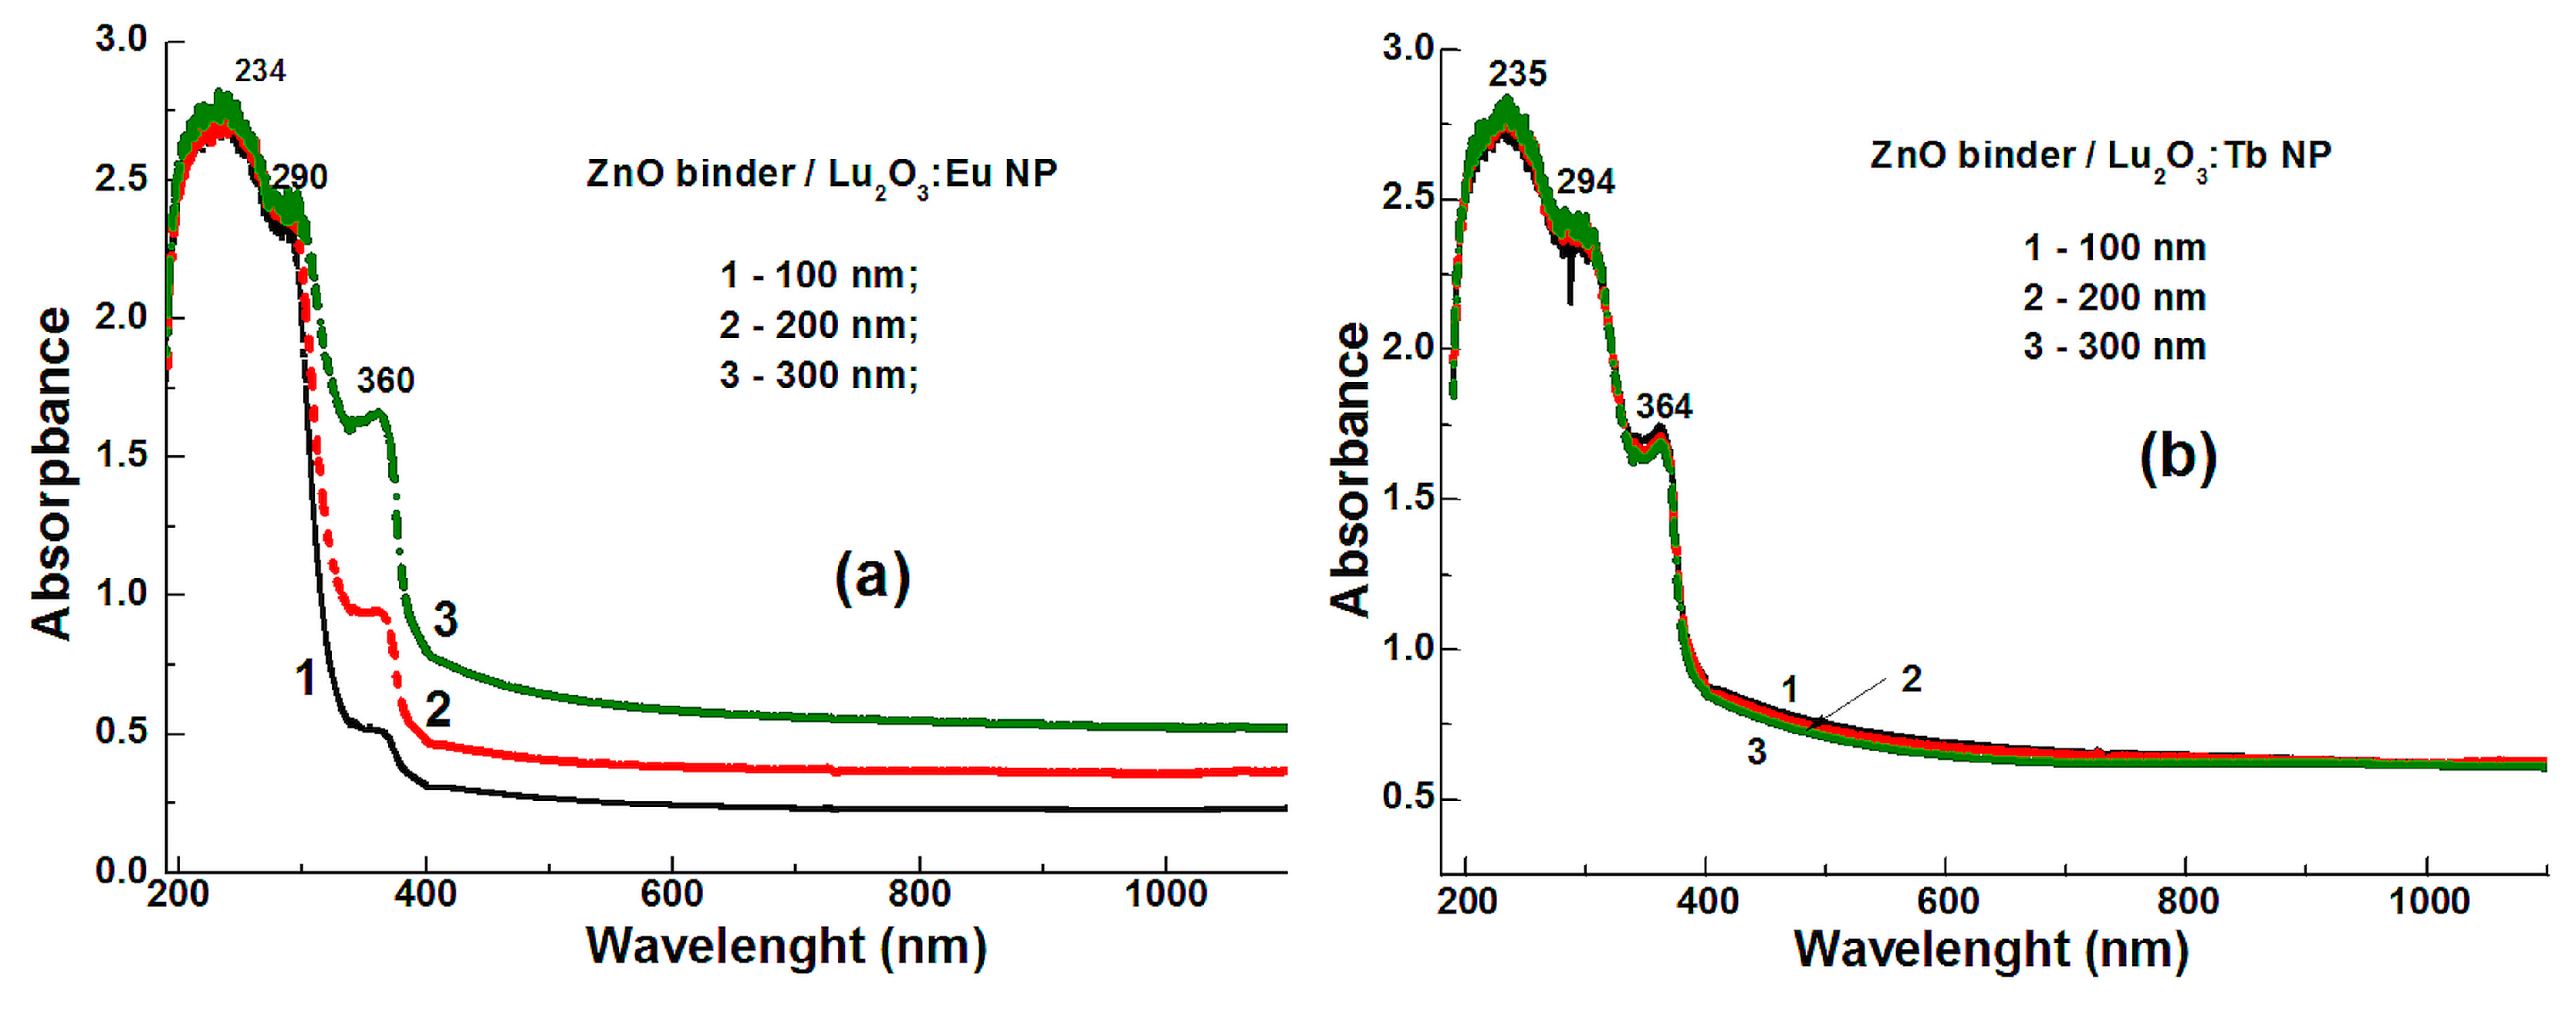
4. Luminescent Properties of Lu2O3:Eu and Lu2O3:Tb NPs and Films

The Lu2O3 lattice provides two positions with different symmetry of Lu3+ cations and consequently also of the Eu3+ and Tb3+ dopants [3]. These are centrosymmetric C3i (often termed S6 in the spectroscopic literature which is not fully correct) and lower-symmetry non-centrosymmetric C2 sites. The population of the latter is triple the population of the former. Generally speaking, for the C3i sites the electric dipole 4f–4f transitions are forbidden and emission spectra of the Lu2O3:Eu and Lu2O3:Tb NPs are dominated by transitions of Eu3+ and Tb3+ ions occupying the C2 sites [2,3] unless direct selective excitation into the dopant in the C3i site is applied. Furthermore, at least for the Eu3+ activator, significant Eu(C3i)→Eu(C2) energy transfer occurs when the dopant content increases above ~1 mol% [2].
It was proven that the Eu3+ and Tb3+ luminescence can be different in the various Lu2O3 crystalline forms (single crystals, powders, films) [6]. This was attributed mainly to a different concentration of oxygen vacancies which interfere with the host–activator energy transfer under excitation above the Lu2O3 host band gap in the different crystalline Lu2O3 samples [6].
The luminescent properties of Lu3O3:Eu NPs and Lu2O3:Tb NPs were characterized by cathodoluminescence (CL), X-ray excited radioluminescence (RL), photoluminescence (PL), and thermoluminescence (TSL) measurements in a broad range of temperatures, both below and above room temperature. Due to the very low thicknesses of the Lu2O3:Eu NP films (100–300 nm) their RL and TSL properties could not be effectively investigated.

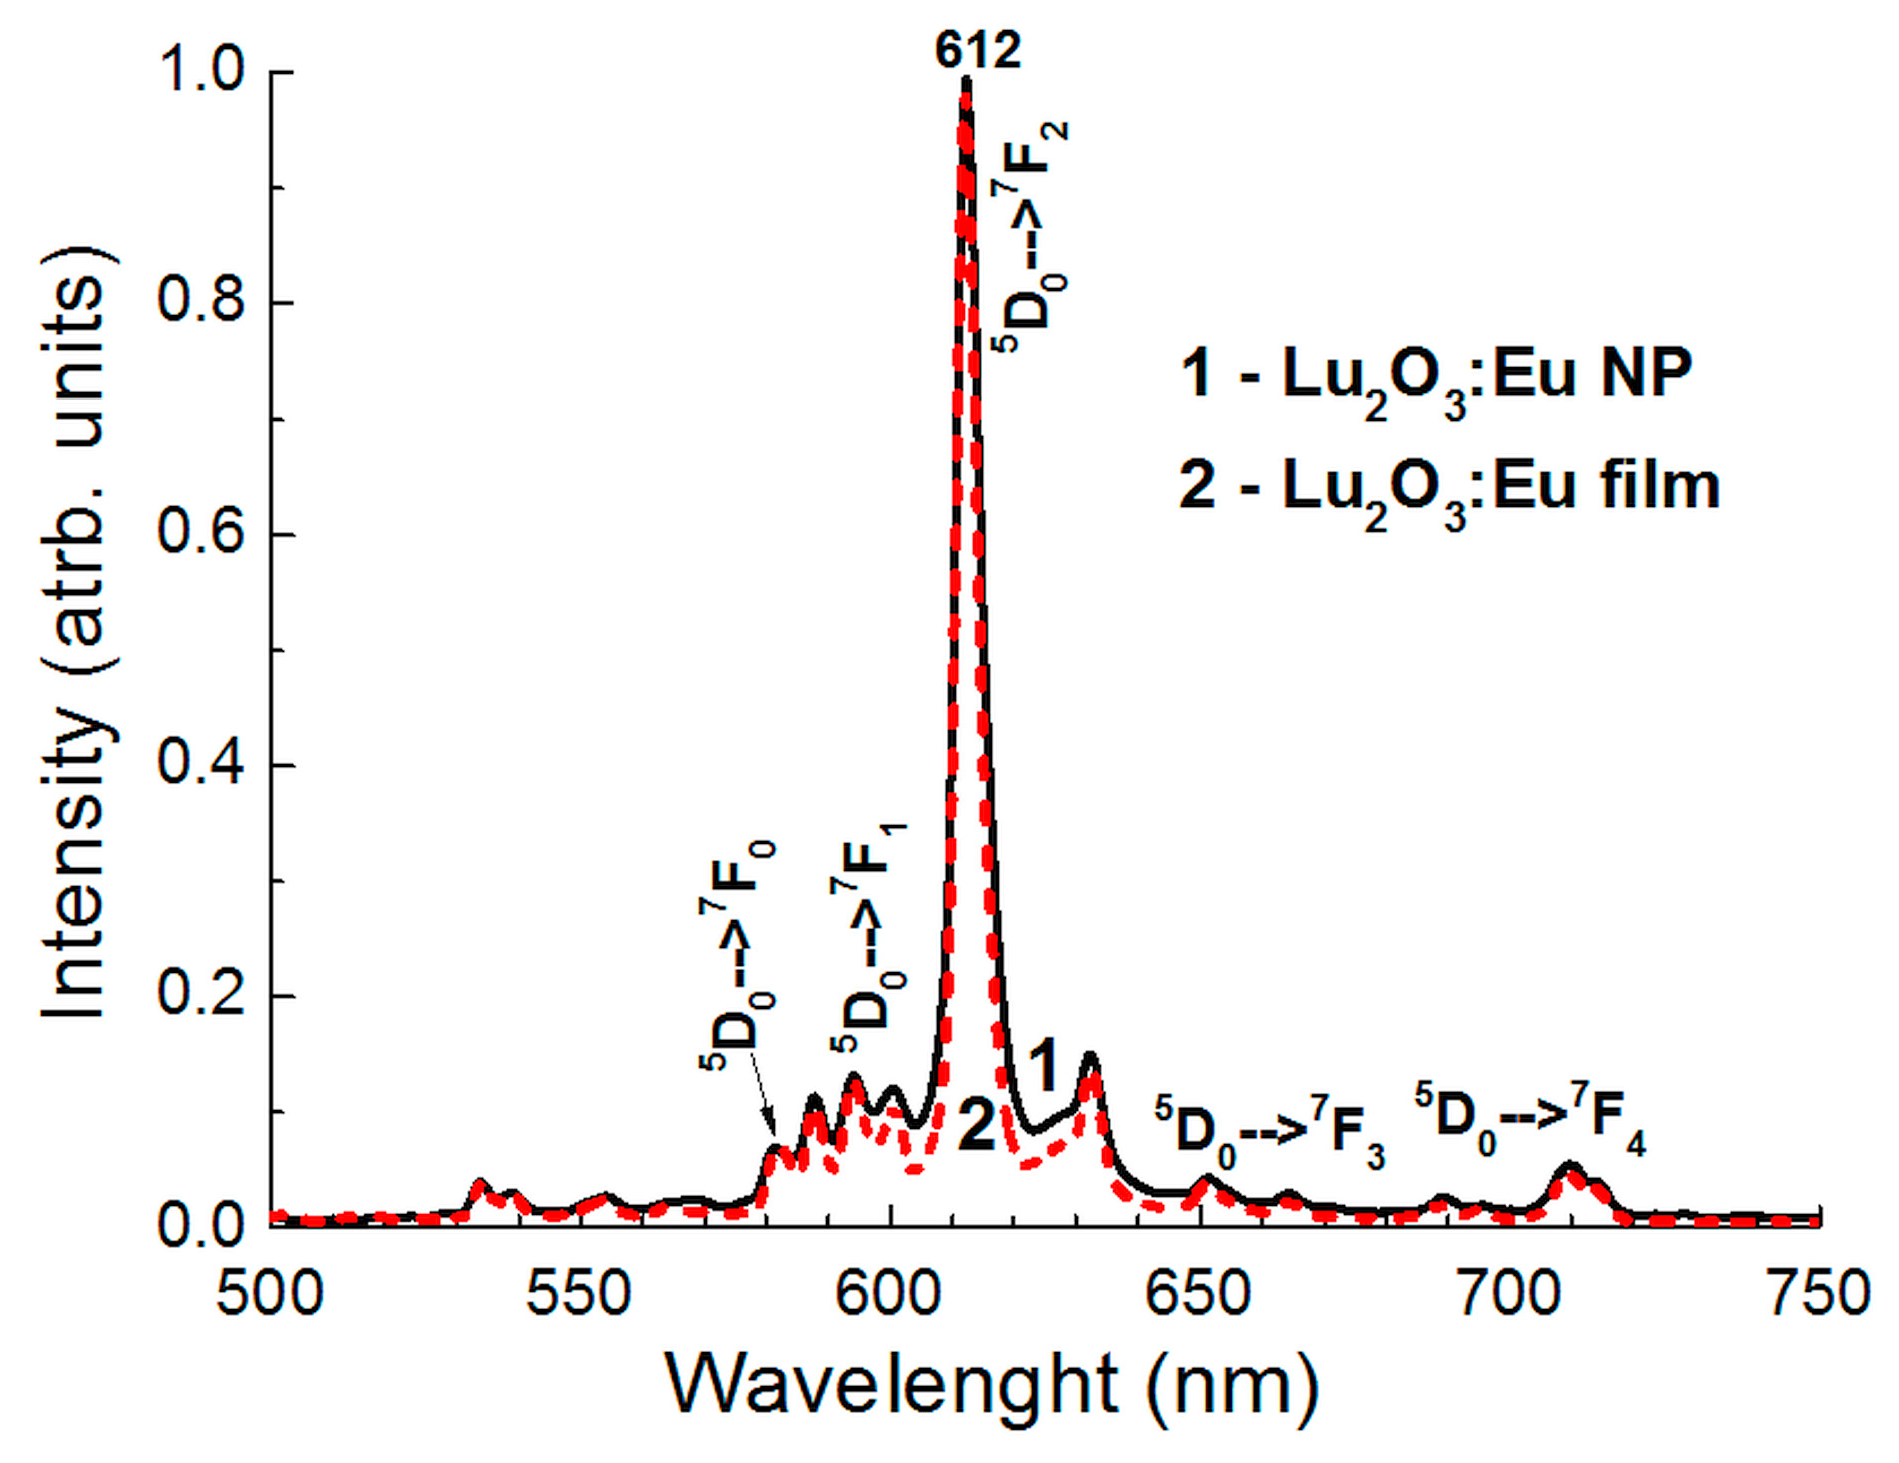
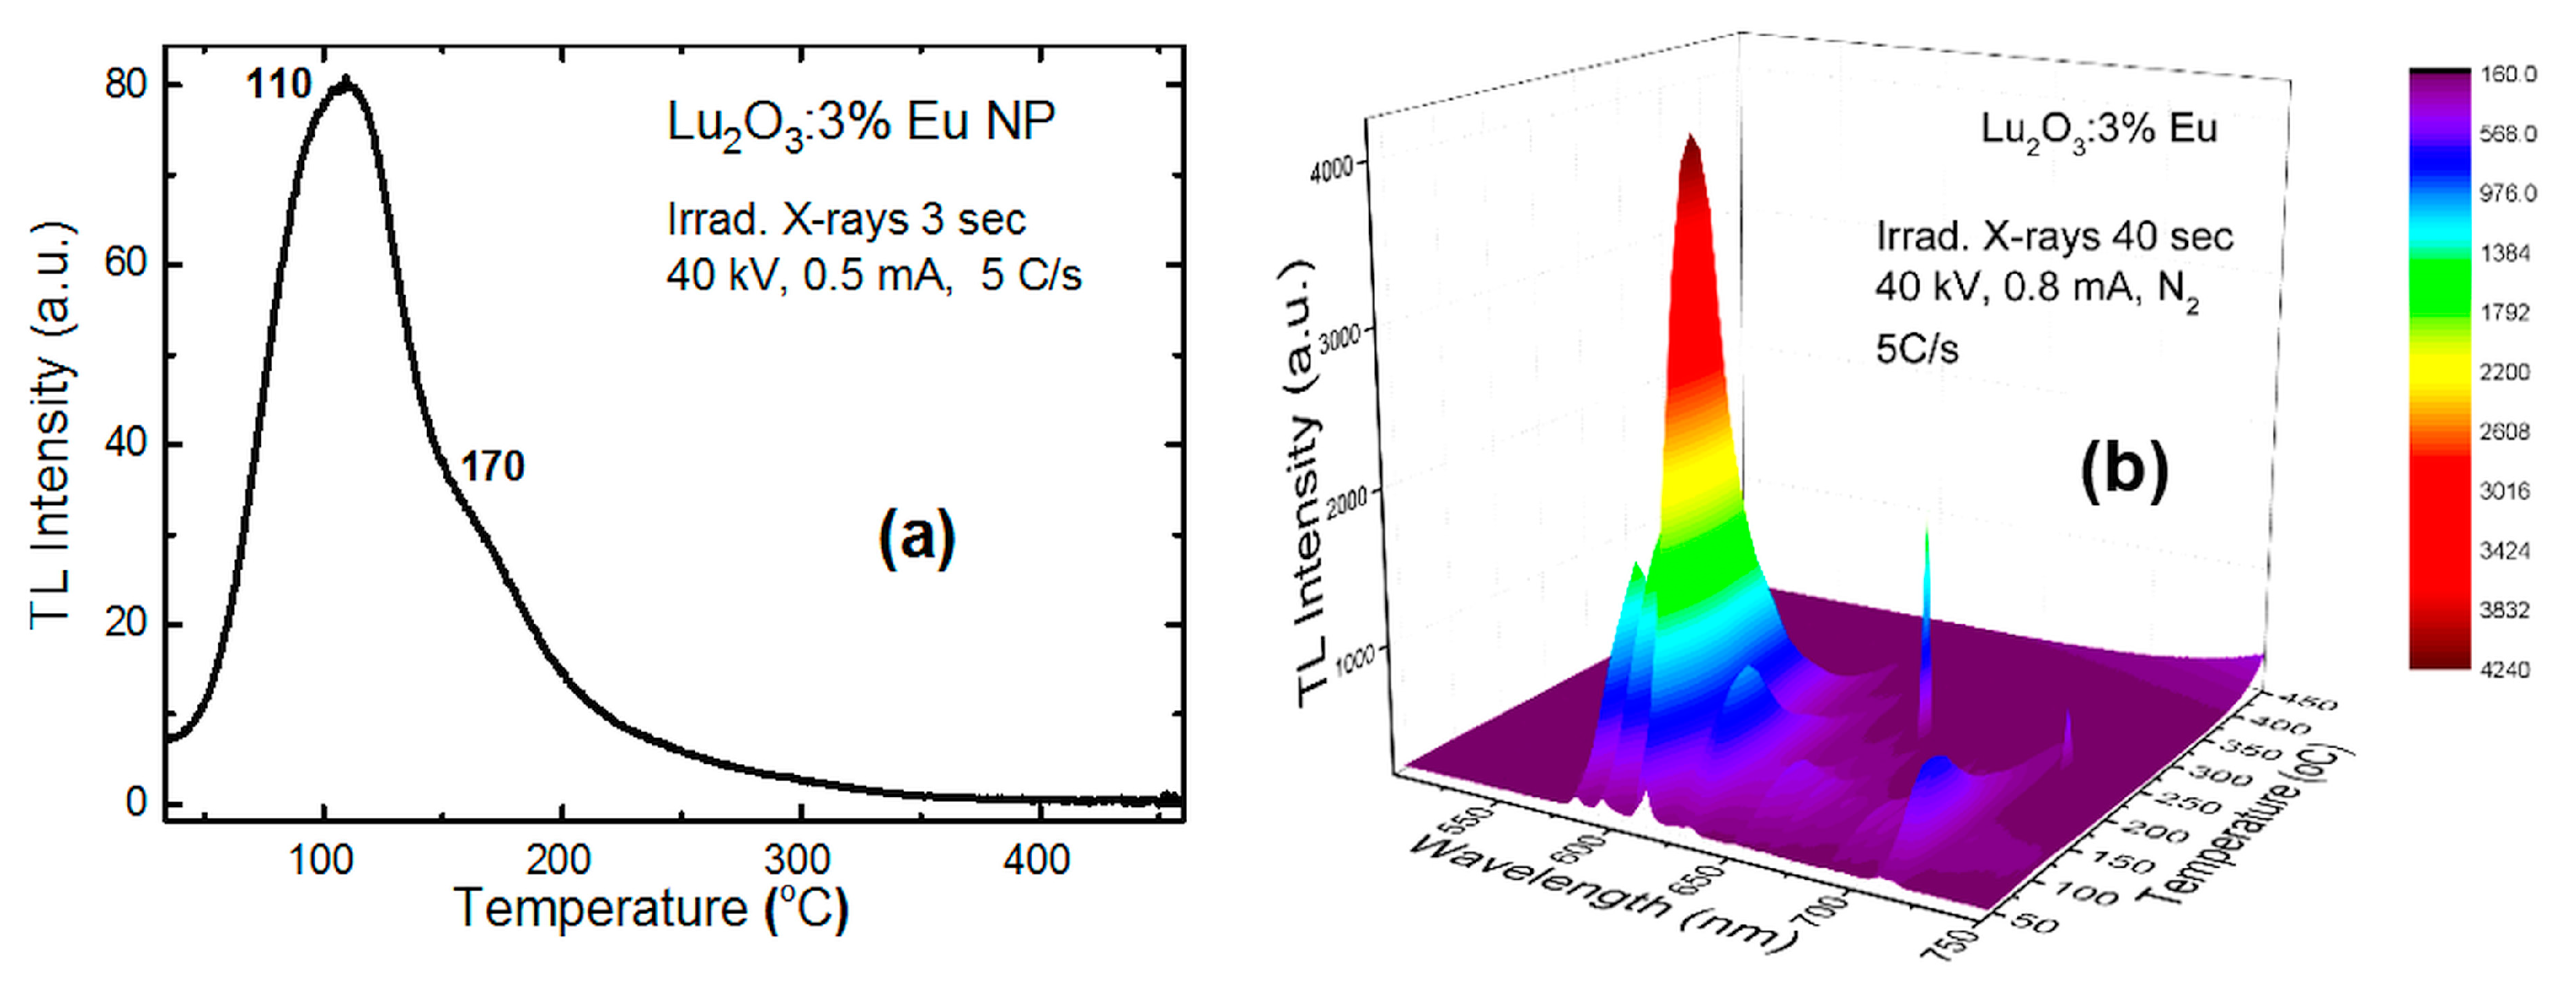
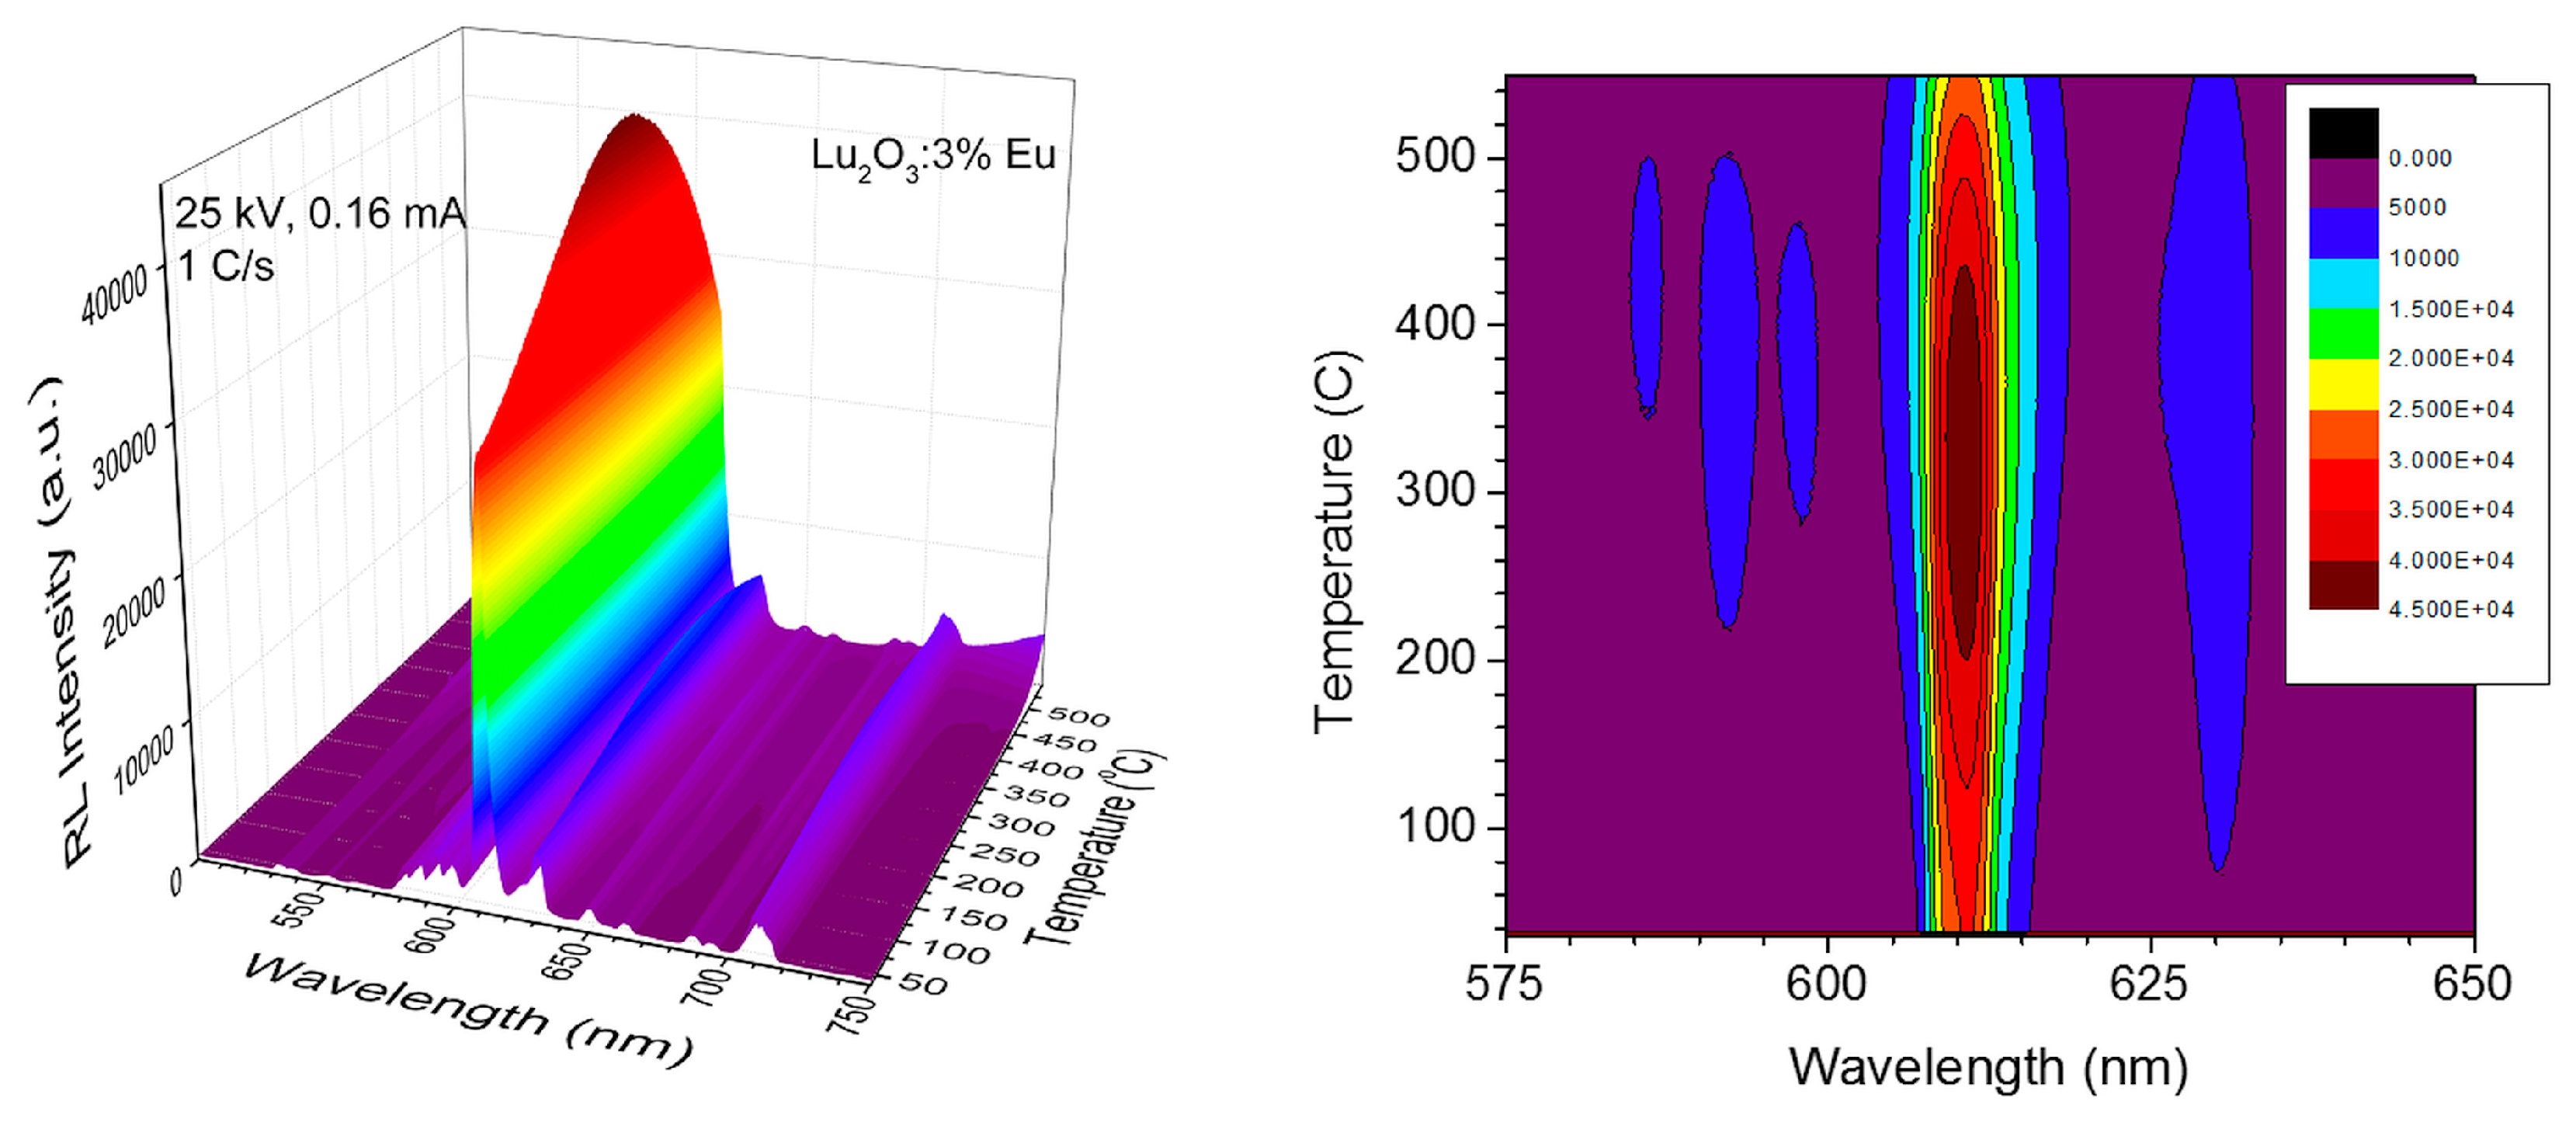
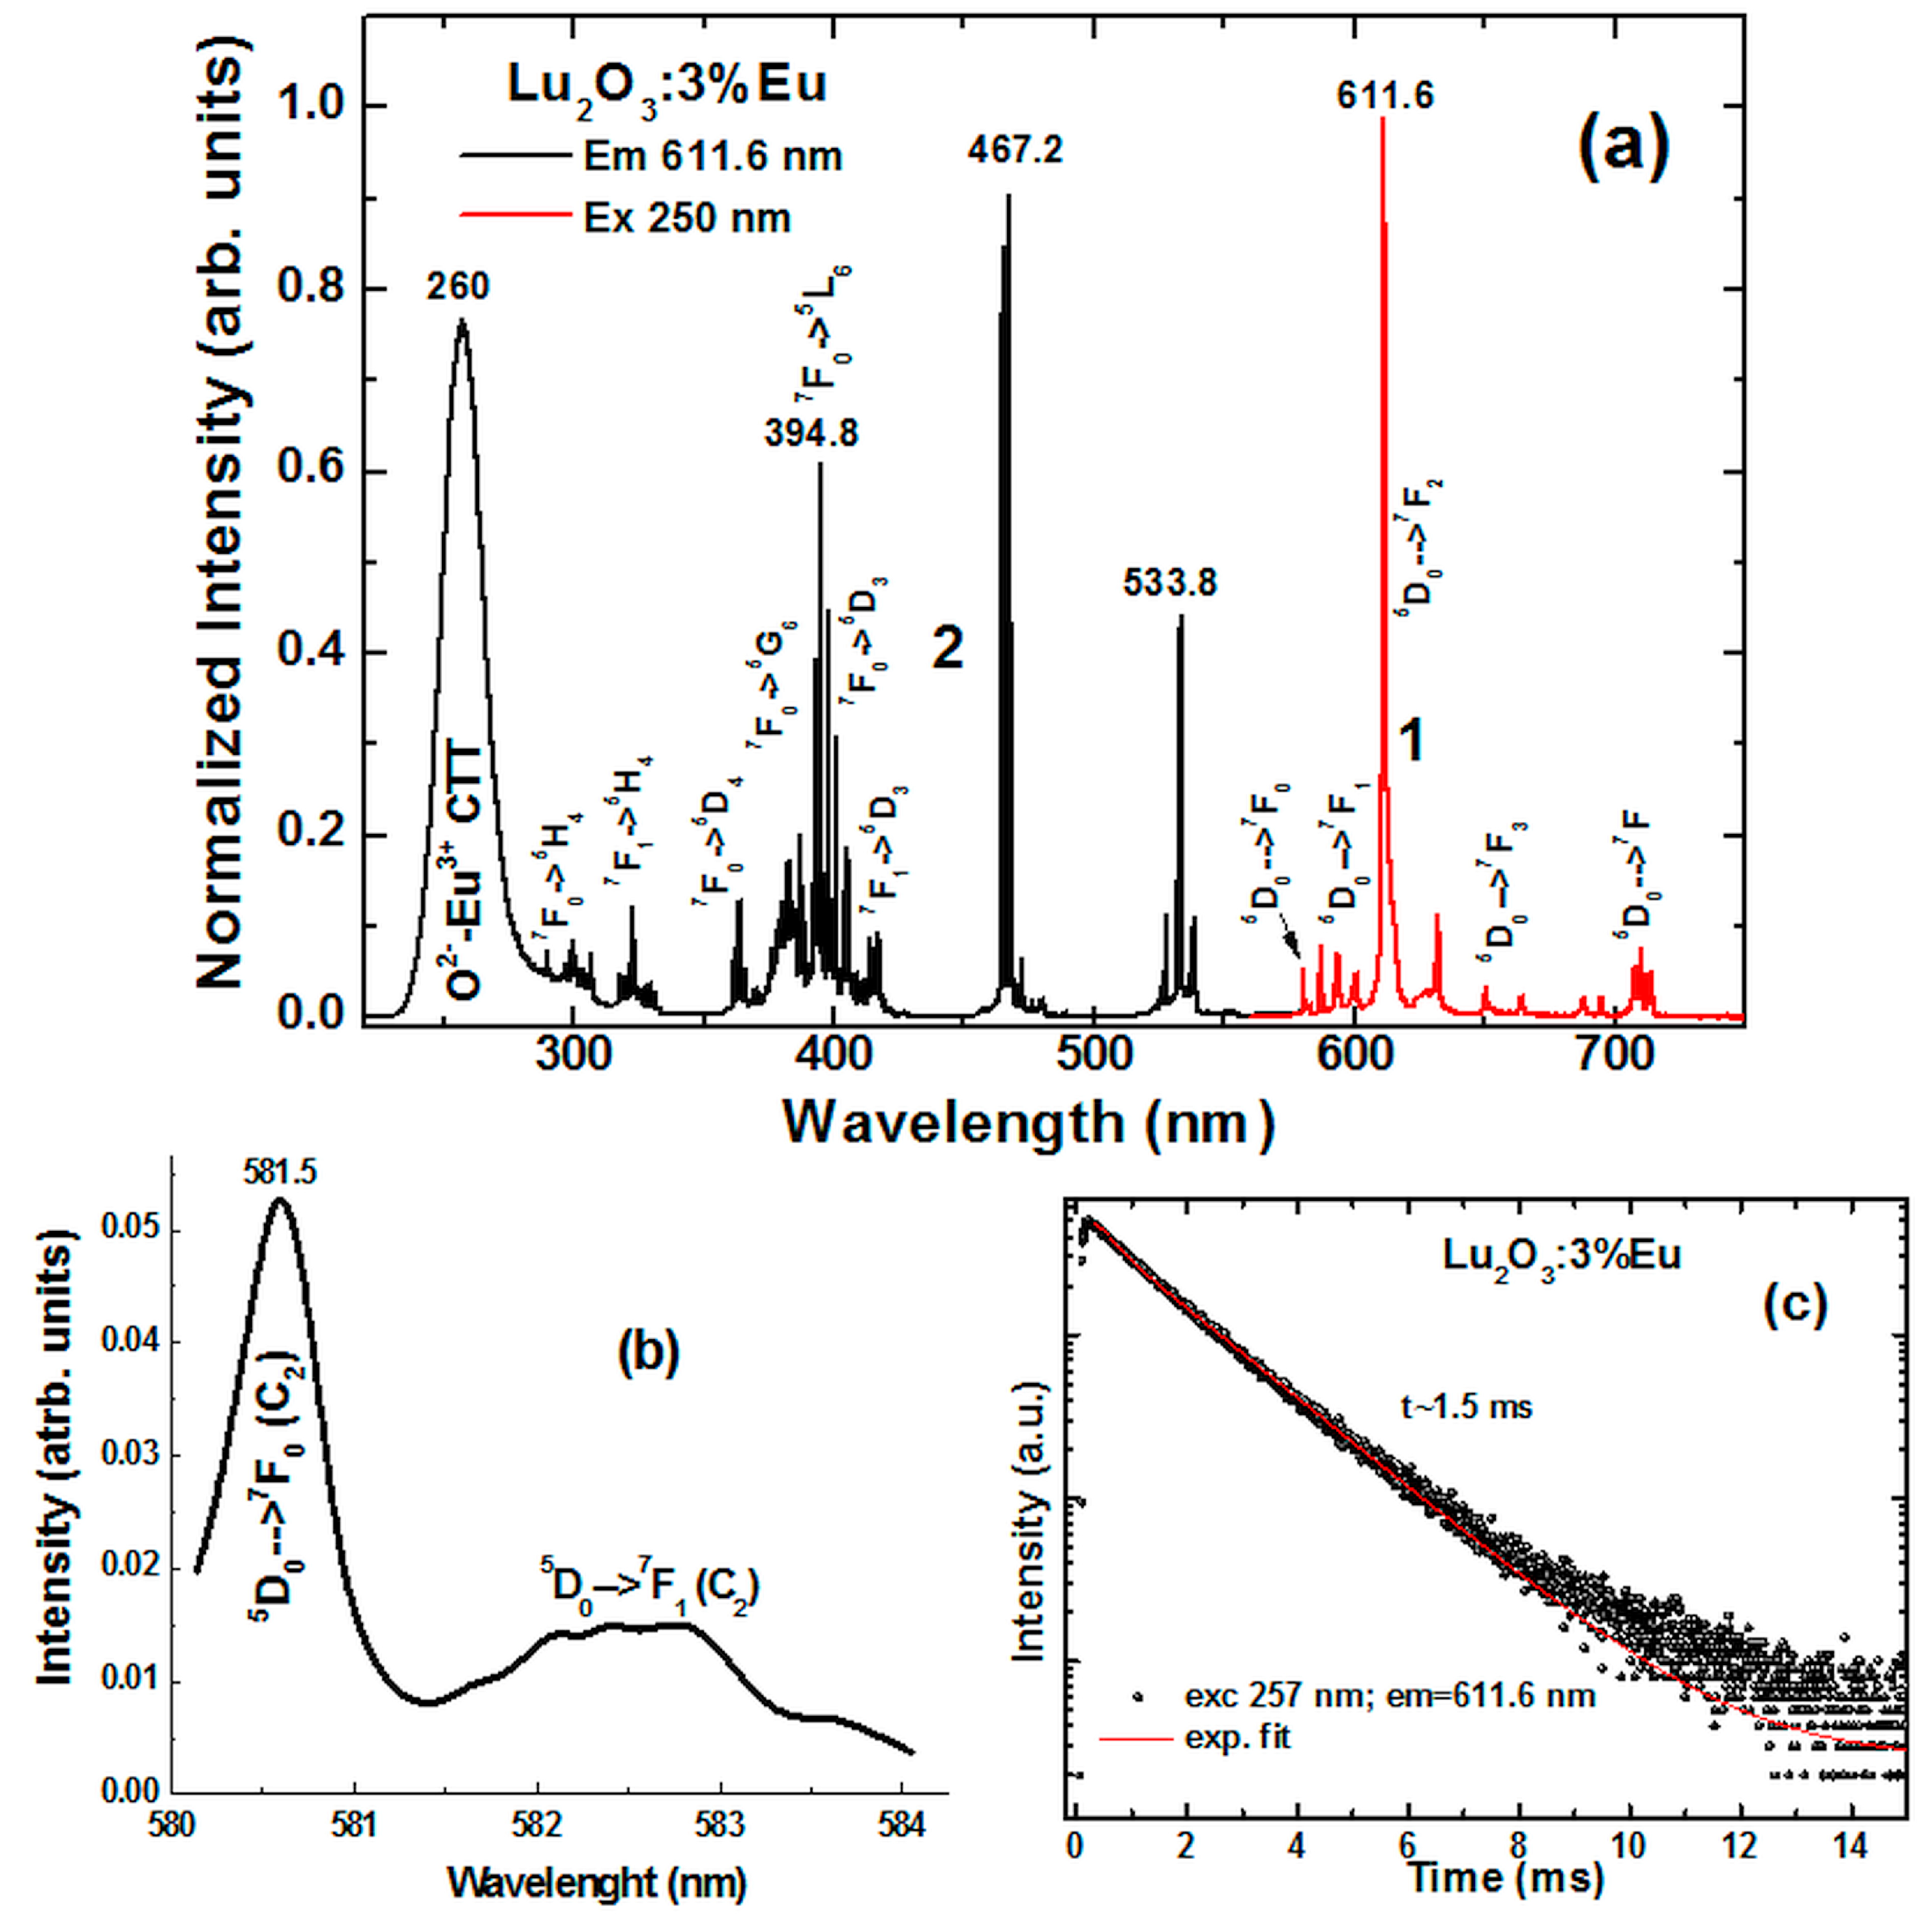
4.1. Lu2O3:Eu NPs and Films

Cathodoluminescence: The CL spectra of both Lu2O3:Eu NPs and films showed quite similar shapes (Figure 3). The most intensive CL emission peak was observed at 612 nm, which corresponded to the 5D07F2 transitions of Eu3+ ions in the C2 site. In both spectra some contribution from the 5D07F0 transitions as well as the low-intensity 5D07F1 transitions of Eu3+ ions was also observed. According to literature, in this range there might also be some light generated by the Eu3+ occupying the C3i site [2]. It is noteworthy that some contribution from the 5D1 level in the ~525–570 nm range of wavelengths was also evident in the CL spectra of Lu2O3:Eu NP (Figure 3 and Figure 4).
Photoluminescence: The PL emission spectra of Lu2O3:Eu NPs at RT were quite similar at different excitation energies and consisted of a group of strong lines caused by the 5D07Fj (J = 0–4) transitions of Eu3+ ions (Figure 5a,b). The most intensive emission peak was observed at 611.6 nm (Figure 5a, curve 1) which corresponded to the 5D07F2 transition of Eu3+ ions in the C2 site. The 5D07F0 transition of Eu3+ ions in the C2 sites at 580.5 nm was clearly observed in the PL spectra of Lu2O3:Eu NPs (Figure 5b). That indirectly confirmed the very good quality of the phosphor [8]. No emission of Eu2+ ions was detected in the Lu2O3:Eu NPs. As is presented in Figure 5c, the main luminescent line showed basically exponential decay with the time constant τ = 1.5 ms. This was noticeably longer than in the case of coarse grains of the same composition, when the decay was about 1.0 ms [14]. The elongation of the decay time in nanopowders was described and explained first by Meltzer [15,16]. Good quality NPs show longer decay times than their micron-sized counterparts because the effective refractive index n felt by the emitting ion in nanopowders is significantly lower than in the coarse-grained materials [14,15,16,17,18]. In the latter, the refractive index n is defined by the host, while in the former, air (vacuum) contributes to the effective n value. The exponential, and much longer than in crystals, decay of Eu3+ luminescence in the Lu2O3:Eu NPs prove their high quality and low population of defects.
The excitation spectrum of the Eu3+ 611.6 nm luminescence (C2 site) of Lu2O3:Eu NP (Figure 5a, curve 2) consisted of sharp lines in the 270–550 nm range, corresponding to the intrinsic 4f–4f transitions of Eu3+ ions. Narrow, well-resolved excitation lines again attested to the high structural quality of the fabricated Lu2O3:Eu NPs. A strong wide excitation band peaking at approximately 260 nm was related to the O2−→Eu3+ charge transfer transitions (CTT). One might be surprised by the high intensity of the 4f→4f excitation transitions of Eu3+ compared to its CTT band. This was already explained years ago [19] for Lu2O3:Eu and even earlier [20] for electronic and vibronic transitions of Pr3+ in other compositions as resulting from the saturation effect which effectively suppresses the measured intensity of the CCT. This occurs because the very high absorption co-efficient of the charge transfer transitions precludes excitation of the whole depth of the phosphor layer, while much lower absorptivity due to 4f→4f transitions allows the deeper penetration of the sample by radiation in the area of their occurrence.
Thermally stimulated luminescence: The TSL glow curve and evolution of TSL emission spectra of Lu2O3:Eu NPs with temperature are shown in Figure 6a,b, respectively. The positions of the main TSL peaks are located at ~110°C and 170°C (Figure 6a). Already at room temperature some afterglow of Lu2O3:Eu NP was observed. The TSL emission spectra of Lu2O3:Eu NP were composed of Eu3+ luminescence exclusively (Figure 6b). According to the model of TSL processes [21,22,23], Eu3+ ions serve as electron traps, while the hole trap is expected to be connected with an intrinsic defect of the host. The relative intensity of the orange features of Eu3+ luminescence (~585–600 nm) in the TSL spectra (Figure 6b) was notably higher than in CL or PL spectra, presented in Figure 4 and Figure 5. This indicated that Eu3+ ions in the C3i site were more susceptible for trapping electrons than those in the C2 site and consequently more profoundly contribute to TSL. Such an observation was already reported in Lu2O3:Eu sintered ceramics [24]. Yet, in the ceramics it was observed only for lower concentrations of Eu, up to 1%, while here it was still seen for the Eu content of 3%. This size-effect should be a subject of more comprehensive and focused investigation in the future. Note that two spikes at ~650 nm and ~730 nm around 260–270 °C seen in Figure 6b were artifacts resulting from an electronic noise of CCD used in this experiment.
Radioluminescence: X-ray excited RL spectra of Lu2O3:Eu NPs were measured in the temperature range of 300–550 °C and the data are presented in Figure 7. Note how much less intense the relative intensity of the orange part (~585–600 nm) was in RL than it was in TSL (Figure 6b). Surprisingly, the maximum of RL intensity Lu2O3:Eu NP was observed around 320–330 °C. Hence, the overall efficiency of the RL was higher when temperature was well above the main TSL peaks (Figure 6). Therefore, this phenomenon had to be caused by a higher efficiency of energy transfer from the excited host to the dopant at such high temperatures. This, in turn, might imply that the light yield under X-ray reported in the past [1] might not reflect the real potential of this X-ray phosphor. This is a truly intriguing conclusion and this effect is worth much deeper investigation, and it is especially interesting that such results can be compared for different Eu concentrations.

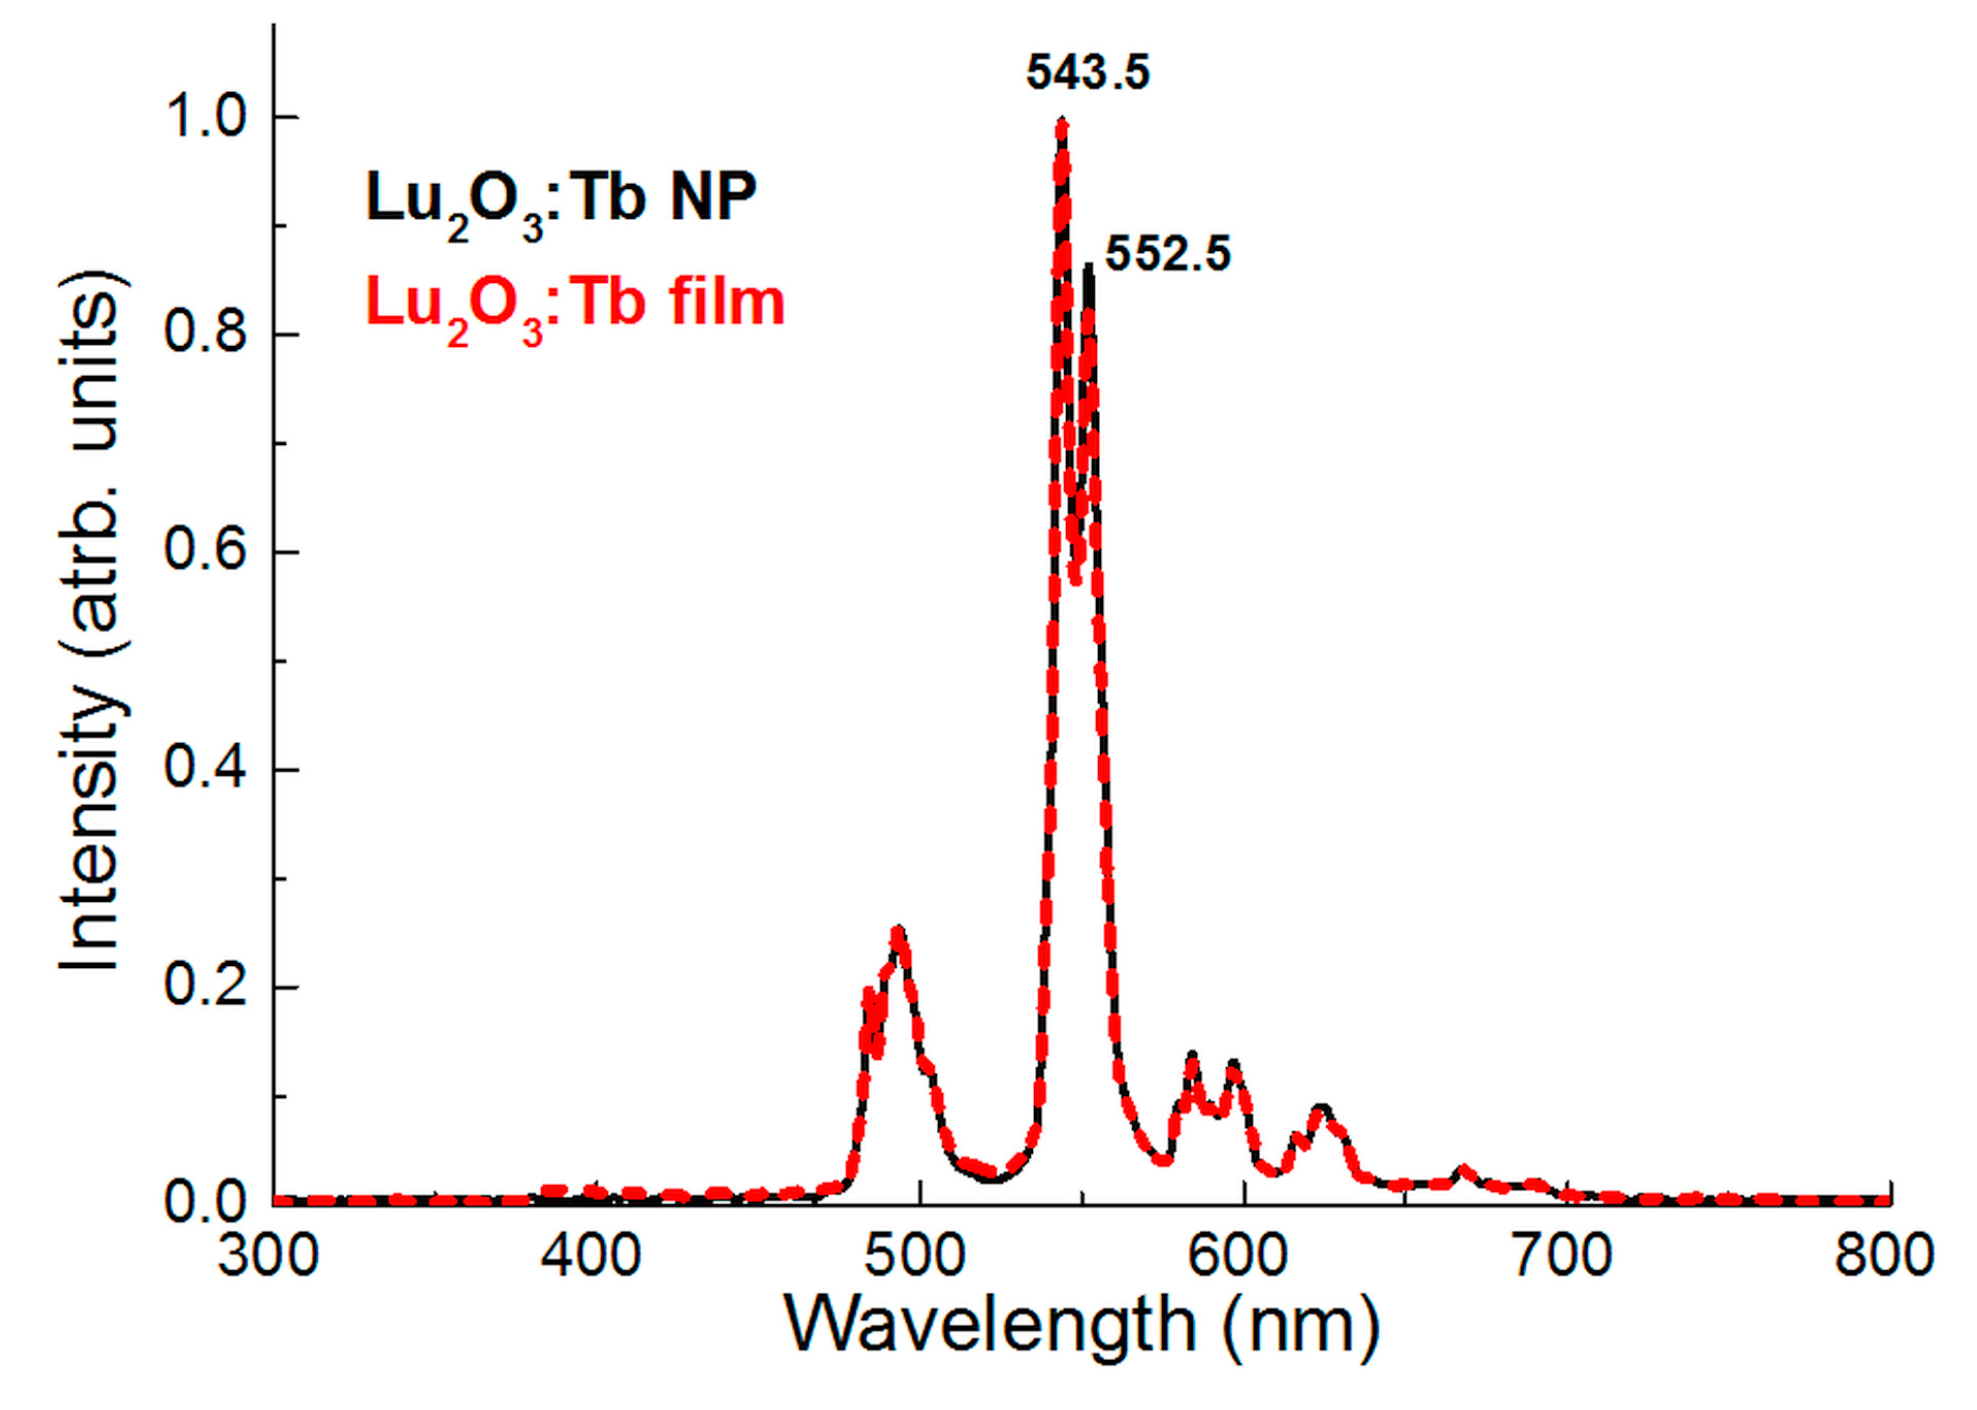
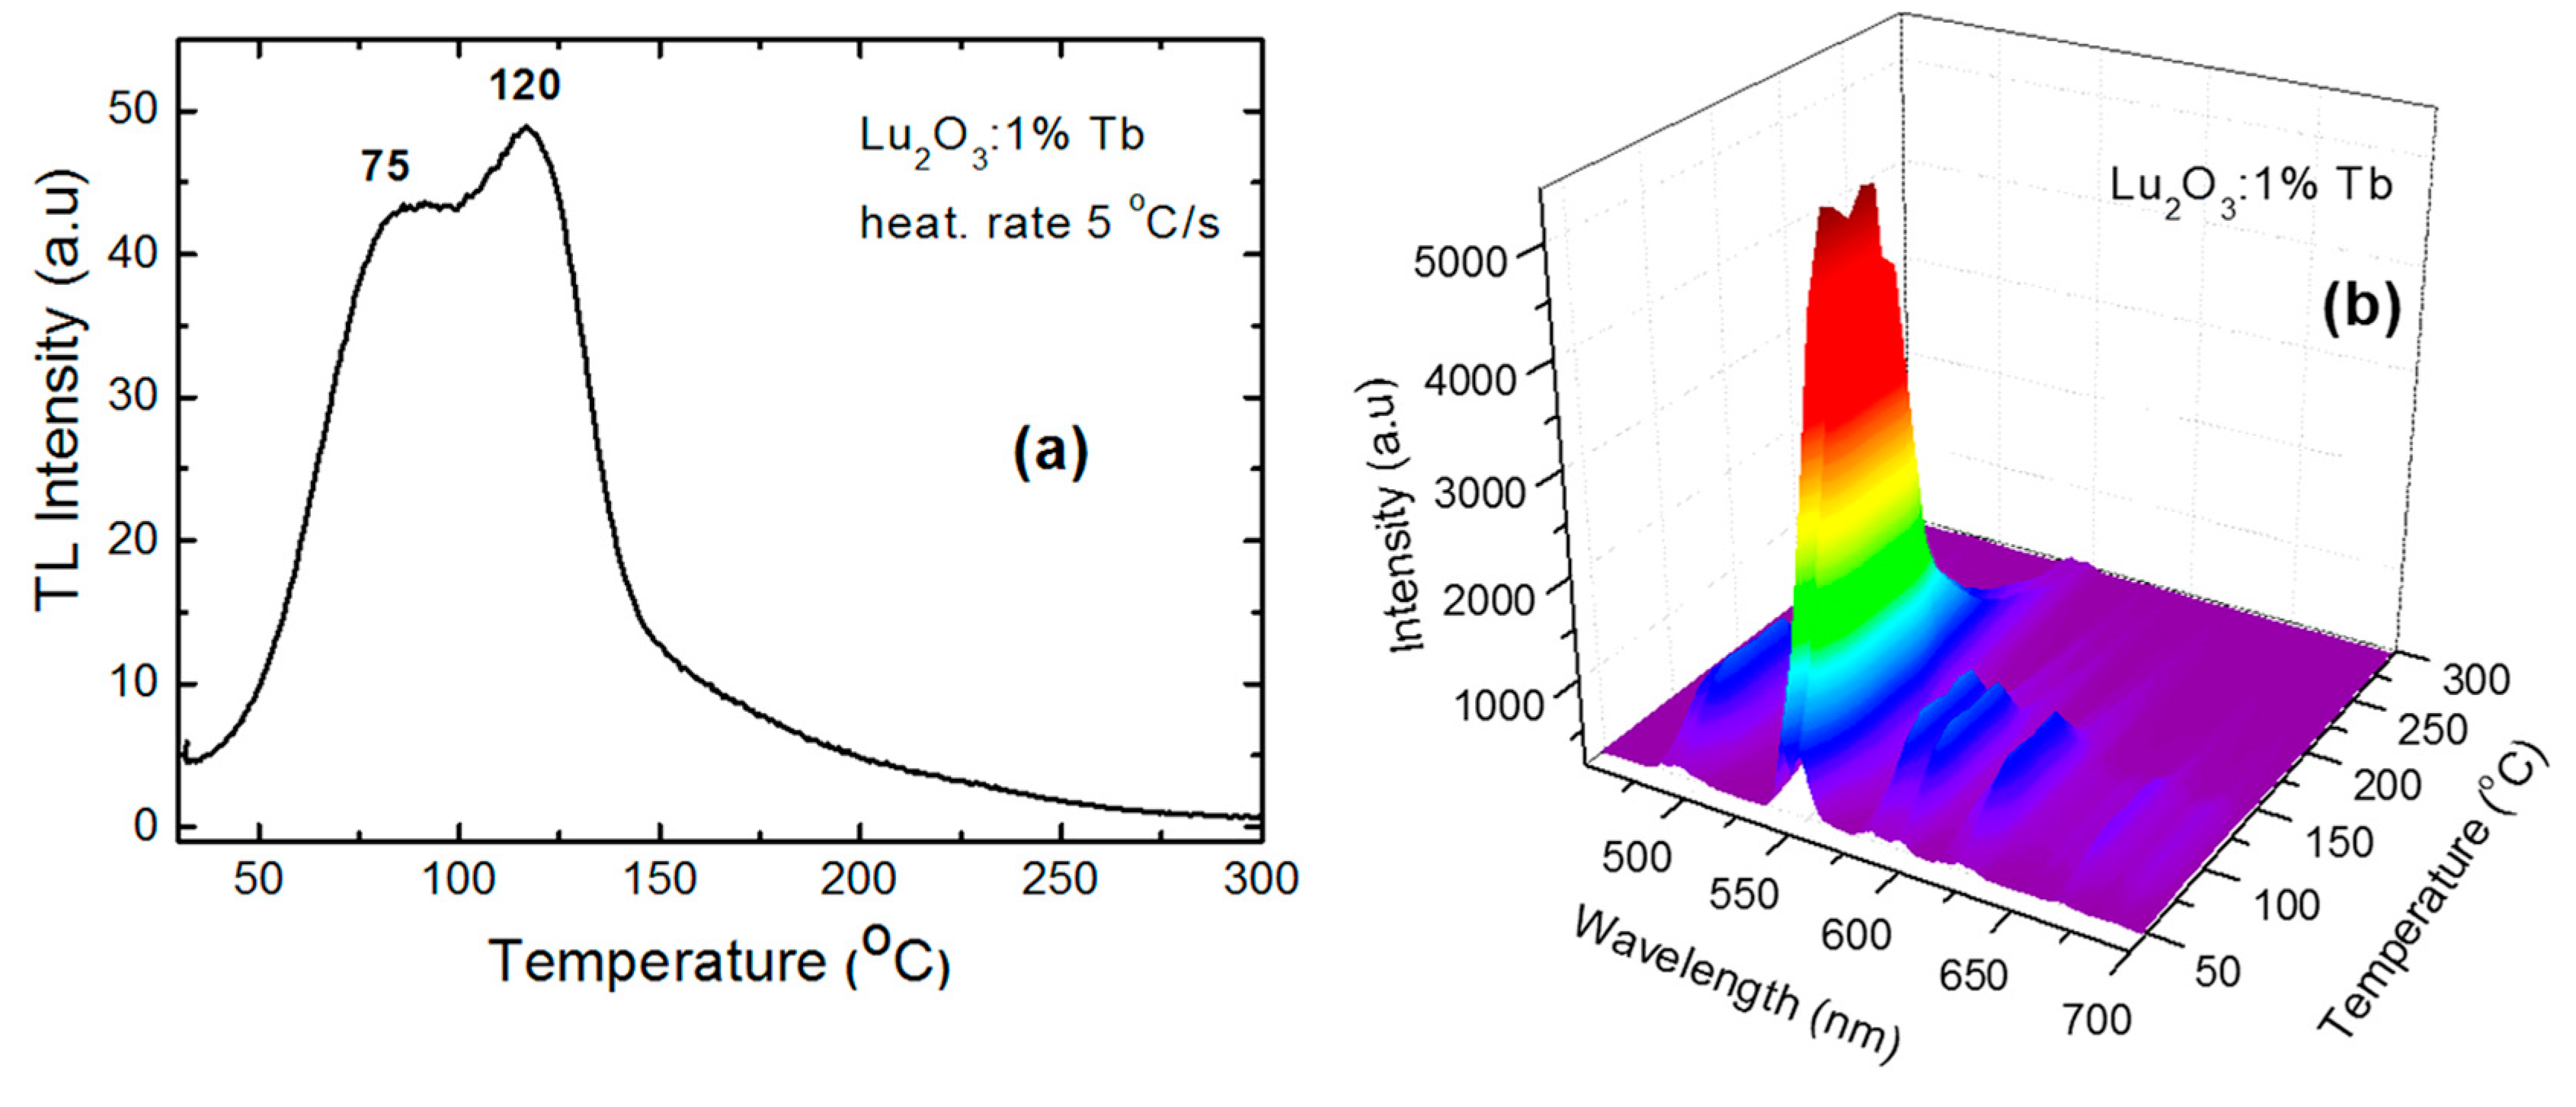
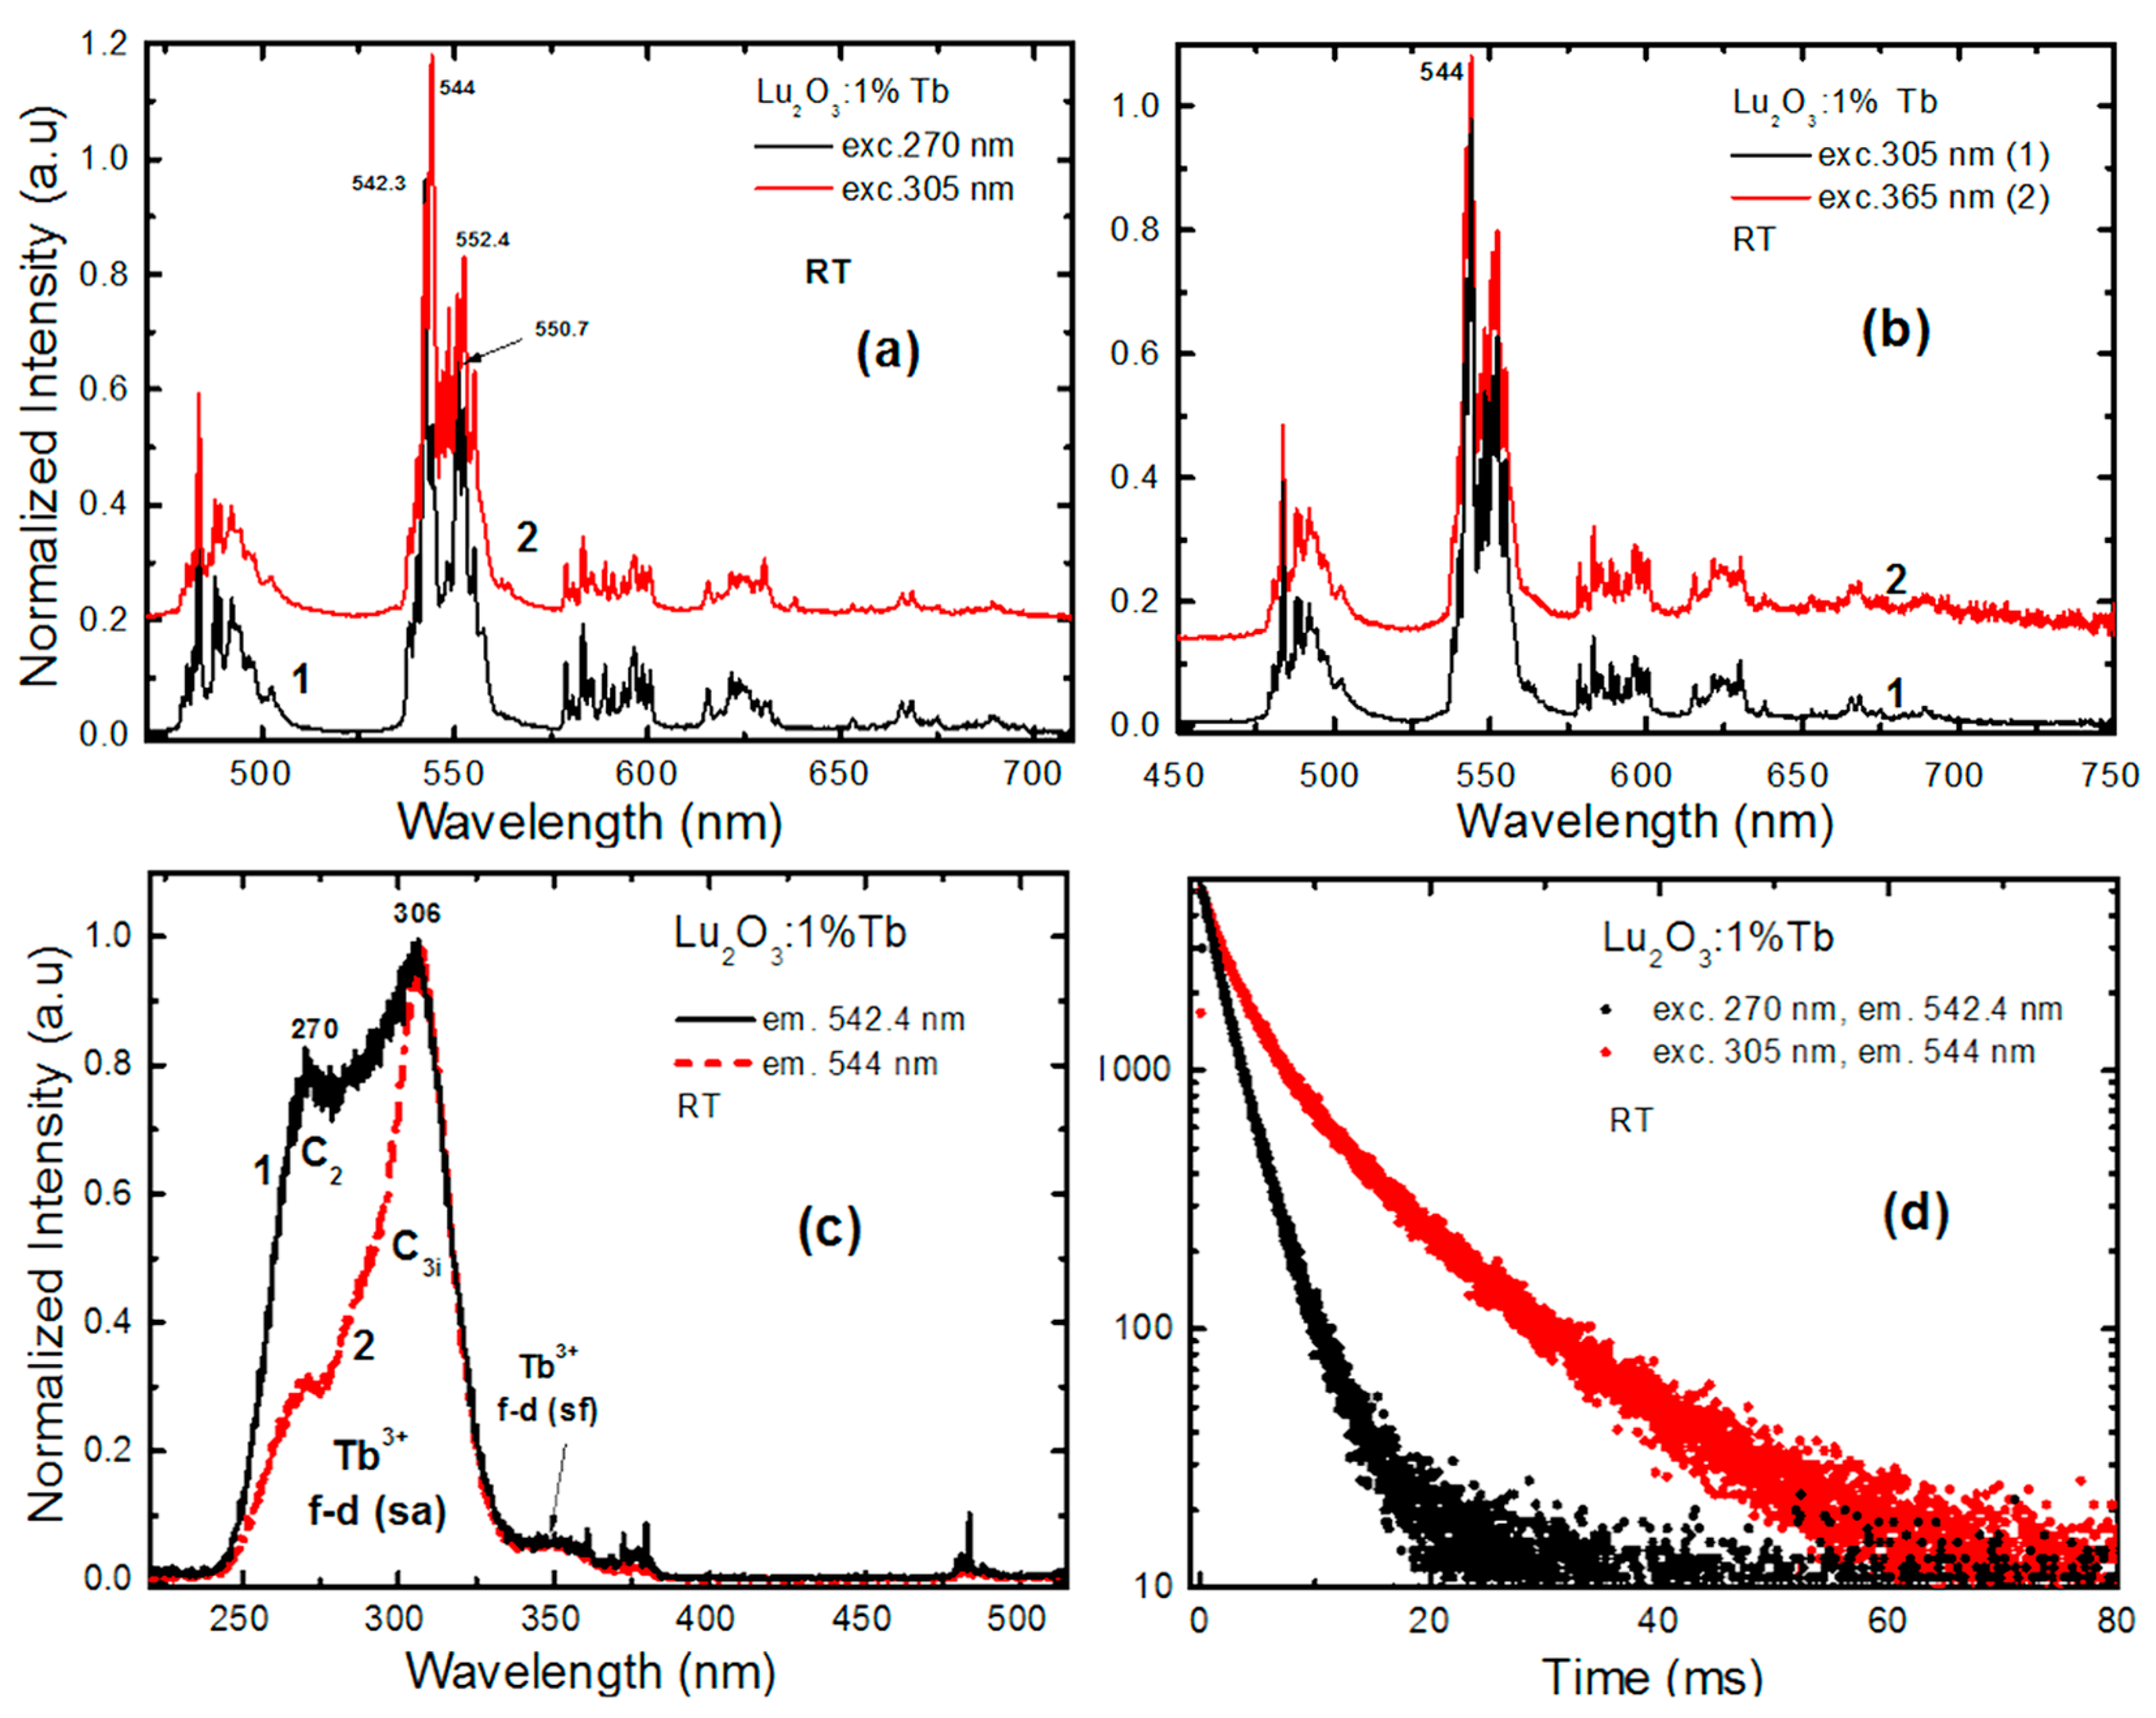
4.2. Lu2O3:Tb NPs and films

Cathodoluminescence: The CL spectra of Lu2O3:Tb NPs and films were very similar (Figure 8). The most intensive emission peaks were observed at 543.5 and 552.2 nm, which upon site selective PL spectroscopy could be attributed to the 5D47Fj transitions of Tb3+ ions in the Lu2O3 host (Figure 9). Taking into account the spectral position of these bands in the PL spectra (Figure 9), the contribution of Tb3+ luminescence in C3i centers may appear significant compared to C2 centers in the CL spectra of Lu2O3:Tb NPs and film. However, at present this is merely a supposition needing precise verification. Determination of a dominant type of emission center and estimation of the relative quantity of Tb3+(C2) and Tb3+(C3i) centers requires CL spectra recorded with a resolution much higher than 1 nm. This observation will be further verified and investigated in other crystalline forms of Lu2O3:Tb samples.
Photoluminescence: Contrary to the CL spectra, emissions from the two sites were clearly observed in the PL spectra of Lu2O3:Tb NP. Namely, the PL spectra of Tb3+ ions in the C2 and C3i positions possessed the main peaks at 542.4 and 544.0 nm, respectively (Figure 9a,b). Their excitation spectra also showed some differences, proving the presence of the two mentioned Tb3+ sites (Figure 9c). Namely, the main excitation 4f→5d bands peaked at 270 nm for the C2 site and at 306 nm for the C3i site of Tb3+ in the Lu2O3 host. A low-intensity excitation band around 365 nm was also observed in the PL excitation spectra and was proven to result from the spin-forbidden (sf) 4f→5d transitions of Tb3+ ions both in C3i sites (Figure 9c). Therefore, excitation at 305 nm and 365 nm results in very similar PL spectra of Lu2O3:Tb NPs due to transitions within the Tb3+ (C3i) (Figure 9a,b).
As expected, the decay kinetics of Tb3+ luminescence deviate from the exponential course, especially for the C3i site. The latter was much longer than that of the C2 sites (Figure 9d). For this reason, for decay curve characterization we have used the two decay times of τ1/e = 2.17 ms and τ1/20 = 3.96 ms for Tb in C2 and τ1/e = 7.32 ms and τ1/20 = 19.36 ms for Tb in the C3i site of the Lu2O3 host. As usual, there was a longer emission of ions in the site with inversion symmetry.
Thermally stimulated luminescence: An easily recordable but not very intense afterglow was observed in Lu2O3:Tb NPs at RT (Figure 10). The TSL glow curve was composed of two superimposed peaks with maxima around 75 °C and 120 °C. The TL emission spectrum was exclusively generated by Tb3+ transitions. Due to the fact that Tb3+ ions typically serve as hole traps, and because it was Tb3+ which finally produced the TSL photons, the observed TSL peaks in Lu2O3:Tb NPs had to correspond to intrinsic electron trapping centers. These may result from oxygen vacancies. Similarly positioned TL peaks were reported for Lu2O3:Tb, Ca ceramics sintered at 1700 °C in a reducing atmosphere, where the oxygen vacancies were responsible for a very intense TL [25,26].
Radioluminescence: The temperature dependence of the RL spectra of Lu2O3:Tb NPs was measured up to 500 °C (Figure 11). As can be seen from this figure, the Tb3+ luminescence disappeared at about 400 °C. This resulted from a thermal quenching which was reported for Lu2O3:Tb sintered ceramics to start right at room temperature [27]. Note that in this experiment, the dependence of RL intensity on temperature was to some extent distorted by the appearance of TL photons which contributed quite significantly in the range of ~50–150 K (see Figure 10a).

5. Conclusions

The Lu2O3:Eu and Lu2O3:Tb NPs were fabricated by means of hydrothermal processing. From the respective NPs the Lu2O3:Eu and Lu2O3:Tb thin films (from 100 up to 300 nm thick) were prepared using a spin-coating method. Despite undergoing essentially the same method of preparation, different morphology of Lu2O3:Eu and Lu2O3:Tb NPs was observed: ball-like particles were formed in the case of Lu2O3:Eu and dendrite-like structures in the case of Lu2O3:Tb. The morphological differences of powders resulted in differences of the morphology and structural quality of the respective films. Accordingly, the Lu2O3:Tb films possessed a more uniform surface than Lu2O3:Eu counterparts.
It was found that the CL and PL emission spectra as well as PL decay kinetic of Lu2O3:Eu NP and films showed the luminescence of Eu3+ ions almost exclusively from the C2 site of Lu2O3 host with the most intensive peak at 611.6 nm and the decay time of about 1.5 ms, about 50% longer than in coarse grained ceramics.
Contrary to Lu2O3:Eu, the PL emission and excitation spectra as well as PL decay kinetic of Lu2O3:Tb NPs and films at 300 K showed two types of Tb3+ luminescence centers in the C2 and C3i sites of the Lu2O3 host with the main emission peaks at 542.4 and 544.0 nm and corresponding maxima of excitation bands located at 270 and 305 nm due to the 4f→5d transition. The luminescence decay traces of Tb3+ ions in C2 and C3i sites were non-exponential, especially for Tb3+ in the C3i position, and the decay times of the Tb3+(C2) and Tb3+(C3i) centers luminescence were equal to t1/e = 2.17 and t1/20 = 3.96 ms and t1/20 = 7.32 and t1/e = 19.36 ms, respectively.
The TL peaks at 110 °C and 170 °C and at 75 °C and 120 °C were observed in Lu2O3:Eu and Lu2O3:Tb NPs, respectively. They corresponded to the formation of the hole and electron trapping centers in the Lu2O3 host, respectively. Significantly different temperature dependences of X-ray excited luminescence in Lu2O3:Eu and Lu2O3:Tb NPs was also evident. Namely, the start of the temperature quenching of Eu3+ and Tb3+ luminescence in Lu2O3:Eu and Lu2O3:Tb NPs was observed at 90°C and 320°C, respectively.

Author Contributions

P.P. performed preparation of NP film, T.Z. performed the measurement of their absorption spectra, K.P. performed the measurements of CL spectra of NP and film samples as well as the investigation of the morphology of films, Y.Z. analyzed the whole experimental materials and contributed in writing Introduction, NP film growth part, Experimental part and Conclusions of the paper. J.Z. synthesized nanocrystalline powders of Lu2O3:Eu, measured their XRD diffractograms, SEM images and performed PL, RL and TL experiments on them. P.B. synthesized nanocrystalline powders of Lu2O3:Tb, measured their XRD diffractograms and performed PL, RL and TL experiments on them. E.Z. contributed to experimental data analysis and writing the paper.

Acknowledgments

The work was performed in the frame of Polish National Science Centre (NCN) grants No 2016/21/B/ST8/03200 (Y.Z.) and No 2014/13/B/ST5/01535 (E.Z.).

Conflicts of Interest

The authors declare no conflict of interest.

References

  1. Lempicki, A.; Brecher, C.; Szupryczynski, P.; Lingertat, H.; Nagarkar, V.; Tipnis, S.; Miller, S. A new lutetia-based ceramic scintillator for X-ray imaging. Nucl. Instrum. Methods Phys. Res. Sect. A Accel. Spectrometersdetectors Assoc. Equip. 2002, 488, 579–590. [Google Scholar] [CrossRef]
  2. Zych, E. Concentration dependence of energy transfer between Eu3+ ions occupying two symmetry sites in Lu2O3. J. Phys. Condens. Matter 2002, 14, 5637. [Google Scholar] [CrossRef]
  3. Zeler, J.; Jerzykiewicz, L.B.; Zych, E. Flux-aided synthesis of Lu2O3 and Lu2O3: Eu—single crystal structure, morphology control and radioluminescence efficiency. Materials 2014, 7, 7059–7072. [Google Scholar] [CrossRef]
  4. Sengupta, D.; Miller, S.; Marton, Z.; Chin, F.; Nagarkar, V.; Pratx, G. Bright Lu2O3: Eu thin-film scintillators for high-resolution radioluminescence microscopy. Adv. Healthc. Mater. 2015, 4, 2064–2070. [Google Scholar] [CrossRef] [PubMed]
  5. Riva, F.; Martin, T.; Douissard, P.; Dujardin, C. Single crystal lutetium oxide thin film scintillators for X-ray imaging. J. Instrum. 2016, 11, C10010. [Google Scholar] [CrossRef]
  6. Zorenko, T.; Gorbenko, V.; Safronova, N.; Matveevskaya, N.; Yavetskiy, R.; Babayevska, N.; Zorenko, Y. Comparative study of the luminescent properties of oxide compounds under synchrotron radiation excitation: Lu2O3: Eu nanopowders, ceramics and films. J. Lumin. 2018, 199, 461–464. [Google Scholar] [CrossRef]
  7. Bellocchi, G.; Franzò, G.; Iacona, F.; Boninelli, S.; Miritello, M.; Cesca, T.; Priolo, F. Eu3+ reduction and efficient light emission in Eu2O3 films deposited on Si substrates. Opt. Express 2012, 20, 5501–5507. [Google Scholar] [CrossRef] [PubMed]
  8. Burmester, P.; Ishii, T.; Huber, G.; Kurfiss, M.; Schilling, M. Characterization of crystalline europium doped α-Y2O3 PLD-films grown on α-Al2O3. Mater. Sci. Eng. B 2003, 105, 25–29. [Google Scholar] [CrossRef]
  9. Gün, T.; Kahn, A.; İleri, B.; Petermann, K.; Huber, G. Two-dimensional growth of lattice matched Nd-doped (Gd, Lu)2O3 films on Y2O3 by pulsed laser deposition. Appl. Phys. Lett. 2008, 93, 053108. [Google Scholar] [CrossRef]
  10. Babaevskaya, N.; Kryzhanovskaya, A.; Matveevskaya, N.; Mateichenko, P.; Yavetskii, R.; Tolmachev, A.; Tret’yak, S. Composite phosphor films based on spherical Lu2O3: Eu3+ nanoparticles. Tech. Phys. Lett. 2011, 37, 174–177. [Google Scholar] [CrossRef]
  11. Babayevskaya, N.; Bezkrovnyi, A.; Mateychenko, P.; Vovk, O.; Yavetskiy, R. Sol-gel processing of transparent Lu2O3: Eu3+ phosphor films. Funct. Mater. 2010, 17, 537–542. [Google Scholar]
  12. Popielarski, P.; Paprocki, K.; Bala, W.; Banaszak-Piechowska, A.; Walczyk, K.; Fabisiak, K.; Szybowicz, M. Raman and impedance spectroscopy of blend polycarbonate and zinc oxide layers grown by sol-gel method. In Proceedings of the Solid State Phenomena, Lviv, Ukraine, 3–7 September 2012; pp. 22–26. [Google Scholar]
  13. Bala, W.; Zorenko, Y.; Savchyn, V.; Voznyak, T.; Paprocki, K.; Popielarski, P.; Szybowicz, M. Optical and electrical properties of ZnO thin films grown by sol-gel method. In Proceedings of the Solid State Phenomena, Lviv, Ukraine, 3–7 September 2012; pp. 14–21. [Google Scholar]
  14. Frackowiak, S.; Zych, E.; Kozlowski, M.; Kepinski, L. Modifying the luminescence characteristics of Lu2O3: Eu large nanocrystals with polycarbonate host. Polym. Compos. 2016, 37, 1330–1334. [Google Scholar] [CrossRef]
  15. Meltzer, R.; Feofilov, S.; Tissue, B.; Yuan, H. Dependence of fluorescence lifetimes of Y2O3: Eu3+ nanoparticles on the surrounding medium. Phys. Rev. B 1999, 60, R14012. [Google Scholar] [CrossRef]
  16. Meltzer, R.; Yen, W.; Zheng, H.; Feofilov, S.; Dejneka, M.; Tissue, B.; Yuan, H. Interaction of rare earth ions doped in nanocrystals embedded in amorphous matrices with two-level systems of the matrix. J. Lumin. 2001, 94, 221–224. [Google Scholar] [CrossRef]
  17. Vetrone, F.; Boyer, J.-C.; Capobianco, J.A.; Speghini, A.; Bettinelli, M. A spectroscopic investigation of trivalent lanthanide doped Y2O3 nanocrystals. Nanotechnology 2003, 15, 75. [Google Scholar] [CrossRef]
  18. Hreniak, D.; Gluchowski, P.; Strek, W.; Bettinelli, M.; Kozlowska, A.; Kozlowski, M. Preparation and upconversion properties of Er3+, Yb3+: Y2Si2O7 nanocrystallites embedded in PVA polymer nanocomposites. Mater. Sci. Wroc. 2006, 24, 405. [Google Scholar]
  19. Trojan-Piegza, J.; Zych, E.; Hreniak, D.; Stręk, W.; Kępiński, L. Structural and spectroscopic characterization of Lu2O3: Eu nanocrystalline spherical particles. J. Phys. Condens. Matter 2004, 16, 6983. [Google Scholar] [CrossRef]
  20. de Mello Donegá, C.; Meijerink, A.; Blasse, G. Saturation effects in the excitation spectra of rare-earth ions. J. Lumin. 1994, 62, 189–201. [Google Scholar] [CrossRef]
  21. Dorenbos, P. Relation between Eu2+ and Ce3+ f↔ d-transition energies in inorganic compounds. J. Phys. Condens. Matter 2003, 15, 4797. [Google Scholar] [CrossRef]
  22. Dorenbos, P. A review on how lanthanide impurity levels change with chemistry and structure of inorganic compounds. ECS J. Solid State Sci. Technol. 2013, 2, R3001–R3011. [Google Scholar] [CrossRef]
  23. Dorenbos, P. Charge transfer bands in optical materials and related defect level location. Opt. Mater. 2017, 69, 8–22. [Google Scholar] [CrossRef]
  24. Trojan-Piegza, J.; Zych, E. Afterglow luminescence of Lu2O3: Eu ceramics synthesized at different atmospheres. J. Phys. Chem. C 2010, 114, 4215–4220. [Google Scholar] [CrossRef]
  25. Trojan-Piegza, J.; Niittykoski, J.; Hölsä, J.; Zych, E. Thermoluminescence and kinetics of persistent luminescence of vacuum-sintered Tb3+-doped and Tb3+, Ca2+-codoped Lu2O3 materials. Chem. Mater. 2008, 20, 2252–2261. [Google Scholar] [CrossRef]
  26. Trojan-Piegza, J.; Zych, E.; Hölsä, J.; Niittykoski, J. Spectroscopic properties of persistent luminescence phosphors: Lu2O3: Tb3+, M2+ (M = Ca, Sr, Ba). J. Phys. Chem. C 2009, 113, 20493–20498. [Google Scholar] [CrossRef]
  27. Kulesza, D.; Bolek, P.; Bos, A.J.; Zych, E. Lu2O3-based storage phosphors. An (in) harmonious family. Coord. Chem. Rev. 2016, 325, 29–40. [Google Scholar] [CrossRef]
Figure 1. XRD patterns of the Lu2O3:Eu and Lu2O3:Tb powders and the simulated one for cubic Lu2O3 [3].
Crystals 09 00148 g001
Figure 2. Morphology of Lu2O3:Eu (a) and Lu2O3:Tb (b) NPs as well as Lu2O3:Eu (c) and Lu2O3:Tb (d) films with thickness of about 300 nm.
Crystals 09 00148 g002
Figure 3. Absorption spectra of Lu2O3:Eu (a) and Lu2O3:Tb (b) films with thicknesses of about of 100 nm (1), 200 nm (2), and 300 nm (3). Due to the close shape of the absorption spectra of Lu2O3:Eu (a) and Lu2O3:Tb (b) films, the bands peaked at 360–364 nm, 290–294 nm, and 234–235 nm ranges which rather corresponded to the absorption of the ZnO based binder and was not related to the absorption of the NP films due to their very low thickness in the 100–300 nm range.
Crystals 09 00148 g003
Figure 4. Cathodoluminescence (CL) spectra of Lu2O3:Eu nanopowder (NP) (1) and film (2) samples at room temperature (RT).
Crystals 09 00148 g004
Figure 5. RT photoluminescence (PL) emission (1a, b) and excitation (2a) spectra (a) of Eu3+ luminescence as well as PL decay kinetic (c) of Lu2O3:Eu NP. (b) More detailed fragment of the excitation spectrum of Eu3+ luminescence in the 580–584 nm range related to the 5D07F0,1 transitions.
Crystals 09 00148 g005
Figure 6. Thermally stimulated luminescence (TSL) glow curve (a) and TSL emission spectra (b) of Lu2O3:Eu NP after irradiation by X-ray at 300 K. The two spikes at ~650 nm and 730 nm around 260–270 °C in (b) are artifacts due to an electronic noise of CCD.
Crystals 09 00148 g006
Figure 7. Temperature dependence of X-ray excited radioluminescence (RL) in Lu2O3:Eu NP in the 30–500 K range.
Crystals 09 00148 g007
Figure 8. RT CL spectra of Lu2O3:Tb NP and film.
Crystals 09 00148 g008
Figure 9. PL emission (a, b) and excitation spectra (c) as well as the PL decay kinetic (d) of Tb3+ luminescence in Lu2O3:Tb NP at 300 K.
Crystals 09 00148 g009
Figure 10. Glow curve (a) and TSL spectra (b) of Lu2O3:Tb NPs after irradiation with X-rays at 300 K.
Crystals 09 00148 g010
Figure 11. Temperature dependence of RL spectra of Lu2O3:Tb NP.
Crystals 09 00148 g011

