Article

Determination of Crystal Growth Geometry Factors and Nucleation Site Densities of Electrodeposited Ferromagnetic Cobalt Nanowire Arrays

1
Graduate School of Engineering, Nagasaki University, Bunkyo-machi 1-14, Nagasaki 852-8521, Japan
2
Faculty of Engineering, Nagasaki University, Bunkyo-machi 1-14, Nagasaki 852-8521, Japan
*
Author to whom correspondence should be addressed.
Crystals 2019, 9(3), 142; https://doi.org/10.3390/cryst9030142
Submission received: 20 February 2019 / Revised: 6 March 2019 / Accepted: 6 March 2019 / Published: 10 March 2019
(This article belongs to the Special Issue Nanowires and Quantum Dots for IoT Applications)

Abstract

:
The time-dependence of electrochemical reduction current, which was observed during the one-dimensional (1-D) crystal growth of ferromagnetic cobalt nanowire arrays, was analyzed by Johnson–Mehl–Avrami–Kolmogorov (JMAK) theory. Textured hcp-Co nanowire arrays were synthesized by potentio-static electrochemical reduction of Co2+ ions in anodized aluminum oxide (AAO) nanochannel films. Crystal growth geometry factor n in the JMAK equation was determined to be ca. 1. Hence, the electrochemical crystal growth process of a numerical nanowires array can be explained by 1-D geometry. The crystal nucleation frequency factor, k in JMAK equation was estimated to be the range between 10−4 and 10−3. Our experimental results revealed that the crystal nucleation site density Nd increased up to 2.7 × 10⁻⁸ nm−3 when increasing the overpotential for cobalt electrodeposition by shifting the cathode potential down to −0.85 V vs. Ag/AgCl. The (002) crystal orientation of hcp-Co nanowire arrays was, remarkably, observed by decreasing Nd. Spontaneous magnetization behavior was observed in the axial direction of nanowires. By decreasing the overpotential for cobalt electrodeposition, the coercivity of the nanocomposite film increased and reached up to 1.88 kOe, with a squareness of ca. 0.9 at room temperature.

1. Introduction

It is well known that when the rare-earth elements (e.g., samarium, neodymium and dysprosium) are added to ferromagnetic metals (e.g., iron, cobalt and nickel), the large magneto-crystalline anisotropy effect occurs and the coercivity of the hard-magnetic material can be enhanced. However, the rare-earth elements are very expensive and there is concern about their supply uncertainty [1]. Recently, ferromagnetic metal nanowires have attracted attention as a substitute for rare-earth compounds because they have large shape magnetic anisotropy along their long axis [2]. Of the ferromagnetic metals, cobalt has relatively high saturation magnetization. In addition, cobalt alloys have a high Curie temperature and excellent corrosion resistance [3]. Thus, cobalt alloy nanowires can be used for the magnetic application utilized under high-temperature conditions and can, thus, have a range of potential applications such as magnetic data storage media, anisotropic magnetoresistance sensors and microwave-absorbing materials with heat-resistance performance. For example, Chen et al. reported that cobalt nanowires with transverse magneto-crystalline anisotropy were fabricated and the microwave absorbing properties were investigated in the GHz frequency range (0.5–18 GHz) [4].
Several methods have been created to synthesize ferromagnetic metal nanowires such as the template-assisted method [2] and solvothermal synthesis [5]. Gandha et al. reported that they could synthesize the Co nanowires with a diameter of ca. 15 nm by using a solvothermal chemical process. In their report, the coercivity of 10.6 kOe was achieved at room temperature [5]. However, the average length of Co nanowires was only ca. 200 nm. Hence, there are still several issues to overcome in addressing the gap, which is required for the permanent magnetic applications with anisotropic performance. In the template-assisted method, ferromagnetic metal is electrodeposited into the template with numerous nanochannels with large aspect ratio (cylinder-like nanopores). This method is a very attractive approach to synthesizing ferromagnetic metal nanowires because it can be carried out using simple experimental devices and its cost is low [6]. Typical template materials include ion track-etched polycarbonate films [7,8,9,10] and anodic aluminum oxide (AAO) films [11]. In particular, pore diameter and thickness of AAO templates can be adjusted by changing experimental conditions such as anodic oxidation voltage. As a result, the diameter (d), length (L) and aspect ratio (L/d) of nanowires, which are electrodeposited into nanochannels, can be adjusted. Therefore, many researchers have synthesized ferromagnetic metal nanowire arrays by using the AAO templates [6,12,13,14,15,16]. In addition, hexagonal close-packed cobalt (hcp-Co) has large magneto-crystalline anisotropy along the c-axis [17,18]. Hence, the magnetic anisotropy of the cobalt nanowire arrays could be enhanced, when the long axis of nanowires corresponds to the c-axis by adjusting the cobalt crystal orientation.
Research to date has focused on the crystal structure and the magnetic properties of ferromagnetic cobalt nanowire arrays, which were synthesized by electrodeposition into the nanochannel templates [6,12,13,14]. However, there has been little research concerning the crystal growth geometry of nanowire arrays (e.g., growth rate, geometry factor and crystal nucleation site density). In addition, it is estimated that the growth process of the cobalt nanowires has an effect on the crystal structure and magnetic properties of the ferromagnetic cobalt nanowire arrays.
In this research, ferromagnetic cobalt nanowire arrays were synthesized by potentio-static electrodeposition from a chloride bath into the AAO nanochannel films, which have numerous nanopores with a large-aspect-ratio structure (d = ca. 25 nm, L = ca. 45 µm and L/d = 1800). The time-dependence of the electrochemical reduction current was measured during the electrodeposition of the cobalt nanowires. Subsequently, the time-dependence of the electrochemical reduction current was analyzed based on Johnson–Mehl–Avrami–Kolmogorov (JMAK) theory [19,20,21,22,23]. The electrochemical crystal growth process of the ferromagnetic cobalt nanowires was investigated by determining the kinetic parameters, which were obtained as the result of JMAK analysis. Furthermore, the effects of the cathode potential, the growth rate and the nucleation site density on the crystal structure and magnetic properties of the ferromagnetic cobalt nanowire arrays were investigated.

2. Materials and Methods

At first, a cross-section of an aluminum rod (diameter: 10 mm, Purity: 99%) was mechanically polished by using a water proof sandpaper. Next, the cross-section of the aluminum rod was electropolished in an ethanol solution containing perchloric acid by applying a constant voltage of 50 V for 120 s. The volume ratio between ethanol (99.5 wt.%) and perchloric acid (60 wt.%) was adjusted to 4:1 in the solution for electropolishing. Then, the polished cross-section of an aluminum rod was anodized in an aqueous solution containing 0.3 M sulfuric acid (2 °C) by applying a constant voltage of 20 V for 24 h. After the anodic oxidation, an AAO nanochannel layer was formed on the cross-section of the aluminum rod. Subsequently, the barrier layer (an interface between the cross-section of metallic aluminum rod and an anodized aluminum oxide layer) was anodically etched by applying a constant voltage of 35 V for 30 s in an ethanol solution containing perchloric acid. The volume ratio between ethanol (99.5 wt.%) and perchloric acid (60 wt.%) was adjusted to 1:1 in the solution for the anodic etching. As a result, the AAO nanochannel layer was exfoliated from the aluminum rod and the AAO nanochannel films were obtained. After that, a thin conductive gold layer was formed on one side of the AAO nanochannel films by using a sputter-deposition technique. For ferromagnetic cobalt electrodeposition into nanochannels, the AAO nanochannel films with thin conductive gold layer served as a cathode. Also, a gold wire was used as an anode, a silver/silver chloride electrode (Ag/AgCl) was used as a reference electrode. An aqueous solution containing 0.5 M cobalt chloride hexahydrate and 0.4 M boric acid was used as an electrolytic solution for the electrodeposition of cobalt. The solution temperature was kept at 60 °C during the electrodeposition. Cobalt nanowire arrays were synthesized by a potentio-static electrochemical reduction method inside the numerous nanochannels of AAO films. During the electrodeposition, the cathode potentials were fixed to −0.85 V, −0.80 V, −0.75 V, −0.70 V and −0.65 V vs. Ag/AgCl. In addition, the time-dependence of electrochemical reduction current was measured during the electrodeposition of cobalt nanowires. After growing nanowires, the aluminum oxide part was dissolved in an aqueous solution (ca. 25 °C) containing 5 M sodium hydroxide to obtain the template-free-standing cobalt nanowire arrays.
The structures of AAO nanochannel film and template-free-standing cobalt nanowire arrays were observed by using a scanning electron microscope (SEM, JSM-7500FA and JCM-5700, JEOL Ltd., Tokyo Japan). Also, the crystal orientation of cobalt nanowire arrays was investigated by using an X-ray diffractometer (XRD, Miniflex 600-DX, Rigaku Corp., Tokyo, Japan). Furthermore, the magnetic properties of cobalt nanowire arrays were evaluated by using a vibrating sample magnetometer (VSM, TM-VSM1014-CRO, Tamakawa Co., Sendai, Japan) at room temperature. While measuring the magnetic properties, an external magnetic field (−10 kOe ~ +10 kOe) was applied in the directions of perpendicular and in-plane to the AAO nanochannel films. The magnetic properties (coercivity and squareness) were obtained from the magnetic hysteresis loops with the scan rate of 0.2 kOe s−1.

3. Theoretical Simulation of Crystal Growth Process Based on Johnson–Mehl–Avrami–Kolmogorov (JMAK) Theory

The JMAK theory [19,20,21,22,23] has included several assumptions, such as:
(I) Crystal grains will continue to grow even after they collide with each other during the crystallization (Figure 1a–d);
(II) Nucleation can occur in all regions (the nucleation can occur regardless of whether phase transformation occurred in the region).
Based on these assumptions, the mechanism of the phase transformation during the crystallization was expressed as a function of time [24]. The JMAK equation is as follows:
X = 1 exp ( k t n ) ,
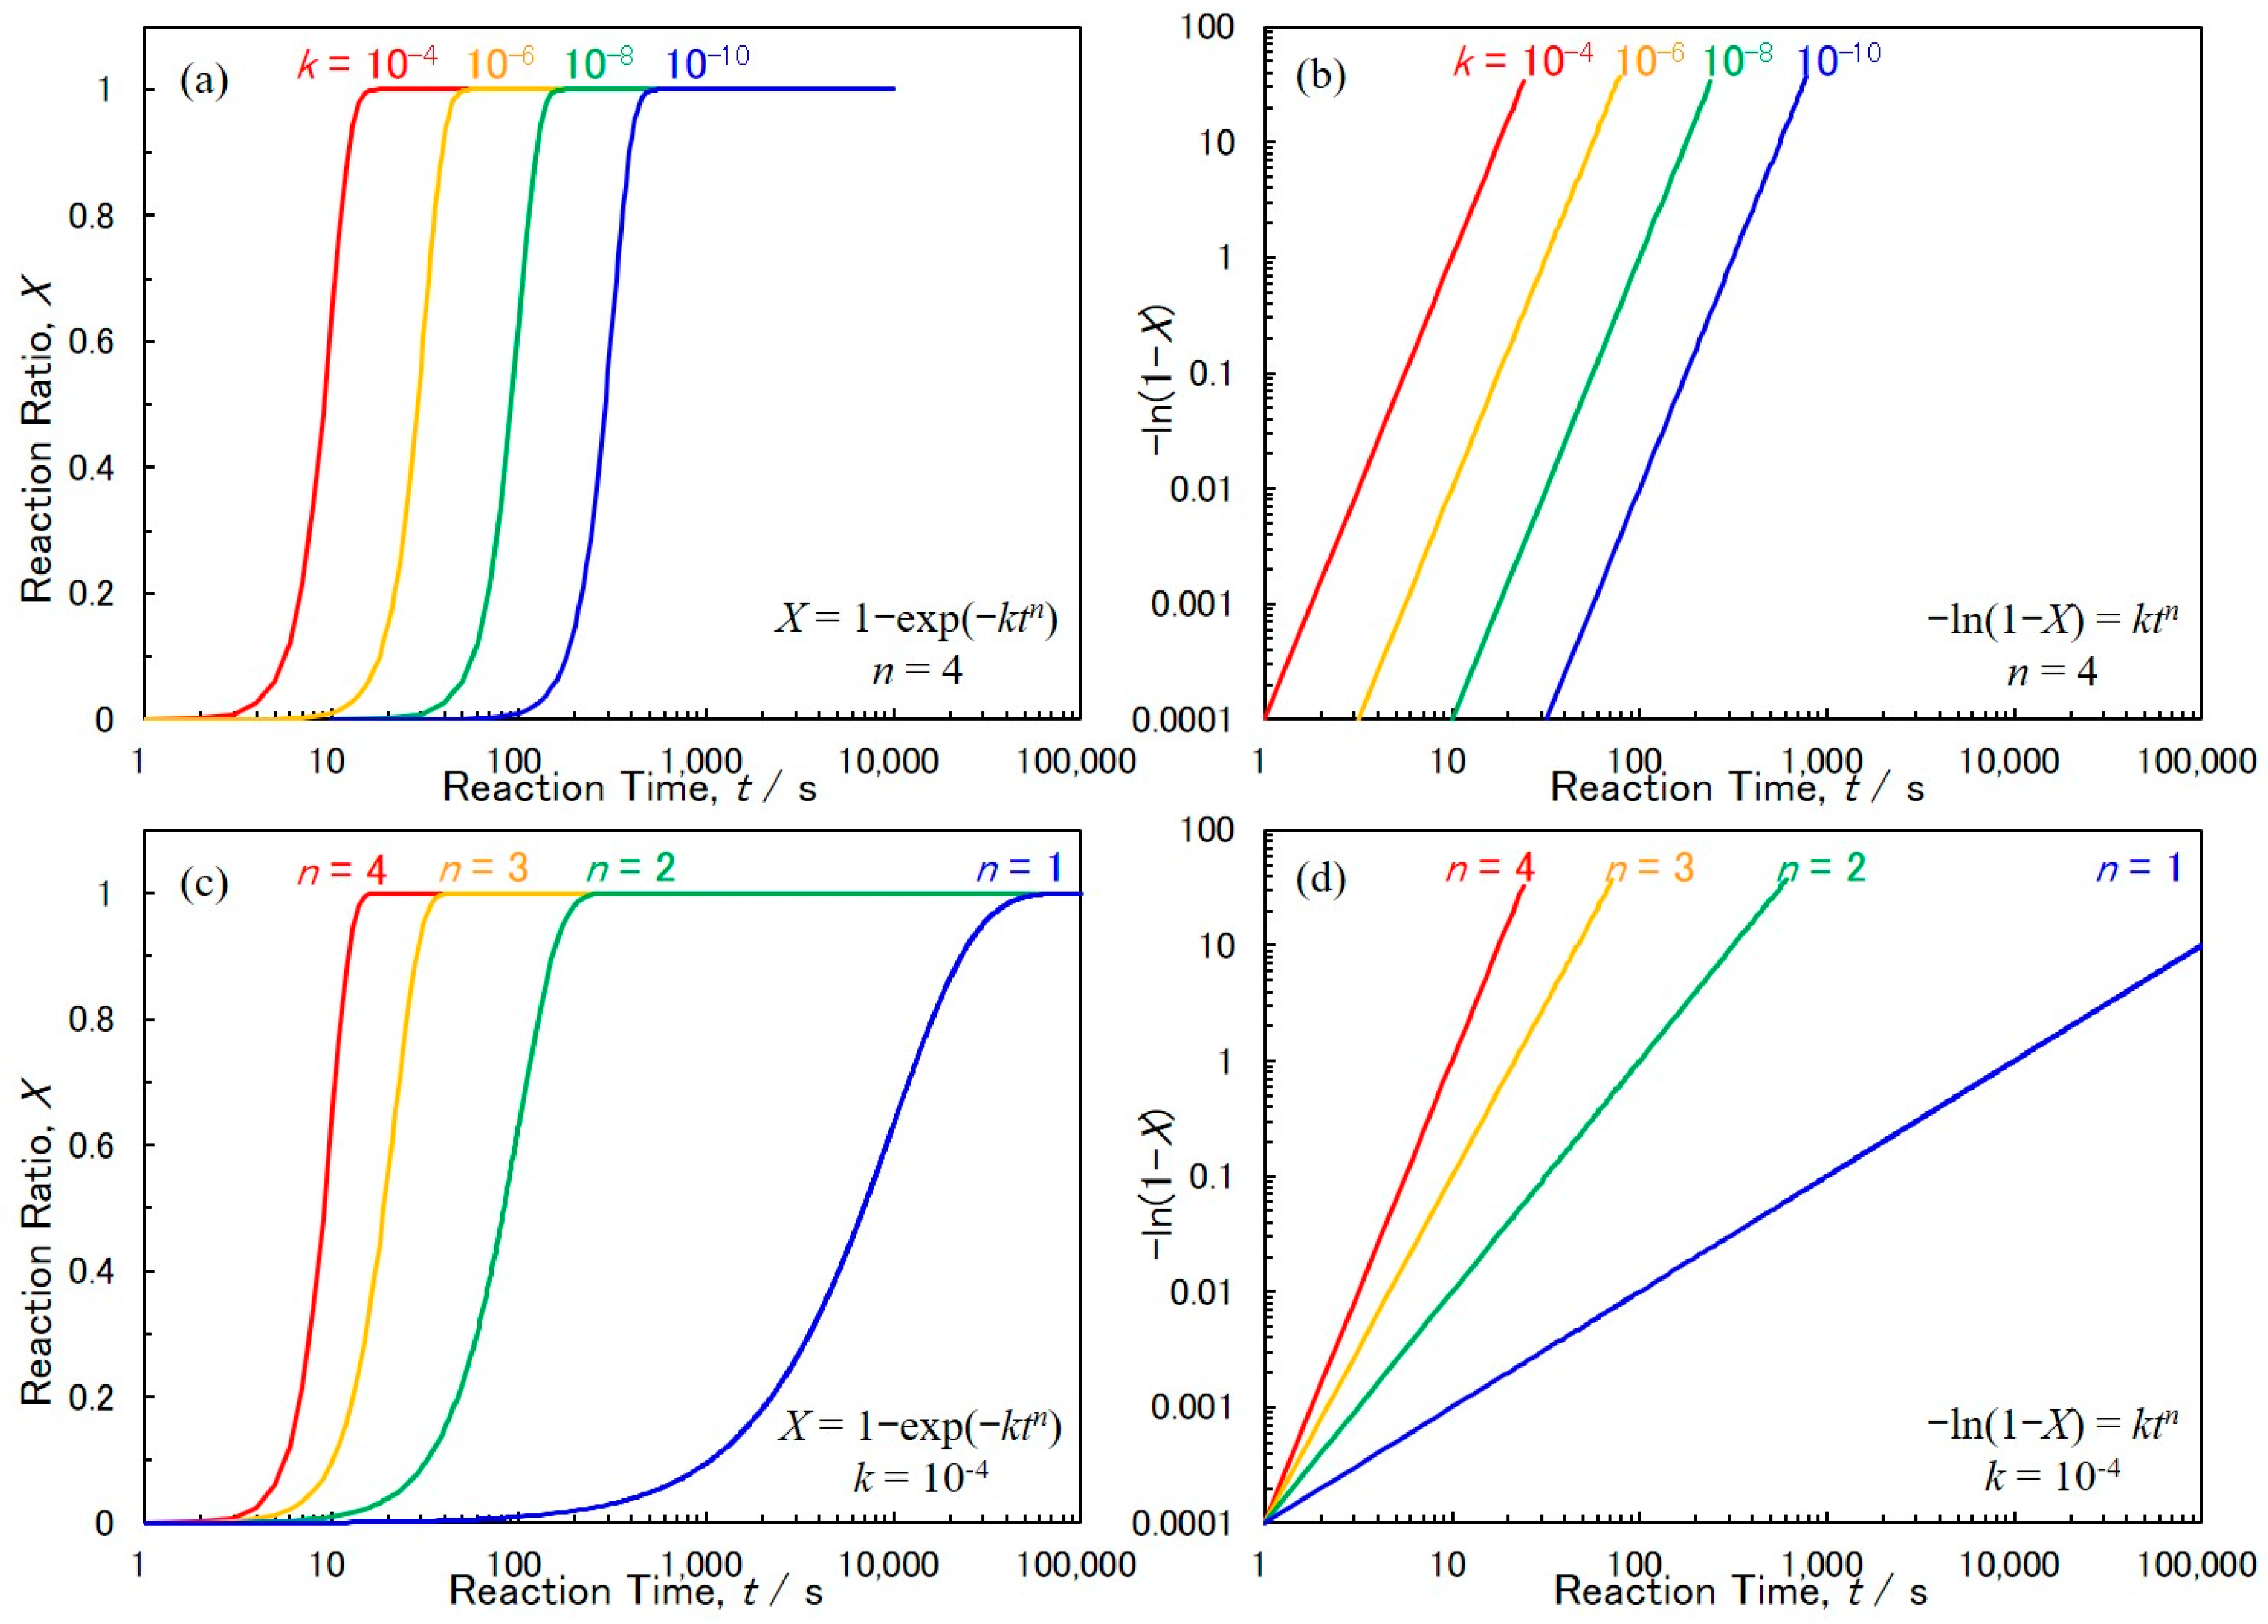
where X is the reaction ratio, t is the reaction time, n is the crystal growth geometry factor, and k is the crystal nucleation frequency factor. First, based on JMAK theory, the time-dependence of the reaction ratio was simulated. Figure 2a shows the time-dependence of the reaction ratio in the case of changing the parameter k (n = 4). Figure 2c shows the time-dependence of the reaction ratio in the case of changing the parameter n (k = 10−4). These figures show that the shape of time-dependence curve changes with the values of parameters n and k.
Equation (1) can be transformed to obtain Equation (2) as follows:
1 X = exp ( k t n ) , ln ( 1 X ) = k t n , ln [ ln ( 1 X ) ] = ln k + n ln t ,
Figure 2b shows the double logarithmic plot of −ln(1 − X) vs. t in the case of changing parameter k (n = 4). Figure 2d shows the double logarithmic plot of −ln(1 − X) vs. t in the case of changing parameter n (k = 10−4). These plots indicate that ln[−ln(1 − X)] is proportional to ln(t).
Hence, the values of parameters n and k can be estimated from the slope and the intercept of the double logarithmic plot of −ln(1 − X) vs. t.
The parameter n reflects the growth dimension of crystal grains. Two mechanisms can be considered for the nucleation with phase transformation. The first is the “site saturation mechanism”. If the nucleation proceeds by the “site saturation mechanism”, all nuclei will be formed at the same time. The second is the “constant nucleation rate mechanism”. If the nucleation proceeds by the “constant nucleation rate mechanism”, a number of nuclei will be formed continuously at a constant rate per unit volume [25]. In the case of the “site saturation mechanism”, if the crystal growth geometry factor equals 3 (n = 3), the crystal nuclei will grow three-dimensionally (3-D). In a similar way, n = 2 and n = 1 correspond to two-dimensional (2-D) and one-dimensional (1-D) growth processes, respectively [26,27]. In the case of the 1-D nanowire growth process as shown in Figure 1a’–d’, the crystal nucleation frequency factor, k is expressed by the following Equation (3).
k = N d A c R g ,
where Nd means the crystal nucleation site density, Ac represents the cross-sectional area of a nanowire and Rg corresponds to the growth rate of nanowires. In this research, the time-dependence of electrochemical reduction current was analyzed by JMAK theory. Then, the electrochemical crystal growth process of the cobalt nanowires was investigated by determining the kinetic parameters of n, k and Nd.

4. Results and Discussion

4.1. Structure of Anodized Aluminum Oxide (AAO) Nanochannel Films

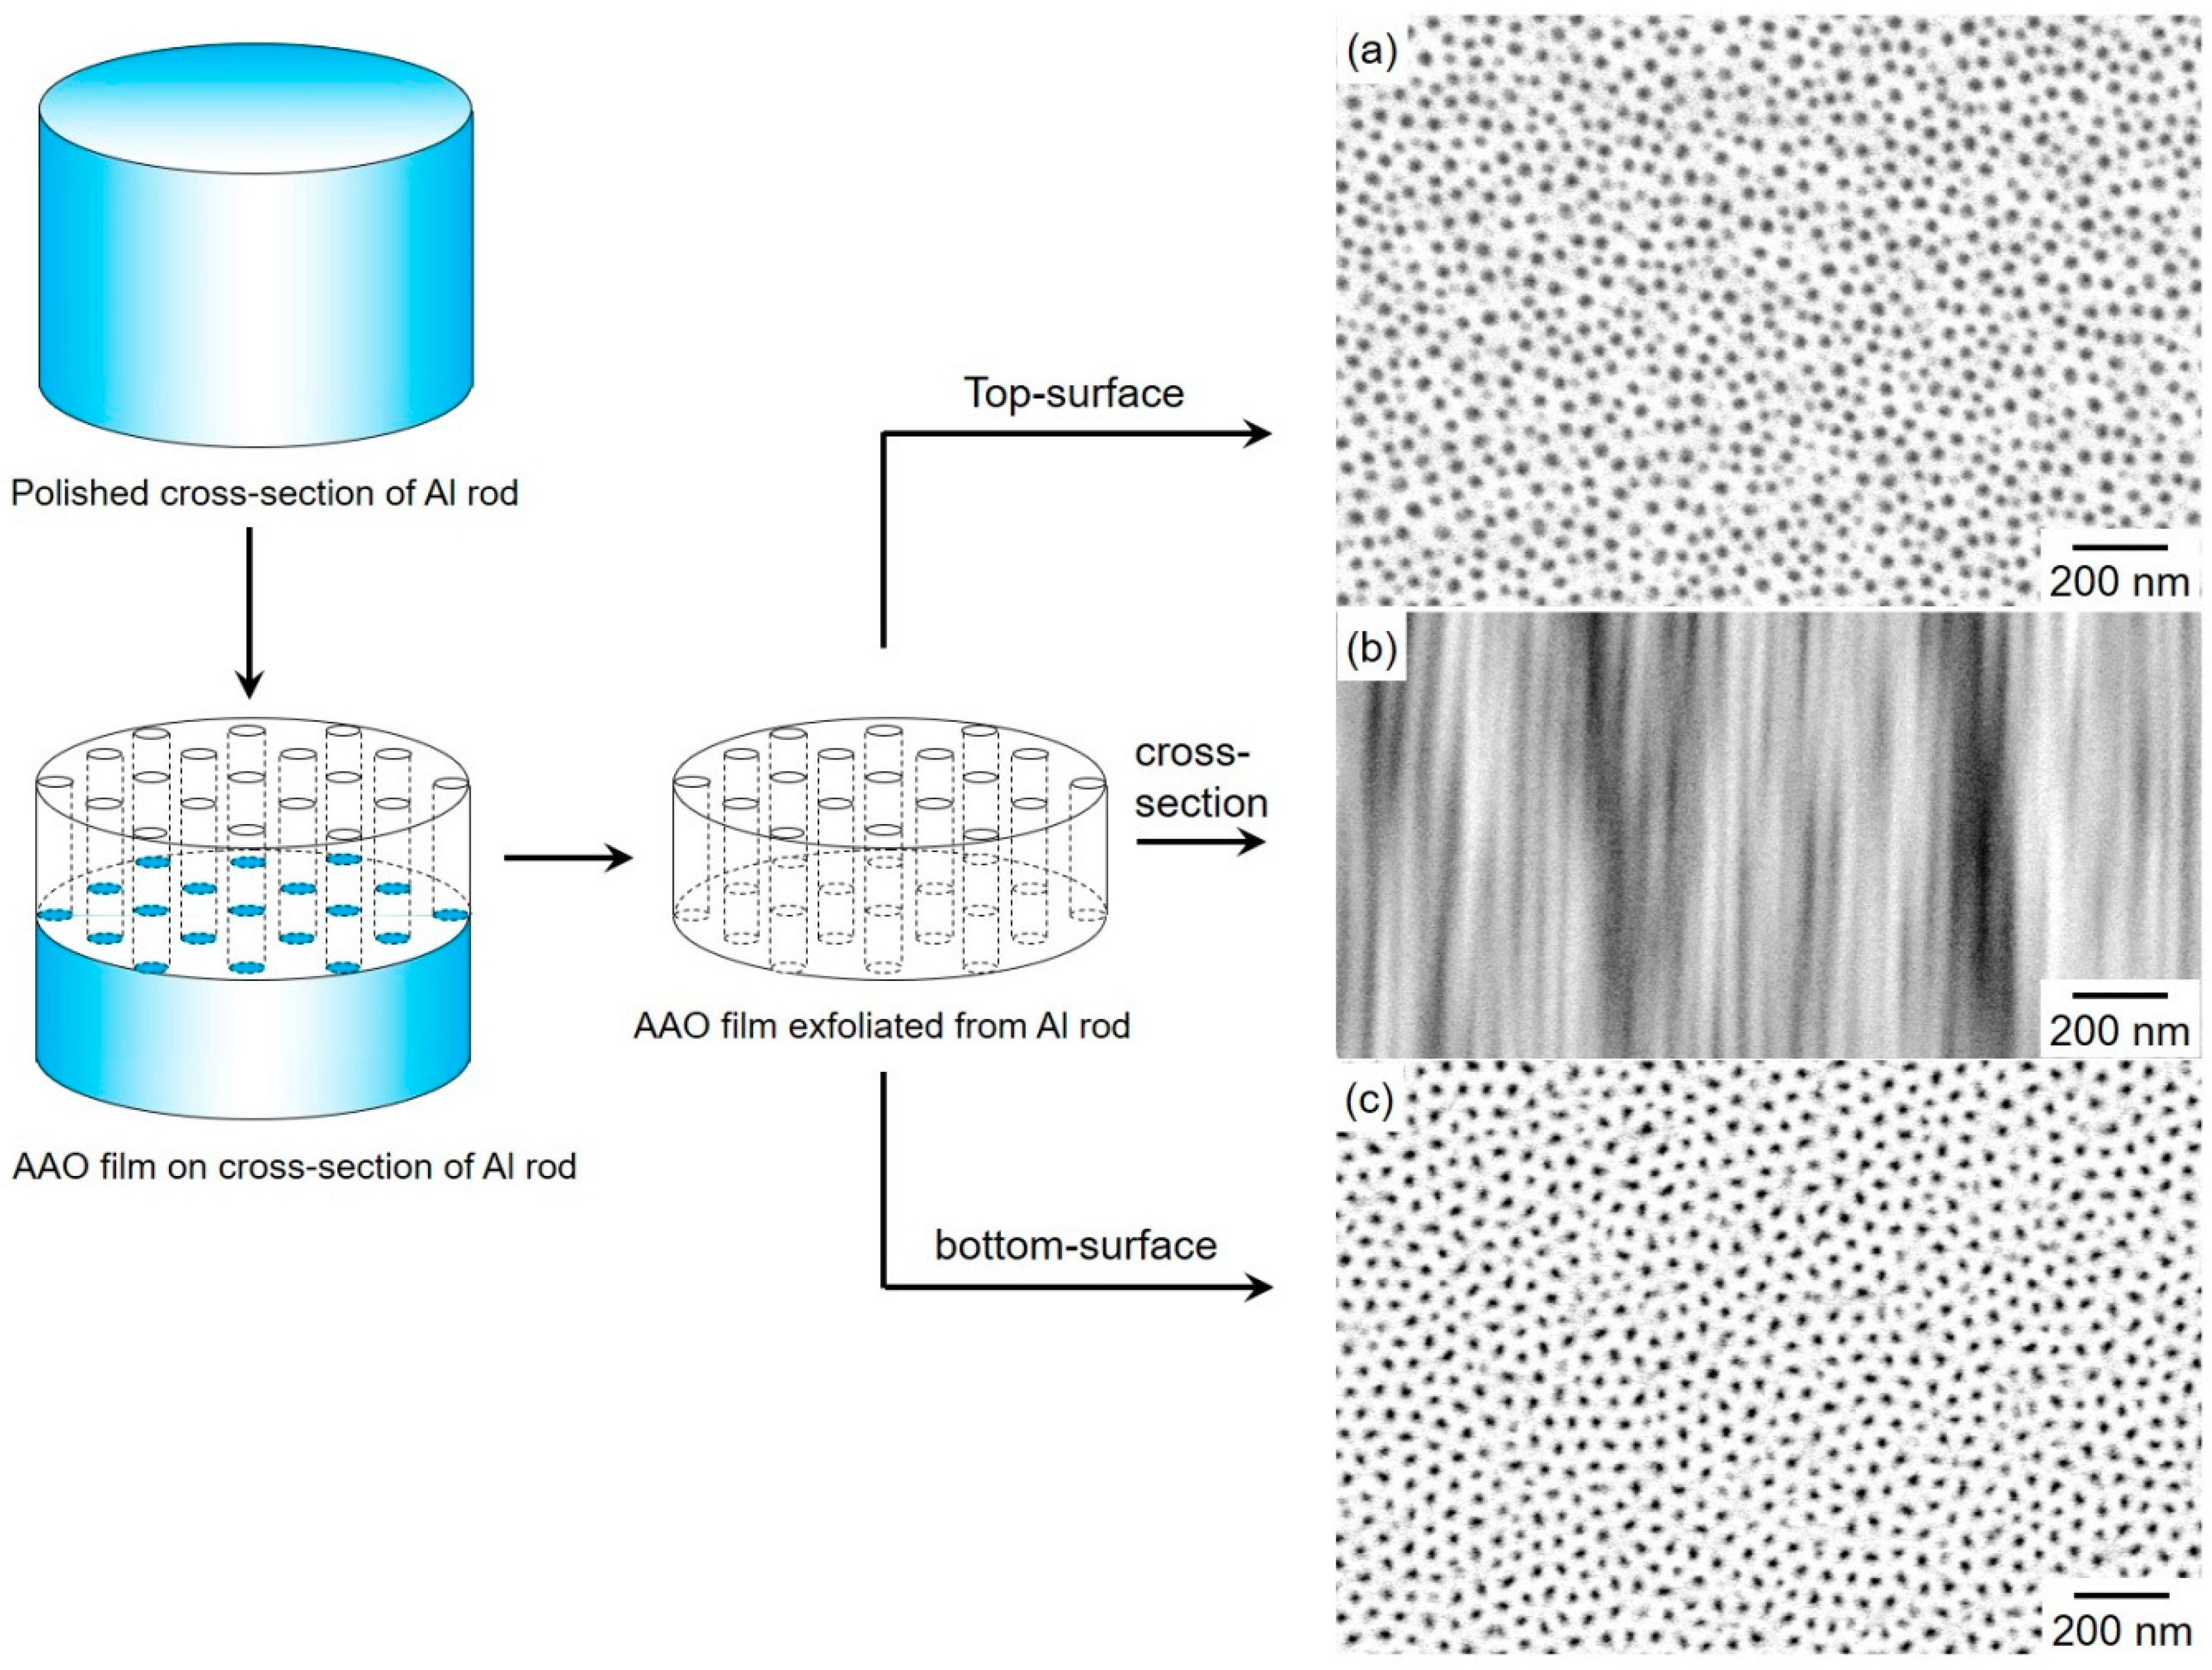
Figure 3 shows scanning electron microscope (SEM) images of the top-surface (a), cross-section (b) and bottom-surface (c) of an AAO nanochannel film that was exfoliated from an aluminum rod. Each nanochannel has an ideal cylindrical shape with parallel-aligned through-hole structure. The average pore diameter (Dp) and the pore length (L) were estimated to be ca. 25 nm and ca. 45 µm, respectively. Therefore, the aspect ratio (L/Dp) of the nanochannel reached ca. 1800.

4.2. Cobalt Electrodeposition into AAO Nanochannel Films

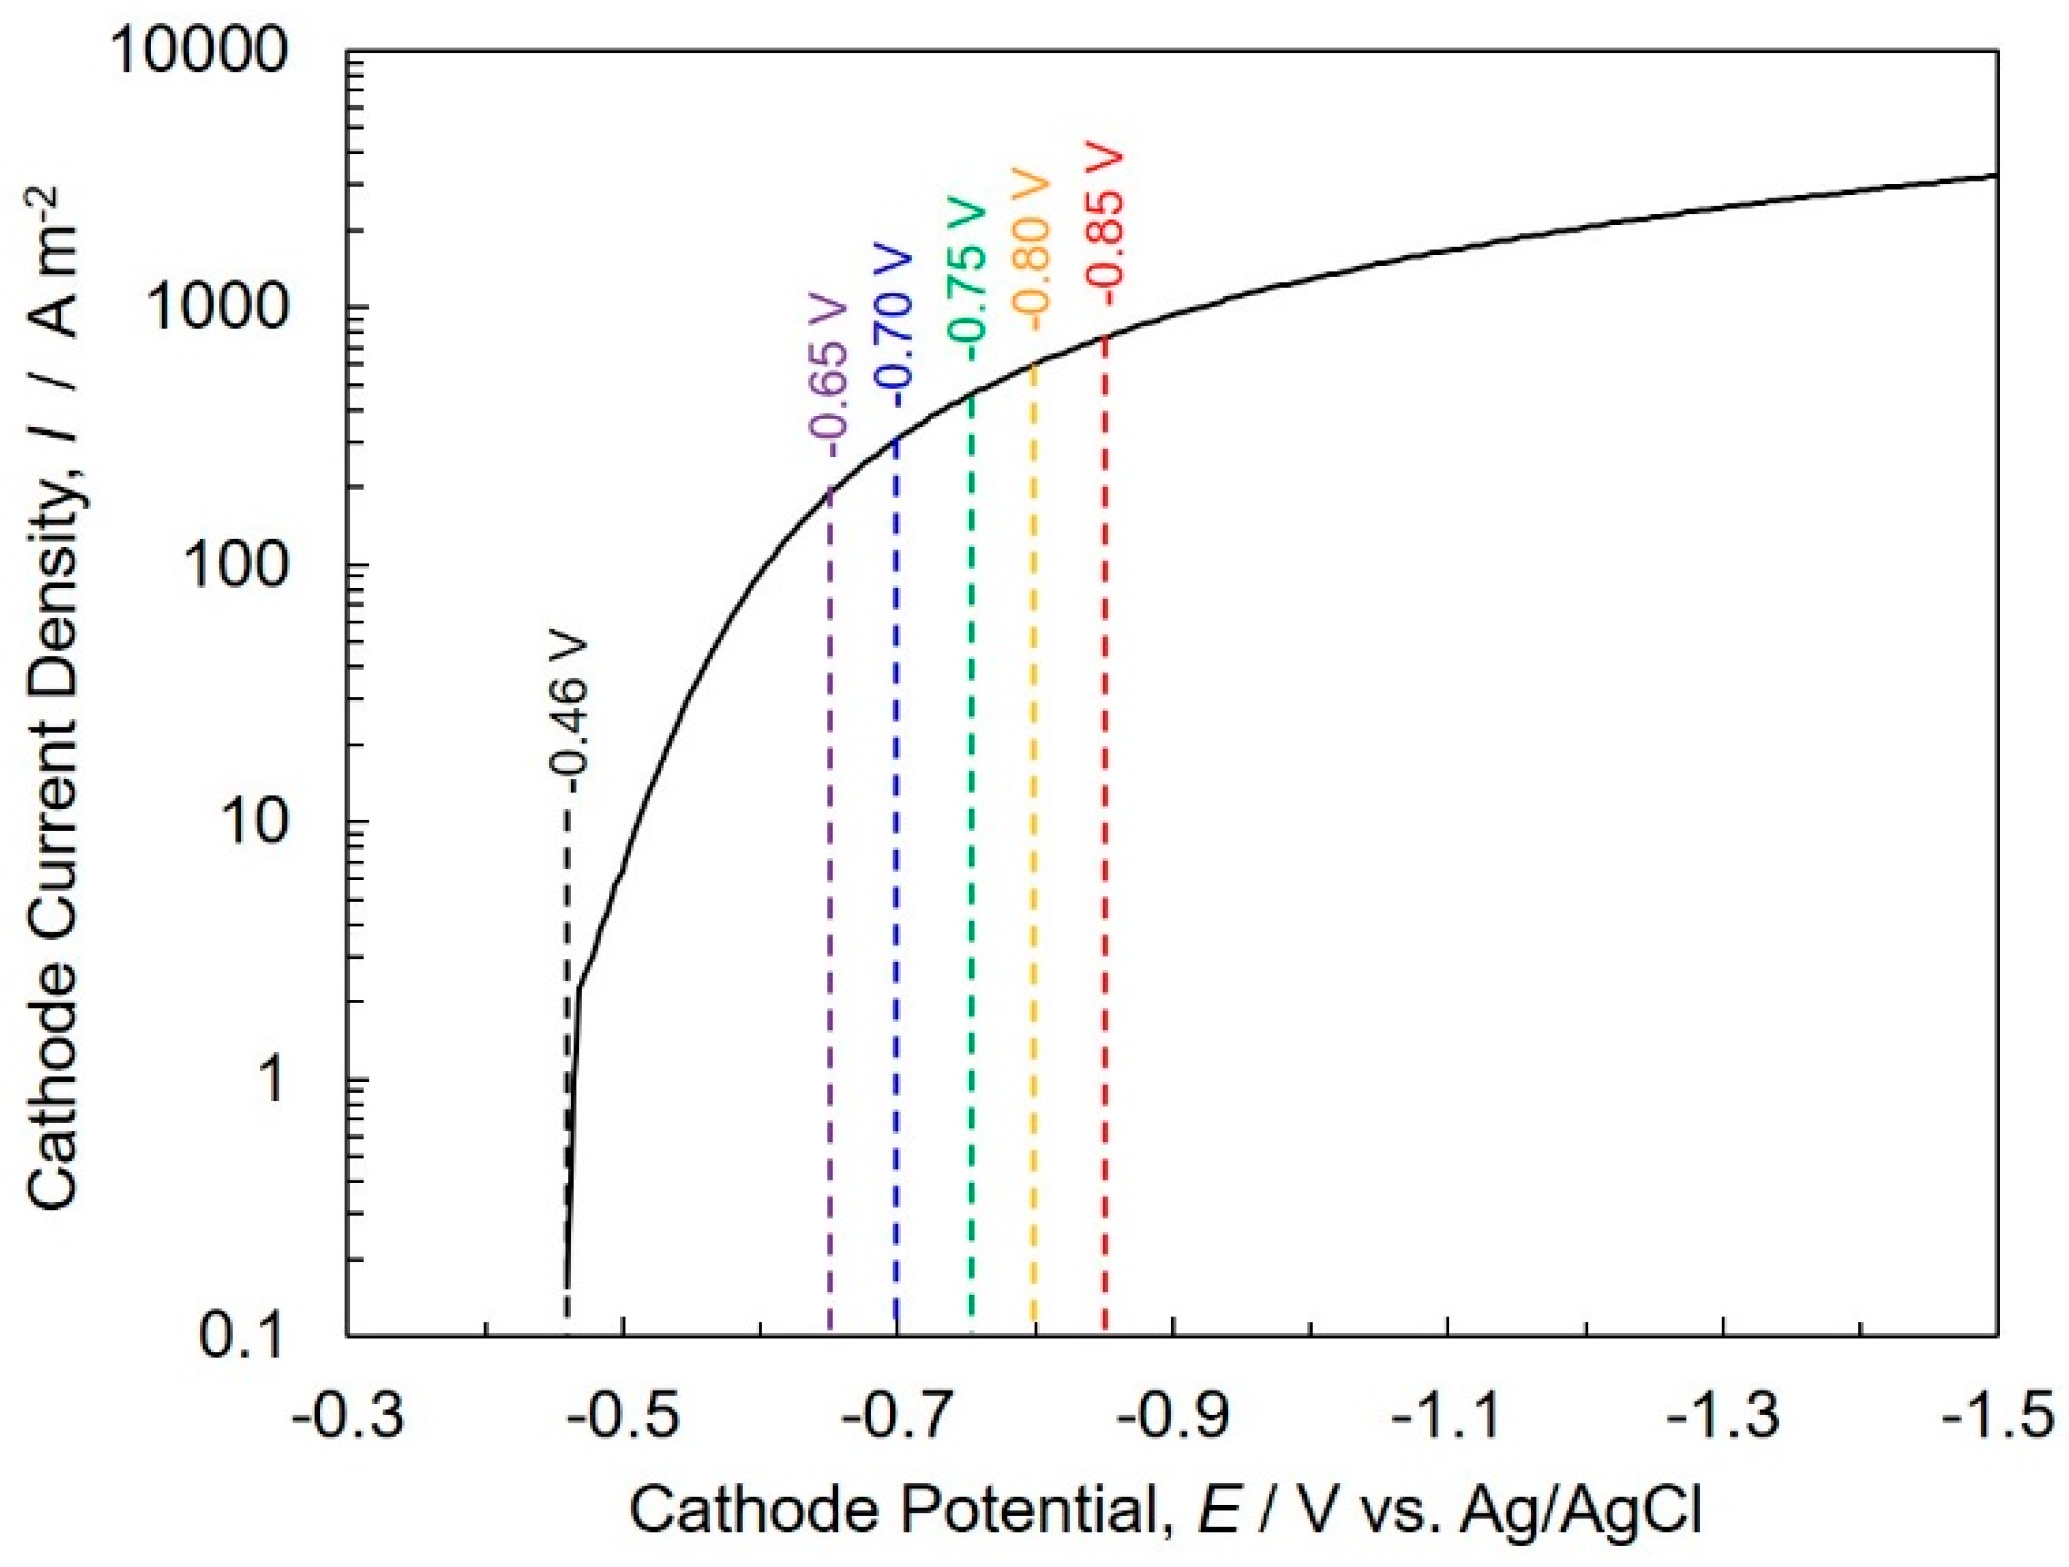
Prior to synthesis of the cobalt nanowire arrays, a cathodic polarization curve was measured to determine a suitable cathode potential region during the electrodeposition (Figure 4). A copper sheet was used as the cathode to measure the cathodic polarization. Also, a gold wire was used as an anode, a silver/silver chloride electrode (Ag/AgCl) was used as a reference electrode. An aqueous solution, which contains 0.5 M cobalt chloride hexahydrate and 0.4 M boric acid, was used for the electrodeposition. The temperature of this solution was kept at 60 °C. The sweep rate of the cathode potential was 50 mV s−1. The equilibrium potential of Co/Co2+ was estimated ca. −0.49 V vs. Ag/AgCl by the following Equation (4) (Nernst’s equation) under the experimental conditions of this research:
E e q = E 0 + R T n F l n [ M n + ] [ M 0 ] ,
where the standard electrode potential of Co/Co2+, E0 = −0.48 V vs. Ag/AgCl, the gas constant, R = 8.3 J K−1 mol−1, the solution temperature, T = 333 K, the valence number of Co2+ ions, n = 2, Faraday constant, F = 96,485 C mol−1, molar concentration of Co2+ ions, [Mn+] = 0.5, activity of metallic Co, [M0] = 1. Figure 4 shows that the cathode current density increased sharply at the potential range from −0.46 V, which is close to the above equilibrium potential, to ca. −0.60 V. In addition, the cathode current density increased moderately at the potential range less noble than ca. −1.0 V. This suggests that the electrochemical reduction rate of Co2+ ions is controlled by the charge transfer process and the reaction proceeds with high efficiency at the potential range from ca. −0.60 V to ca. −1.0 V. However, the mass transfer of the inside of the nanochannel is affected by the diffusion; the diffusion coefficient decreases as the length of nanochannel increases [28,29]. Hence, in the case of using the AAO nanochannel films as the cathode, the mass transfer limitation could occur at a nobler potential range than the case of using a copper sheet. Thus, −0.85 V, −0.80 V, −0.75 V, −0.70 V, −0.65 V vs. Ag/AgCl were determined as the cathode potentials during electrodeposition into the AAO nanochannel films.
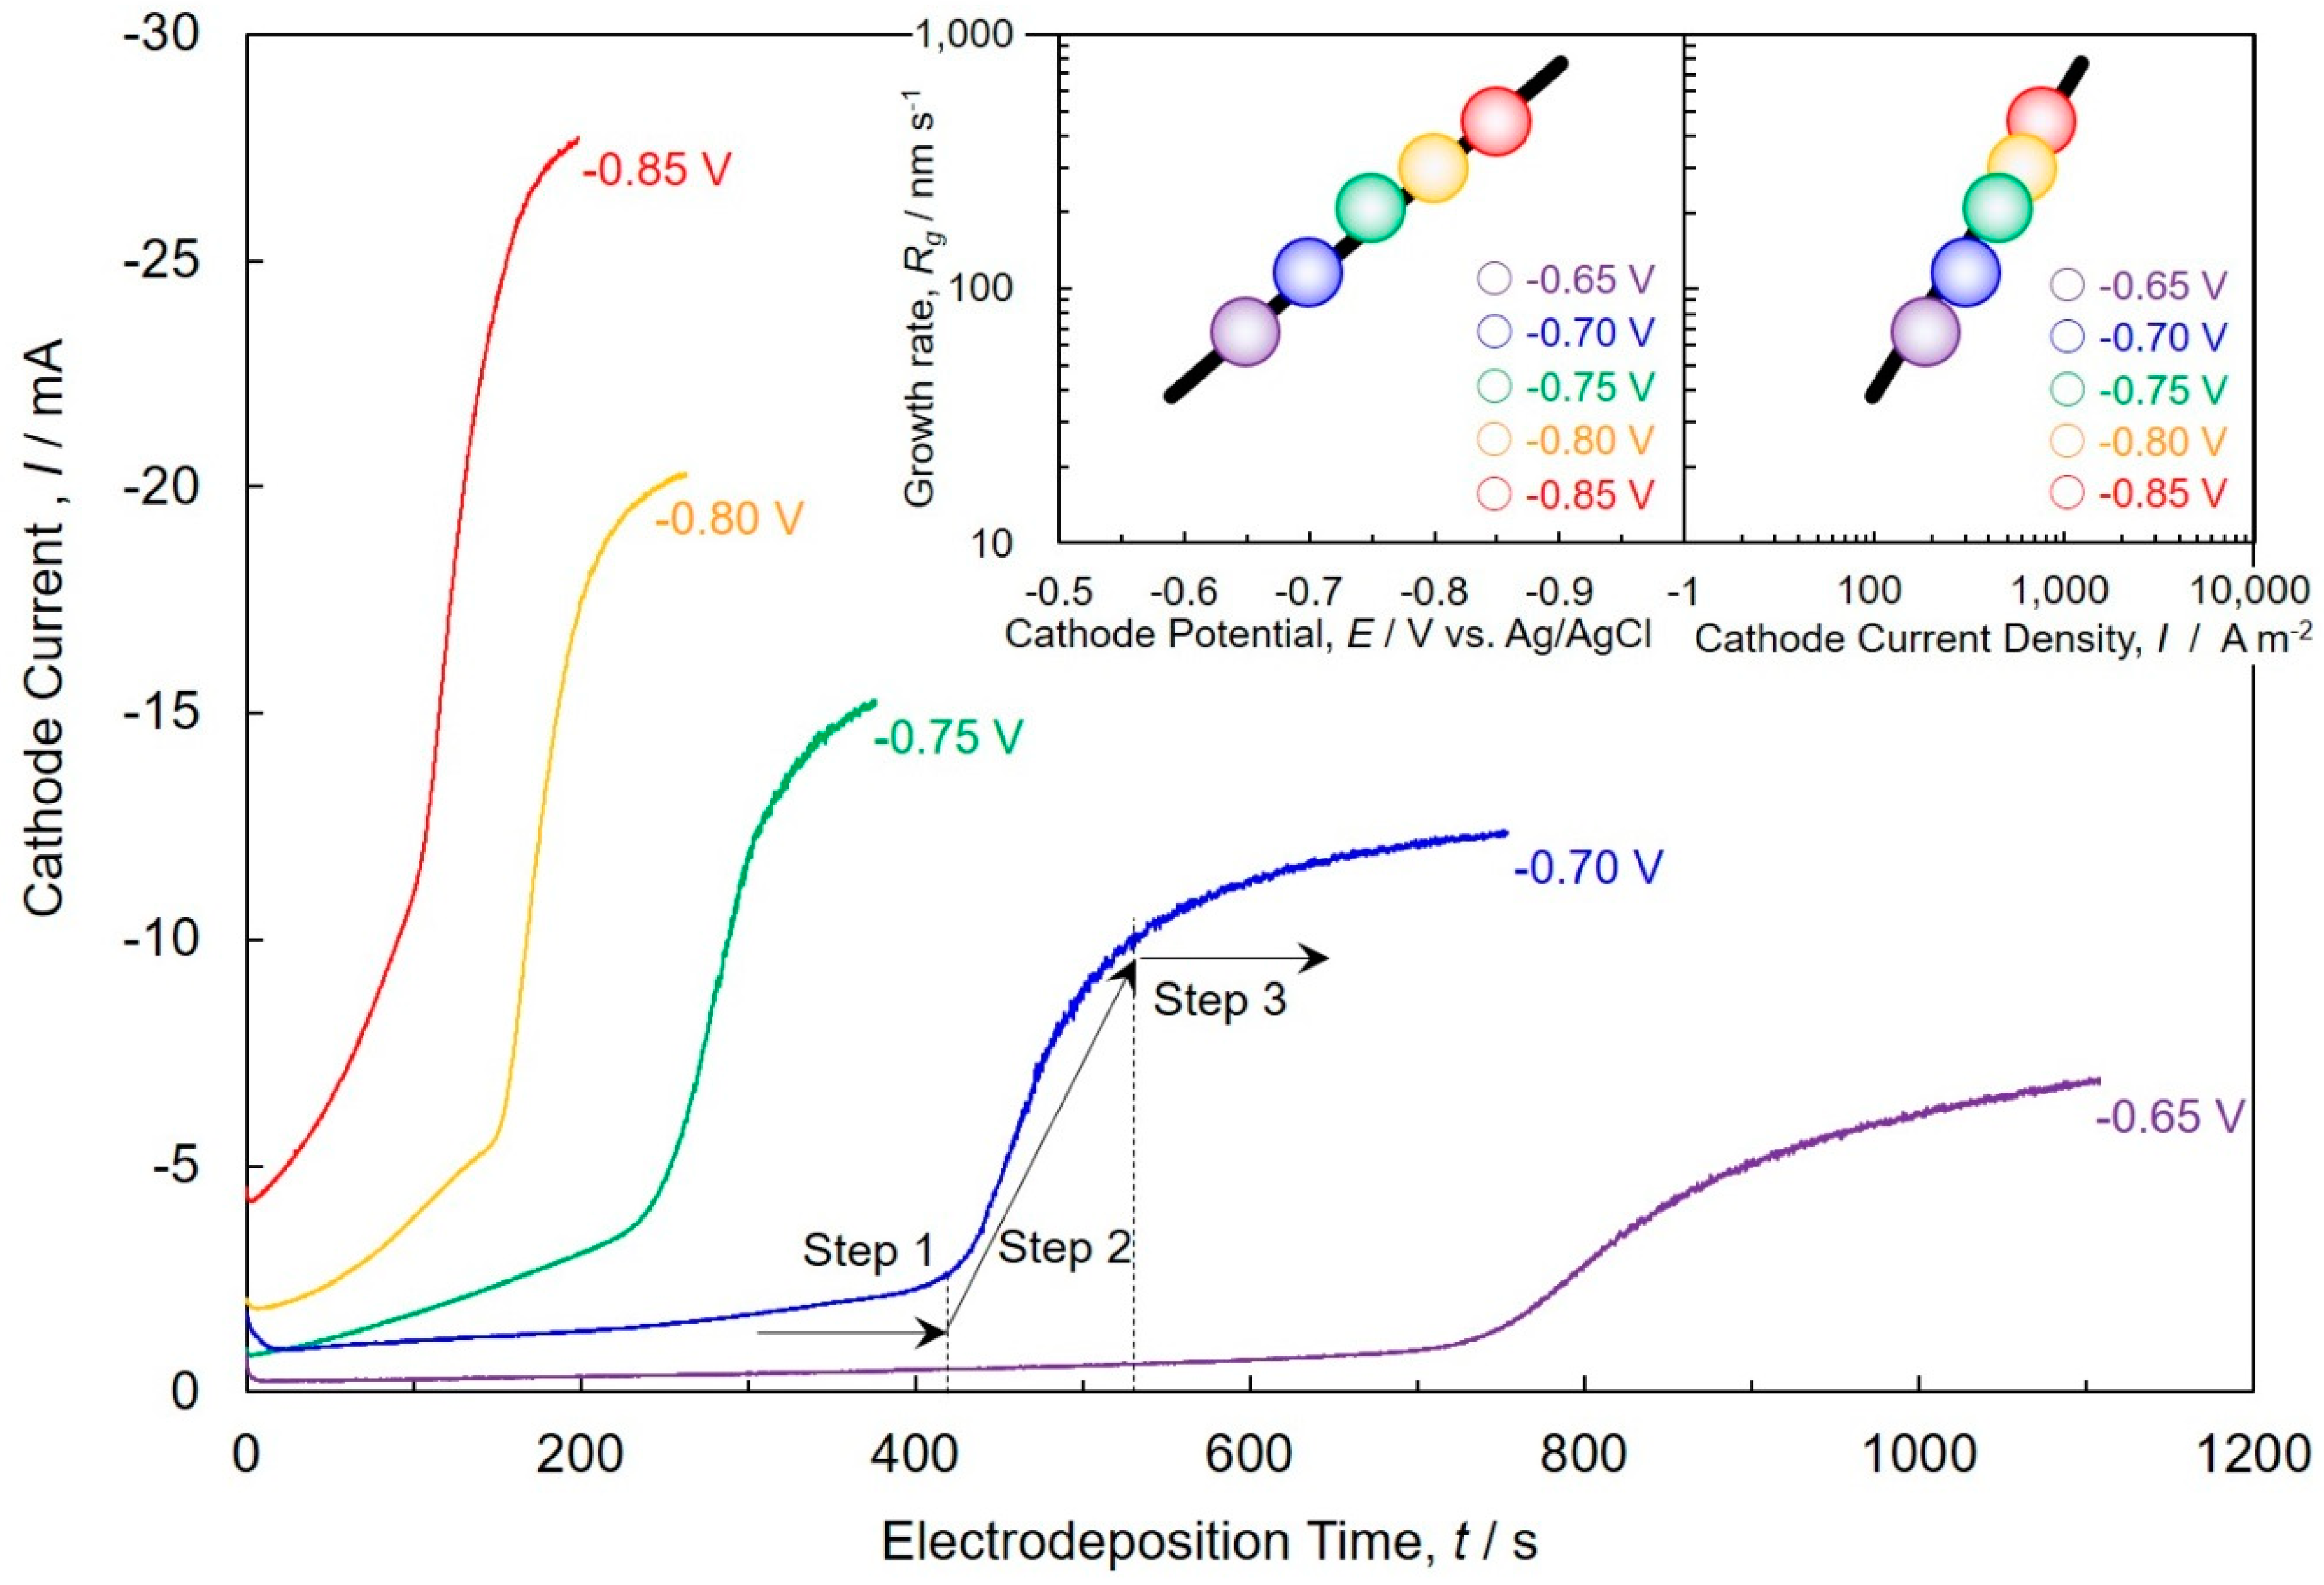
Figure 5 shows the time dependence of the electrochemical reduction current, which was measured during the electrodeposition into the AAO nanochannel films. The magnitude of electrochemical reduction current corresponds to the area of electrode surface, which reflects the growth process of the cobalt nanowires. The growth process can be classified into the following three steps:
Step 1. The electrochemical reduction current is kept to almost constant value for a while after the start of electrodeposition as shown in Figure 5 (Step 1). At this time, cobalt electrodeposits into the nanochannels, and the cobalt nanowires are growing as shown in Figure 1b”.
Step 2. The value of the electrochemical reduction current begins to increase sharply at a certain time as shown in Figure 5 (Step 2). A sharp increase of the current value indicates that the nanochannels are filled with cobalt nanowires and the nanowires reach the surface of the AAO nanochannel film as shown in Figure 1c”.
Step 3. Subsequently, the value of the current continues to increase as shown in Figure 5 (Step 3). In this period, the film-like cobalt deposit is growing and spreading on the surface of the AAO nanochannel film as shown in Figure 1d”. The electrodeposition of cobalt was stopped when the AAO nanochannel was covered with the film-like cobalt deposit. After the electrodeposition process, the surface of the AAO nanochannel film was etched by using 1 M nitric acid solution. In this way, the cobalt nanowire arrays were synthesized.
In this research, the thickness of the AAO nanochannel films was ca. 45 µm. The growth rate of cobalt nanowires was calculated by dividing the thickness by the time taken for the cobalt nanowires to reach the surface of the AAO nanochannel film. As shown in the insets of Figure 5, the growth rate of the cobalt nanowires increases with an increase of the overpotential and the current density for cobalt electrodeposition.

4.3. Electrochemical Crystal Growth Process of Cobalt Nanowire Arrays Analyzed by JMAK Theory

The time-dependence of the electrochemical reduction current during the electrodeposition of cobalt into the AAO nanochannel films was analyzed by JMAK theory. As mentioned above, the time-dependence of the electrochemical reduction current reflects the growth processes of cobalt nanowires. When the analysis was carried out, the time-dependence of electrochemical reduction current was normalized by using the maximum current values at the ending time (X = 1) of cobalt electrodeposition.
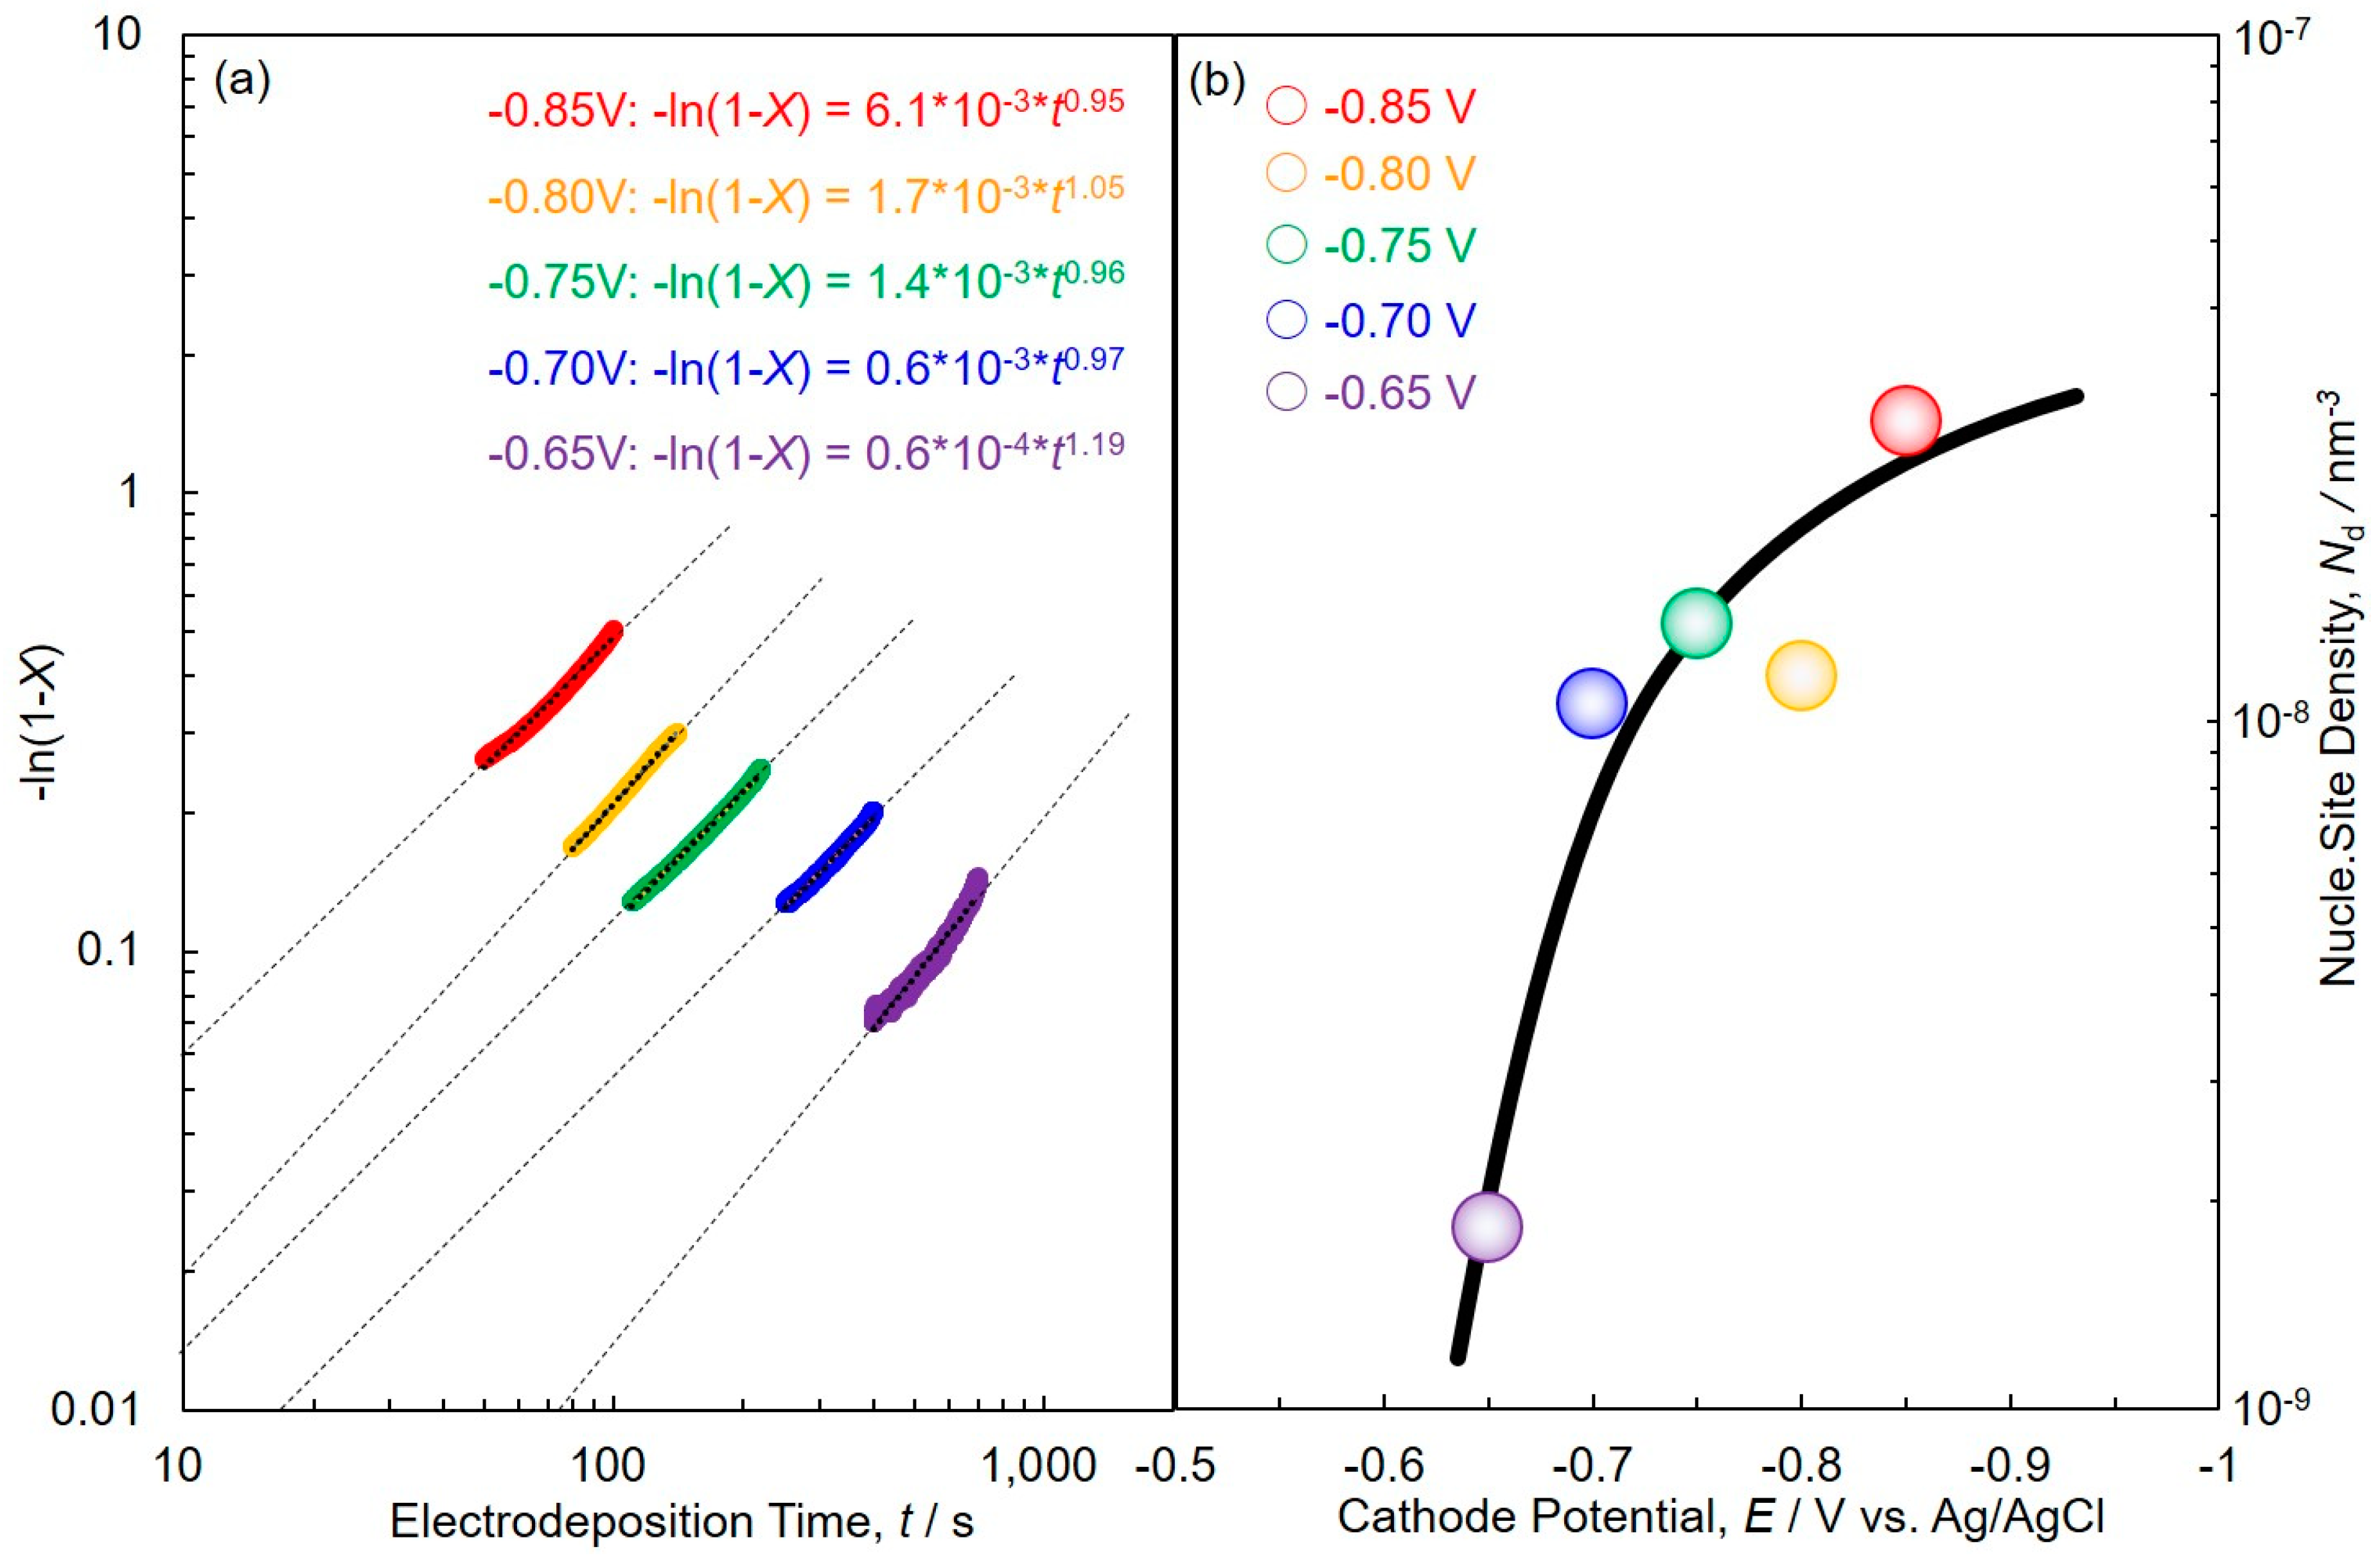
Figure 6a shows the double logarithmic plot of −ln(1 − X) vs. t derived from the time-dependence of electrochemical reduction current during the “Step 1” process. The values of parameters n (crystal growth geometry factor) and k (crystal nucleation frequency) were estimated from the slope and the intercept of the double logarithmic plot. As a result, the values of n at the cathode potentials of −0.85 V, −0.80 V, −0.75 V, −0.70 V and −0.65 V vs. Ag/AgCl were determined as 0.95, 1.05, 0.96, 0.97 and 1.19, respectively. When “the site saturation mechanism” is assumed, n = 3, n = 2 and n = 1 represent 3-D, 2-D and 1-D growth processes, respectively [26,27]. Therefore, the electrochemical crystal growth process of the numerical nanowire array can be explained by 1-D geometry as shown in Figure 1a’–d’. In addition, the values of k at the cathode potentials of −0.85 V, −0.80 V, −0.75 V, −0.70 V and −0.65 V vs. Ag/AgCl were determined as 6.1 × 10⁻³, 1.7 × 10⁻³, 1.4 × 10⁻³, 0.6 × 10⁻³ and 0.6 × 10⁻⁴, respectively. Hence, the crystal nucleation frequency tended to increase when the overpotential for cobalt electrodeposition increased by shifting the cathode potential to a less-noble direction. If the values of n can be approximated as 1, the values of Nd are estimated by Equation (3). Figure 6b shows the effect of the cathode potential on the nucleation site density, Nd of electrodeposited Co nanowire arrays. As shown in Figure 6b, Nd decreases down to 1.8 × 10⁻⁹ nm−3 when shifting the cathode potential up to −0.65 V vs. Ag/AgCl. This tendency corresponds well to the cathode polarization curve as shown in Figure 4.

4.4. Morphological and Structural Studies of Cobalt Nanowire Arrays

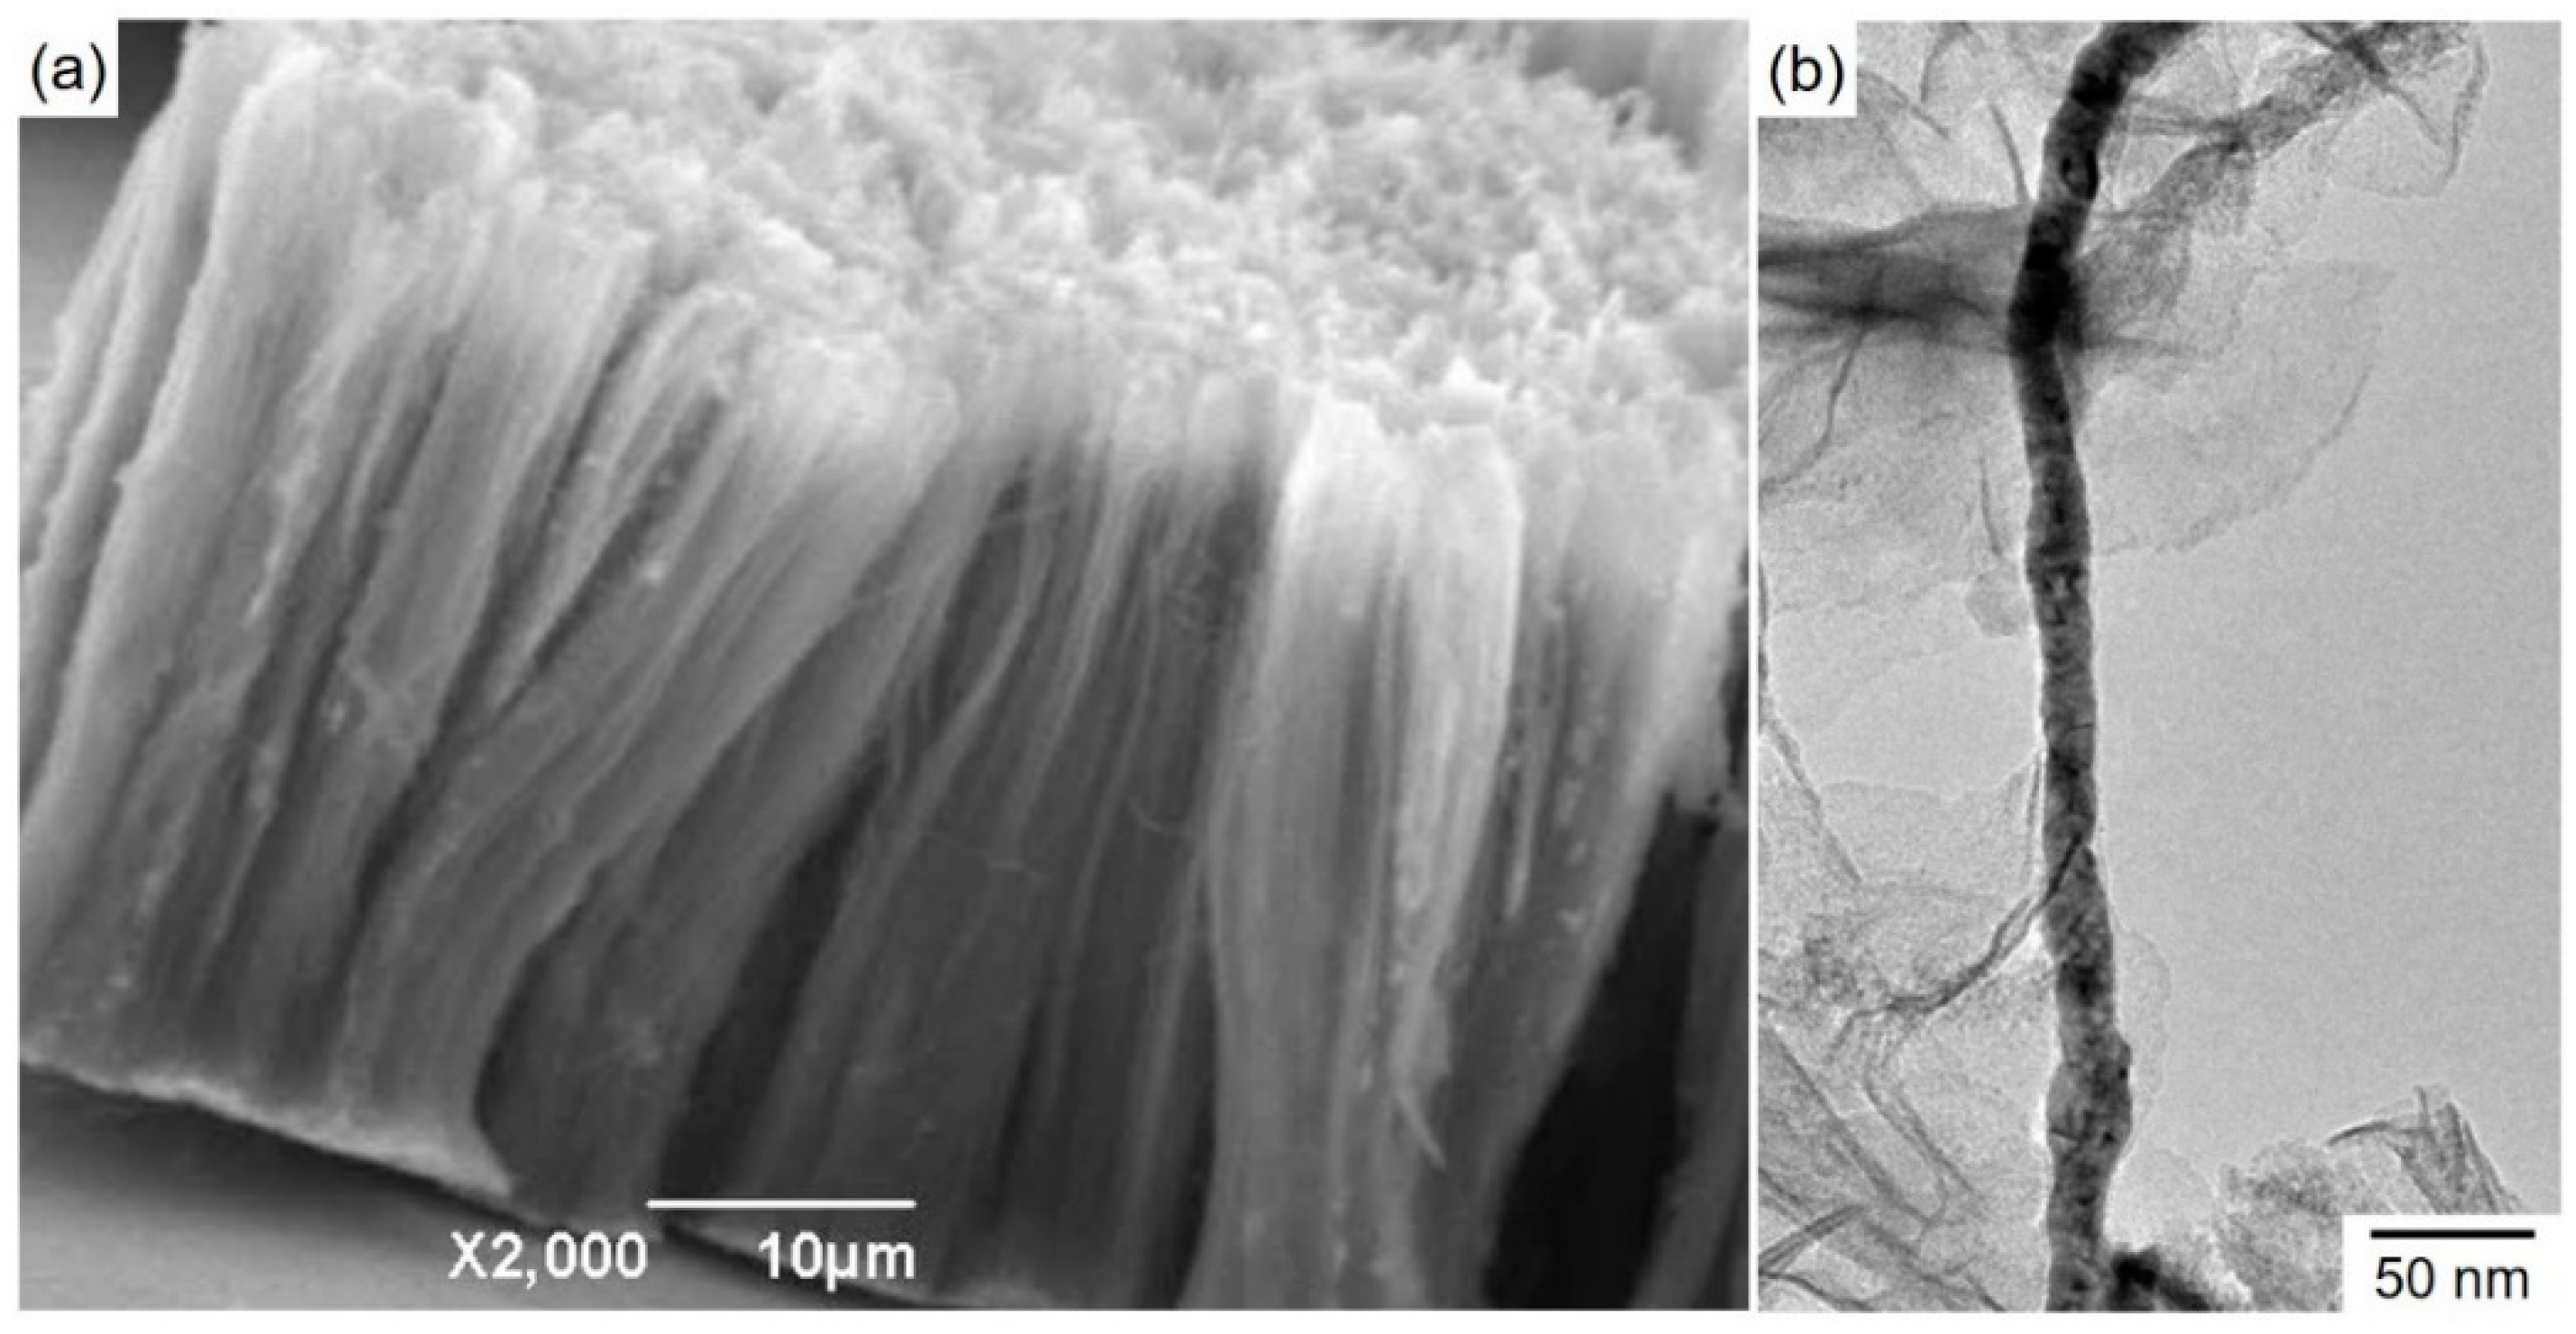
The aluminum oxide part of the cobalt nanowire array was dissolved by using a sodium hydroxide solution. Figure 7 shows an SEM image (a) and a transmission electron microscope (TEM) bright field image (b) of electrodeposited Co nanowires, which were separated from an anodized aluminum oxide nanochannel template. As shown in Figure 7a, it is observed that the close-set cobalt nanowires are arrayed in parallel and the length in the long axis is ca. 45 µm; while the diameter in cross-section is ca. 25 nm as shown in Figure 7b. Hence, the aspect ratio of cobalt nanowires, which were obtained in this study, reaches ca. 1800.
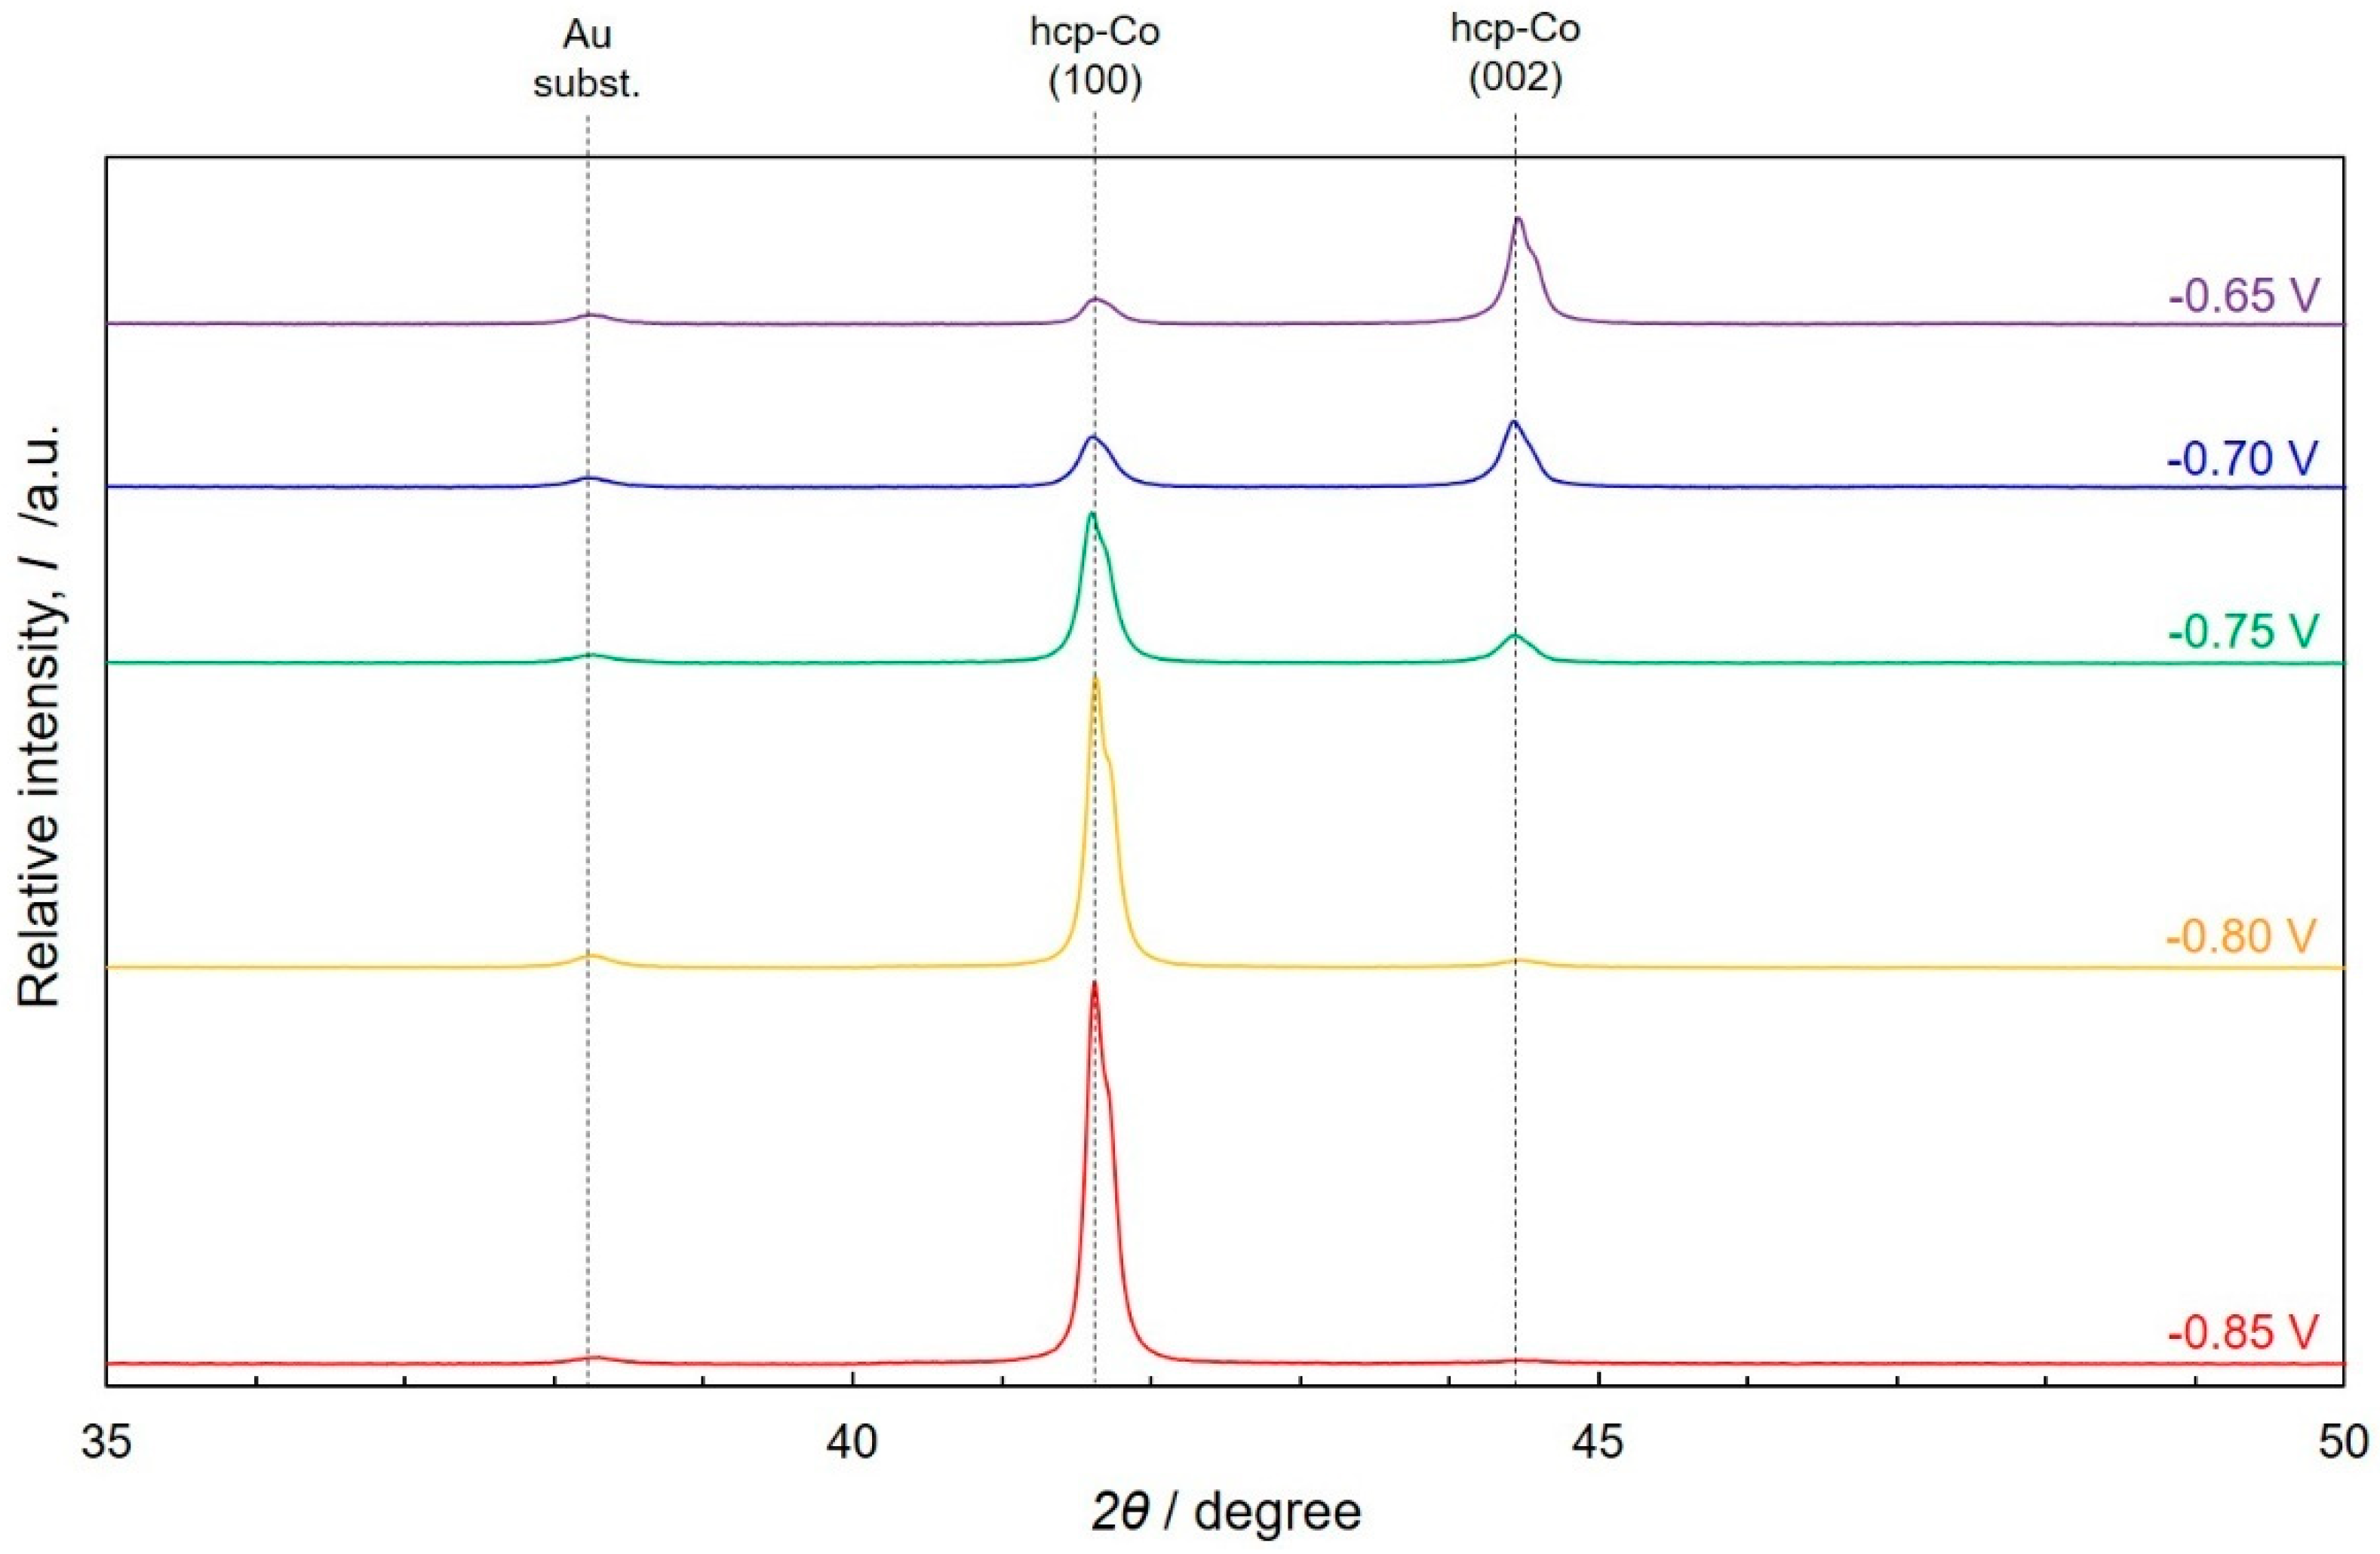
Figure 8 shows the X-ray diffraction profiles of the cobalt nanowire arrays (2θ = 20–90°). In the experimental conditions of this research, two peaks derived from the crystal planes of hcp-Co were observed. The peak at 2θ = 41.6° represented the intensity of (100). In contrast, the peak at 2θ = 44.5° represented the intensity of (002). In the case of cobalt nanowire arrays electrodeposited at cathode potentials of −0.85 V, −0.80 V and −0.75 V, the peak intensity of (100) was very strong compared with that of (002). In the sample electrodeposited at cathode potential of −0.70 V, the peak intensities of (100) and (002) were not greatly different. Moreover, in the sample electrodeposited at the cathode potential of −0.65 V, the peak intensity of (100) was very weak compared with that of (002).
Next, the texture coefficients TC(hkl) of the cobalt nanowire arrays were evaluated from the X-ray diffraction (XRD) profiles by using the Harris formula [30]:
T C ( h k l ) = I ( h k l ) i / I ( h k l ) 0 1 / N × j = 1 N ( I ( h k l ) j / I ( h k l ) 0 ) ,
where I0 is the peak intensity of a standard cobalt powder, I is the peak intensity of a sample and N is the number of crystal planes considered for calculation of the texture coefficients TC(hkl).
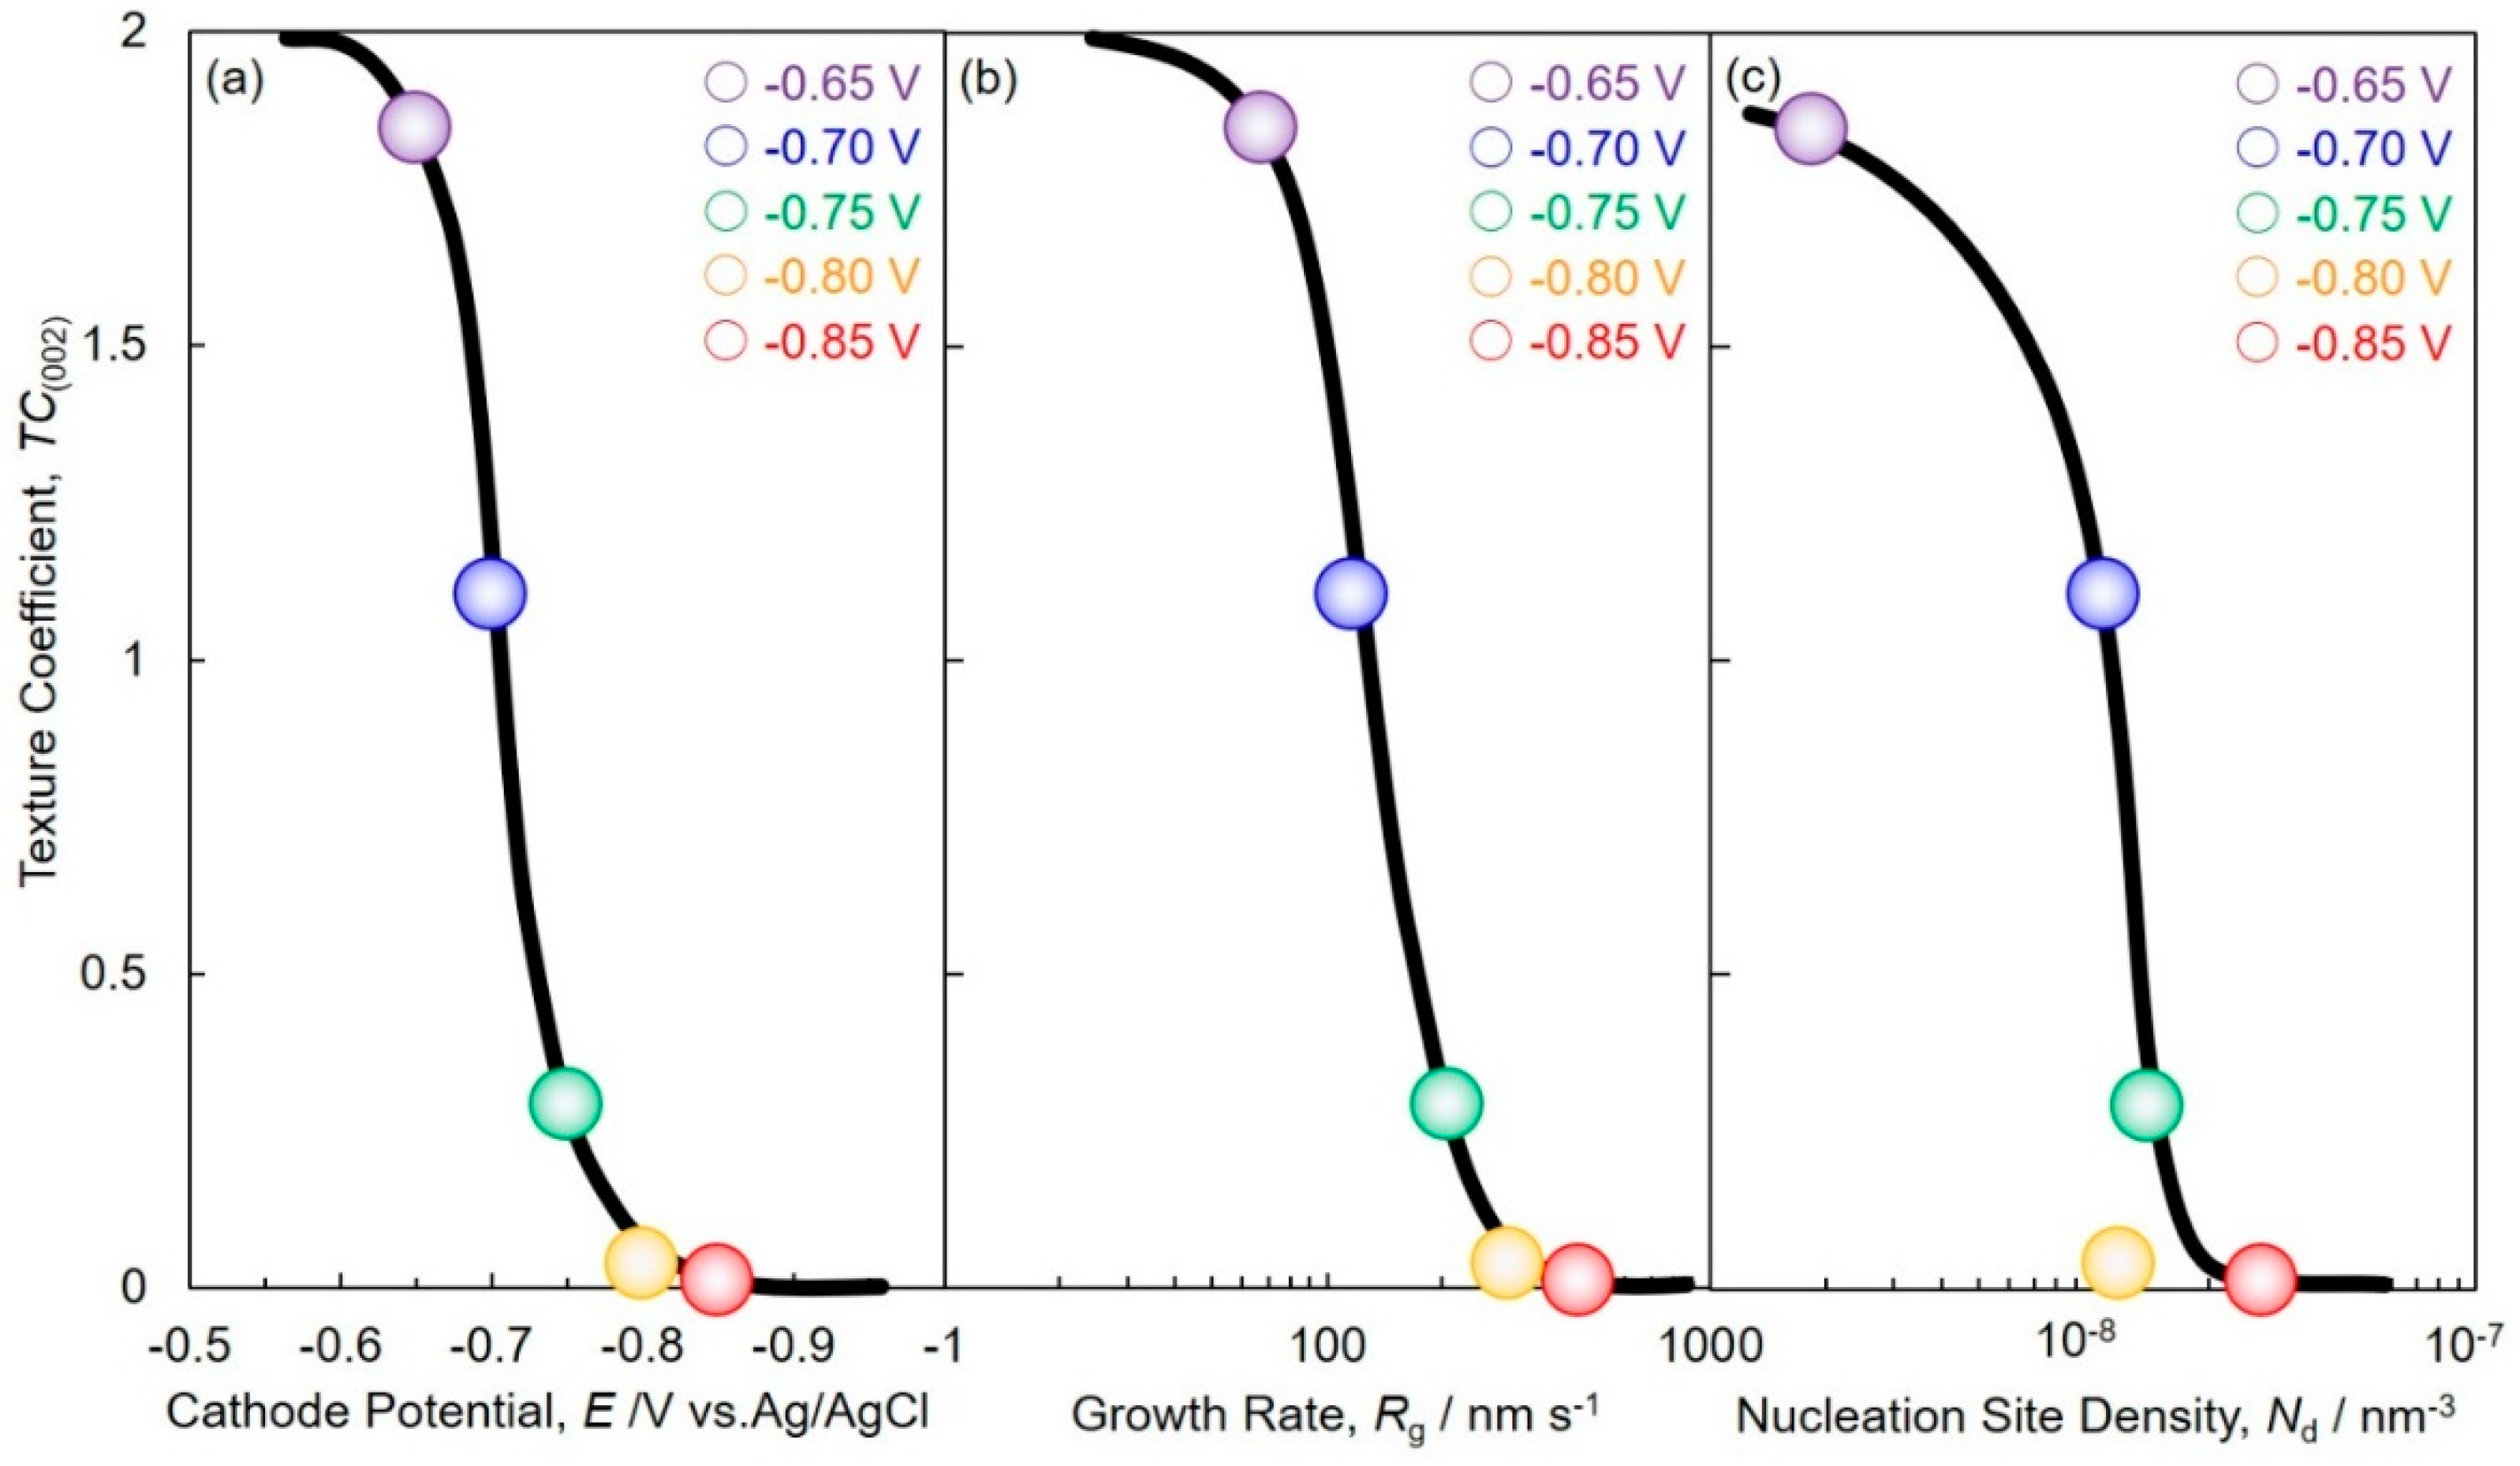
Figure 9 shows the effect of cathode potential (a), growth rate (b) and nucleation site density (c) on the texture coefficient TC(002) of electrodeposited Co nanowire arrays. TC(002) increased with a decrease of the overpotential by shifting the cathode potential to noble direction as shown in Figure 9a. In a similar way, Figure 9b,c show that TC(002) increased with the decrease of the growth rate and the nucleation site density of the cobalt nanowires.
Pangarov et al. calculated theoretically the works to form a two-dimensional nucleus of each crystal plane based on two-dimensional nuclei theory. They also predicted that the crystal orientation of electrodeposited cobalt shifts with a change in the overpotential for electrodeposition. According to their prediction, the cobalt crystal was oriented preferentially <002> when the overpotential was decreased [31,32]. Our experimental results corresponded with their prediction. Hence, it was found that the c-axis <002> of hcp-Co corresponds with the long axis of the nanowire when the overpotential, growth rate and nucleation site density were decreased.

4.5. Magnetic Properties of Cobalt Nanowire Arrays

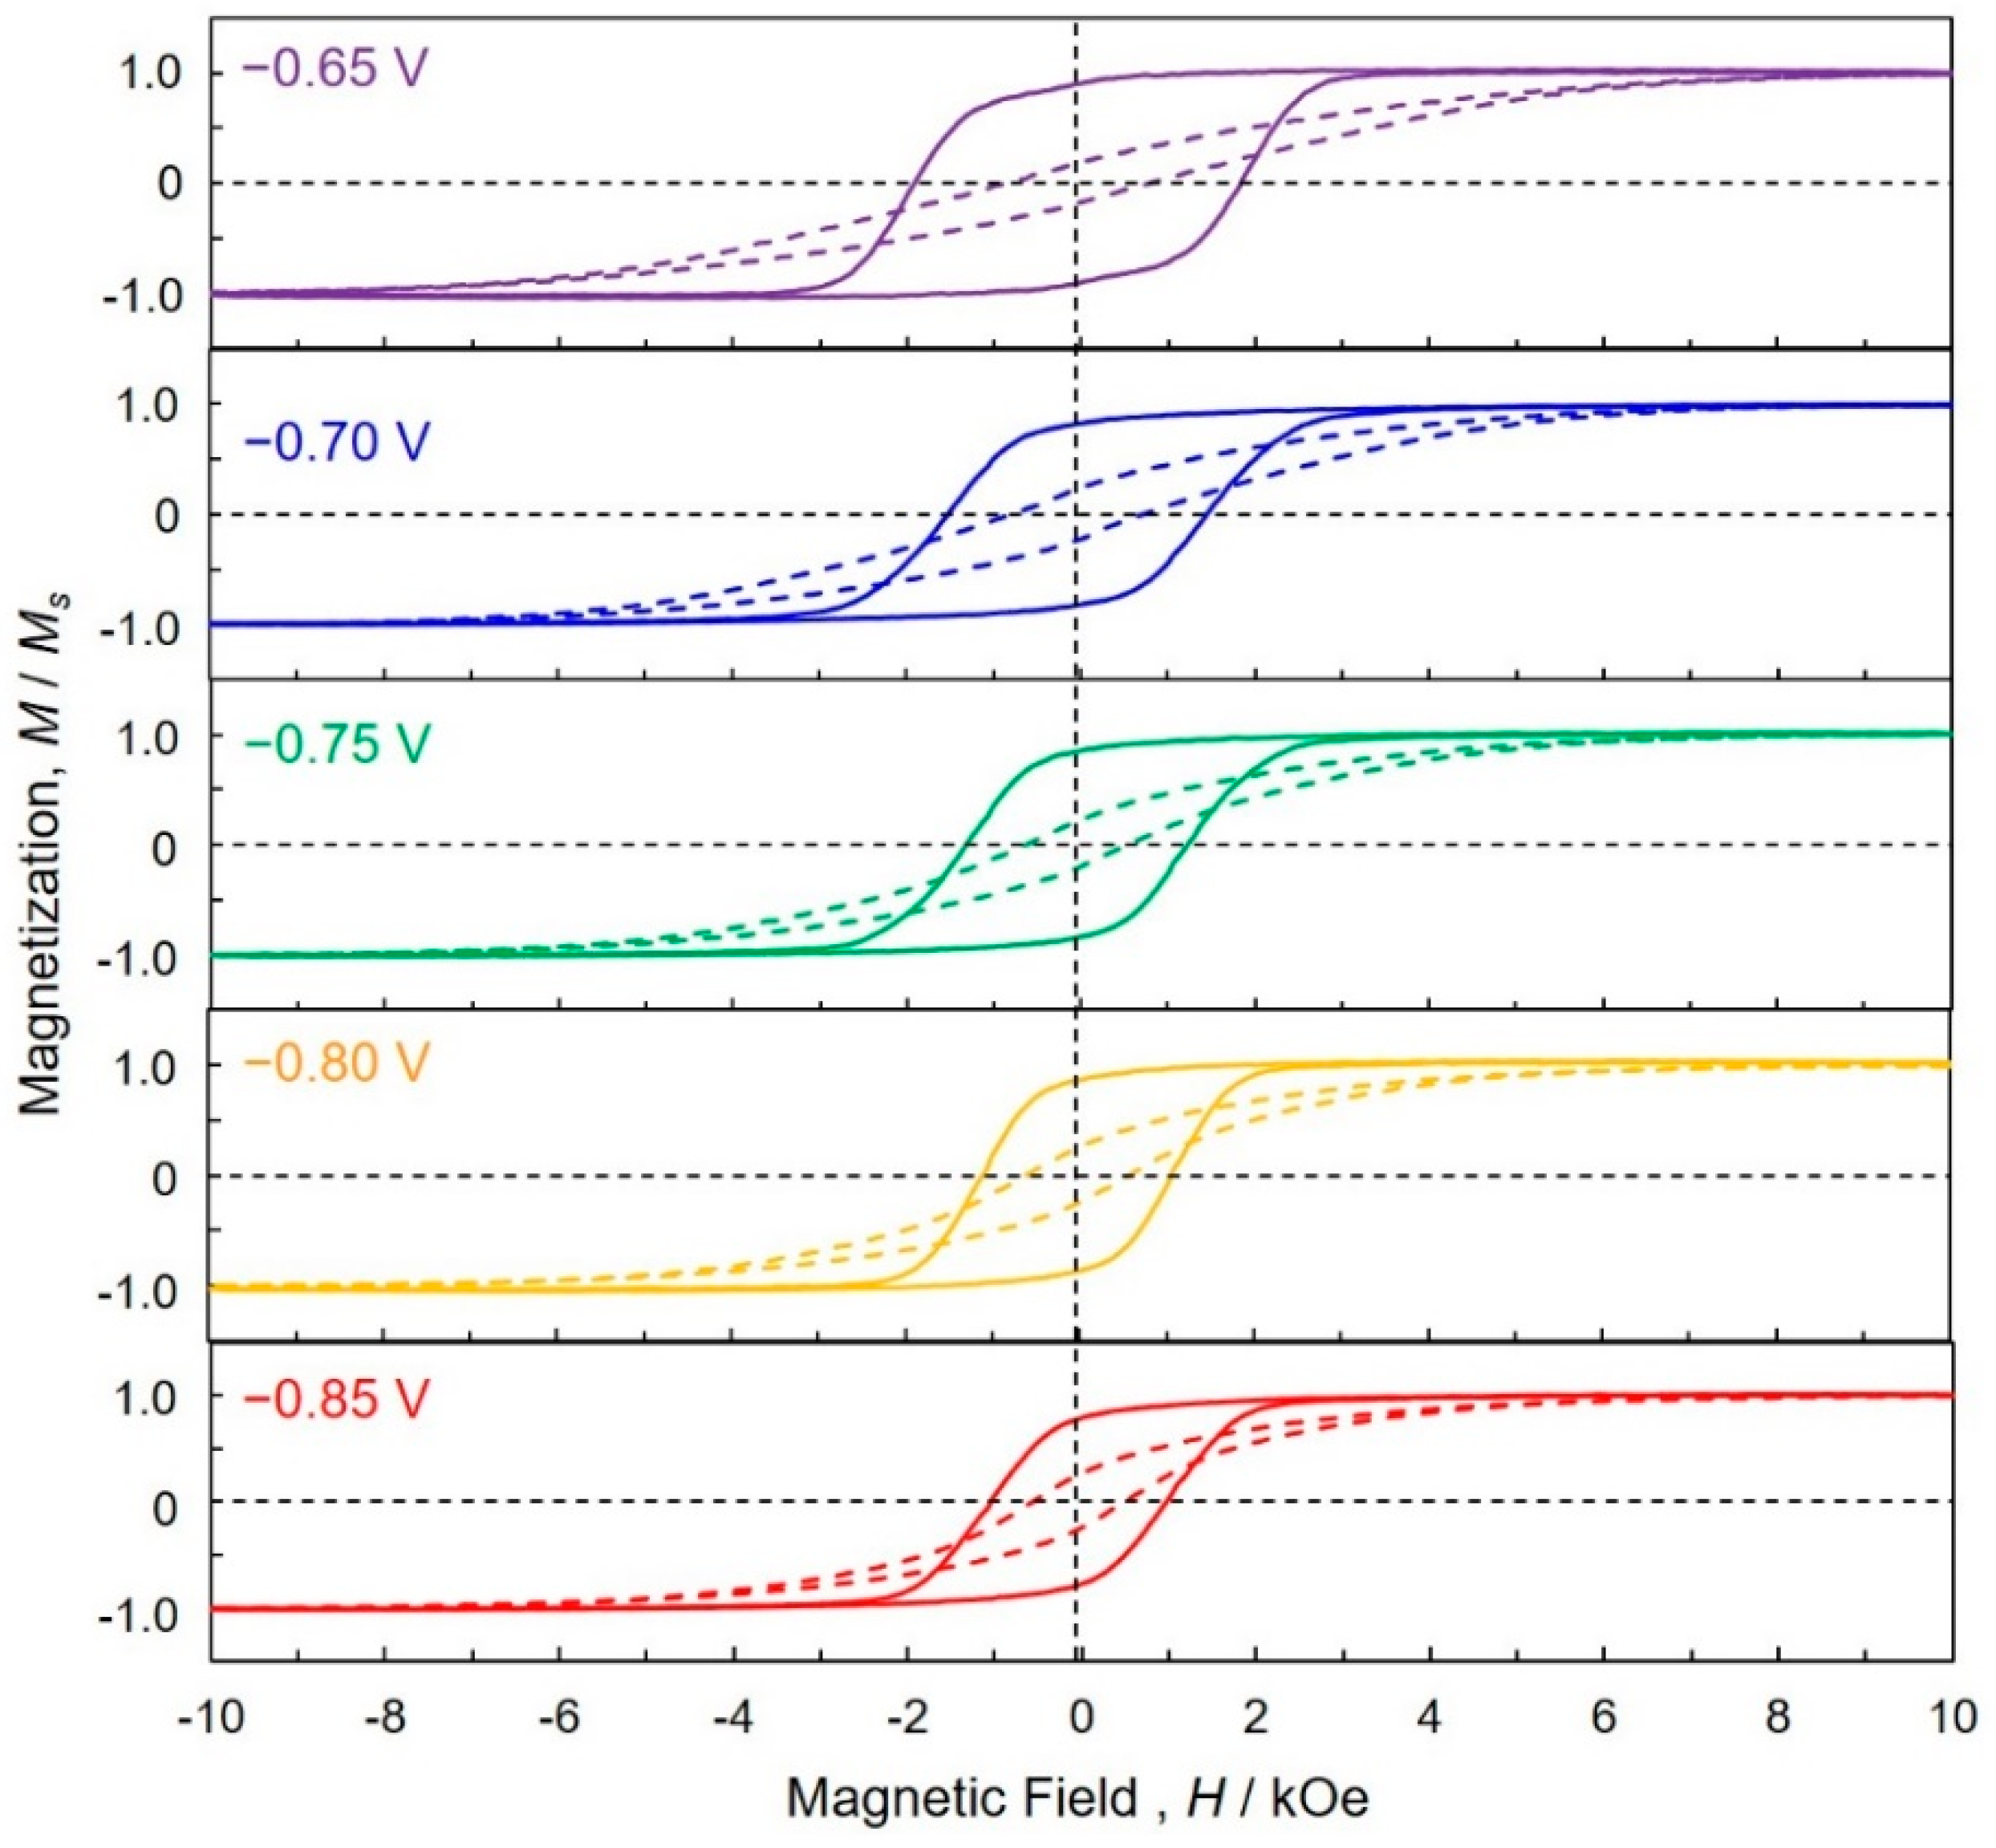
Figure 10 shows the magnetic hysteresis loops of the cobalt nanowire arrays electrodeposited at each cathode potential. The external field was applied perpendicular (solid line) and in-plane (dashed line) to the AAO nanochannel films. In all cases, the coercivity (Hc) and squareness (Mr/Ms) of the perpendicular direction was higher than those of the in-plane direction, indicating that the cobalt nanowire arrays had higher perpendicular magnetization performance. The shape anisotropy based on the high aspect ratio of cobalt nanowire is likely to have produced such magnetic properties.
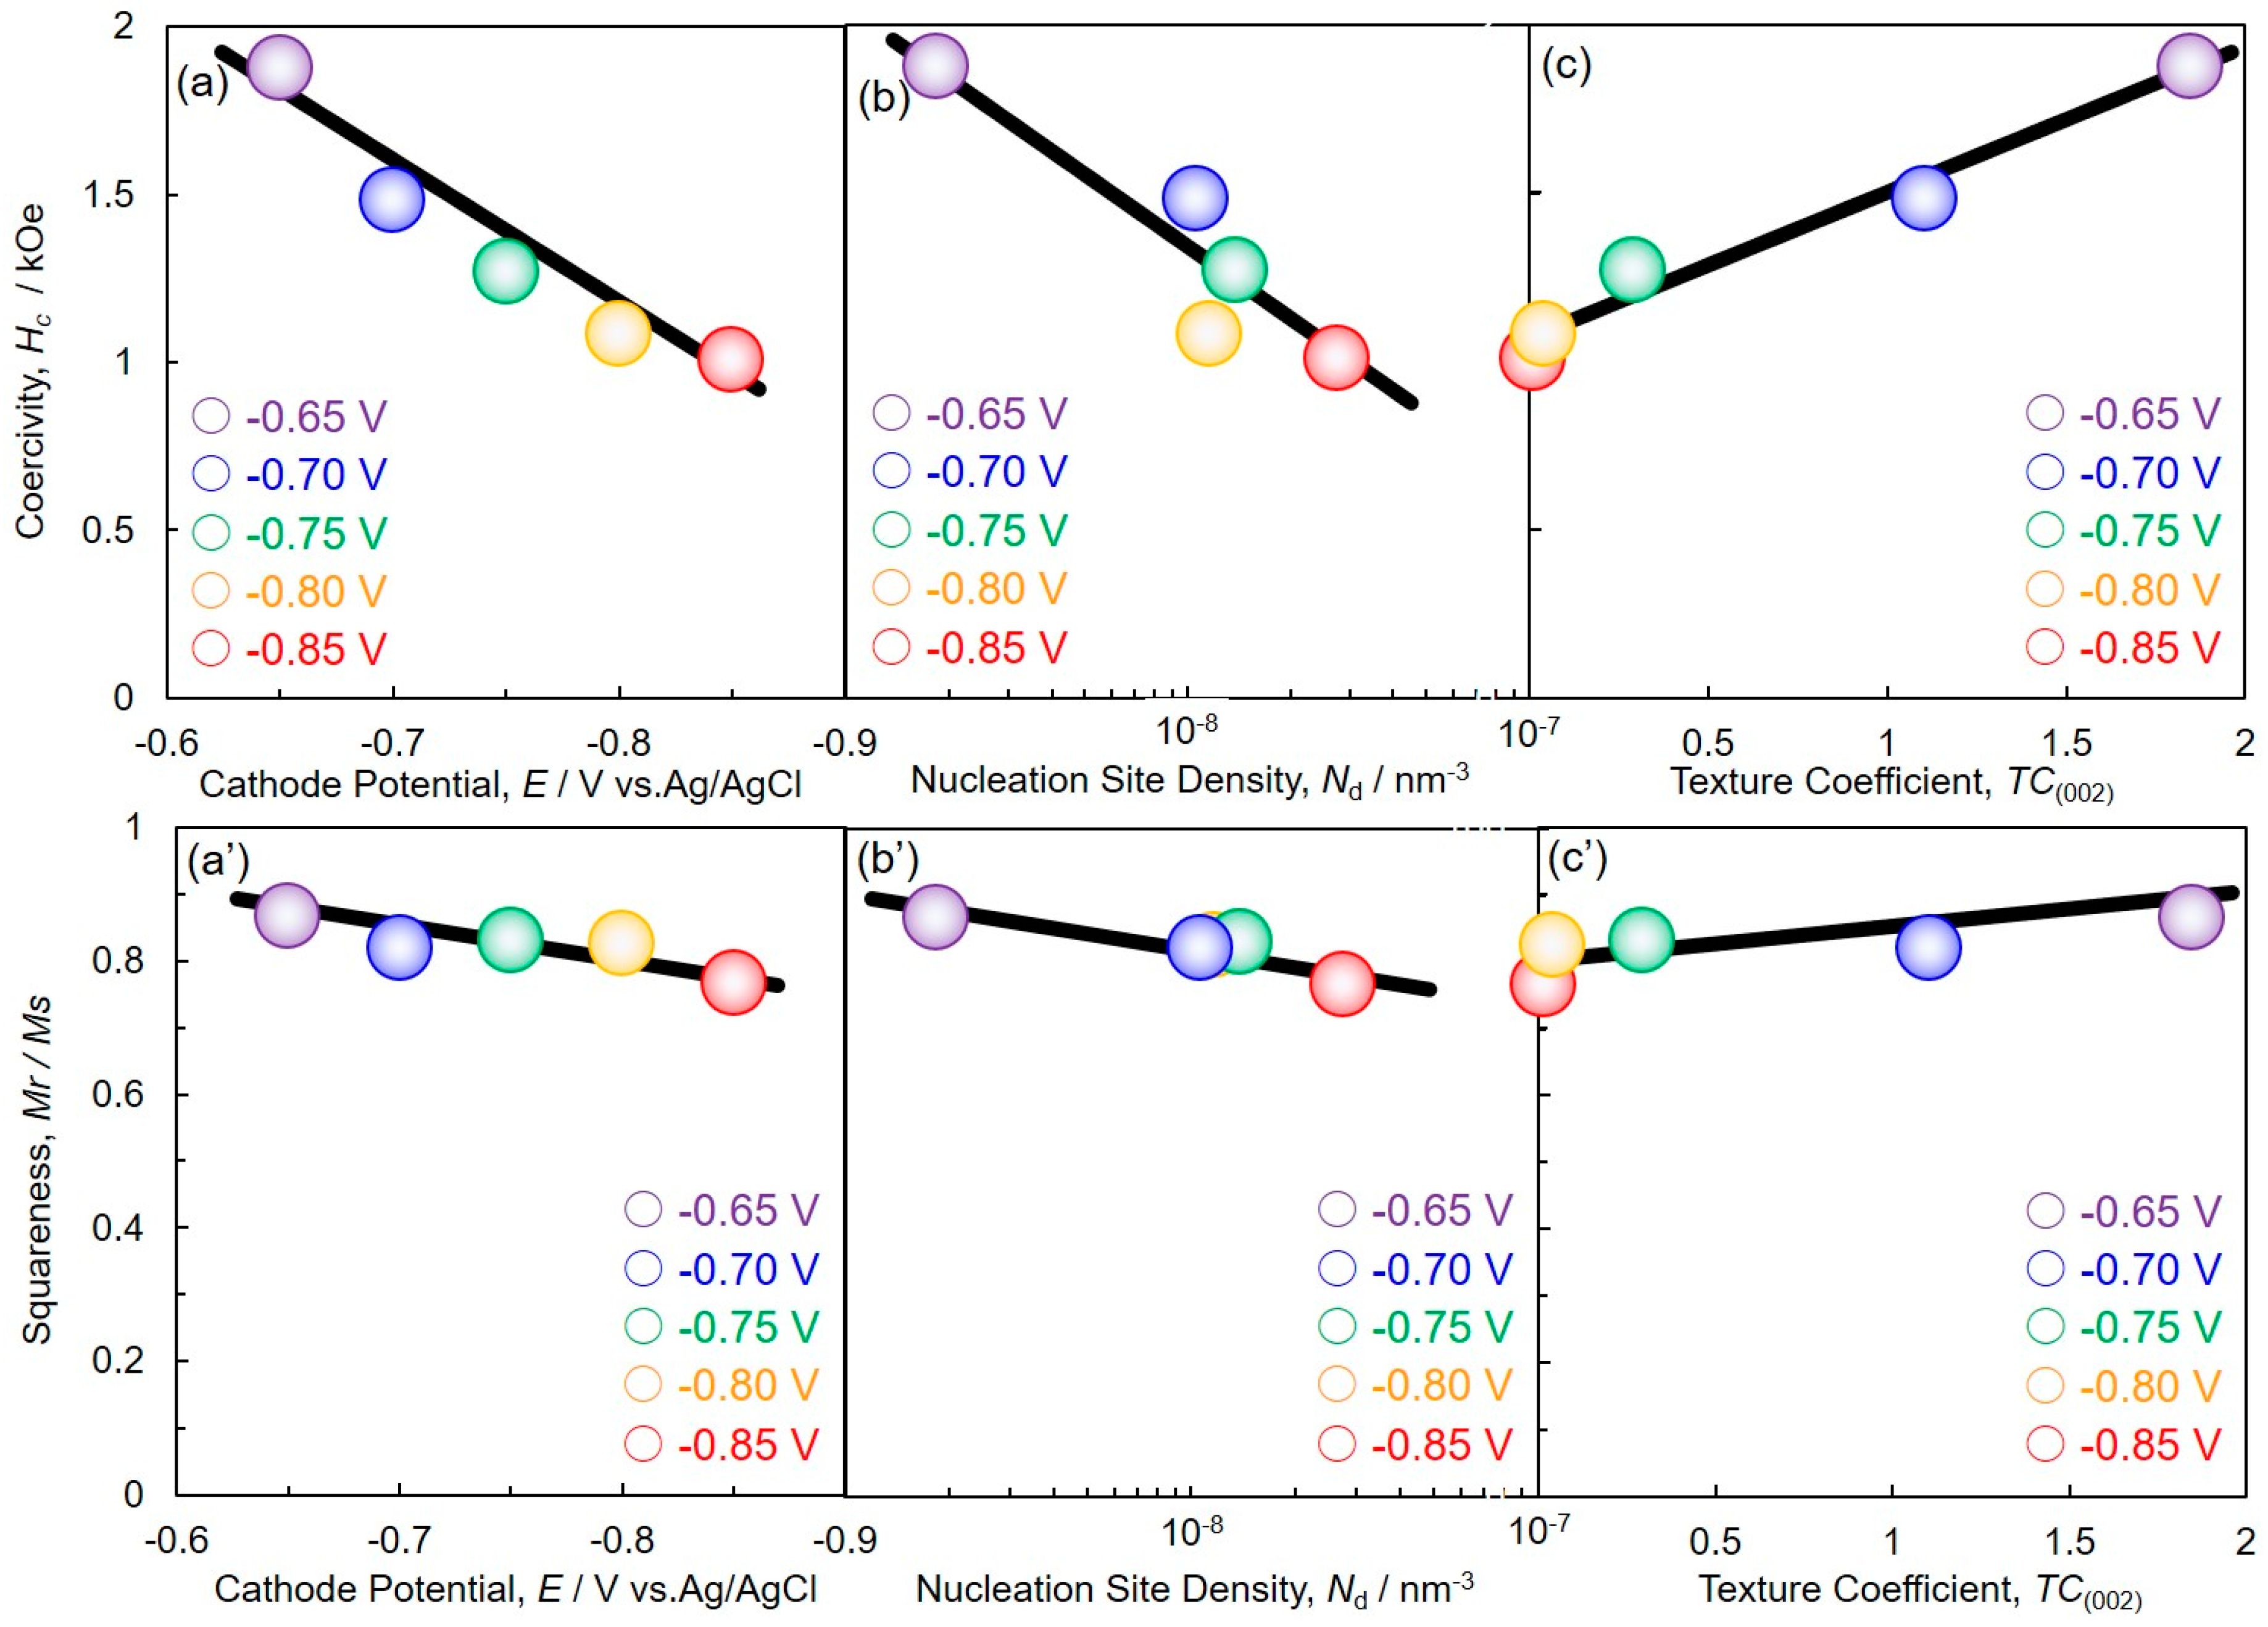
Coercivity and squareness (in the direction perpendicular to the AAO nanochannel film) of the cobalt nanowire array increased with decrease of the overpotential by shifting the cathode potential to the noble direction (Figure 11a,a’). For example, coercivity and squareness of the sample electrodeposited at the cathode potential of −0.85 V were 1.01 kOe and 0.77, respectively. In contrast, these magnetic properties of the sample electrodeposited at the cathode potential of −0.65 V increased up to 1.88 kOe and 0.87, respectively. The coercivity and squareness (in the direction perpendicular to the AAO nanochannel film) increased with a decrease of the nucleation site density of the cobalt nanowires (Figure 11b,b’). Finally, the coercivity and squareness (in the direction of perpendicular to the AAO nanochannel film) increased with an increase of TC(002) (Figure 11c,c’).
Rani et al. synthesized a cobalt nanowire (d = 50 nm, L = 6 µm and L/d = 120) array by using an DC electrodeposition into a polycarbonate membrane. The coercivity of their sample reached ca. 0.26 kOe [8]. Yang et al. synthesized cobalt nanowire arrays by using a pulsed electrodeposition (200 Hz) into the AAO templates (pore diameters = 50 nm, 65 nm and 90 nm) [6]. Their experiment revealed that coercivity and squareness of the sample increased with a decrease of the pore diameter. When the template with pore diameter of 50 nm was used, coercivity and squareness of their samples were 1.42 kOe and 0.20, respectively [6]. In contrast, in our research the obtained cobalt nanowire arrays had perpendicular magnetization performance and their coercivity and squareness reached 1.88 kOe and 0.87, respectively. These values exceeded those reported in other research [6,7,8,12,13,14]. It is thought that the high aspect ratio (ca. 1800) of the cobalt nanowires produced shape magnetic anisotropy. In addition, the c-axis <002> of hcp-Co corresponded with the long axis of the nanowire with the decrease of the growth rate of cobalt nanowires. Therefore, we considered that both the effects of shape anisotropy and magneto-crystalline anisotropy can enhance coercivity and squareness in the direction perpendicular to the AAO nanochannel film.

5. Conclusions

The cobalt nanowire arrays were synthesized by using a potentio-static electrochemical reduction process inside the numerous nanochannels of AAO films. The growth rate of cobalt nanowires was controlled by the cathode potential for cobalt deposition. The time-dependence of electrochemical reduction current during electrodeposition was analyzed by JMAK theory. The crystal growth geometry factor (n) in the JMAK equation was estimated to be ca. 1. When the “site saturation mechanism” is assumed, n = 1 indicates a 1-D growth process. Hence, the electrochemical crystal growth process of the nanowires array can be categorized to 1-D crystal growth. In addition, the crystal nucleation site density, Nd increases up to 2.7 × 10⁻⁸ nm−3 with shifting the cathode potential down to −0.85 V vs. Ag/AgCl.
The X-ray diffraction profiles of the cobalt nanowire arrays revealed that the c-axis <002> of hcp-Co oriented along the long axis of the nanowire when the nucleation site density Nd of cobalt nanowires decreased. The perpendicular magnetization performance of the cobalt nanowire array was enhanced through the corresponding directions of the c-axis of hcp-Co and the long axis of the nanowire. When decreasing Nd down to 1.8 × 10⁻⁹ nm−3 by shifting the cathode potential up to −0.65 V vs. Ag/AgCl, the coercivity and the squareness increased up to 1.88 kOe and 0.87, respectively, at room temperature.

Author Contributions

Experiments, analyzing data and writing the manuscript were mainly carried out by R.S. Designing the study, supervising the project and analyzing the data were mainly conducted by T.O. The final manuscript was read and approved by all authors.

Funding

All authors acknowledge the financial support from the Japan Society for the Promotion of Science (JSPS: 15K06508 and 18H01754), Japan Science and Technology Agency (JST: AS262Z02450K) and IKETANI Science and Technology Foundation (0271040-A).

Conflicts of Interest

The authors have no conflict of interest directly relevant to the content of this article.

Abbreviations

JMAKJohnson–Mehl–Avrami–Kolmogorov
AAOanodized aluminum oxide
SEMscanning electron microscopy
hcphexagonal close packed structure
VSMvibrating sample magnetometer

References

  1. Widmer, J.D.; Martin, R.; Kimiabeigi, M. Electric vehicle traction motors without rare earth magnets. Sustain. Mater. Technol. 2015, 3, 7–13. [Google Scholar] [CrossRef] [Green Version]
  2. Srivastav, A.K.; Shekhar, R. Crystal anisotropy induced temperature dependent magnetization in cobalt nanowires electrodeposited within alumina template. J. Magn. Magn. Mater. 2014, 349, 21–26. [Google Scholar] [CrossRef]
  3. Bazzi, K.; Meka, V.M.; Rathi, A.; Jayaraman, T.V. Influence of temperature on the magnetic properties of nanostructured Fe-49 wt.% Co-2 wt.% V alloy powder synthesized by mechanically milling prealloyed gas-atomized powder. Mater. Chem. Phys. 2019, 227, 36–45. [Google Scholar] [CrossRef]
  4. Chen, W.; Han, M.; Deng, L. High frequency microwave absorbing properties of cobalt nanowires with transverse magnetocrystalline anisotropy. Phys. B 2010, 405, 1484–1488. [Google Scholar] [CrossRef]
  5. Gandha, K.; Elkins, K.; Poudyal, N.; Liu, X.; Liu, J.P. High energy product developed from cobalt nanowires. Sci. Rep. 2014, 4, 5345. [Google Scholar] [CrossRef] [PubMed]
  6. Yang, Y.; Chen, Y.; Wu, Y.; Chen, X.; Kong, M. Diameter-Controllable Magnetic Properties of Co Nanowire Arrays by Pulsed Electrodeposition. J. Nanomater. 2010, 2010, 793854. [Google Scholar] [CrossRef]
  7. Sharma, S.; Barman, A.; Sharma, M.; Shelford, L.R.; Kruglyak, V.V.; Hicken, R.J. Structural and magnetic properties of electrodeposited Cobalt nanowire arrays. Solid State Commun. 2009, 149, 1650–1653. [Google Scholar] [CrossRef]
  8. Rani, V.S.; Anandakumar, S.; Lee, H.; Bang, W.; Hong, K.; Yoon, S.S.; Jeong, J.R.; Kim, C. Structural and magnetic properties of electrodeposited cobalt nanowires in polycarbonate membrane. Phys. Status Solidi A 2009, 206, 667–670. [Google Scholar] [CrossRef]
  9. Ohgai, T.; Fujimaru, T.; Tanaka, Y. Isotropic magnetization response of electrodeposited nanocrystalline Ni–W alloy nanowire arrays. J. Appl. Electrochem. 2014, 44, 301–307. [Google Scholar] [CrossRef]
  10. Ohgai, T.; Washio, R.; Tanaka, Y. Anisotropic magnetization behavior of electrodeposited nanocrystalline Ni-Mo alloy thin films and nanowires array. J. Electrochem. Soc. 2012, 159, H800–H804. [Google Scholar] [CrossRef]
  11. Masuda, H.; Fukuda, K. Ordered metal nanohole arrays made by a two-step replication of honeycomb structures of anodic alumina. Science 1995, 268, 1466–1468. [Google Scholar] [CrossRef] [PubMed]
  12. Shaterabadi, Z.; Soltanian, S.; Koohbor, M.; Salimi, A.; Servati, P. Modification of microstructure and magnetic properties of electrodeposited Co nanowire arrays: A study of the effect of external magnetic field, electrolyte acidity and annealing process. Mater. Chem. Phys. 2015, 160, 389–397. [Google Scholar] [CrossRef]
  13. Zhang, H.; Jia, W.; Sun, H.; Guo, L.; Sun, J. Growth mechanism and magnetic properties of Co nanowire arrays by AC electrodeposition. J. Magn. Magn. Mater. 2018, 468, 188–192. [Google Scholar] [CrossRef]
  14. Garcia, C.; Rosa, W.O.; Garcia, J.; Prida, V.M.; Hernando, B.; López, J.A.; Vargas, P.; Ross, C.A. Magnetization Reversal in Radially Distributed Nanowire Arrays. J. Phys. Chem. C 2018, 122, 5124−5130. [Google Scholar] [CrossRef]
  15. Saeki, R.; Ohgai, T. Effect of growth rate on the crystal orientation and magnetization performance of cobalt nanocrystal arrays electrodeposited from aqueous solution. Nanomaterials 2018, 8, 566. [Google Scholar] [CrossRef] [PubMed]
  16. Saeki, R.; Ohgai, T. Determination of activation overpotential during the nucleation of hcp-cobalt nanowires synthesized by potentio-static electrochemical reduction. Materials 2018, 11, 2355. [Google Scholar] [CrossRef] [PubMed]
  17. Kaur, D.; Chaudhary, S.; Pandya, D.K.; Gupta, R.; Kotnala, R.K. Magnetization reversal studies in structurally tailored cobalt nanowires. J. Magn. Magn. Mater. 2013, 344, 72–78. [Google Scholar] [CrossRef]
  18. Ren, Y.; Liu, Q.F.; Li, S.L.; Wang, J.B.; Han, X.H. The effect of structure on magnetic properties of Co nanowire arrays. J. Magn. Magn. Mater. 2009, 321, 226–230. [Google Scholar] [CrossRef]
  19. Kolomogrov, A. A statistical theory for the recrystallisation of metals. Izv. Akad. Nauk SSSR. Ser. Matem. 1937, 1, 355. [Google Scholar]
  20. Avrami, M. Kinetics of Phase Change. I General Theory. J. Chem. Phys. 1939, 7, 1103–1112. [Google Scholar] [CrossRef]
  21. Avrami, M. Kinetics of Phase Change. II Transformation-Time Relations for Random Distribution of Nuclei. J. Chem. Phys. 1940, 8, 212–224. [Google Scholar] [CrossRef]
  22. Avrami, M. Granulation, Phase Change, and Microstructure Kinetics of Phase Change. III. J. Chem. Phys. 1941, 9, 177–184. [Google Scholar] [CrossRef]
  23. Johnson, W.A.; Mehl, R.F. Reaction Kinetics in Processes of Nucleation and Growth. Trans. AIME 1939, 135, 416–441. [Google Scholar]
  24. Zhou, Y.; Lin, W.; Yang, F.; Fang, W.; Huang, J.; Li, Q. Insights into formation kinetics of gold nanoparticles using the classical JMAK model. Chem. Phys. 2014, 441, 23–29. [Google Scholar] [CrossRef]
  25. Rios, P.R.; Oliveira, V.T.; Pereira, L.O.; Pereira, M.R.; Castro, J.A. Cellular Automata Simulation of Site-saturated and Constant Nucleation Rate Transformations in Three Dimensions. Mater. Res. 2006, 9, 223–230. [Google Scholar] [CrossRef]
  26. Luo, H.; Sietsma, J.; van der Zwaag, S. Effect of Inhomogeneous Deformation on the Recrystallization Kinetics of Deformed Metals. ISIJ Int. 2004, 44, 1931–1936. [Google Scholar] [CrossRef] [Green Version]
  27. Moghadam, M.M.; Voorhees, P.W. Thin film phase transformation kinetics: From theory to experiment. Scr. Mater. 2016, 124, 164–168. [Google Scholar] [CrossRef]
  28. Schlörb, H.; Haehnel, V.; Khatri, M.S.; Srivastav, A.; Kumar, A.; Schultz, L.; Fähler, S. Magnetic nanowires by electrodeposition within templates. Phys. Status Solidi B 2010, 247, 2364–2379. [Google Scholar]
  29. Kaur, D.; Pandya, D.K.; Chaudhary, S. Texture changes in electrodeposited cobalt nanowires with bath temperature. J. Electrochem. Soc. 2012, 159, D713–D716. [Google Scholar] [CrossRef]
  30. Duan, J.; Liu, J.; Cornelius, T.W.; Yao, H.; Mo, D.; Chen, Y.; Zhang, L.; Sun, Y.; Hou, M.; Trautmann, C.; et al. Magnetic and optical properties of cobalt nanowires fabricated in polycarbonate ion-track templates. Nucl. Instr. Meth. Phys. Res. B 2009, 267, 2567–2570. [Google Scholar] [CrossRef]
  31. Pangarov, N.A.; Vitkova, S.D. Preferred orientation of electrodeposited cobalt crystallites. Electrochim. Acta 1966, 11, 1733–1745. [Google Scholar] [CrossRef]
  32. Pangarov, N.A. The crystal orientation of electrodeposited metals. Electrochim. Acta 1962, 7, 139–146. [Google Scholar] [CrossRef]
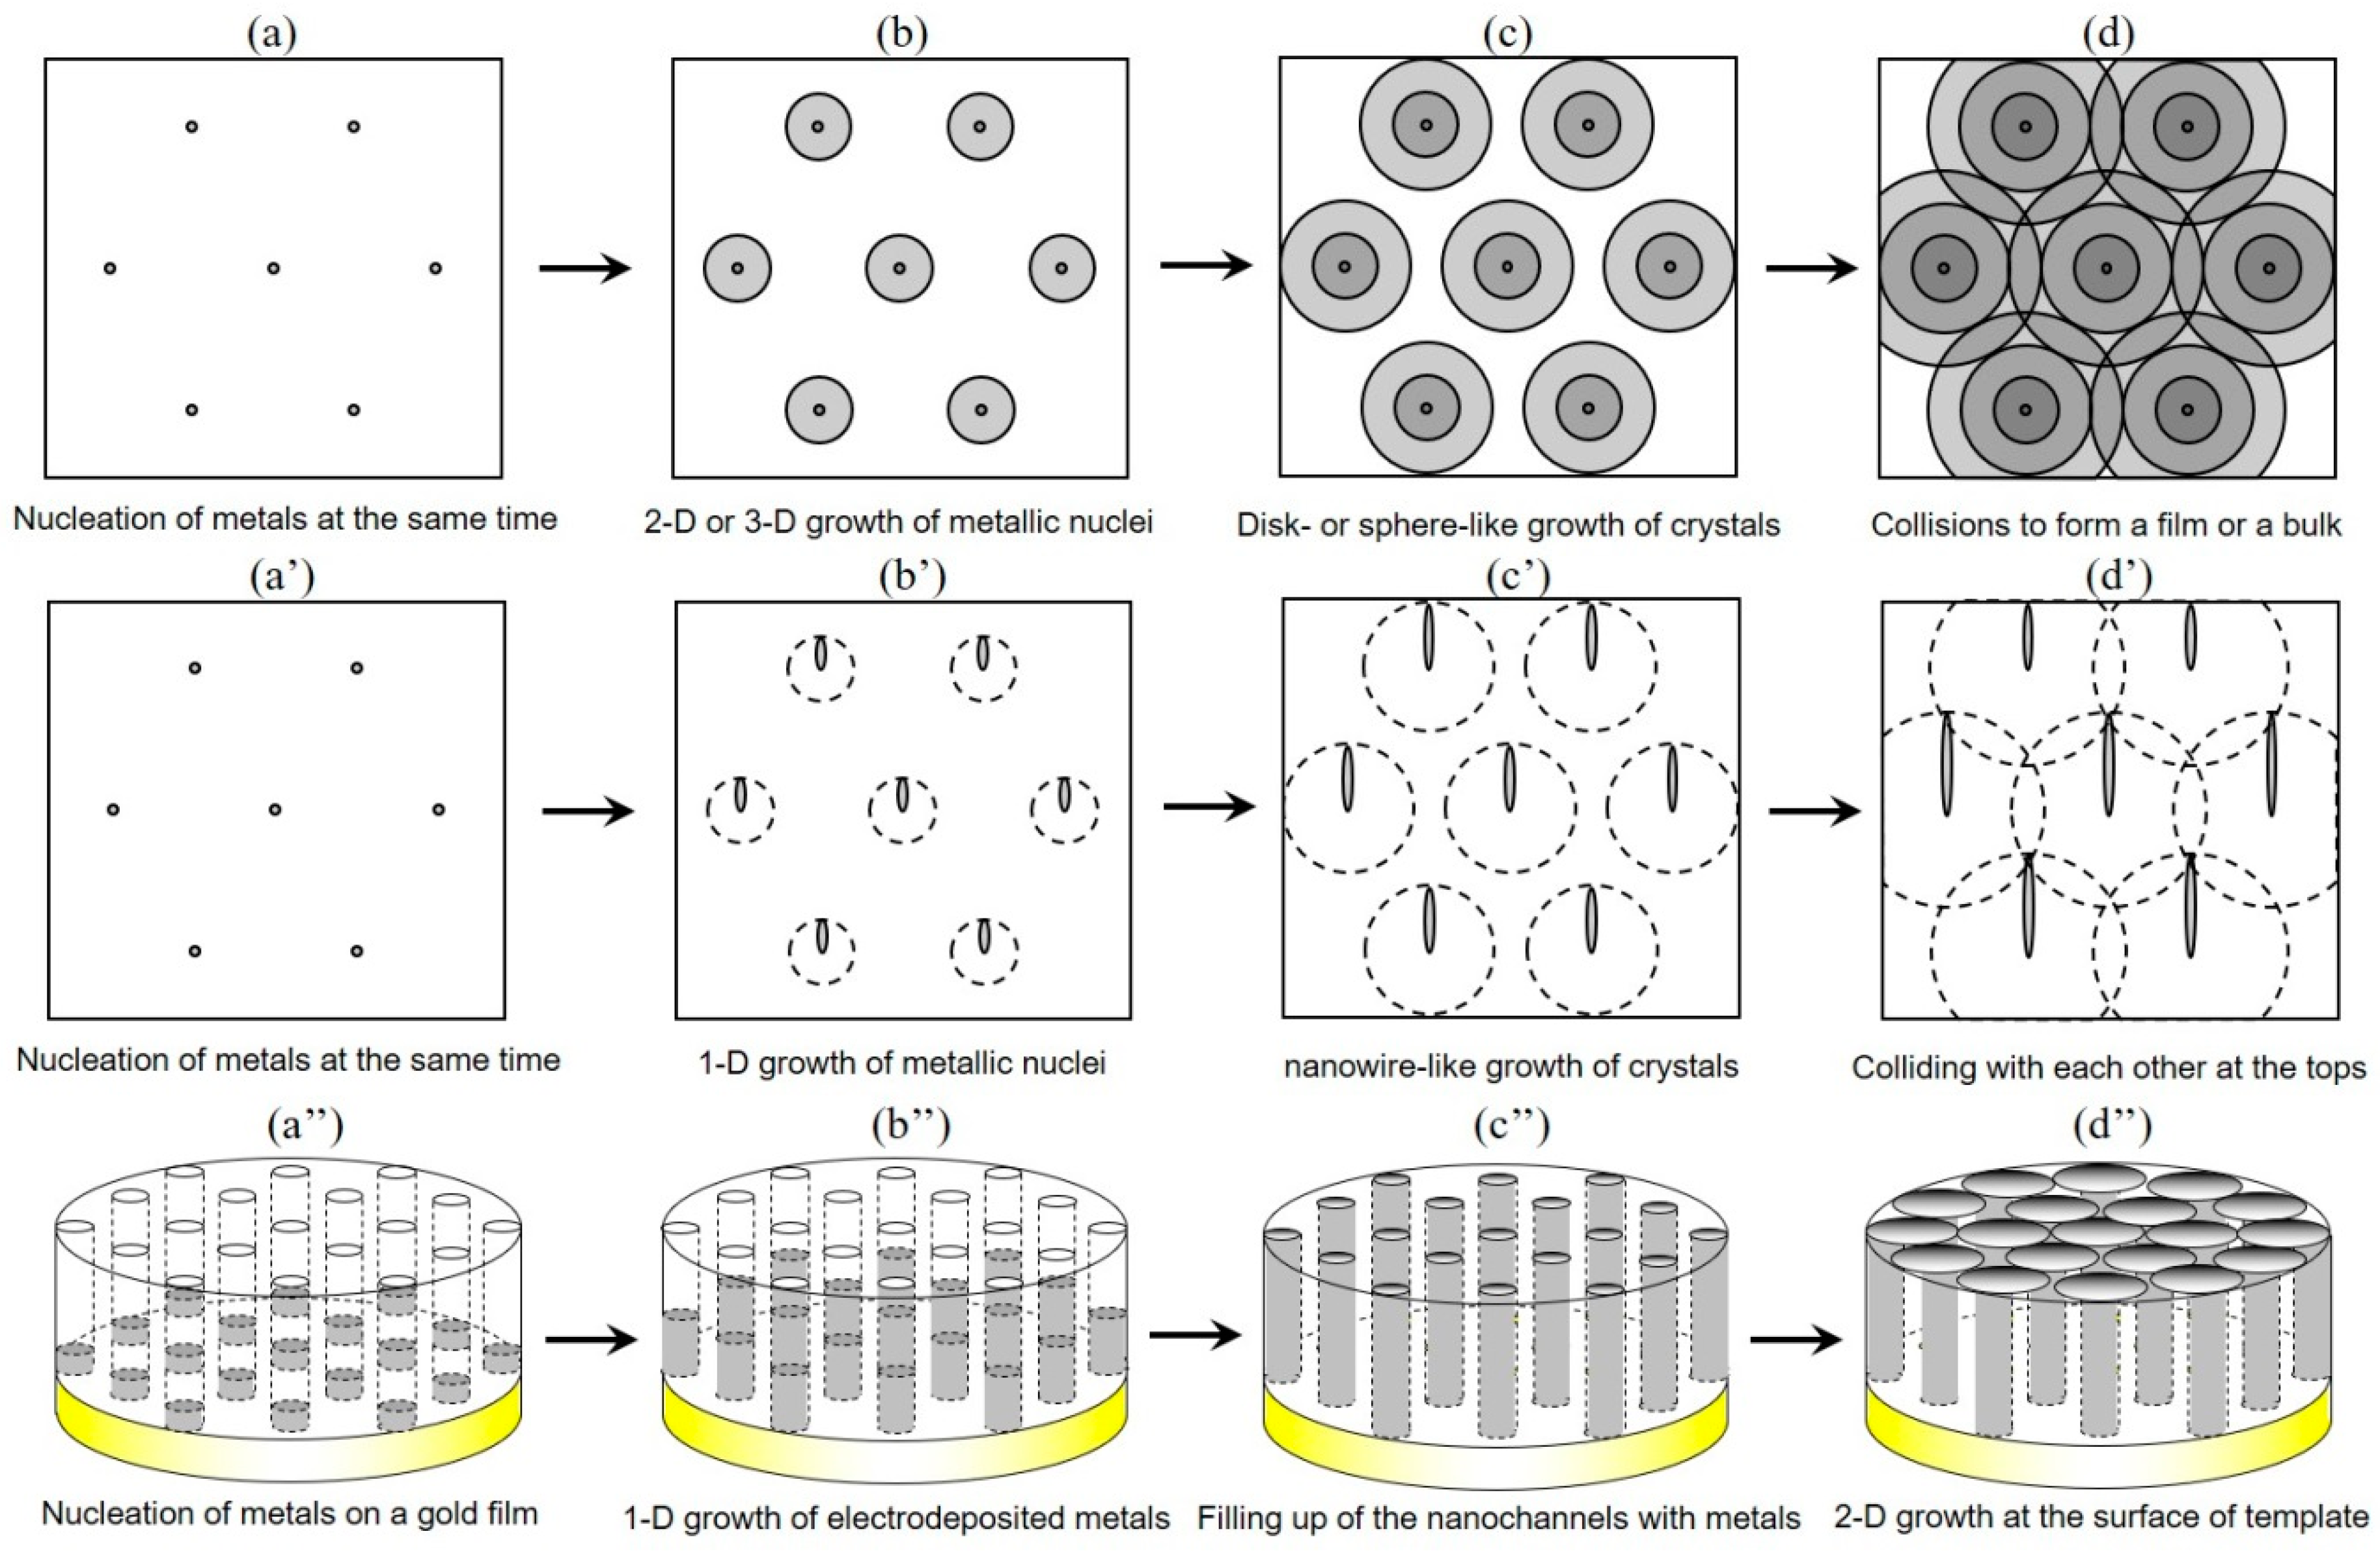
Figure 1. Schematic images of crystal nucleation and 2-D or 3-D growth process based on Johnson–Mehl–Avrami–Kolmogorov (JMAK) theory (ad). 1-D growth process and electrochemical nanowires growth process are also shown in (a’d’) and (a”d”), respectively.
Crystals 09 00142 g001
Figure 2. Theoretical simulation concerning the effect of reaction time on the reaction ratio based on Johnson–Mehl–Avrami–Kolmogorov (JMAK) theory. (a): X = 1 − exp(−ktn), n = 4. (b): −ln(1 − X) = ktn, n = 4. (c): X = 1 − exp(−ktn), k = 10−4. (d): −ln(1 − X) = ktn, k = 10−4.
Crystals 09 00142 g002
Figure 3. Scanning electron microscope (SEM) images of top-surface (a), cross-section (b) and bottom-surface (c) of anodized aluminum oxide nanochannel templates that were anodized at 20 V for 24 h. The electrolytic solution temperature was kept to 2 °C during the anodization.
Crystals 09 00142 g003
Figure 4. Cathode polarization curve for Co electrodeposition from an aqueous solution containing 0.5 M CoCl2 and 0.4 M H3BO3. The solution temperature was kept at 60 °C.
Crystals 09 00142 g004
Figure 5. Time-dependence of cathode current during the electrodeposition of Co nanowires in the nanochannels of anodized aluminum oxide templates. Insets: Effect of the cathode potential and the cathode current density on the growth rate of electrodeposited Co nanowire arrays.
Crystals 09 00142 g005
Figure 6. Shows the double logarithmic plot of −ln(1 − X) vs. t derived from the time-dependence of electrochemical reduction current during the “Step 1” process (a) and the effect of cathode potential on the nucleation site density of electrodeposited Co nanowire arrays (b).
Crystals 09 00142 g006
Figure 7. SEM image (a) and transmission electron microscope (TEM) bright field image (b) of electrodeposited Co nanowires electrodeposited potentio-statically. Co nanowires were separated from an anodized aluminum oxide nanochannel template.
Crystals 09 00142 g007
Figure 8. X-ray diffraction (XRD) patterns of Co nanowire arrays that were electrodeposited at cathode potentials of −0.65 V, −0.70 V, −0.75 V, −0.80 V, and −0.85 V.
Crystals 09 00142 g008
Figure 9. Effect of cathode potential (a), growth rate (b) and nucleation site density (c) on the texture coefficient TC(002) of electrodeposited Co nanowire arrays.
Crystals 09 00142 g009
Figure 10. Magnetic hysteresis loops of Co nanowire arrays that were electrodeposited at each cathode potential ranging from −0.65 V to −0.85 V in the anodized aluminum oxide (AAO) nanochannel films. Magnetic field was applied to the in-plane (dashed lines) and perpendicular (solid lines) directions, with respect to the films.
Crystals 09 00142 g010
Figure 11. Effects of the cathode potential, nucleation site density and texture coefficient on the coercivity and squareness of electrodeposited Co nanowire arrays. Magnetic field was applied to the perpendicular direction with respect to the films.
Crystals 09 00142 g011