Article

Modelling of the Polymorph Nucleation Based on Classical Nucleation Theory

1
Department of Chemical and Materials Engineering, Chang Gung University, Taoyuan 333, Taiwan
2
Department of Urology, Chang Gung Memorial Hospital, Linkou, Taoyuan 333, Taiwan
Crystals 2019, 9(2), 69; https://doi.org/10.3390/cryst9020069
Submission received: 9 January 2019 / Revised: 22 January 2019 / Accepted: 24 January 2019 / Published: 28 January 2019
(This article belongs to the Special Issue Crystal Nucleation Kinetics)

Abstract

:
To elucidate the relative nucleation rates of different polymorphs, a competitive kinetic model is developed based on classical nucleation theory to describe the time evolution of two different polymorphic cluster size distributions controlled by the association and dissociation of the solute molecules during polymorph nucleation. Although there is only one type of the solute molecules, the agglomerated solute clusters are divided into two types–A form and B form, which resemble the structures and morphologies of the different mature polymorphs and eventually lead to the formation of two polymorphic crystals. A dissociation kernel is incorporated into the proposed model to account for gradual dissolution of the solute clusters smaller than a critical nucleus size due to the thermodynamic instability. By fitting the experimental induction period data and the final measured weight fractions of eflucimibe polymorphs with the proposed model, the association and dissociation rate constants for two polymorphs are determined. The developed model is satisfactory to explain the competitive mechanism of polymorph nucleation for eflucimibe that B form dominates at higher supersaturation while A form dominates at lower supersaturation. The results also indicate that A form is more stable than B form with a transition energy of 3.1 kJ/mole at 35 °C.

1. Introduction

A substance capable of crystallizing into different crystalline forms is said to exhibit polymorphism. Polymorphism plays an important role for pharmaceutical products. Different polymorphs of the same substance might lead to different biological activity due to the possibility of conversion among polymorphic forms affecting the dissolution rate [1,2].
Solute molecules in the supersaturated solution can aggregate and form clusters. Clusters can further aggregate to a bigger size or break into some smaller particles due to the thermodynamic instability. When the size of a cluster exceeds a critical size, it becomes stable and the subsequent growth leads to a new crystal [3,4,5]. The existence of solute clusters in the supersaturated solution for the single polymorphic system has been reported by many researchers [6,7,8,9,10]. For the multiple polymorphic system, a general hypothesis is accepted in the literature that the solute molecules in the supersaturated solution assemble to form different polymorphic clusters, which resemble the structures and morphologies of the various mature polymorphs and eventually lead to the formation of multiple polymorphic crystals [11,12]. Recently, Van Driessche et al. [13] observed polymorph nucleation events that are driven by oriented attachments between subcritical clusters of the protein glucose isomerase that already exhibit a degree of crystallinity. Consequently, the relative nucleation rates of different polymorphs should be closely related to the time evolution of multiple polymorphic clusters in nucleation.
Understanding the nucleation and growth mechanisms of polymorphism is crucial to better control of the desired forms during polymorph crystallization [14,15,16,17,18,19,20,21,22,23,24,25,26,27]. Although various nucleation theories for the single polymorphic system have been developed based on either the thermodynamics of the process [4,5] or the kinetics of the process [28,29,30], nucleation theory for the multiple polymorphic system is comparatively less studied in the literature. Hammond et al. [31] used a molecular modeling approach to study the stability of different polymorphic forms of L-glutamic acid through building and optimizing molecular clusters of different sizes and shapes. ter Horst et al. [32] adopted a combination method of molecular simulations and process modeling to predict the polymorphic fraction and crystal size distribution during polymorph crystallization. Deij et al. [33] applied the growth probability method combined with a Monte Carlo routine to simulate polymorph formation for some dimorphic systems.
When multiple polymorphs of the same substance crystallize together out of a solution, the relative productivity of different polymorphs depends on supersaturation, temperature, cooling rate, solvent, agitation, PH, additive, impurity, seeding, etc. Among these factors, supersaturation is of utmost significance [34]. For example, Ni and Liao [35] and Qu et al. [36] indicated for L-glutamic acid that the metastable α crystals are favored at lower supersaturations while the stable β crystals are favored at higher supersaturations. Sun et al. [37] reported that either spontaneously nucleating quiescent aqueous L-glycine solution or nonphotochemical laser-induced nucleation tends to produce the intermediate stable α glycine at lower supersaturations and the most stable γ glycine at higher supersaturations. Gracin and Rasmuson [38] observed for the polymorph nucleation of p-aminobenzoic acid that cooling crystallization can be performed to produce the most stable pure β form in water and in ethyl acetate by careful control of supersaturation and temperature. Teychene and Biscans [39] investigated the nucleation kinetics of two eflucimibe polymorphs by induction time measurements and found that the stable A-form crystals are favored at lower supersaturations while the metastable stable B-form crystals are favored at higher supersaturations. Zhu et al. [40] indicated that the polymorph nucleation of gestodene in ethanol depends on both the supersaturation and crystallization temperature. Roelands et al. [41] and Wantha et al. [42] reported that the metastable polymorph increases with increasing supersaturation for the crystallization of L-histidine from aqueous solution with the antisolvent ethanol.
Stranki and Totomanov [43] attempted an explanation of the Ostwald rule of stages from the corresponding rates of crystal nucleation and argued that the first nucleated phase is the phase that has the lowest free-energy barrier of formation, i.e., the one which has the fastest nucleation rate, rather than the most stable phase; afterwards, the system may undergo a polymorphic form transition toward another metastable phase, or directly to the stable phase. Tahri et al. [44] evaluated the competition between the nucleation, the growth, and the Ostwald ripening of the different phases by means of the kinetic equation model and concluded that Ostwald ripening can induce the total dissolution of the slow growing stable polymorph nuclei, leading to a result in agreement with the Ostwald rule of stages.
As supersaturation plays an important role during polymorph crystallization, understanding the competition between nucleation rates of different polymorphs is crucial for polymorphism control in a supersaturated solution. In the current paper a competitive kinetic model for polymorph nucleation is proposed to elucidate the effects of supersaturation on polymorph selection.

2. Theory

A competitive kinetic model is developed to describe the time evolution of two different polymorphic cluster size distributions in a supersaturated solution, where the simultaneous nucleation of the two polymorphs is controlled by the association and dissociation mechanisms during the induction time period. Although the Ostwald rule of stages postulates that a crystallization system progresses from the supersaturated state to equilibrium in stages, each stage representing the smallest possible change in free energy [4]. In the dimorphic system this means the initial appearance of the metastable crystals, followed by their transformation to the stable crystals. However, in the actual crystallization system kinetics are often more important than thermodynamics. It is in fact, if more than one phase is thermodynamically possible, the resulting phase is not just the one that is thermodynamically most likely. Instead, the resulting crystals are determined by the relative rates of crystal nucleation and growth of the metastable and stable forms, which usually depends on the process conditions, e.g., supersaturation, crystallization temperature, and the solvent type [4,45,46,47].
In derivation of the competitive kinetic model for polymorph nucleation, it is assumed that: (1) Although there is only one type of the solute molecules ( n 1 ) , the solute clusters are divided into two types—A form ( n i , A ,   i 2 ) and B form ( n i , B ,   i 2 ) ; (2) Depending on the steric colliding direction between two solute molecules, two solute molecules can collide to form either an A-type or B-type cluster; (3) Depending on the steric colliding direction, a solute molecule can collide with an A-type cluster to form a larger A-type cluster or collide with a B-type cluster to form a larger B-type cluster; (4) Only two solute clusters of the same type can collide to form a larger solute cluster of the same type, i.e., the collision between A-type clusters and B-type clusters results in no formation of a larger solute cluster due to the structure difference; (5) A solute cluster smaller than the critical nucleus size for n i , A ( 2 i g A 1 ) or n i , B ( 2 i g B 1 ) might dissociate to form one primary particle and one smaller solute cluster of the same type due to the thermodynamic instability; (6) As the size of a cluster exceeds the critical nucleus size for n i , A ( i g A ) or n i , B ( i g B ) , it becomes stable and no dissociation occurs. The subsequent growth leads to a new crystal of the same type.
Various association and dissociation processes are depicted in simplified form in Table 1. The time evolution of n 1 , n i , A ( i 2 ) and n i , B ( i 2 ) for polymorph nucleation in a super saturation solution can be derived as follows. Note that n 1 , A = n 1 , B = n 1 due to only one type of the solute molecules. Based on Smoluchowski’s agglomeration theory [48,49], the net formation rate of n 1 , n i , A   ( i 2 ) , and n i , B   ( i 2 ) , by association can be described respectively as:
RA 1 = k A n 1 ( n 1 + n t , A ) k B n 1 ( n 1 + n t , B )
RA i , A = k A n i , A ( n 1 + n t , A ) + 1 2 k A j = 1 i 1 n j , A n i j , A ( i 2 )
RA i , B = k B n i , B ( n 1 + n t , B ) + 1 2 k B j = 1 i 1 n j , B n i j , B ( i 2 )
where k A and k B represents the association rate constant of A-type clusters and B-type clusters, respectively. Note that n t , A = i = 2 n i , A and n t , B = i = 2 n i , B .
According to classical nucleation theory (CNT) [4,5], a cluster becomes stable when its size reaches the critical nucleus size. Thus, dissociation only occurs for n i , A ( 2 i g A 1 ) or n i , B ( 2 i g B 1 ) . As similar to the solute clustering process in a supersaturation solution [50], gradual dissociation kernel is proposed in this work. For gradual dissociation kernel, one large aggregate, n i , A ( 2 i g A 1 ) , dissociates into one primary particle, n 1 , and one smaller aggregate, n i 1 , A . Similar dissociation process is applied for n i , B ( 2 i g B 1 ) . Thus, gradual dissociation kernel corresponds to gradual dissolution of the solute clusters smaller than a critical nucleus size due to the thermodynamic instability.
The net formation rate of n 1 by dissociation for gradual disruption kernel is given by
RD 1 = 2 k dA , 2 n 2 , A + 2 k dB , 2 n 2 , B + j = 3 g A 1 k dA , j n j , A + j = 3 g B 1 k dB , j n j , B
where the first and second terms on the right-hand side of Equation (4) represent the birth term due to dissociation of n 2 , A and n 2 , B while the third and fourth terms represent the birth term due to dissociation of n j , A ( 3 j g A 1 ) and n j , B ( 3 j g B 1 ) . In this work, k dA , j = k dA 0 ( j 1 ) and k dB , j = k dB 0 ( j 1 ) are assumed due to more molecules available for dissociation for larger clusters.
As dissociation occurs for n i , A ( 2 i g A 1 ) , the net formation rate of n i , A ( i 2 ) by dissociation can be described as
RD i , A = k dA , i n i , A + k dA , i + 1 n i + 1 , A ( 2 i g A 2 )
RD i , A = k dA , i n i , A ( i = g A 1 )
RD i , A = 0 ( i g A )
Note that no dissociation occurs for n i , A ( i g A ) . Similarly, as dissociation occurs for n i , B ( 2 i g B 1 ) , RD i , B ( 2 i g B 1 ) can be derived. Note that no dissociation occurs for n i , B ( i g B ) .
To determine the time evolution of n 1 , n i , A ( i 2 ) , and n i , A ( i 2 ) , the net formation rate by both association and dissociation should be considered. Thus, one obtains
dn 1 d t = RA 1 + RD 1
dn i , A d t = RA i , A + RD i , A ( i 2 )
dn i , B d t = RA i , B + RD i , B ( i 2 )
Substituting Equations (1,4) into Equation (8) yields
dn 1 d t = k A n 1 ( n 1 + n t , A ) k B n 1 ( n 1 + n t , B ) + 2 k dA , 2 n 2 , A + 2 k dB , 2 n 2 , B + j = 3 g A 1 k dA , j n j , A + j = 3 g B 1 k dB , j n j , B
Substituting Equations (2,5–7) into Equation (9) yields
dn i , A d t = k A n i , A ( n 1 + n t , A ) + 1 2 k A j = 1 i 1 n j , A n i j , A k dA , i n i , A + k dA , i + 1 n i + 1 , A ( 2 i g A 2 )
dn i , A d t = k A n i , A ( n 1 + n t , A ) + 1 2 k A j = 1 i 1 n j , A n i j , A k dA , i n i , A ( i = g A 1 )
dn i , A d t = k A n i , A ( n 1 + n t , A ) + 1 2 k A j = 1 i 1 n j , A n i j , A ( i g A )
Summing Equations (12–14) from i = 2 to yields
dn t , A d t = k A i = 2 n i , A ( n 1 + n t , A ) + 1 2 k A i = 2 j = 1 i 1 n j , A n i j , A k dA , 2 n 2 , A = k A n t , A ( n 1 + n t , A ) + 1 2 k A ( n 1 + n t , A ) 2 k dA , 2 n 2 , A = 1 2 k A ( n 1 2 n t , A 2 ) k dA , 2 n 2 , A
where i = 2 j = 1 i 1 n j , A n i j , A = ( n 1 + n t , A ) 2 (see Equation (A1) in Appendix A). Multiplying Equations (14) by i and summing the resulting equation from i = g A to yields (see Equation (A2) in Appendix A)
dM C , A dt = k A ( i = g A in i , A ) ( n 1 + n t , A ) + 1 2 k A i = g A i j = 1 i 1 n j , A n i j , A = k A M C , A ( n 1 + n t , A ) + 1 2 k A [ 2 ( n 1 + n t , A ) ( n 1 + i = 2 g A 1 in i , A + M C , A ) i = 2 g A 1 i j = 1 i 1 n j , A n i j , A ] = k A ( n 1 + n t , A ) ( n 1 + i = 2 g A 1 in i , A ) 1 2 k A i = 2 g A 1 i j = 1 i 1 n j , A n i j , A
where M C , A = i = g A in i , A .
Similarly, one can derive
dn i , B d t = k B n i , B ( n 1 + n t , B ) + 1 2 k B j = 1 i 1 n j , B n i j , B k dB , i n i , B + k dB , i + 1 n i + 1 , B ( 2 i g B 2 )
dn i , B d t = k B n i , B ( n 1 + n t , B ) + 1 2 k B j = 1 i 1 n j , B n i j , B k dB , i n i , B ( i = g B 1 )
dn i , B d t = k B n i , B ( n 1 + n t , B ) + 1 2 k B j = 1 i 1 n j , B n i j , B ( i g B )
Summing Equations (17–19) from i = 2 to yields
dn t , B d t = 1 2 k B ( n 1 2 n t , B 2 ) k dB , 2 n 2 , B
Multiplying Equations (19) by i and summing the resulting equation from i = g B to yields
dM C , B dt = k B ( n 1 + n t , B ) ( n 1 + i = 2 g B 1 in i , B ) 1 2 k B i = 2 g B 1 i j = 1 i 1 n j , B n i j , B
where M C , B = i = g B in i , B .
When solutes exist as free molecules initially, n 1 ( 0 ) = C 0 , n i , A ( 0 ) = n i , B ( 0 ) = 0 ( i 2 ) , n t , A ( 0 ) = n t , B ( 0 ) = 0 , and M C , A ( 0 ) = M C , B ( 0 ) = 0 . Thus, Equations (11–13, 15–18, 20, 21) constitute of a set of g A + g B + 1 differential equations that can be simultaneously solved for the time evolution of g A + g B + 1 unknowns— n 1 , n i , A ( 2 i g A 1 ) , n t , A , n i , B ( 2 i g B 1 ) , n t , B , M C , A and M C , B .
The induction time is defined as the time at which the volume fraction of the newly formed solid phase in solutions becomes detectable [4]. For simplicity, the minimum detectable volume fraction of the newly formed solid phase, f V , at the induction time is assumed corresponding to the total volume fraction of stable A-type and B-type clusters. As n i , A ( i g A ) and n i , B ( i g B ) represents the number concentration of stable A-type and B-type clusters, respectively, one obtains
At
t = t ind , V m ( M C , A + M C , B ) = f V
where V m denotes the volume of a solute molecule. As V m M C , A and V m M C , B represents the volume fraction of stable A-type and B-type clusters in solutions, respectively, the weight fraction of the stable A-type crystals at the induction time is defined as
At
t = t ind , w A = M C , A M C , A + M C , B
Note that f V depends on the measurement device and on the substance. Based on the study of 28 inorganic systems, Mersmann and Bartosch [51] estimated f V = 10 4 10 3 . As the intermediate value, f V = 4 × 10 4 , was adopted at the detection of the nucleation point for the Lasentec focus beam reflectance measurements reported by Lindenberg and Mazzotti [52] and for the turbidity measurements reported by Shiau and his coworkers [53,54,55], this value is also adopted in this study.
The proposed model is applied to the polymorph nucleation based on CNT. However, for the two-step mechanism of nucleation, nucleation is thought to consist of two steps in series, i.e., the formation of the dense liquid clusters in solutions followed by the formation of the crystalline nucleus inside the dense liquid clusters [56]. Thus, the derivation above is not applicable to the two-step mechanism of nucleation.

3. Results and Discussion

The experimental results for eflucimibe polymorph nucleation reported by Teychene and Biscans [39] are illustrated to verify the developed model. Eflucimibe is a new drug inhibiting acyl-coenzyme A: cholesterol acyltransferase (ACAT), an enzyme which inhibition may lead to lower serum cholesterol concentration. Eflucimibe crystallizes from a mixture of ethanol and n-heptane into two polymorphic forms—A form and B form. A form is the stable form while B form is the metastable form. These two forms have different solubilities and interfacial energies. The experimental induction time data and the final measured weight fractions of eflucimibe polymorphs for various supersaturation at 35   ° C are listed in Table 2.
Based on CNT, critical nucleus sizes for A-type and B-type clusters can be respectively estimated as [4,5,57,58]
g A = 32 π V m 2 γ A 3 3 ( k B T   lnS A ) 3
g B = 32 π V m 2 γ B 3 3 ( k B T   lnS B ) 3
In Table 2, g A and g B are the closest integers calculated for each S A based on γ A = 5.17 erg / cm 2 and γ B = 4.23 erg / cm 2 , respectively. Note that both g A and g B decrease with increasing S A . The following values at 35   ° C are used in the calculations: ρ c = 1.3 g / cm 3 , C eq , A = 2.12 × 10 19 molecule / cm 3 , C eq , B = 2.38 × 10 19 molecule / cm 3 , S B = S A / 1.123 , M w = 469.73 and V m = 1.59 × 10 22 cm 3 / molecule . In Table 2 C 0 represent the initial concentration of solutes for each S A calculated from S A = C 0 / C eq , A .
By fitting the experimental induction time data and measured weight fractions of eflucimibe polymorphs with the proposed model, the following regression procedure is adopted to determine four parameters— k A , k B , k dA 0 and k dB 0 : (1) guess a set of k A , k B , k dA 0 and k dB 0 ; (2) determine the time evolution of n 1 , n i , A ( 2 i g A 1 ) , n t , A , n i , B ( 2 i g B 1 ) , n t , B , M C , A and M C , B for each S A by solving Equations (11–13, 15–18, 20, 21) simultaneously; (3) calculate t ind , the , at which it leads to V m ( M C , A + M C , B ) = f V , based on Equations (22) for each S A ; (4) calculate W A , the at t ind , exp based on Equation (23) for each S A ; (5) calculate ε t from Equation (26); (6) calculate ε w from Equation (27).
The average relative deviation between the experimental and theoretical induction time is defined as
ε t = 1 H j = 1 H | t ind , the , j t ind , exp , j | t ind , exp , j
where H is the number of the experimental runs, t ind , exp is the induction time measured during the experiments, and t ind , the is the induction time calculated from Equation (22).
As shown in Table 2, pure A form is crystallized at low supersaturation and pure B form is crystallized at high supersaturation while a mixture of A form and B form is crystallized at intermediate supersaturation. For simplicity, the weight fractions of A-form eflucimibe measured at the end of the experiments are assumed close to the weight fractions of A-form eflucimibe nucleated at the induction time. The average relative deviation between the experimental and theoretical weight fraction of A-type crystals at the induction time is defined as
ε w = 1 H j = 1 H | W A , the , j W A , exp , j | W A , exp , j
where w A , exp is the weight fractions of A-form eflucimibe measured at the end of the experiments, and w A , the is the weight fractions of A-form eflucimibe calculated from Equation (23).
It should be noted in the regression procedure that, for any guessed values of k A , k B , k dA 0 and k dB 0 , a set of 184 differential equations for S A = 1.86 ( g A = 91 ,   g B = 92 ) need to be simultaneously solved for the time evolution of n 1 , n i , A ( 2 i 90 ) , n t , A , n i , B ( 2 i 91 ) , n t , B , M C , A and M C , B . However, as supersaturation is increased to S A = 3.4 ( g A = 12 ,   g B = 9 ) , only a set of 22 differential equations need to be simultaneously solved for the time evolution of n 1 , n i , A ( 2 i 11 ) , n t , A , n i , B ( 2 i 8 ) , n t , B , M C , A and M C , B .
By repeating the regression procedure from (1) to (6), the optimal values of k A , k B , k dA 0 and k dB 0 with the smallest sum of ε t and ε w are determined based on f V = 4 × 10 4 in Table 3, which indicates k A = 7.7 × 10 22 cm 3 / s , k B = 1.4 × 10 21 cm 3 / s , k dA 0 = 5.3 × 10 4 s 1 and k dB 0 = 3.2 × 10 3 s 1 , leading to k B k A = 2 and k dB 0 k dA 0 = 6 . Thus, one obtains k B > k A and k dB 0 > k dA 0 .
Due to the different activation energy for bonding between solute molecules, the association rate constants for A-type and B-type clusters can be expressed respectively as
k A = k 0 exp [ ( E A * E 0 ) RT ]
k B = k 0 exp [ ( E B * E 0 ) RT ]
where exp [ ( E A * E 0 ) RT ] and exp [ ( E B * E 0 ) RT ] represents the fraction of the successful collisions which overcomes the activation energy of association for A-type and B-type clusters, respectively. The collision rate constant, k 0 , is proportional to the diffusivity for solute clusters in a supersaturated solution [4]. Combining Equations (28–29) yields
k B k A = exp [ ( E A * E B * ) RT ]
Substituting the optimal values of k A and k B at 35   ° C into Equation (30) yields E A * E B * = 1.5 kJ / mole . Thus, we conclude E A * > E B * for association.
The dissociation rate constants for A-type and B-type clusters can be expressed respectively as
k dA 0 = k d 0 exp [ ( E A * E A ) RT ]
k dB 0 = k d 0 exp [ ( E B * E B ) RT ]
where the dissociation frequency factor, k d 0 , mainly depends on the solution property. Combining Equations (32–33) yields
k dB 0 k dA 0 = exp [ ( E A * E B * ) + ( E B E A ) RT ]
As E A * E B * = 1.5 kJ / mole , substituting the optimal values of k dA 0 and k dB 0 at 35   ° C into Equation (33) yields E B E A = 3.1 kJ / mole . Thus, it yields E B > E A , which is consistent with the literature that form A is more stable than form B [39]. Based on the results using Equations (30,33), the change in potential energy during polymorph crystallization is plotted in Figure 1.
Based on the optimal values of k A , k B , k dA 0 and k dB 0 in Table 3, Figure 2 shows comparison of t ind , the and t ind , exp for various S A , where t ind , the is calculated from Equation (22) using the time evolution M C , A and M C , B . The dashed line represents the calculated t ind , the while the solid circle represents the experimental t ind , exp . It is found that t ind , the and t ind , exp decreases with increasing S A as both g A and g B decrease with increasing   S A .
Figure 3 shows comparison of W A , exp and W A , the at the end of the experiments for various S A , where W A , the is calculated from Equation (23) using the time evolution M C , A and M C , B . The dashed line represents the calculated W A , the while the solid circle represents the experimental W A , exp . It is found that W A , exp and W A , the decreases with increasing S A . These results can be attributed to k B > k A and k dB 0 > k dA 0 . At higher S A due to smaller critical nucleus size and shorter induction time, association rate among n 1 , n i , A ( 2 i g A 1 ) , and n i , B ( 2 i g B 1 ) plays a more important role than dissociation rate for n i , A ( 2 i g A 1 ) and n i , B ( 2 i g B 1 ) in nucleation. As k B > k A , it is easier for the metastable B-form to grow to smaller critical nucleus size at higher S A . Thus, nucleation of the metastable B-form dominates at higher S A , leading to M C , B > M C , A and w B > w A at the end of the experiments. However, at lower S A due to greater critical nucleus size and longer induction time, dissociation rate becomes important for n i , A ( 2 i g A 1 ) and n i , B ( 2 i g B 1 ) in nucleation. As k dB 0 > k dA 0 , it becomes more difficult for the metastable B-form to grow to larger critical nucleus size at lower S A . Subsequently, nucleation of the stable A-form dominates at lower S A , leading to M C , A > M C , B and w A > w B at the end of the experiments. As displayed in Figure 2 and Figure 3, the fourteen experimental data points are fitted well to the corresponding calculated results by the developed model using the optimal values of k A , k B , k dA 0 and k dB 0 .
The following time evolution of n 1 , n i , A ( 2 i g A 1 ) , n t , A , n i , B ( 2 i g B 1 ) , n t , B , M C , A and M C , B are calculated based on the optimal values of k A , k B , k dA 0 and k dB 0 in Table 3. For example, a set of 184 differential equations for S A = 1.86 ( g A = 91 , g B = 92 ) are simultaneously solved for the time evolution of n 1 , n i , A ( 2 i 90 ) , n t , A , n i , B ( 2 i 91 ) , n t , B , M C , A and M C , B . Similarly, a set of 22 differential equations for S A = 3.4 ( g A = 12 , g B = 9 ) are simultaneously solved for the time evolution of n 1 , n i , A ( 2 i 11 ) , n t , A , n i , B ( 2 i 8 ) , n t , B , M C , A and M C , B .
The variations of n 1 , n 2 , A , n 2 , B , n 3 , A , n 3 , B , n t , A and n t , B with increasing time are displayed for various S A in Figure 4, where n 1 decreases monotonically with increasing time; however, n 2 , A , n 2 , B , n 3 , A , n 3 , B , n t , A and n t , B passes through a maximum at certain time and then declines slowly for each S A . A general trend is observed for various S A that, although n 1 is significantly greater than n 2 , A , n 2 , B , n 3 , A and n 3 , B for 0 < t < 0.1   t ind , n 2 , A , n 2 , B , n 3 , A and n 3 , B become not negligible compared to n 1 for t > 0.1   t ind . Thus, as n 1 dominates in the earlier stage of nucleation, association between two solute clusters of the same type, n j , A   ( j 2 ) or n j , B   ( j 2 ) , is nearly negligible for 0 < t < 0.1   t ind . However, such association between two solute clusters of the same type becomes significant in the later stage of nucleation for t > 0.1   t ind . In Figure 4, n 1 / C 0 is decreased to 0.04 at t ind = 80   s for S A = 3.4 ; n 1 / C 0 is decreased to 0.02 at t ind = 1614 s for S A = 2.5 ; n 1 / C 0 is decreased to 0.01 at t ind = 28000   s for S A = 1.86 . Thus, n 1 / C 0 at t ind becomes smaller for a lower S A due to longer induction time available for association.
The variations of M C , A and M C , B with increasing time are displayed for various S A in Figure 5, where M C , A and M C , B increases monotonically with increasing time for each S A . For S A = 1.86 1.97 , M C , A is significantly greater than M C , B at t ind , leading to w A , the = 1 at t ind based on Equation (23), which is consistent with w A , exp = 0.96 0.97 in Table 2. Note that M C , B / C 0 remains nearly zero in the range 0 t ind . Thus, nearly only form A is obtained at the end of experiments. For S A 2.3 , M C , B becomes significant compared to M C , A at t ind . For example, M C , A is only slightly than M C , B at t ind for S A = 2.5 , leading to w A , the = 0.55 at t ind based on Equation (23), which is close to w A , exp = 0.64 in Table 2. Thus, form A is slightly more than form B at the end of experiments. For S A = 2.7 , M C , B becomes greater than M C , A at t ind , leading to w A , the = 0.33 at t ind based on Equation (23), which is consistent with w A , exp = 0.33 in Table 2. Thus, form B is more than form A at the end of experiments. For S A = 3.4 , M C , B is significantly greater than M C , A at t ind , leading to w A , the = 0 at t ind based on Equation (23), which is consistent with w A , exp = 0 in Table 2. Note that M C , A / C 0 remains nearly zero in the range 0 t ind . Thus, nearly only form B is obtained at the end of experiments.

4. Conclusions

A competitive kinetic model for polymorph nucleation is developed in this work to describe the time evolution of two different polymorphic cluster size distributions in a supersaturated solution. By fitting the experimental induction time data and measured weight fractions of eflucimibe polymorphs with the proposed model, the association and dissociation rate constants for two polymorphs are determined, leading to k A = 7.7 × 10 22 cm 3 / s , k B = 1.4 × 10 21 cm 3 / s , k dA 0 = 5.3 × 10 4 s 1 and k dB 0 = 3.2 × 10 3 s 1 . Thus, one obtains k B k A = 2 and k dB 0 k dA 0 = 6 , leading to E A * E B * = 1.5 kJ / mole and E B E A = 3.1 kJ / mole . This is consistent with Ostwald’s rule of stages that the metastable B-form tends to crystallize out more easily than the stable A-form due to E A * > E B * while the stable A-form has a lower potential energy than the metastable B-form due to E B > E A .
Supersaturation is crucial in the polymorph selection for nucleation of eflucimibe. Association rate plays a more important role than dissociation rate at higher supersaturation due to smaller critical nucleus size and shorter induction period. As k B > k A , it is easier for the metastable B-form to grow to smaller critical nucleus size at higher supersaturation. Thus, nucleation of the metastable B-form dominates at higher supersaturation, leading to w B > w A at the end of the experiments. However, dissociation rate becomes important at lower supersaturation due to larger critical nucleus size and longer induction period. As k dB 0 > k dA 0 , it becomes more difficult for the metastable B-form to grow to larger critical nucleus size at lower supersaturation. Subsequently, nucleation of the stable A-form dominates at lower supersaturation, leading to w A > w B at the end of the experiments. These findings are consistent with the experimental results obtained by Teychene and Biscans [39], indicating that the metastable B-form dominates at higher supersaturation while the stable A-form dominates at lower supersaturation.

Funding

This research was funded by Chang Gung Memorial Hospital (CMRPD2G0242) and Ministry of Science and Technology of Taiwan (MOST107-2221-E-182-031).

Acknowledgments

The author would like to thank Chang Gung Memorial Hospital (CMRPD2G0242) and Ministry of Science and Technology of Taiwan (MOST107-2221-E-182-031) for financial support of this research.

Conflicts of Interest

The authors declare no conflict of interest.

Notation

C 0 = initial concentration of solutes (molecules/cm3)
C eq = saturated concentration of solutes (molecules/cm3)
E 0 = potential energy of the solute molecules (kJ/mole)
E A = potential energy of A-type crystals (kJ/mole)
E B = potential energy of B-type crystals (kJ/mole)
E A * = activation energy for the association between A-type solute clusters (kJ/mole)
E B * = activation energy for the association between B-type solute clusters (kJ/mole)
g A = critical nucleus size of A-type crystals (dimensionless)
g B = critical nucleus size of B-type crystals (dimensionless)
k A = association rate constant of A-type clusters (cm3/s)
k B = association rate constant of B-type clusters (cm3/s)
k 0 = collision rate constant (cm3/s)
k d 0 = dissociation frequency factor (cm3/s)
k dA , j = dissociation rate constant of n j , A (1/s)
k dA 0 = dissociation rate coefficient of A-type clusters (1/s)
k dB , j = dissociation rate constant of n j , B (1/s)
k dB 0 = dissociation rate coefficient of B-type clusters (1/s)
M C , A = total number of molecules for n i , A ( i g A ) per unit volume, (#/cm3)
M C , B = total number of molecules for n i , B ( i g B ) per unit volume, (#/cm3)
M W = molecular weight (g/mol)
N A = Avogadro number (1/mol)
n i , A 
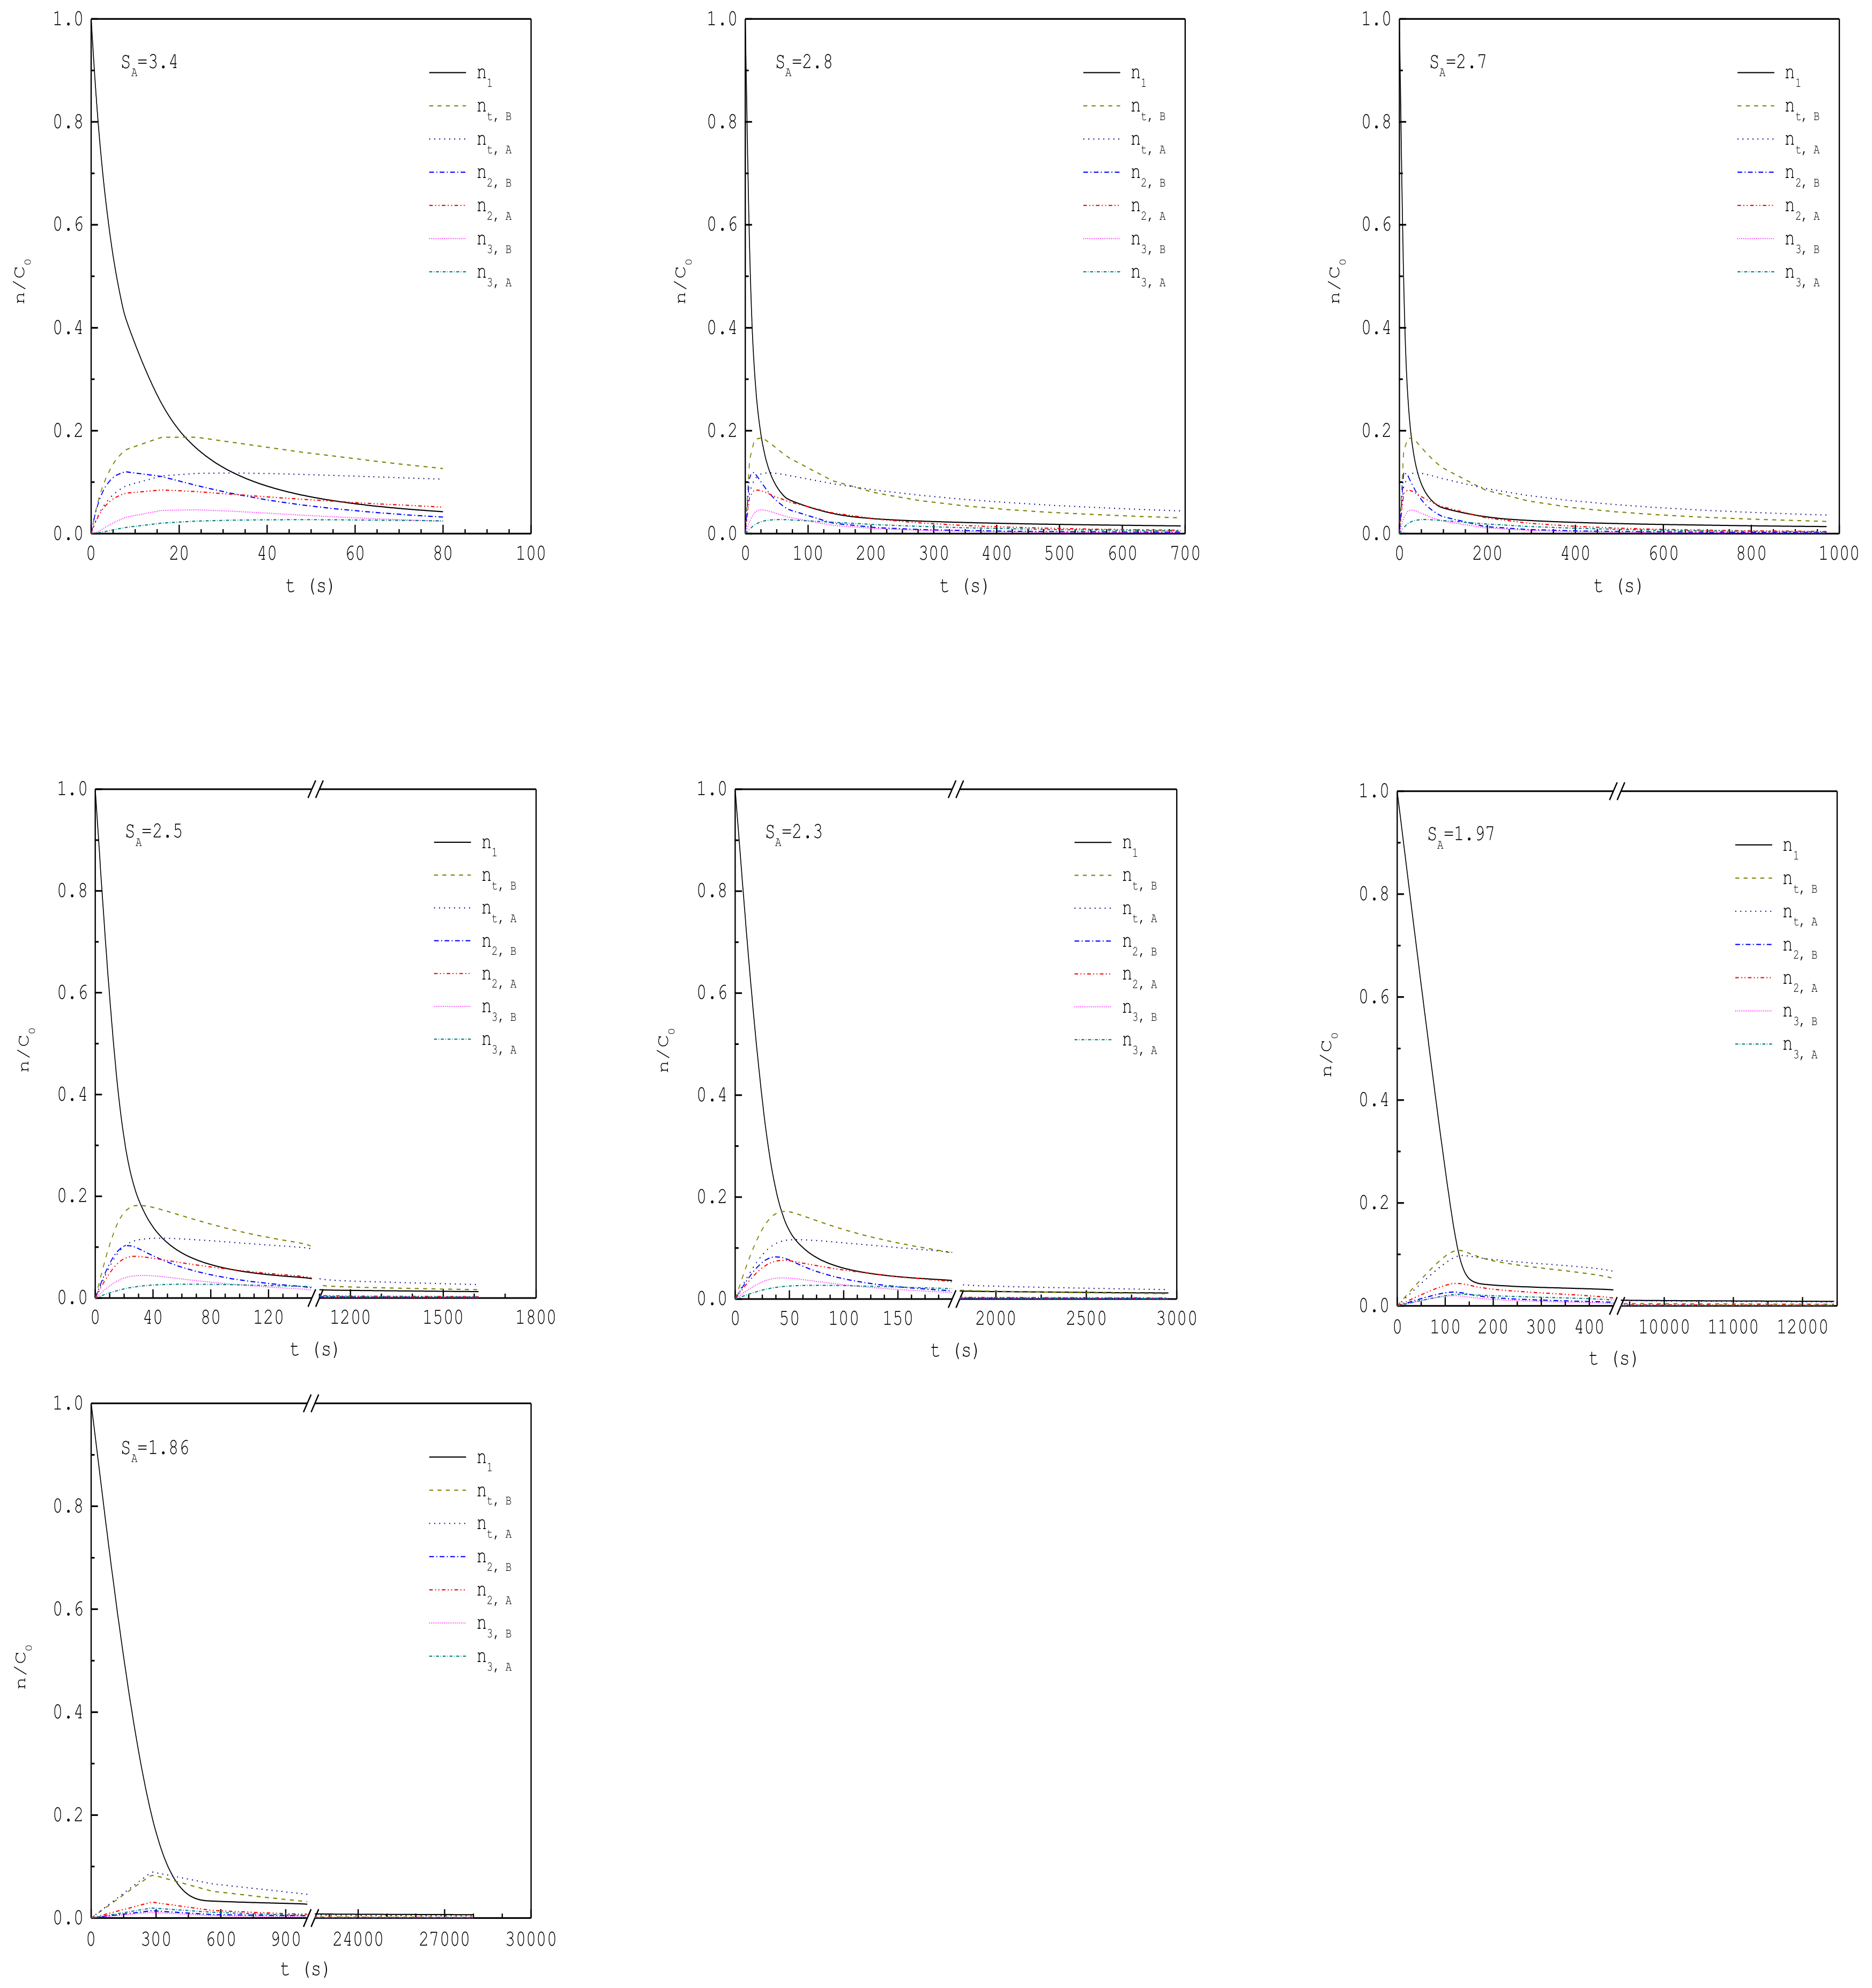
= number concentration of A-type clusters with i solute molecules (#/cm3)
n i , B = number concentration of B-type clusters with i solute molecules (#/cm3)
n t , A = total number concentration of A-type clusters (#/cm3)
n t , B = total number concentration of B-type clusters (#/cm3)
RA i , A = net formation rate of n i , A due to association (#/cm3-s)
RD i , A = net formation rate of n i , A due to dissociation (#/cm3-s)
RA i , B = net formation rate of n i , B due to association (#/cm3-s)
RD i , B = net formation rate of n i , B due to dissociation (#/cm3-s)
S A = supersaturation based on A-type crystals,
S A = C 0 / C eq , A (dimensionless)
S B = supersaturation based on B-type crystals,
S B = C 0 / C eq , B (dimensionless)
T = temperature (K)
t = time (s)
t ind , exp 
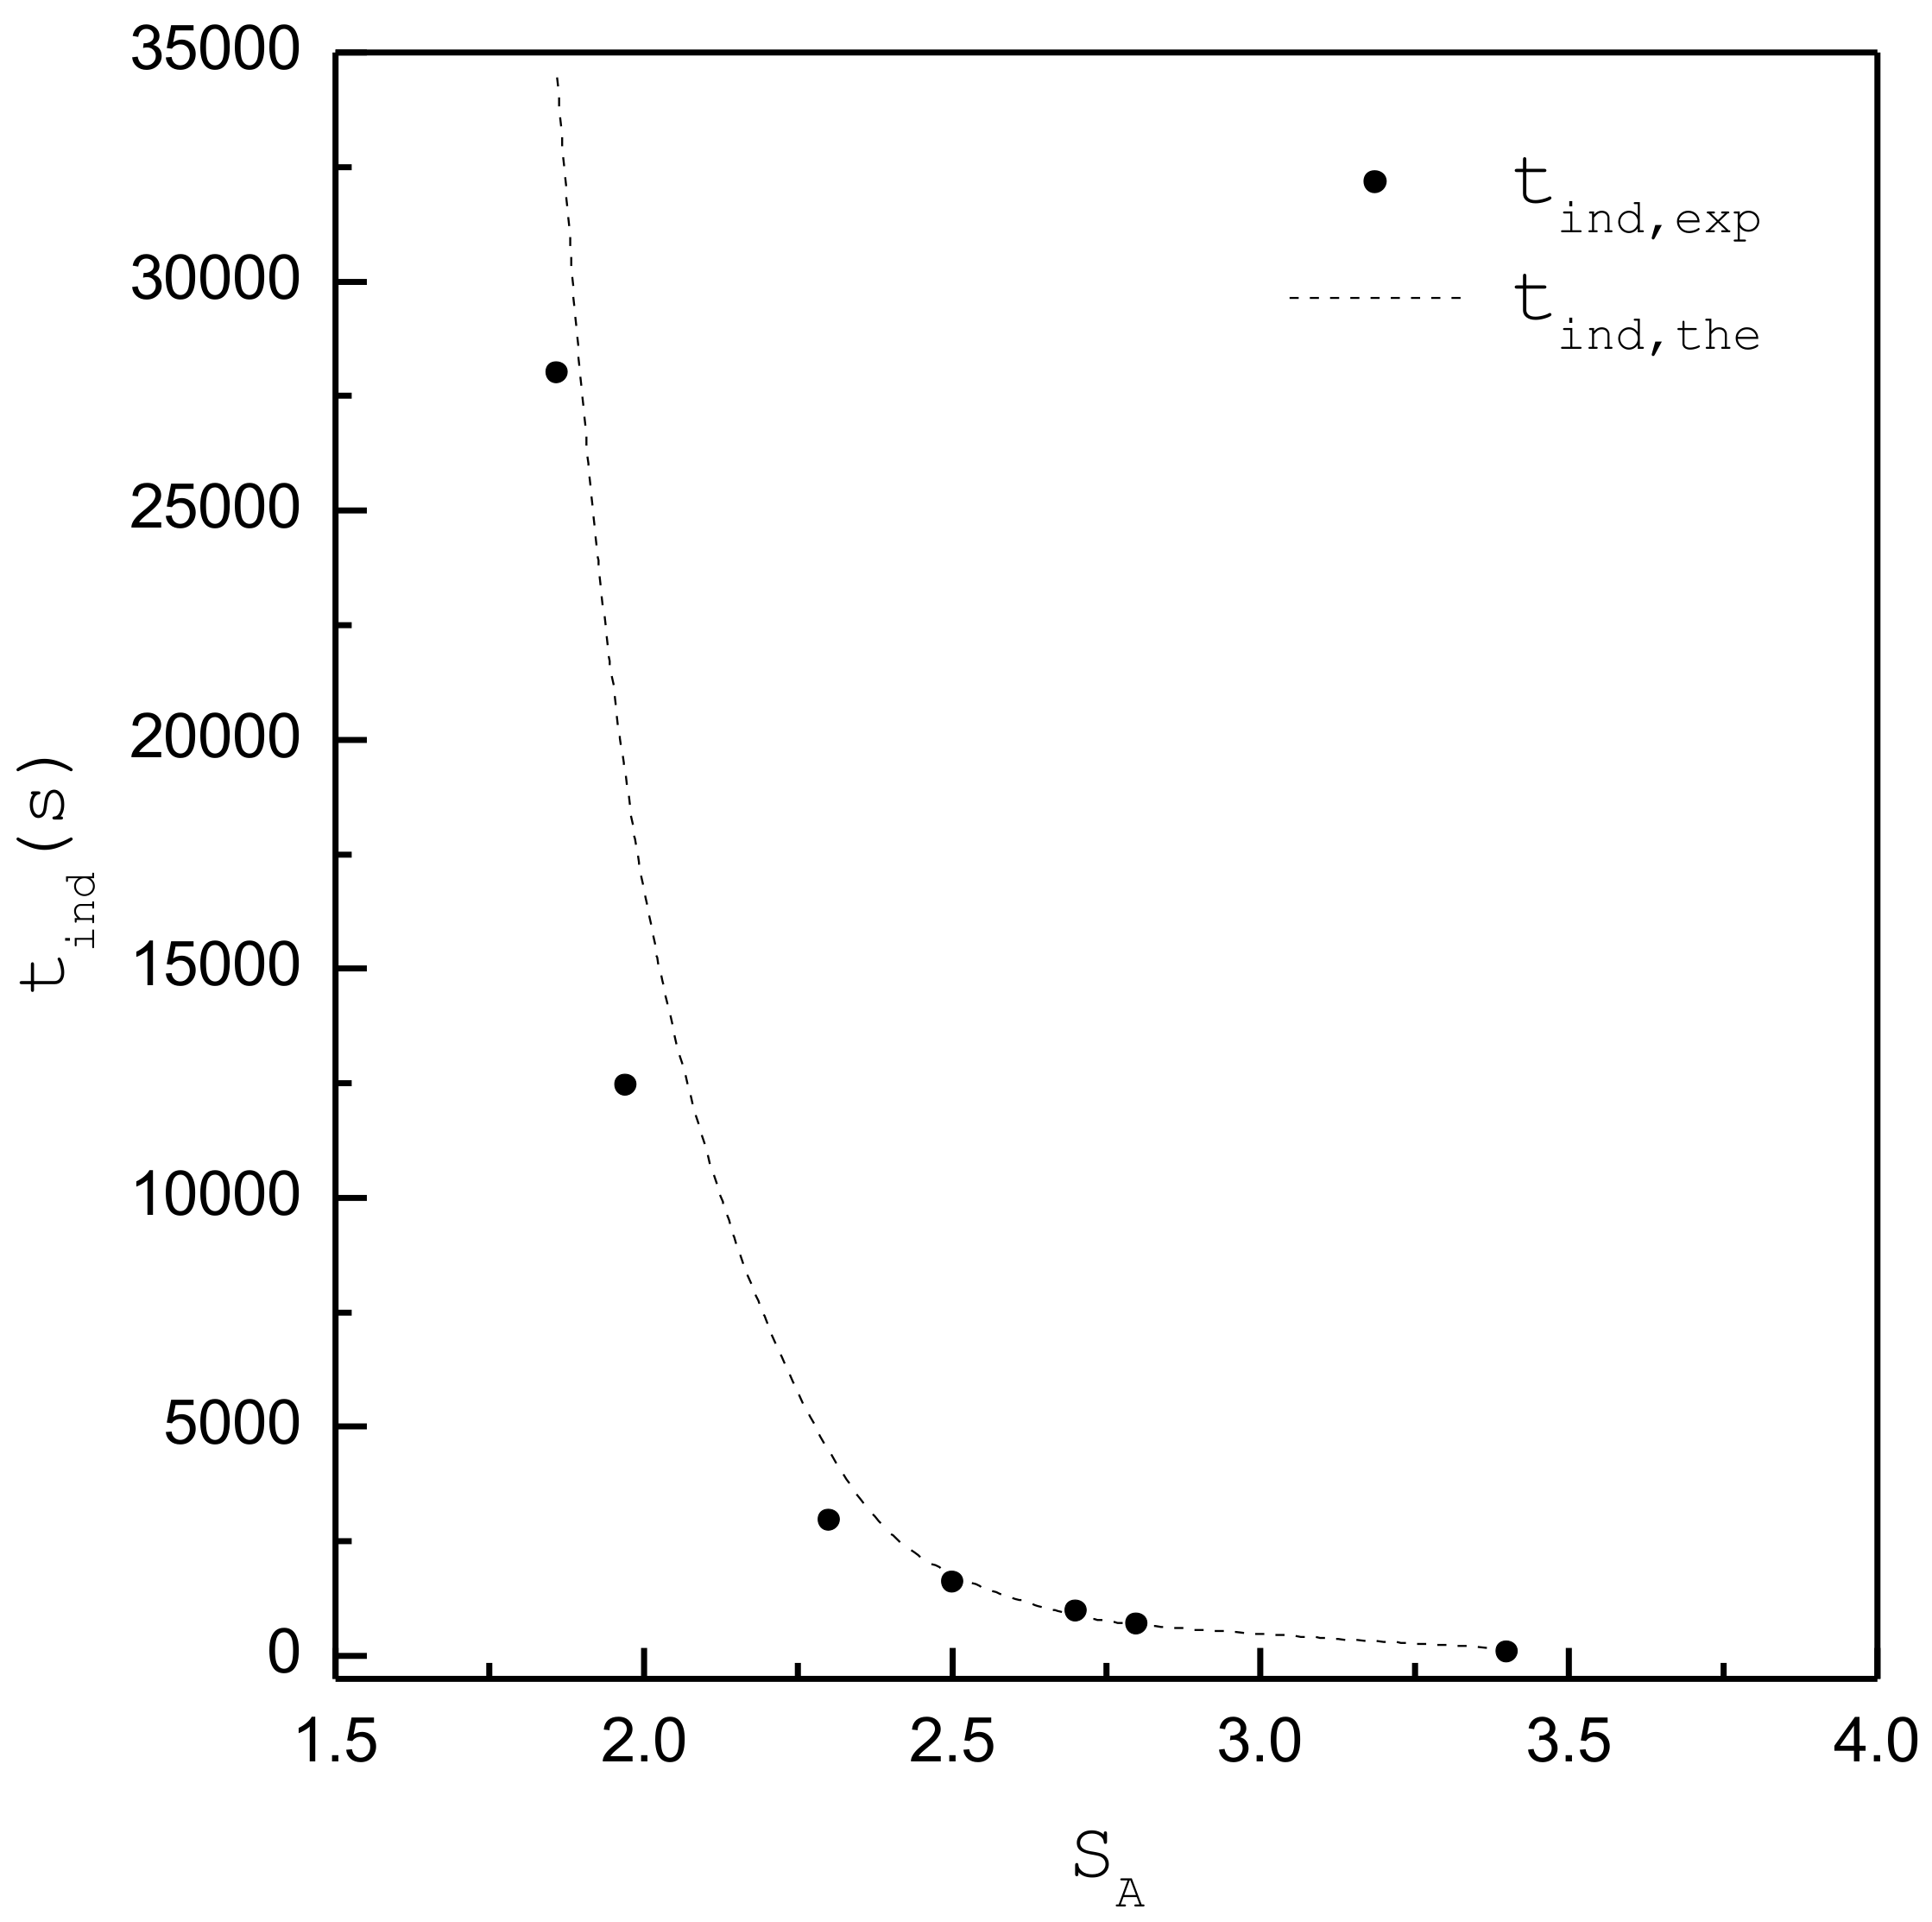
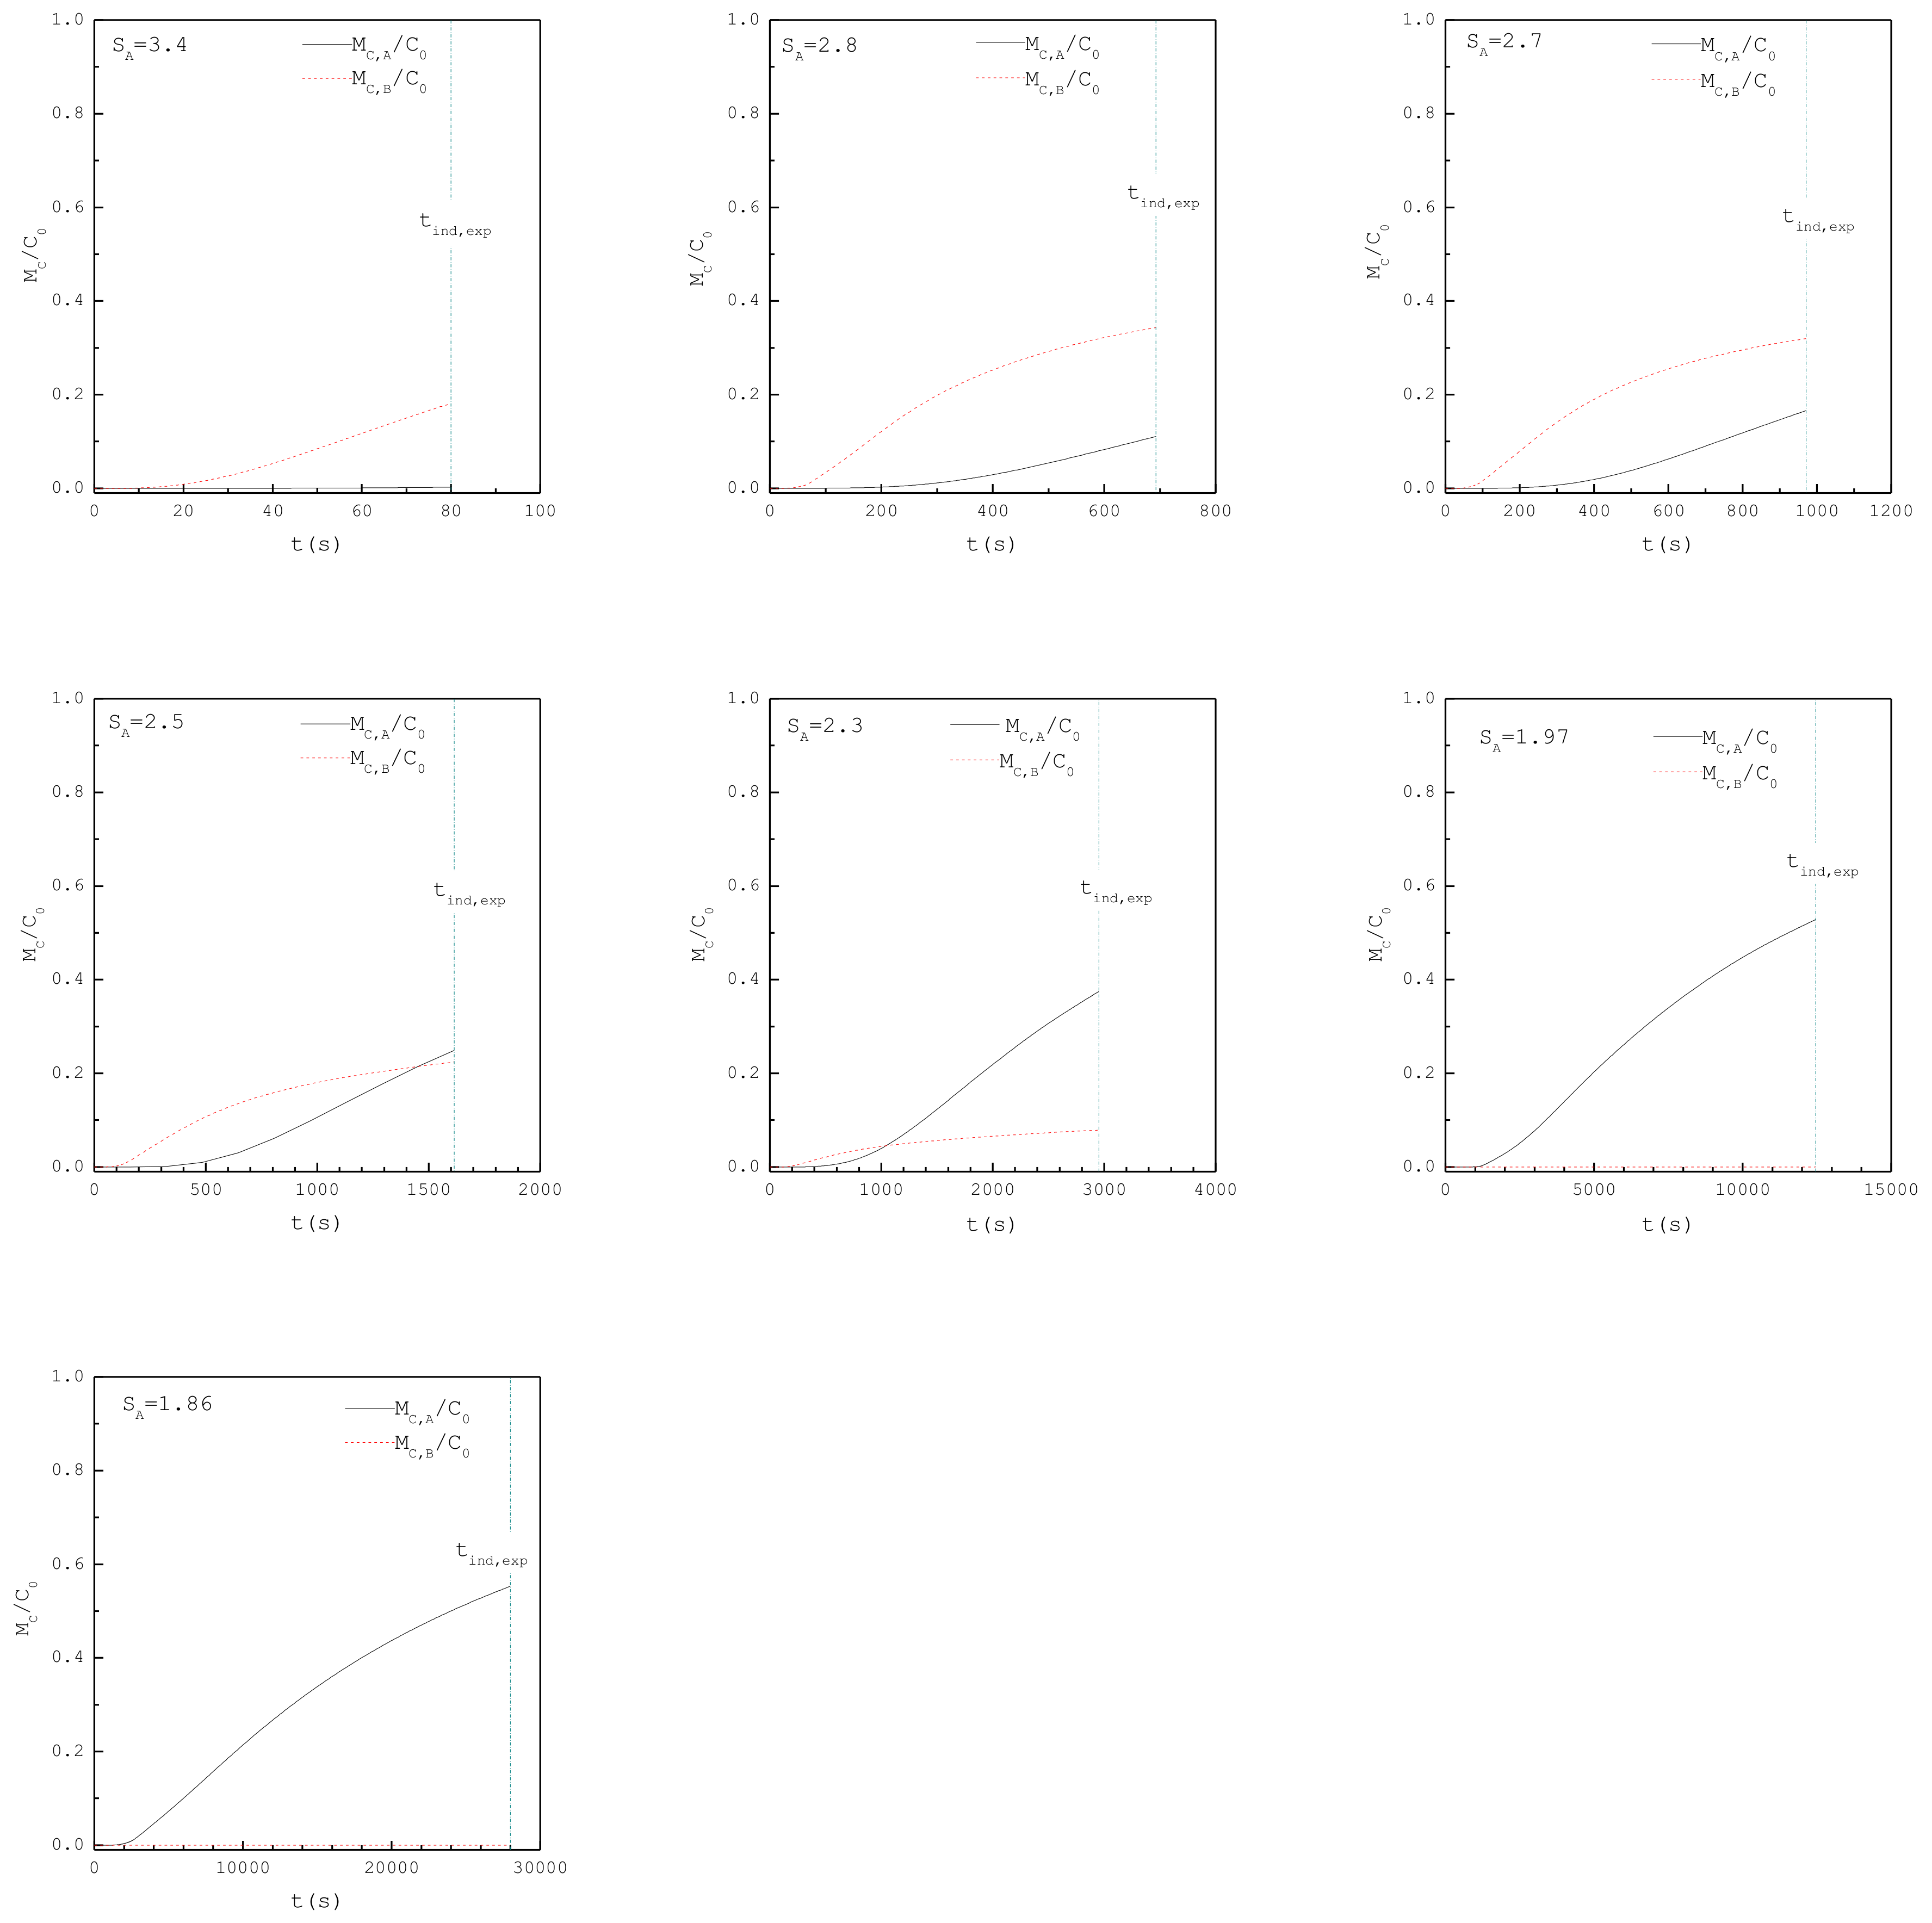
= experimental induction time (s)
t ind , the = theoretical induction time (s)
V m = volume of a solute molecule (cm3)
w A , exp 
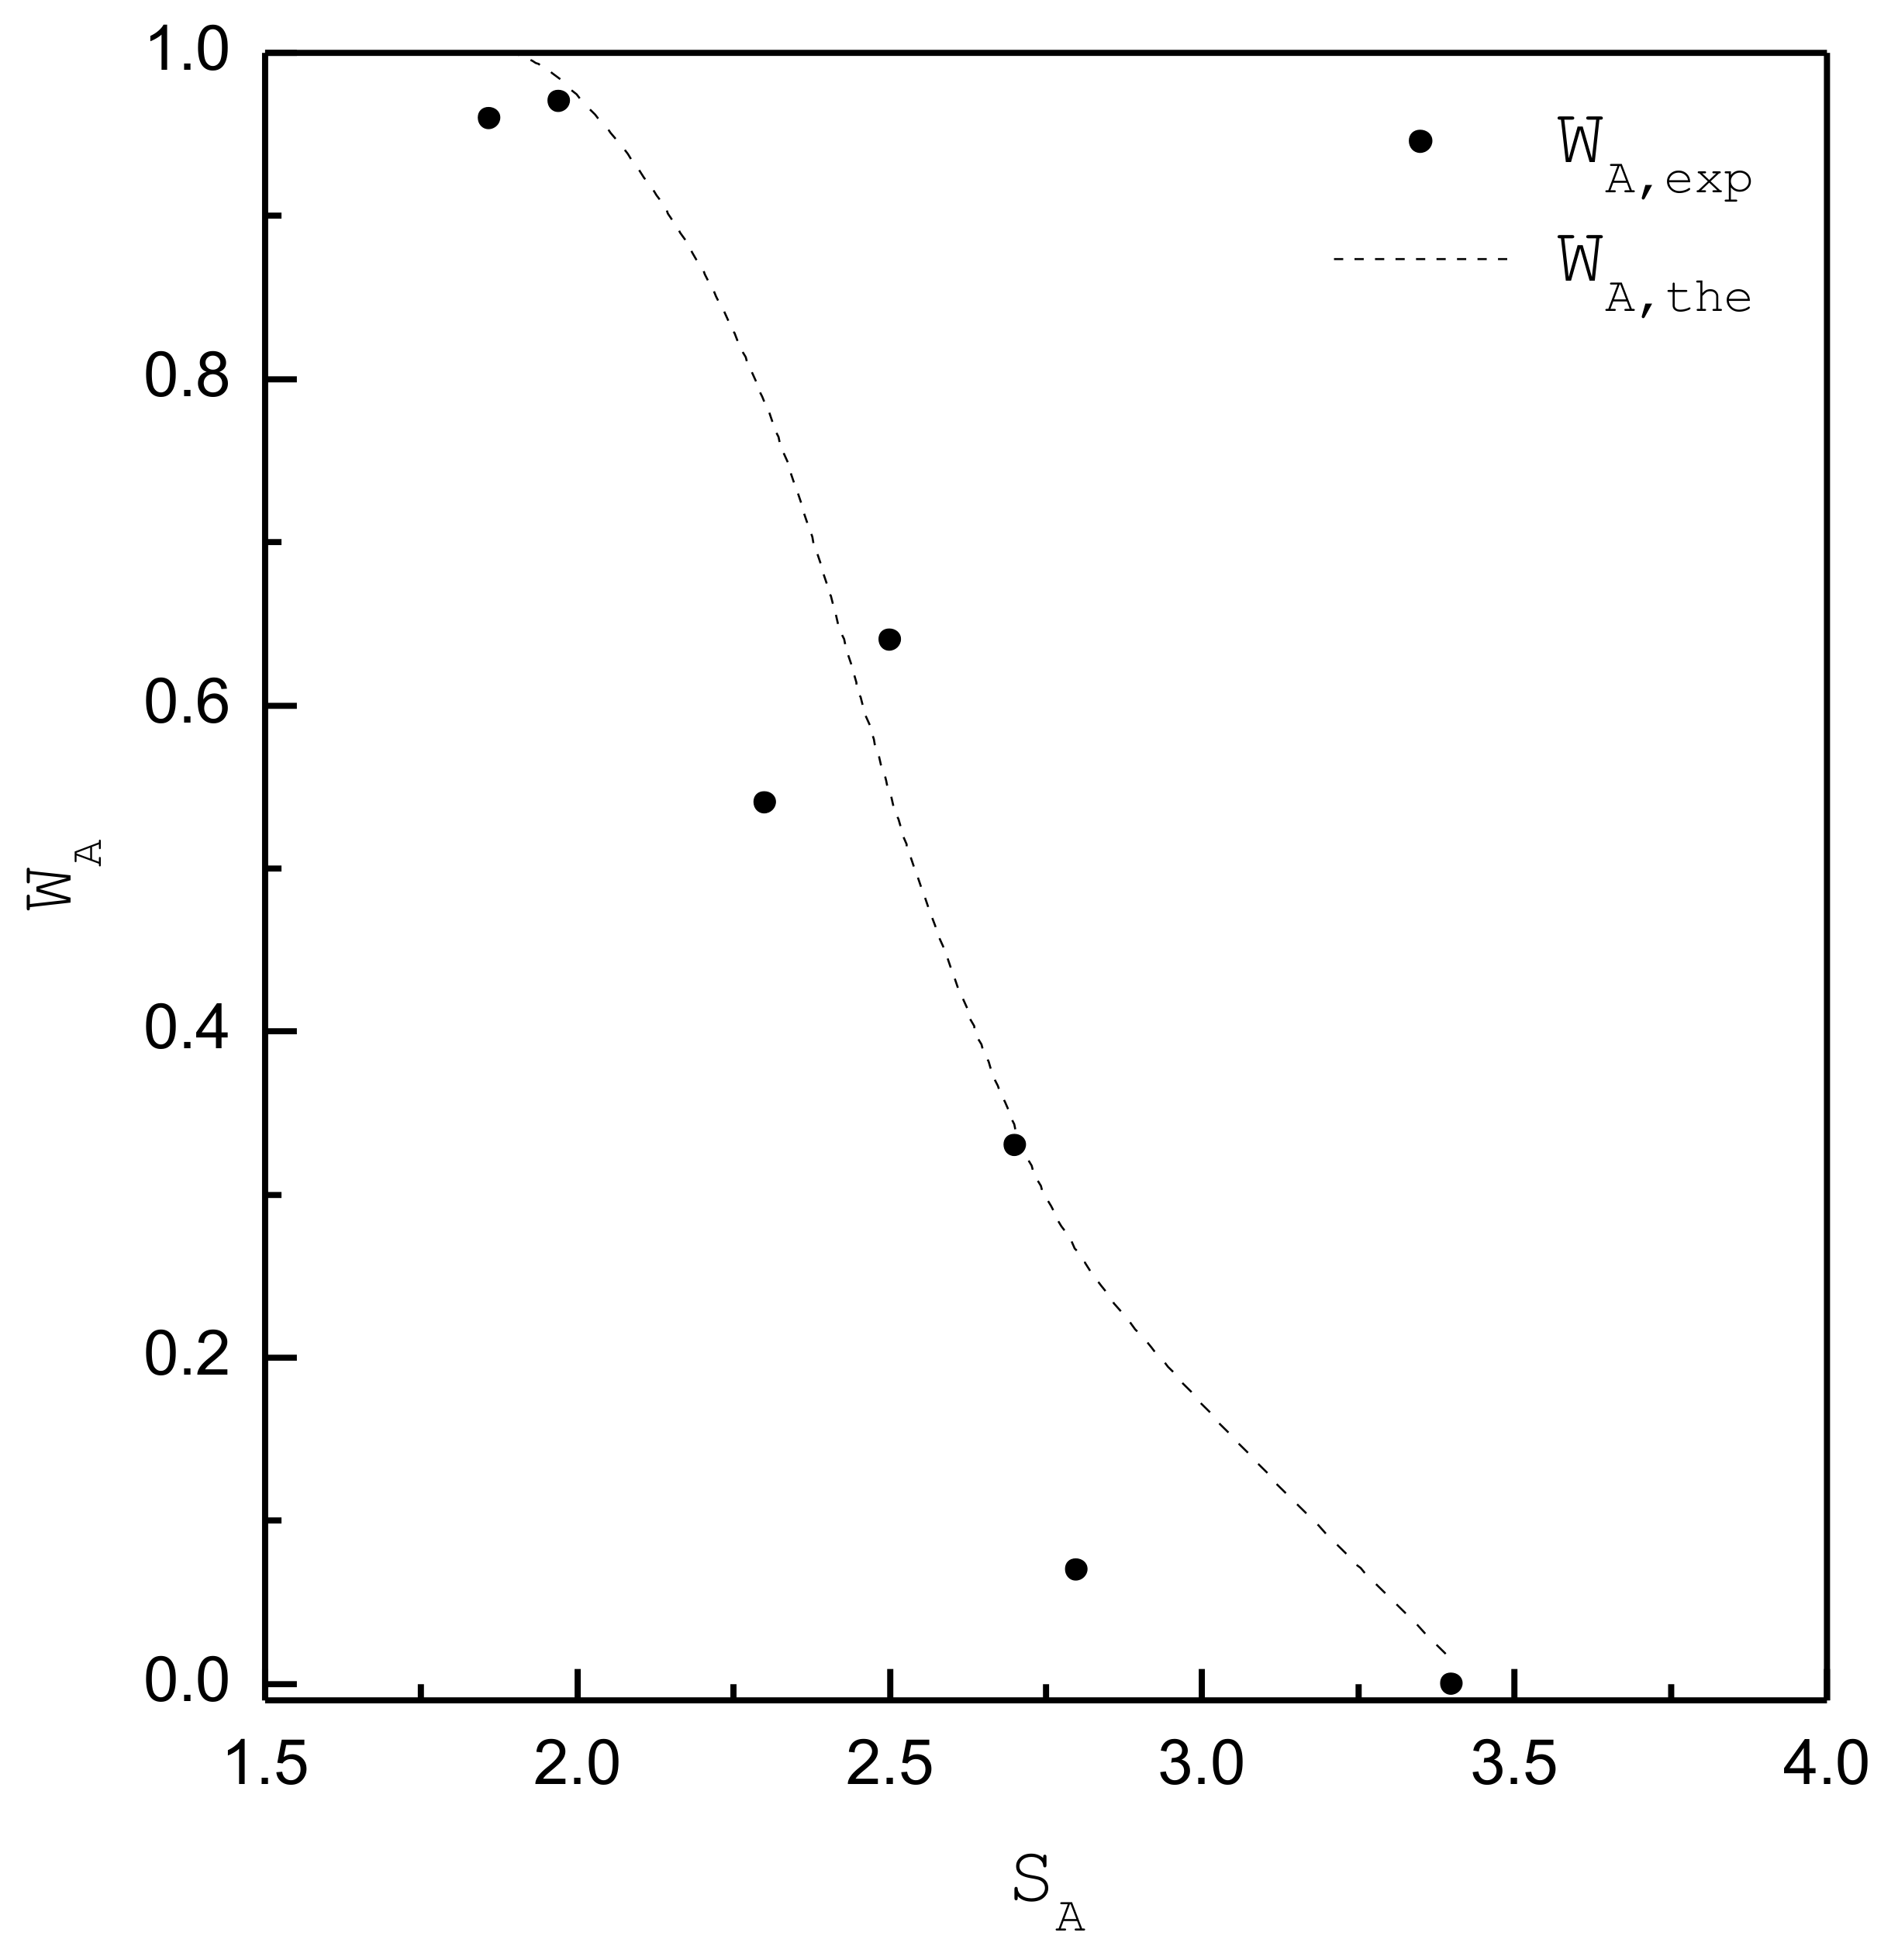
= experimental weight fraction of A-type crystals (dimensionless)
w A , the = theoretical weight fraction of A-type crystals (dimensionless)
Greek letters
γ A = interfacial energy for form A (erg/cm2)
γ B = interfacial energy for form B (erg/cm2)
ρ C = crystal density (g/cm3)
ε t = average relative deviation between the experimental and theoretical induction time (dimensionless)
ε w = average relative deviation between the experimental and theoretical weight fraction of A-type or B-type crystals (dimensionless).

Appendix A

By expanding and rearranging each term in the summations, the following equations for n i , A can be derived.
i = 2 j = 1 i 1 n j , A n i j , A = n 1 n 1 + n 1 n 2 , A + n 2 , A n 1 + n 1 n 3 , A + n 2 , A n 2 , A + n 3 , A n 1 + = ( n 1 + n 2 , A + n 3 , A + ) ( n 1 + n 2 , A + n 3 , A + ) = ( n 1 + n t , A ) 2
i = g A i j = 1 i 1 n j , A n i j , A = i = 2 i j = 1 i 1 n j , A n i j , A i = 2 g A 1 i j = 1 i 1 n j , A n i j , A = 2 n 1 n 1 + 3 n 1 n 2 , A + 3 n 2 , A n 1 + 4 n 1 n 3 , A + 4 n 2 , A n 2 , A + 4 n 3 , A n 1 + i = 2 g A 1 i j = 1 i 1 n j , A n i j , A = 2 ( n 1 + n 2 , A + n 3 , A + ) ( n 1 + 2 n 2 , A + 3 n 3 , A + ) i = 2 g A 1 i j = 1 i 1 n j , A n i j , A = 2 ( n 1 + n t , A ) ( n 1 + i = 2 g A 1 in i , A + i = g A in i , A   i = 2 g A 1 i j = 1 i 1 n j , A n i j , A = 2 ( n 1 n t , A ) ( n 1 + i = 2 g A 1 in i , A + M C , A ) i = 2 g A 1 i j = 1 i 1 n j , A n i j , A
Similar equations can be derived for n i , B .

References

  1. Desiraju, G.R. Crystal Engineering: The Design of Organic Solids; Elsevier: New York, NY, USA, 1989. [Google Scholar]
  2. Bernstein, J. Polymorphism in Molecular Crystals; Oxford University Press: Oxford, UK, 2002. [Google Scholar]
  3. Randolph, A.D.; Larson, M.A. Theory of Particulate Processes; Academic Press, Inc.: San Diego, CA, USA, 1988. [Google Scholar]
  4. Mullin, J.W. Crystallization; Butterworth-Heinemann: Oxford, UK, 1993. [Google Scholar]
  5. Kashchiev, D. Nucleation: Basic Theory with Applications; Butterworth-Heinemann: Oxford, UK, 2000. [Google Scholar]
  6. Allen, A.T.; McDonald, M.P.; Nicol, W.M.; Wood, R.M. Athermal concentration gradients in supersaturated solutions of sucrose. Nature 1972, 235, 36–37. [Google Scholar] [CrossRef]
  7. Larson, M.A.; Garside, J. Solute clustering in supersaturated solutions. Chem. Eng. Sci. 1986, 41, 1285–1289. [Google Scholar] [CrossRef]
  8. Tanaka, S.; Ito, K.; Hayakawa, R.; Ataka, M. Size and number density of precrystalline aggregates in lysozyme crystallization process. J. Chem. Phys. 1999, 111, 10330–10337. [Google Scholar] [CrossRef]
  9. Yau, S.T.; Vekilov, P.G. Quasi-planar nucleus structure in apoferritin crystallization. Nature 2000, 406, 494–497. [Google Scholar] [CrossRef] [PubMed]
  10. Chattopadhyay, S.; Erdemir, D.; Evans, J.M.B.; Ilavsky, J.; Amenitsch, H.; Segre, C.U.; Myerson, A.S. SAXS study of the nucleation of glycine crystals from a supersaturated solution. Cryst. Growth Des. 2005, 5, 523–527. [Google Scholar] [CrossRef]
  11. Weissbuch, I.; Lahav, M.; Leiserowitz, L. Toward stereochemical control, monitoring, and understanding of crystal nucleation. Cryst. Growth Des. 2003, 3, 125–150. [Google Scholar] [CrossRef]
  12. Torbeev, V.Y.; Shavit, E.; Weissbuch, I.; Leiserowitz, L.; Lahav, M. Control of crystal polymorphism by tuning the structure of auxiliary molecules as nucleation inhibitors. The β-polymorph of glycine grown in aqueous solutions. Cryst. Growth Des. 2005, 5, 2190–2196. [Google Scholar] [CrossRef]
  13. Van Driessche, A.E.S.; Van Gerven, N.; Bomans, P.H.H.; Joosten, R.R.M.; Friedrich, H.; Gil-Carton, D.; Sommerdijk, N.A.J.M.; Sleutel, M. Molecular nucleation mechanisms and control strategies for crystal polymorph selection. Nature 2018, 556, 89–94. [Google Scholar] [CrossRef]
  14. Chakraborty, D.; Bhatia, S.K. Formation and agglomeration of polymorphs in continuous precipitation. 1. Mathematical modeling. Ind. Eng. Chem. Res. 1996, 35, 1985–1994. [Google Scholar] [CrossRef]
  15. Ter Horst, J.H.; Kramer, H.J.M.; Jansens, P.J. A new molecular modeling approach to predict concomitant nucleation of polymorphs. Cryst. Growth Des. 2002, 2, 351–356. [Google Scholar] [CrossRef]
  16. Blagden, N.; Davey, R.J. Polymorph Selection: Challenges for the Future? Cryst. Growth Des. 2003, 3, 873–885. [Google Scholar] [CrossRef]
  17. Madras, G.; McCoy, B.J. Growth and Ripening Kinetics of Crystalline Polymorphs. Cryst. Growth Des. 2003, 3, 981–990. [Google Scholar] [CrossRef]
  18. Kitamura, M. Controlling factors and mechanism of polymorphic crystallization. Cryst. Growth Des. 2004, 4, 1153–1159. [Google Scholar] [CrossRef]
  19. Gracin, S.; Uusi-Penttila, M.; Rasmuson, A.C. Influence of ultrasound on the nucleation of polymorphs of p-aminobenzoic acid. Cryst. Growth Des. 2005, 5, 1787–1794. [Google Scholar] [CrossRef]
  20. Chen, S.; Xi, H.; Yu, L. Cross Nucleation between ROY Polymorphs. J. Am. Chem. Soc. 2005, 127, 17439–17444. [Google Scholar] [CrossRef] [PubMed]
  21. Mendez Del Rio, J.R.; Rousseau, R.W. Batch and tubular-batch crystallization of paracetamol: Crystal size distribution and polymorph formation. Cryst. Growth Des. 2006, 6, 1407–1414. [Google Scholar] [CrossRef]
  22. Desgranges, C.; Delhommelle, J. Polymorph selection during the crystallization of Yukawa systems. J. Chem. Phys. 2007, 126, 054501. [Google Scholar] [CrossRef]
  23. Barthe, S.C.; Grover, M.A.; Rousseau, R.W. Observation of polymorphic change through analysis of FBRM data: Transformation of paracetamol from form II to form I. Cryst. Growth Des. 2008, 8, 3316–3322. [Google Scholar] [CrossRef]
  24. Mangin, D.; Puel, F.; Veesler, S. Polymorphism in processes of crystallization in solution: A practical review. Org. Process Res. Dev. 2009, 13, 1241–1253. [Google Scholar] [CrossRef]
  25. Hall, V.J.; Simpson, G.J. Direct Observation of Transient Ostwald Crystallization Ordering from Racemic Serine Solutions. J. Am. Chem. Soc. 2010, 132, 13598–13599. [Google Scholar] [CrossRef]
  26. Ike, Y.; Hirasawa, I. Polymorph control of L-phenylalanine in cooling crystallization by ultrasonication. Chem. Eng. Technol. 2018, 41, 1093–1097. [Google Scholar] [CrossRef]
  27. Rimez, B.; Conte, J.; Lecomte-Norrant, E.; Cognet, P.; Gourdon, C.; Scheid, B. Continuous-flow tubular crystallization to discriminate between two competing crystal polymorphs. 2. Antisolvent crystallization. Cryst. Growth Des. 2018, 18, 6440–6447. [Google Scholar] [CrossRef]
  28. Narsimhan, G.; Ruckenstein, E. A new approach for the prediction of the rate of nucleation in liquids. J. Colloid Interface Sci. 1989, 128, 549–565. [Google Scholar] [CrossRef]
  29. Ruckenstein, E.; Karpe, P. On the enzymatic superactivity in ionic reverse micelles. J. Colloid Interface Sci. 1990, 139, 408–436. [Google Scholar] [CrossRef]
  30. Ruckenstein, E.; Berim, G.O. Kinetics of heterogeneous nucleation on a rough surface: Nucleation of a liquid phase in nanocavities. J. Colloid Interface Sci. 2010, 351, 277–282. [Google Scholar] [CrossRef] [PubMed]
  31. Hammond, R.B.; Pencheva, K.; Roberts, K.J. Simulation of energetic stability of facetted L-glutamic acid nanocrystalline clusters in relation to their polymorphic phase stability as a function of crystal size. J. Phys. Chem. B 2005, 109, 19550–19552. [Google Scholar] [CrossRef]
  32. Ter Horst, J.H.; Kramer, H.J.M.; Jansens, P.J. Towards a crystalline product quality prediction method by combining process modeling and molecular simulations. Chem. Eng. Technol. 2006, 29, 175–181. [Google Scholar] [CrossRef]
  33. Deij, M.A.; ter Horst, J.H.; Meekes, H.; Jansens, P.; Vlieg, E. Polymorph formation studied by 3D nucleation simulations. Application to a yellow isoxazolone dye, paracetamol, and L-glutamic acid. J. Phys. Chem. B 2007, 111, 1523–1530. [Google Scholar] [CrossRef]
  34. Lu, J.; Rohani, S. Polymorphism and crystallization of active pharmaceutical ingredients (APIs). Curr. Med. Chem. 2009, 16, 884–905. [Google Scholar] [CrossRef]
  35. Ni, X.; Liao, A. Effects of cooling rate and solution concentration on solution crystallization of L-glutamic acid in an oscillatory baffled crystallizer. Cryst. Growth Des. 2008, 8, 2875–2881. [Google Scholar] [CrossRef]
  36. Qu, H.; Alatalo, H.; Hatakka, H.; Kohonen, J.; Louhi-Kultanen, M.; Reinikainen, S.P.; Kallas, J. Raman and ATR FTIR spectroscopy in reactive crystallization: Simultaneous monitoring of solute concentration and polymorphic state of the crystals. J Cryst. Growth 2009, 311, 3466–3475. [Google Scholar] [CrossRef]
  37. Sun, X.; Garetz, B.A.; Myerson, A.S. Supersaturation and polarization dependence of polymorph control in the nonphotochemical laser-induced nucleation (NPLIN) of aqueous glycine solutions. Cryst. Growth Des. 2006, 6, 684–689. [Google Scholar] [CrossRef]
  38. Gracin, S.; Rasmuson, A.C. Polymorphism and crystallization of p-aminobenzoic acid. Cryst. Growth Des. 2004, 4, 1013–1023. [Google Scholar] [CrossRef]
  39. Teychene, S.; Biscans, B. Nucleation kinetics of polymorphs: Induction period and interfacial energy measurements. Cryst. Growth Des. 2008, 8, 1133–1139. [Google Scholar] [CrossRef]
  40. Zhu, L.; Wang, L.Y.; Sha, Z.L.; Wang, Y.F.; Yang, L.B.; Zhu, X.Y.; Du, W. Interplay between thermodynamics and kinetics on polymorphic appearance in the solution crystallization of an enantiotropic system. Cryst. Growth Des. 2017, 17, 4582–4595. [Google Scholar] [CrossRef]
  41. Roelands, C.P.M.; Jiang, S.; Kitamura, M.; ter Horst, J.H.; Kramer, H.J.M.; Jansens, P.J. Antisolvent crystallization of the polymorphs of L-histidine as a function of supersaturation ratio an of solvent composition. Cryst. Growth Des. 2006, 6, 955–963. [Google Scholar] [CrossRef]
  42. Wantha, L.; Punmalee, N.; Sawaddiphol, V.; Flood, A.E. Effect of ethanol on crystsllization of the polymorphs of L-histidine. J. Cryst. Growth 2018, 490, 65–70. [Google Scholar] [CrossRef]
  43. Stranski, I.N.; Totomanov, D. Rate of formation of (crystal) nuclei and the Ostwald step rule. Z. Phys. Chem. 1933, 163, 399–408. [Google Scholar]
  44. Tahri, Y.; Kozisek, Z.; Gagniere, E.; Chabanon, E.; Bounahmidi, T.; Mangin, D. Modeling the competition between polymorphic phases: Highlights on the effect of Ostwald ripening. Cryst. Growth Des. 2016, 16, 5689–5697. [Google Scholar] [CrossRef]
  45. Scholl, J.; Bonalumi, D.; Vicum, L.; Mazzotti, M. In situ monitoring and modeling of the solvent-mediated polymorphic transformation of L-glutamic acid. Cryst. Growth Des. 2006, 6, 881–891. [Google Scholar] [CrossRef]
  46. Kee, N.C.S.; Arendt, P.D.; Tan, R.B.H.; Braatz, R.D. Selective crystallization of the metastable anhydrate form in the enantiotropic pseudo-dimorph system of L-phenylalanine using concentration feedback control. Cryst. Growth Des. 2009, 9, 3052–3061. [Google Scholar] [CrossRef]
  47. Rimez, B.; Debuysschere, R.; Conte, J.; Lecomte-Norrant, E.; Gourdon, C.; Cogent, P.; Scheid, B. Continuous-flow tubular crystallization to discriminate between two competing crystal polymorphs. 1. Cooling crystallization. Cryst. Growth Des. 2018, 18, 6431–6439. [Google Scholar] [CrossRef]
  48. Smoluchowski, M. Versuch einer mathematischen Theorie der Koagulationskinetic kolloider Lösungen. Z. Phys. Chem. 1917, 92, 129–168. [Google Scholar]
  49. Farkas, L. Keimbildnngsgeschwindigkeit in übersättigten dämpfen. Z. Phys. Chem. 1927, 125, 236–242. [Google Scholar]
  50. Shiau, L.D.; Lu, Y.F. Modeling solute clustering in the diffusion layer around a growing crystal. J. Chem. Phys. 2009, 130, 094105. [Google Scholar] [CrossRef] [PubMed]
  51. Mersmann, A.; Bartosch, K. How to predict the metastable zone width. J. Cryst. Growth 1998, 183, 240–250. [Google Scholar] [CrossRef]
  52. Lindenberg, C.; Mazzotti, M. Effect of temperature on the nucleation kinetics of α L-glutamic acid. J. Cryst. Growth 2009, 311, 1178–1184. [Google Scholar] [CrossRef]
  53. Shiau, L.D.; Lu, T.S. A model for determination of the interfacial energy from the induction time or metastable zone width data based on turbidity measurements. CrystEngComm 2014, 16, 9743–9752. [Google Scholar] [CrossRef]
  54. Shiau, L.D. Determination of the nucleation and growth kinetics from aqueous L-glycine solutions from the turbidity induction time data. Crystals 2018, 8, 403. [Google Scholar] [CrossRef]
  55. Shiau, L.D. The temperature dependence of the pre-exponential factor and interfacial energy for aqueous glycine solutions based on the metastable zone width data. J. Cryst. Growth 2018, 496–497, 18–23. [Google Scholar] [CrossRef]
  56. Vekilov, P.G. The two-step mechanism of nucleation of crystals in solution. Nanoscale 2010, 2, 2346–2357. [Google Scholar] [CrossRef] [PubMed]
  57. Qian, R.Y.; Botsaris, G.D. A new mechanism for nuclei formation in suspension crystallizers: The role of interparticle forces. Chem. Eng. Sci. 1997, 52, 3429–3440. [Google Scholar] [CrossRef]
  58. Lee, G.W. Formation of metastable crystals from supercooled, supersaturated, and supercompressed liquids: Role of crystal-liquid interfacial free energy. Crystals 2017, 7, 326. [Google Scholar] [CrossRef]
Figure 1. Schematic diagram for the change in potential energy during polymorph crystallization from the initial state to two different polymorphs.
Crystals 09 00069 g001
Figure 2. Comparison of t ind , the and t ind , exp for various S A , where t ind , the is calculated from Equation (22) using the optimal values of k A , k B , k dA 0 and k dB 0 . The dashed line represents the calculated t ind , the while the solid circle represents the experimental t ind , exp .
Crystals 09 00069 g002
Figure 3. Comparison of w A , exp and w A , the at the end of the experiment for various S A , where w A , the is calculated from Equation (23) using the optimal values of k A , k B , k dA 0 and k dB 0 . The dashed line represents the calculated w A , the while the solid circle represents the experimental w A , exp .
Crystals 09 00069 g003
Figure 4. Variation of n 1 , n 2 , A , n 2 , B , n 3 , A , n 3 , B , n t , A and n t , B with increasing time for various S A in the range t = 0 t ind .
Crystals 09 00069 g004
Figure 5. Variation of M C , A and M C , B with increasing time for various S A in the range t = 0 t ind .
Crystals 09 00069 g005
Table 1. Various association and dissociation processes for polymorph nucleation.
Association and Dissociation Processes
n 1 + n 1 k A n 2 , A or   n 1 + n 1 k B n 2 , B
n 1 + n i , A k A n i + 1 , A   ( i 2 )
n 1 + n i , B k B n i + 1 , B   ( i 2 )
n i , A + n j , A k A n i + j , A   ( i 2 ,   j 2 )
n i , B + n j , B k B n i + j , B ( i 2 ,   j 2 )
n i , A + n j , B no   association   ( i 2 ,   j 2 )
n 2 , A k dA , 2 n 1 + n 1
n 2 , B k dB , 2 n 1 + n 1
n i , A k dA i n i 1 , A + n 1   ( 3 i g A 1 )
n i , B k dB i n i 1 , B + n 1   ( 3 i g B 1 )
Table 2. The experimental induction time data and the final measured weight fractions of eflucimibe polymorphs for various supersaturation at 35   ° C reported by Teychene and Biscans [39].
S A   ( - ) S B   ( - ) C 0   ( no . / cm 3 ) t ind , exp   ( s ) g A   ( - ) g B   ( - ) w A , exp   ( - ) Polymorphic Form
1.861.663.94 × 10192800091920.96A
1.971.764.18 × 10191245670670.97A
2.32.054.88 × 1019295438320.54A+B
2.52.235.30 × 1019161428230.64A+B
2.72.415.72 × 101997122180.33A+B
2.82.505.94 × 101969320160.07~B
3.43.037.21 × 1019801290B
Table 3. The optimal values of k A , k B , k dA 0 and k dB 0 with the smallest sum of ε t and ε w for 1.86 S A 3.4 at 35 °C.
k A   ( cm 3 / s ) k B   ( cm 3 / s ) k dA 0   ( 1 / s ) k dB 0   ( 1 / s ) ε t   ( - ) ε w   ( - )
7.7 × 10−221.4 × 10−215.3 × 10−43.2 × 10−30.220.14

