Computational Study on Homogeneous Melting of Benzene Phase I


Abstract
:1. Introduction
2. Methods
2.1. Model
2.2. Molecular-Dynamics Simulation
2.3. Crystalline Structure
3. Results and Discussion
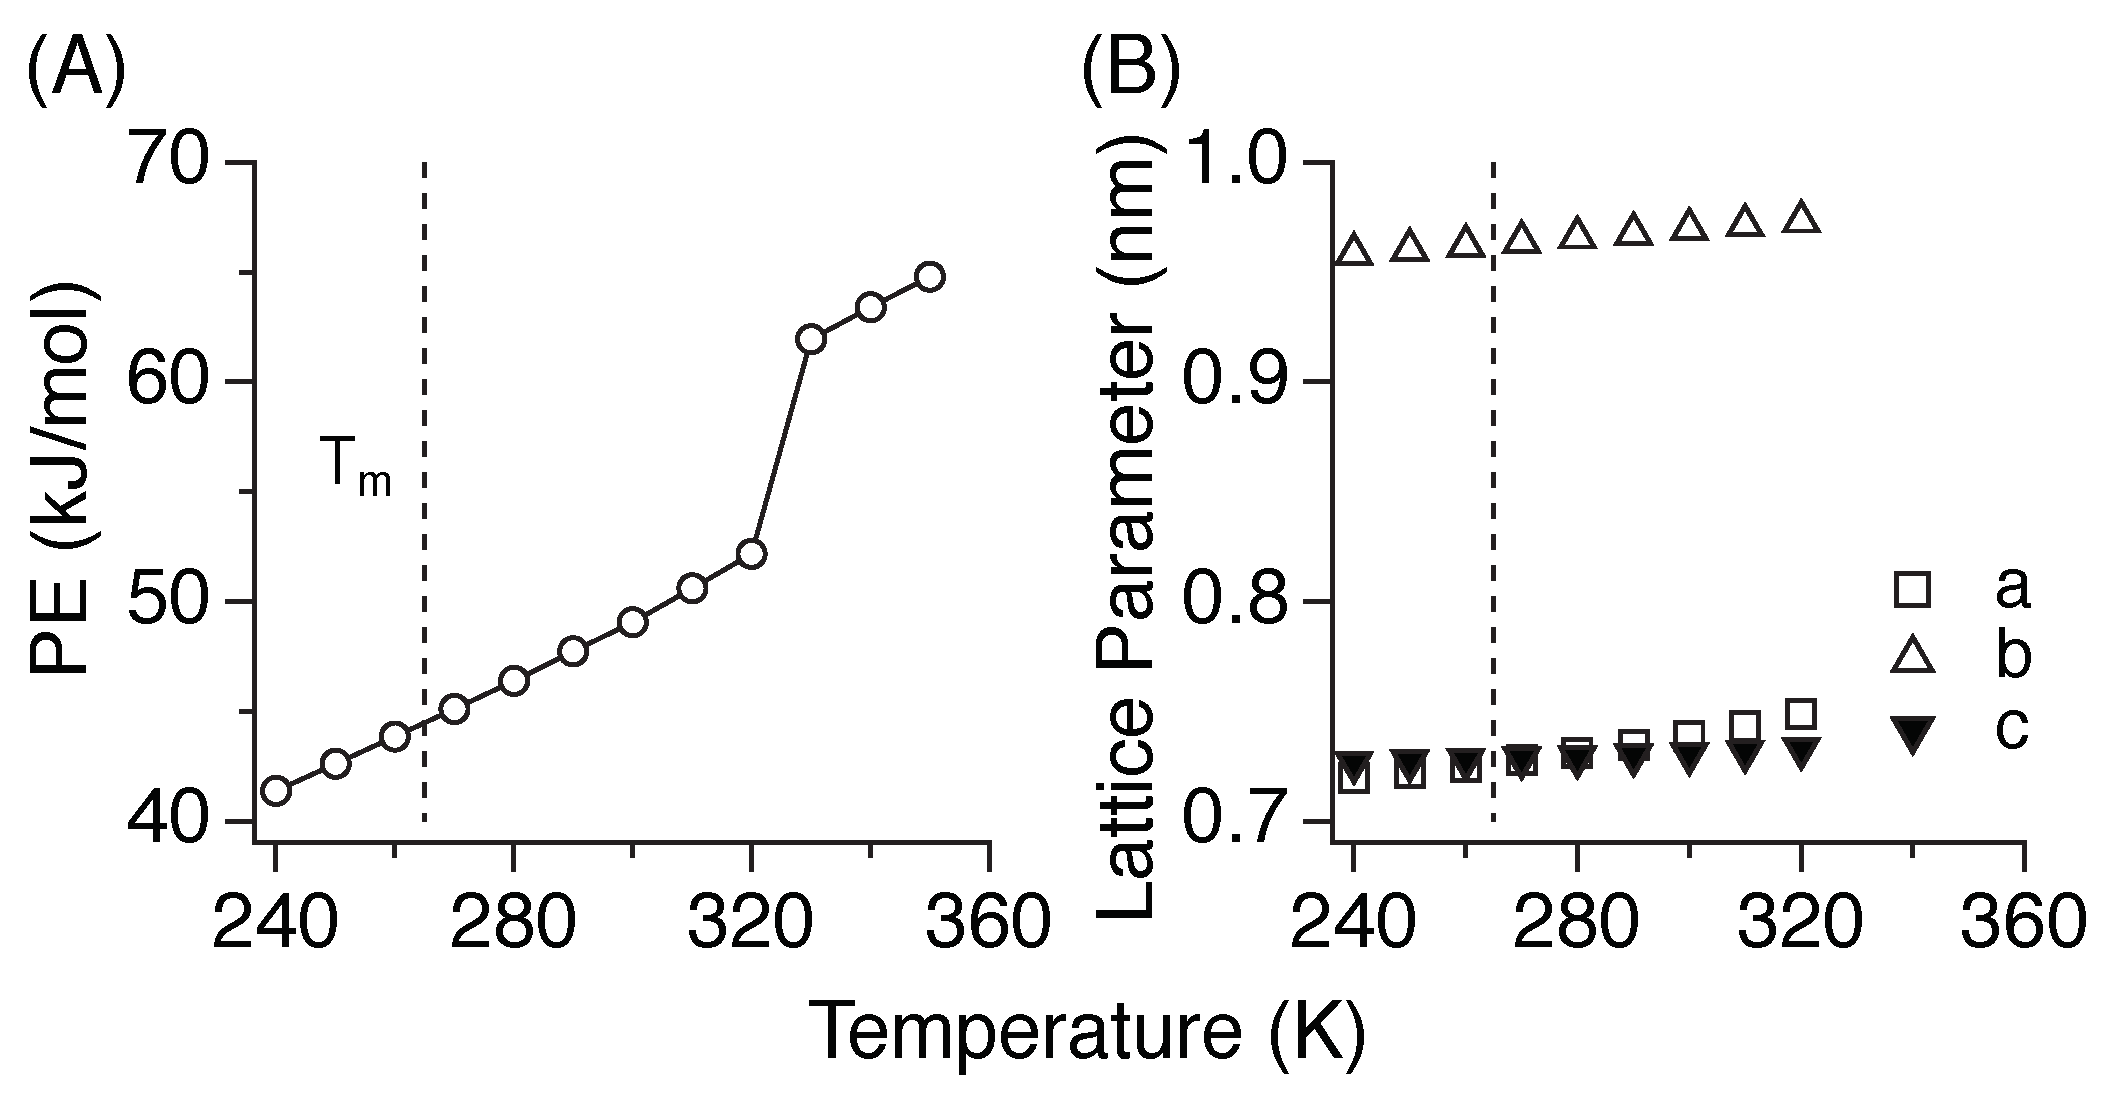
3.1. Melting Temperature
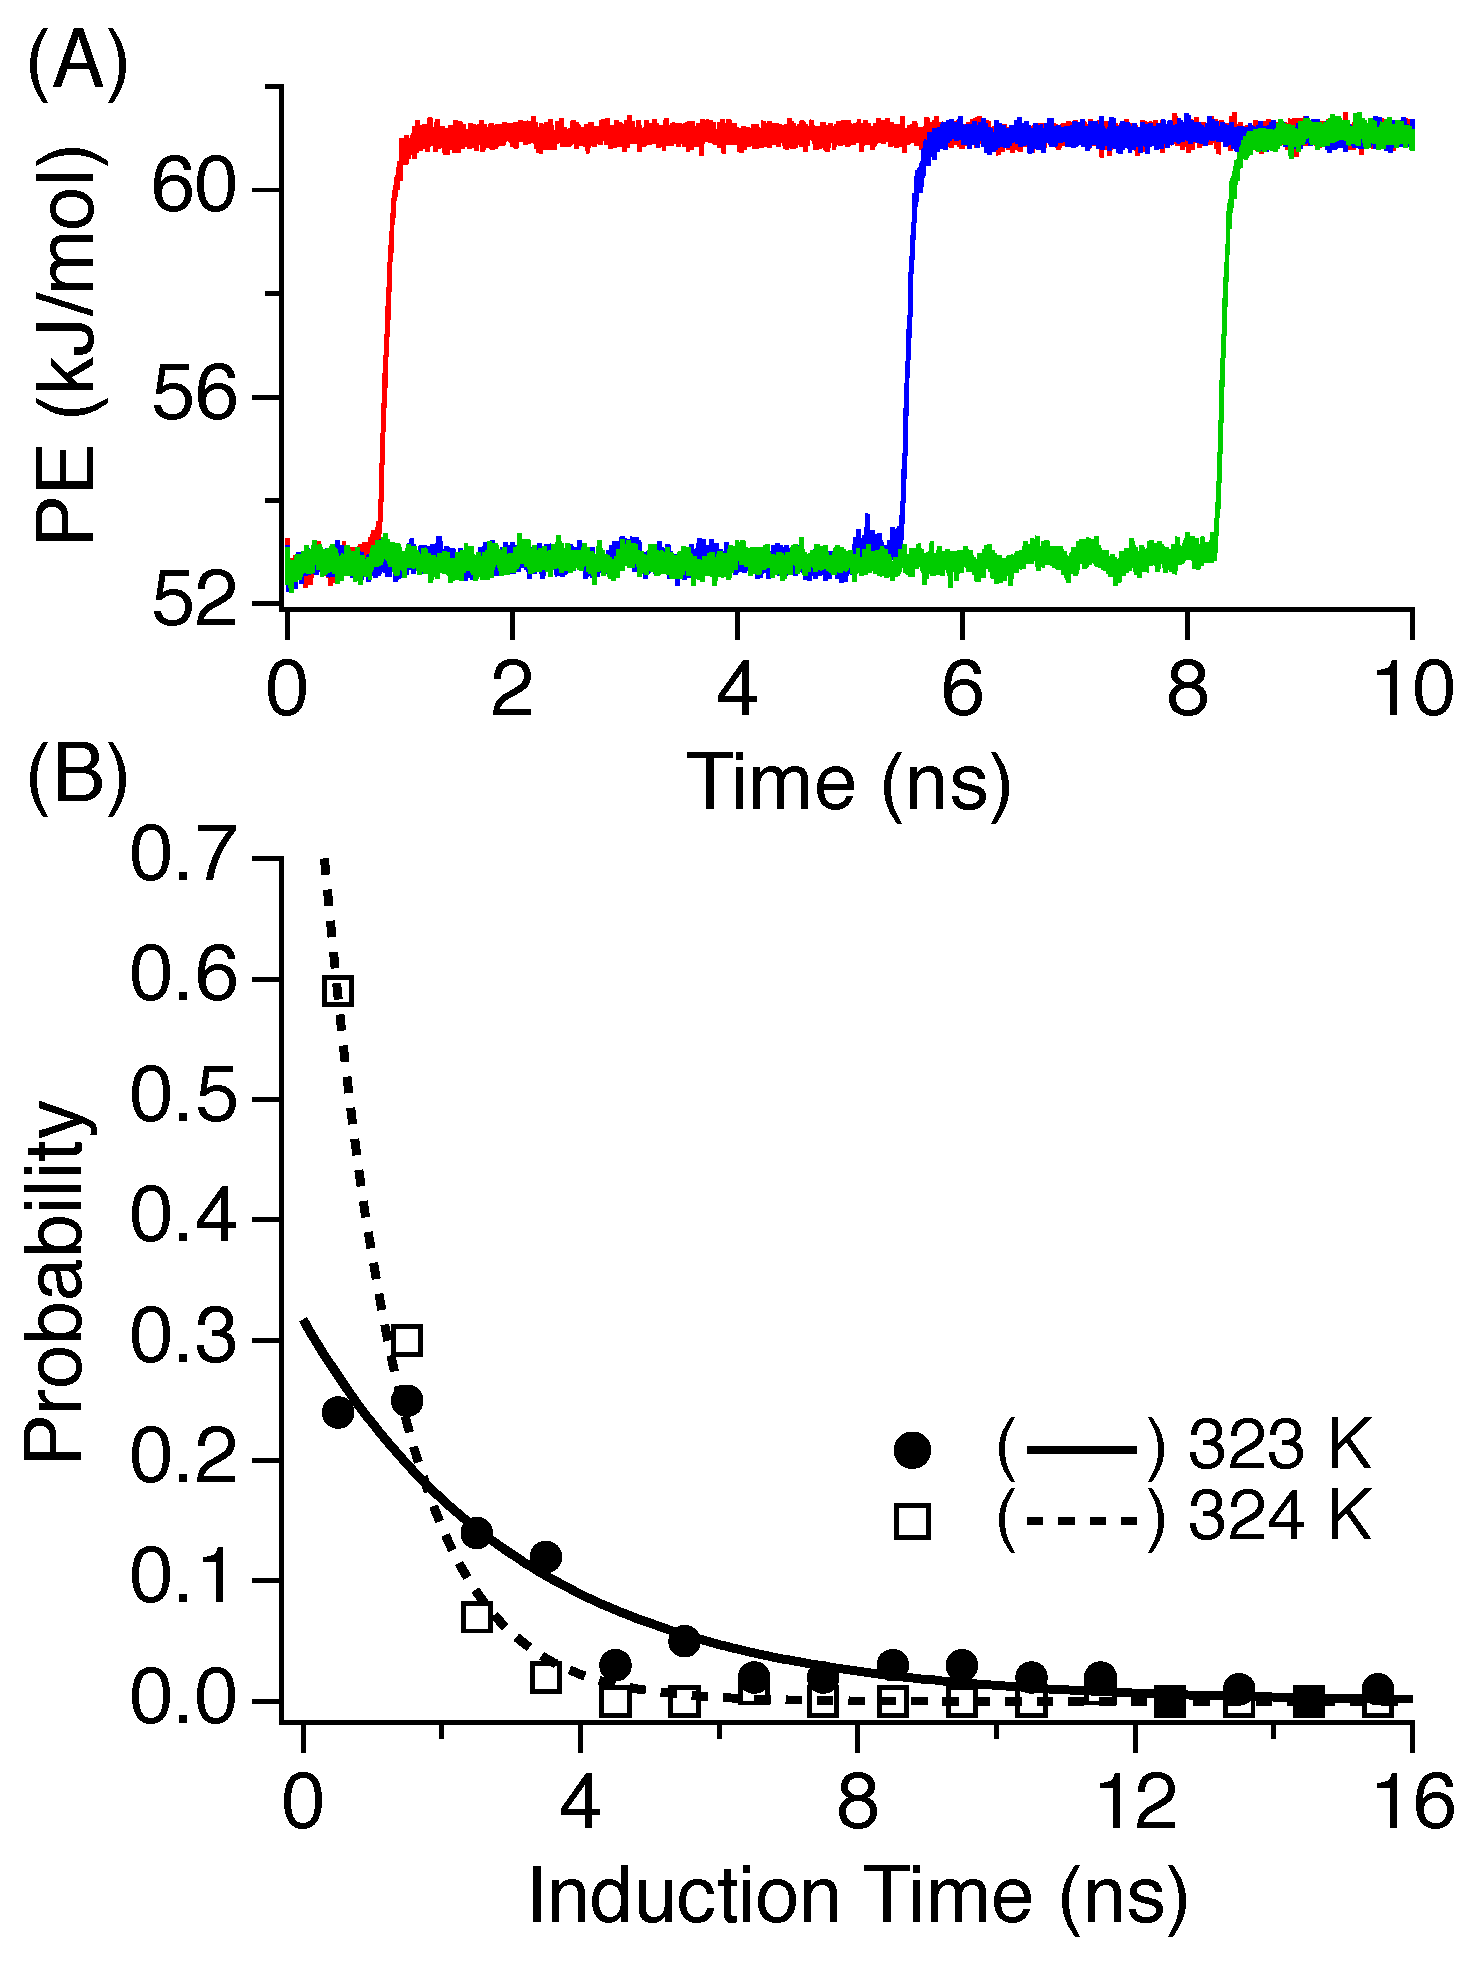
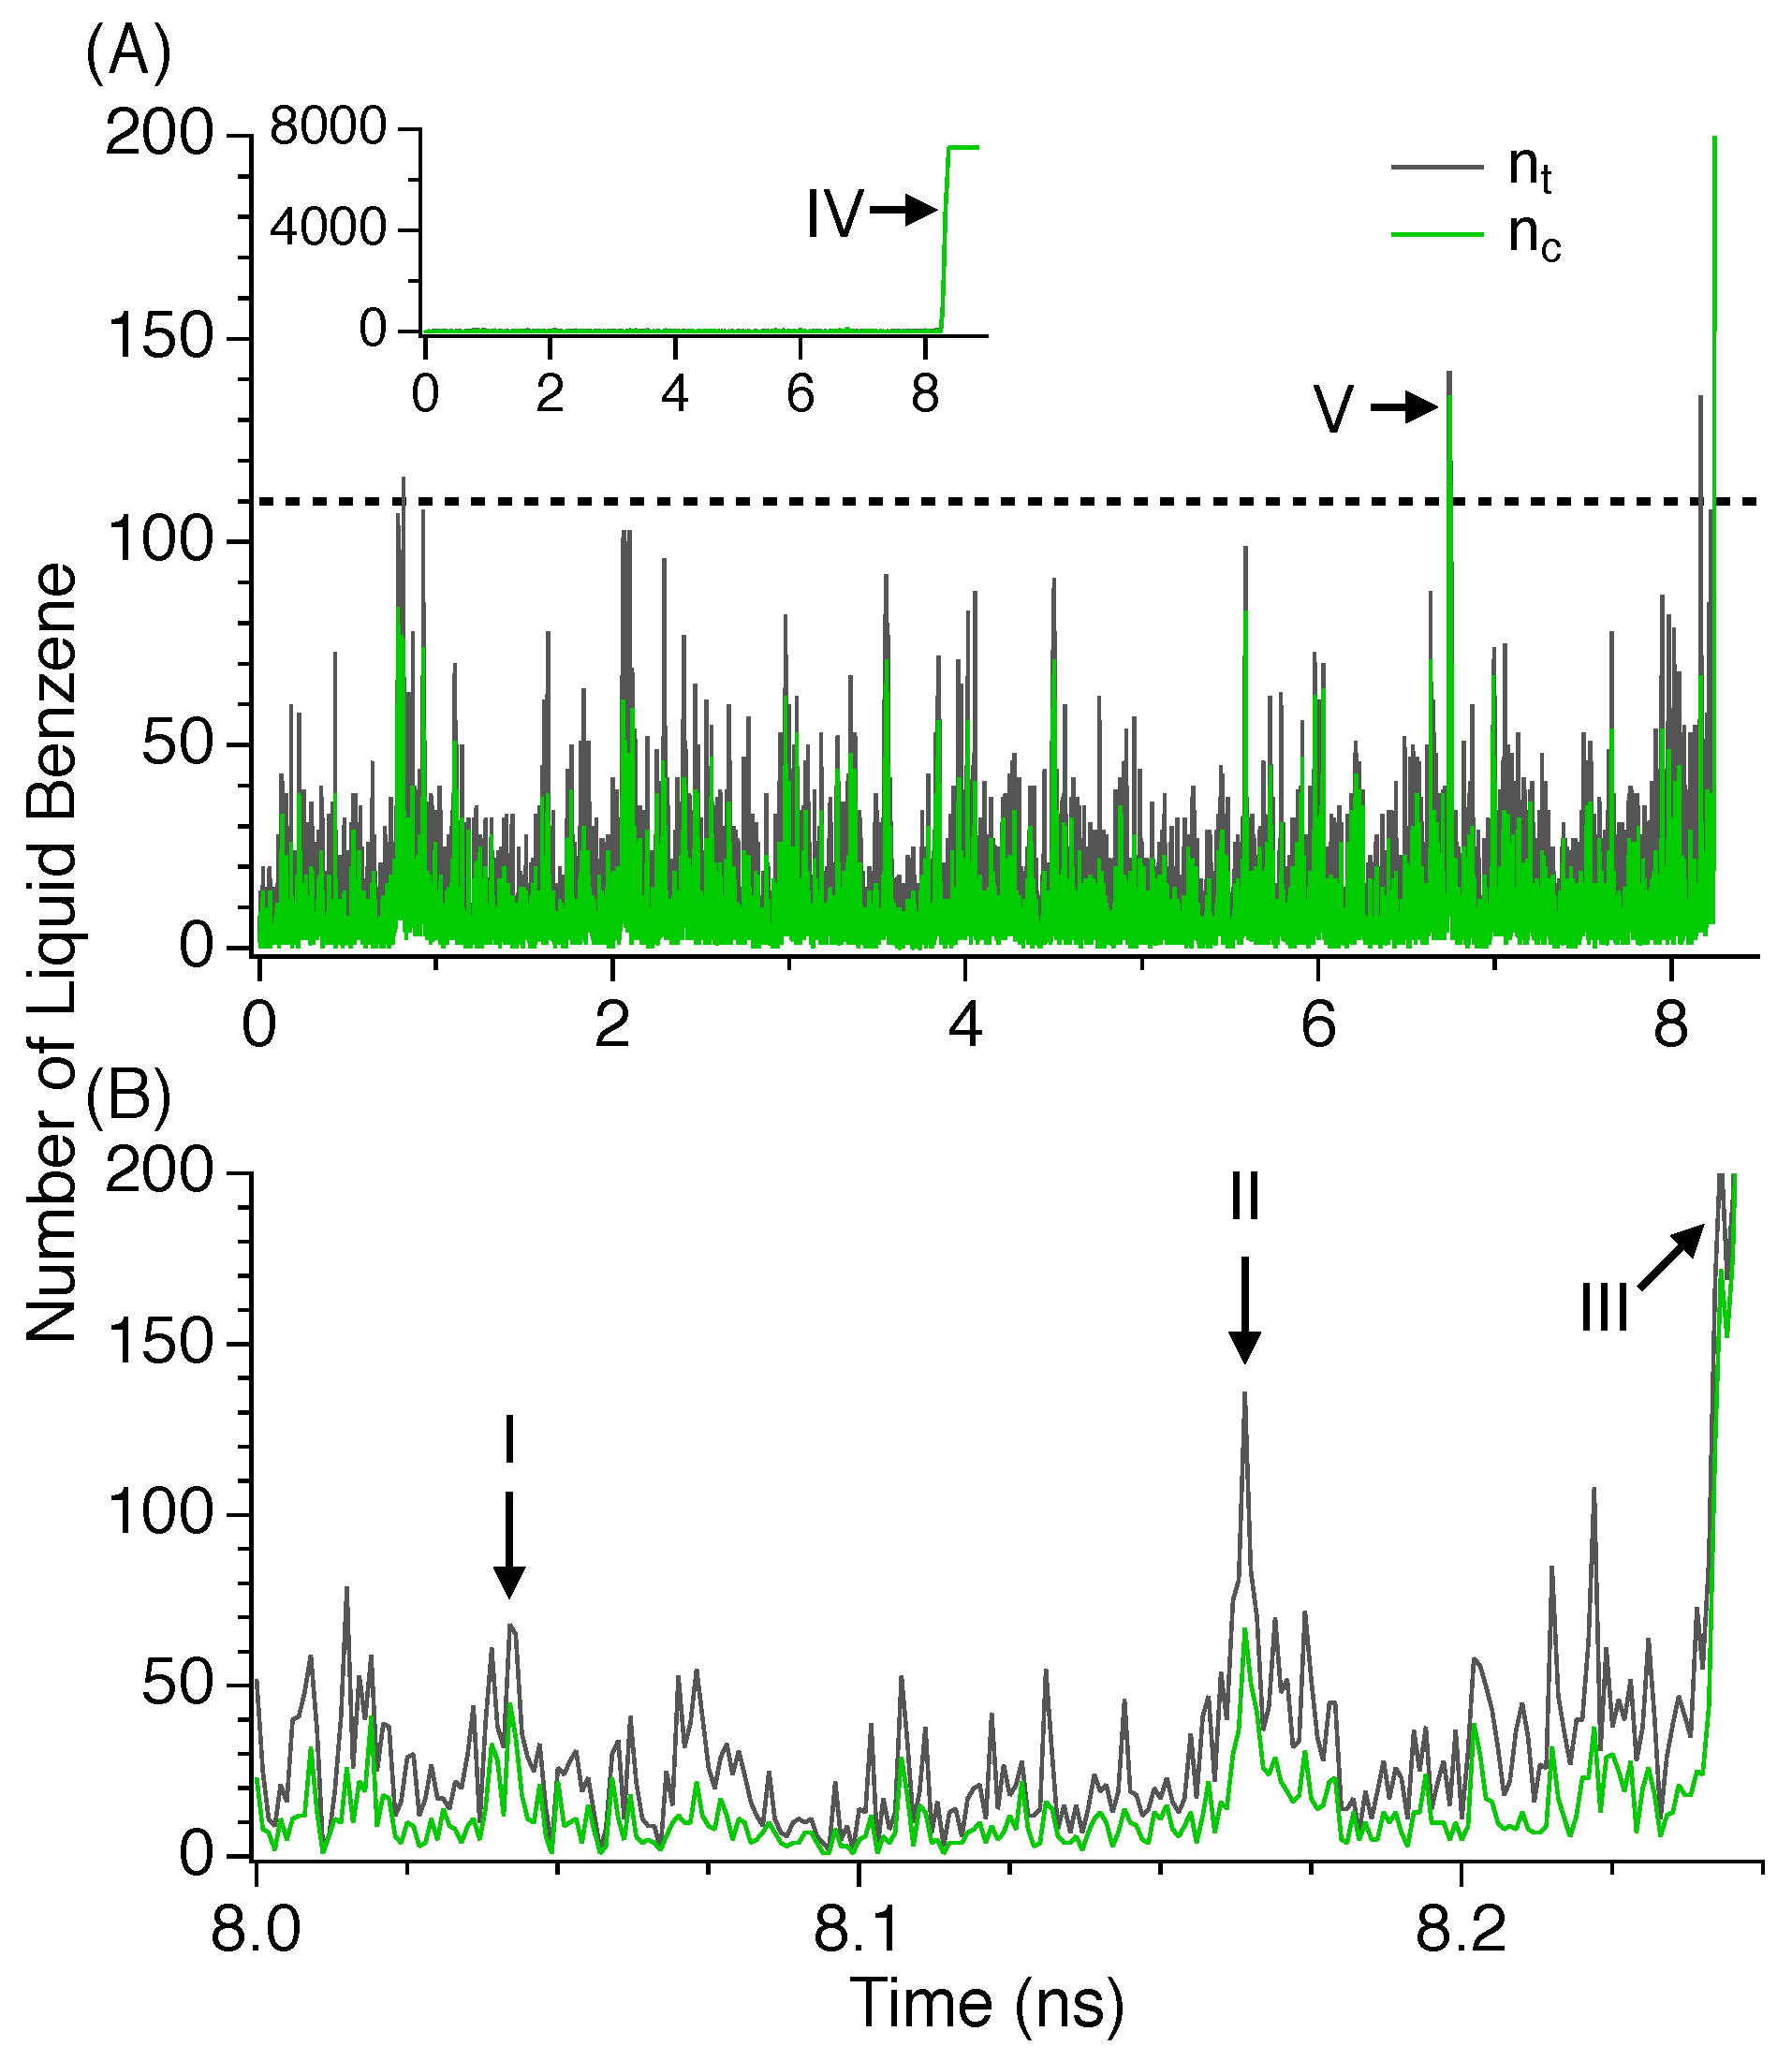
3.2. Induction Time
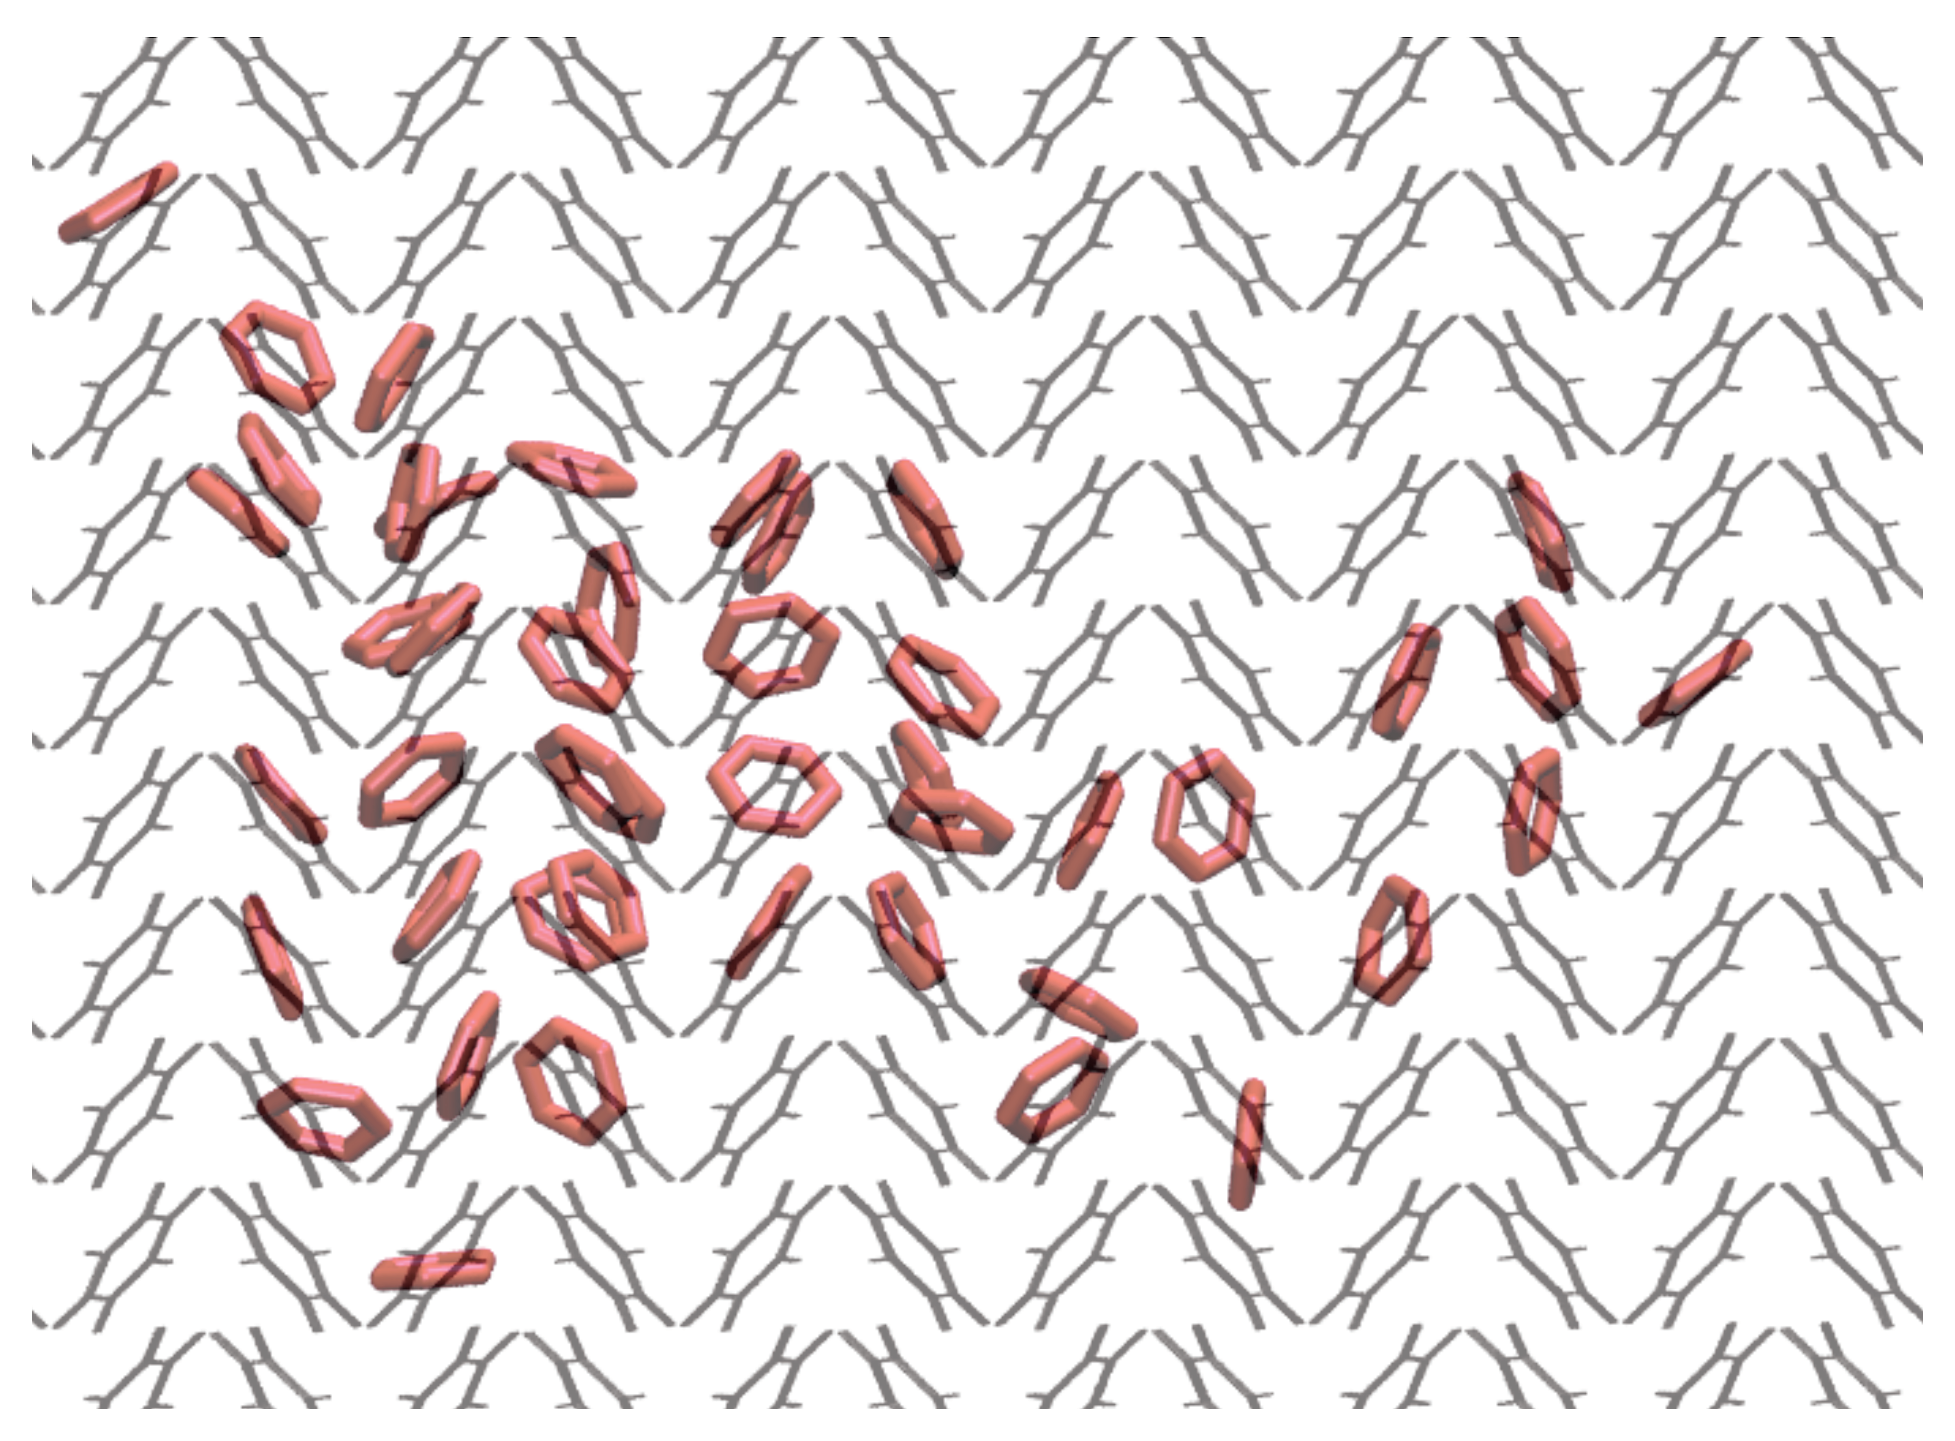
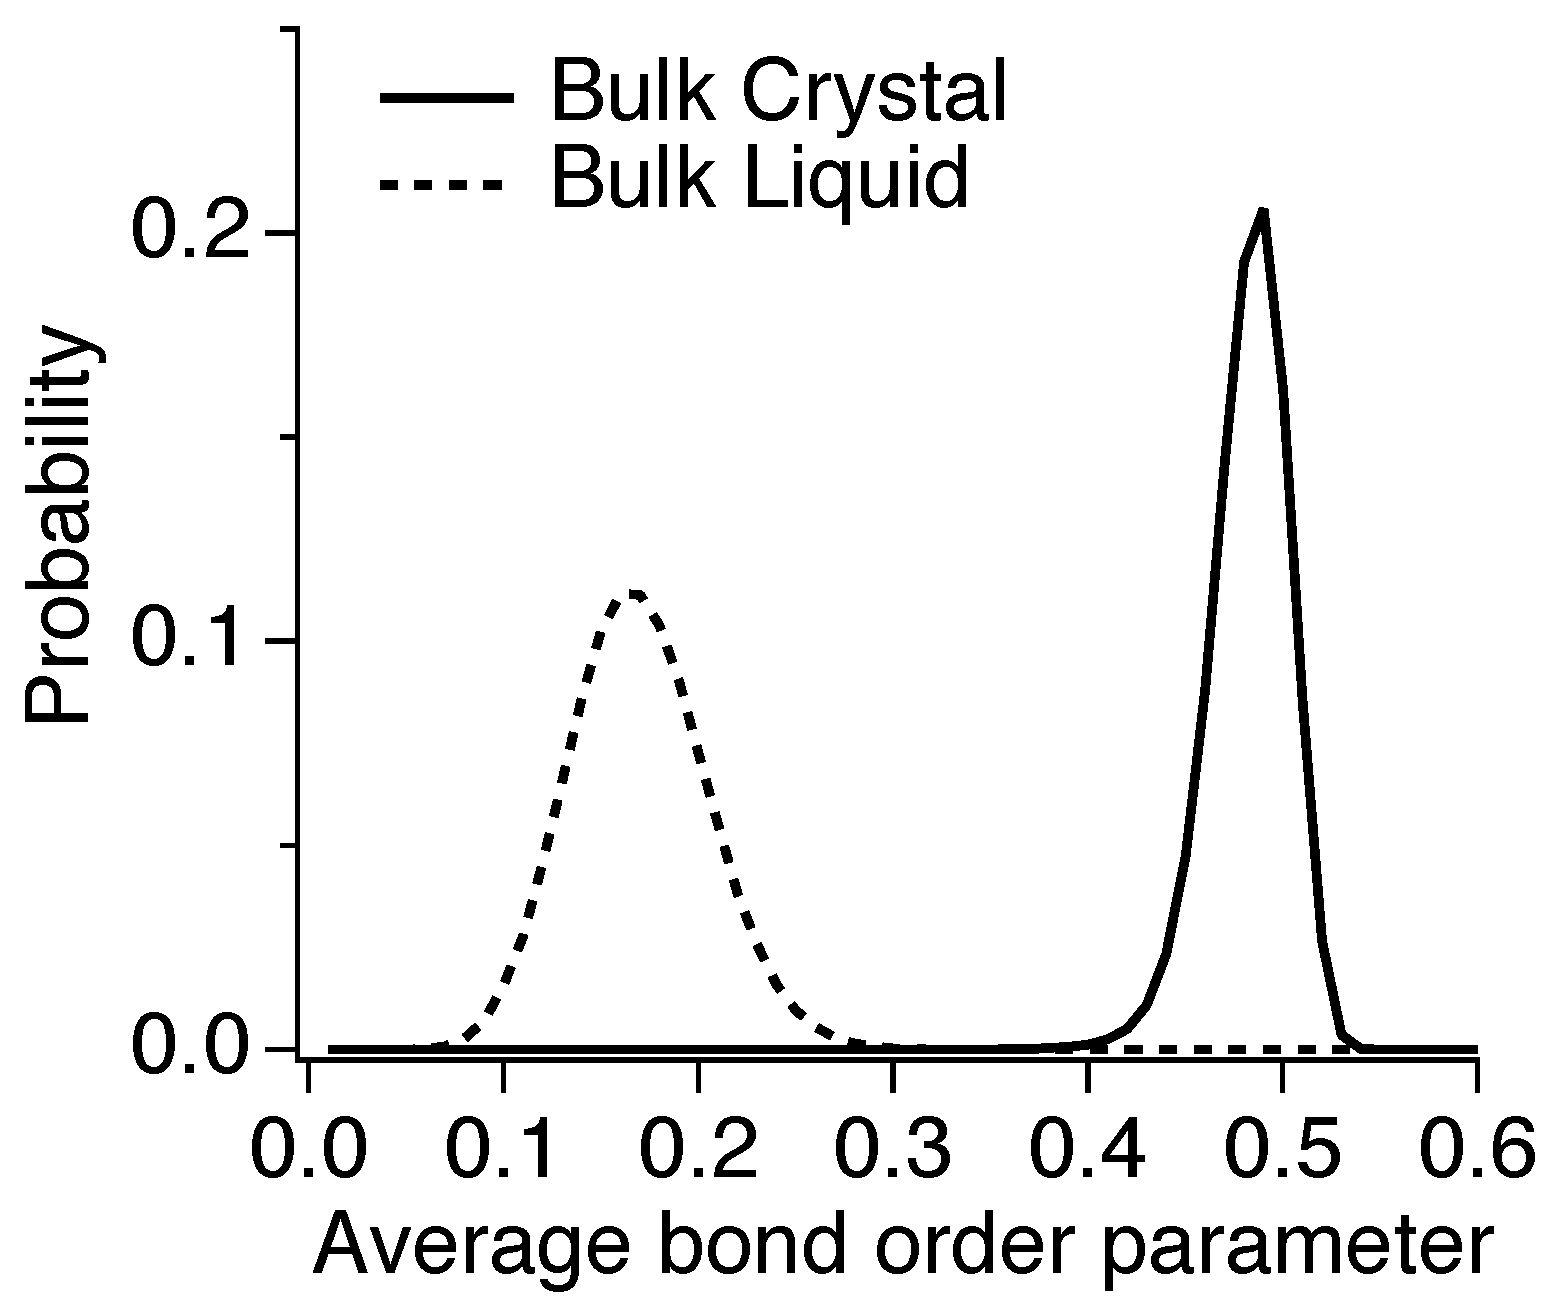
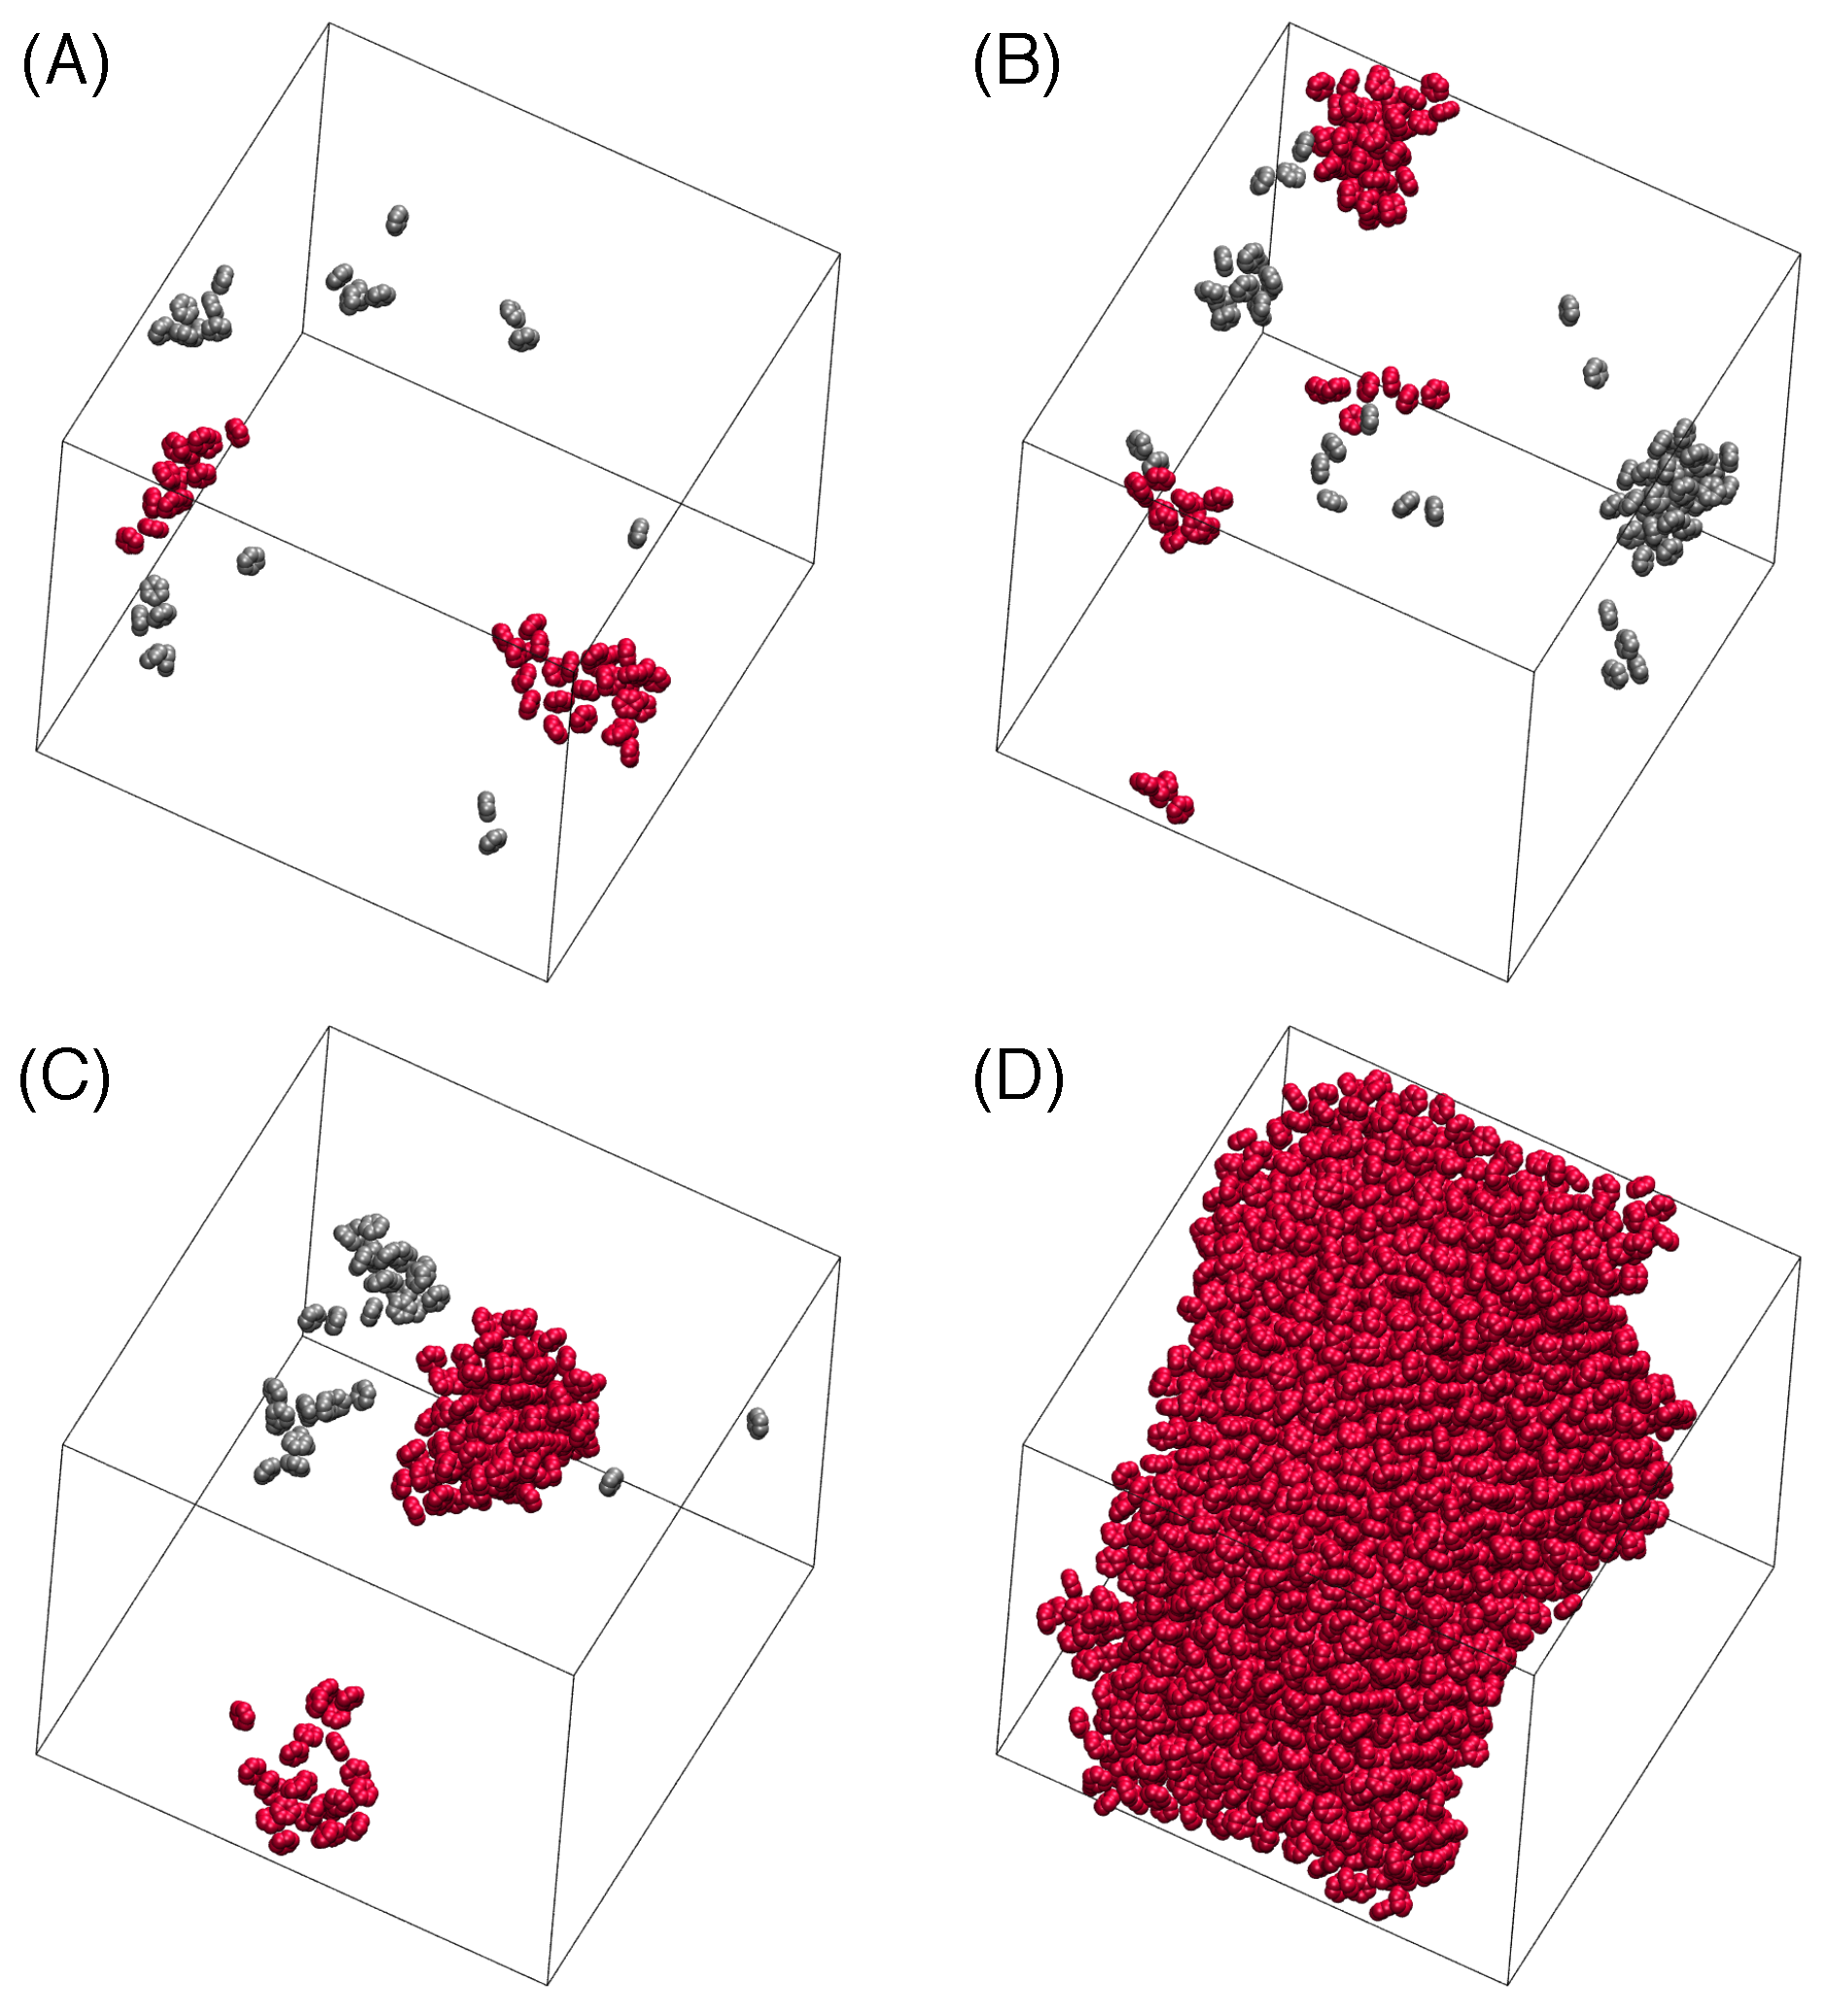
3.3. Nucleation
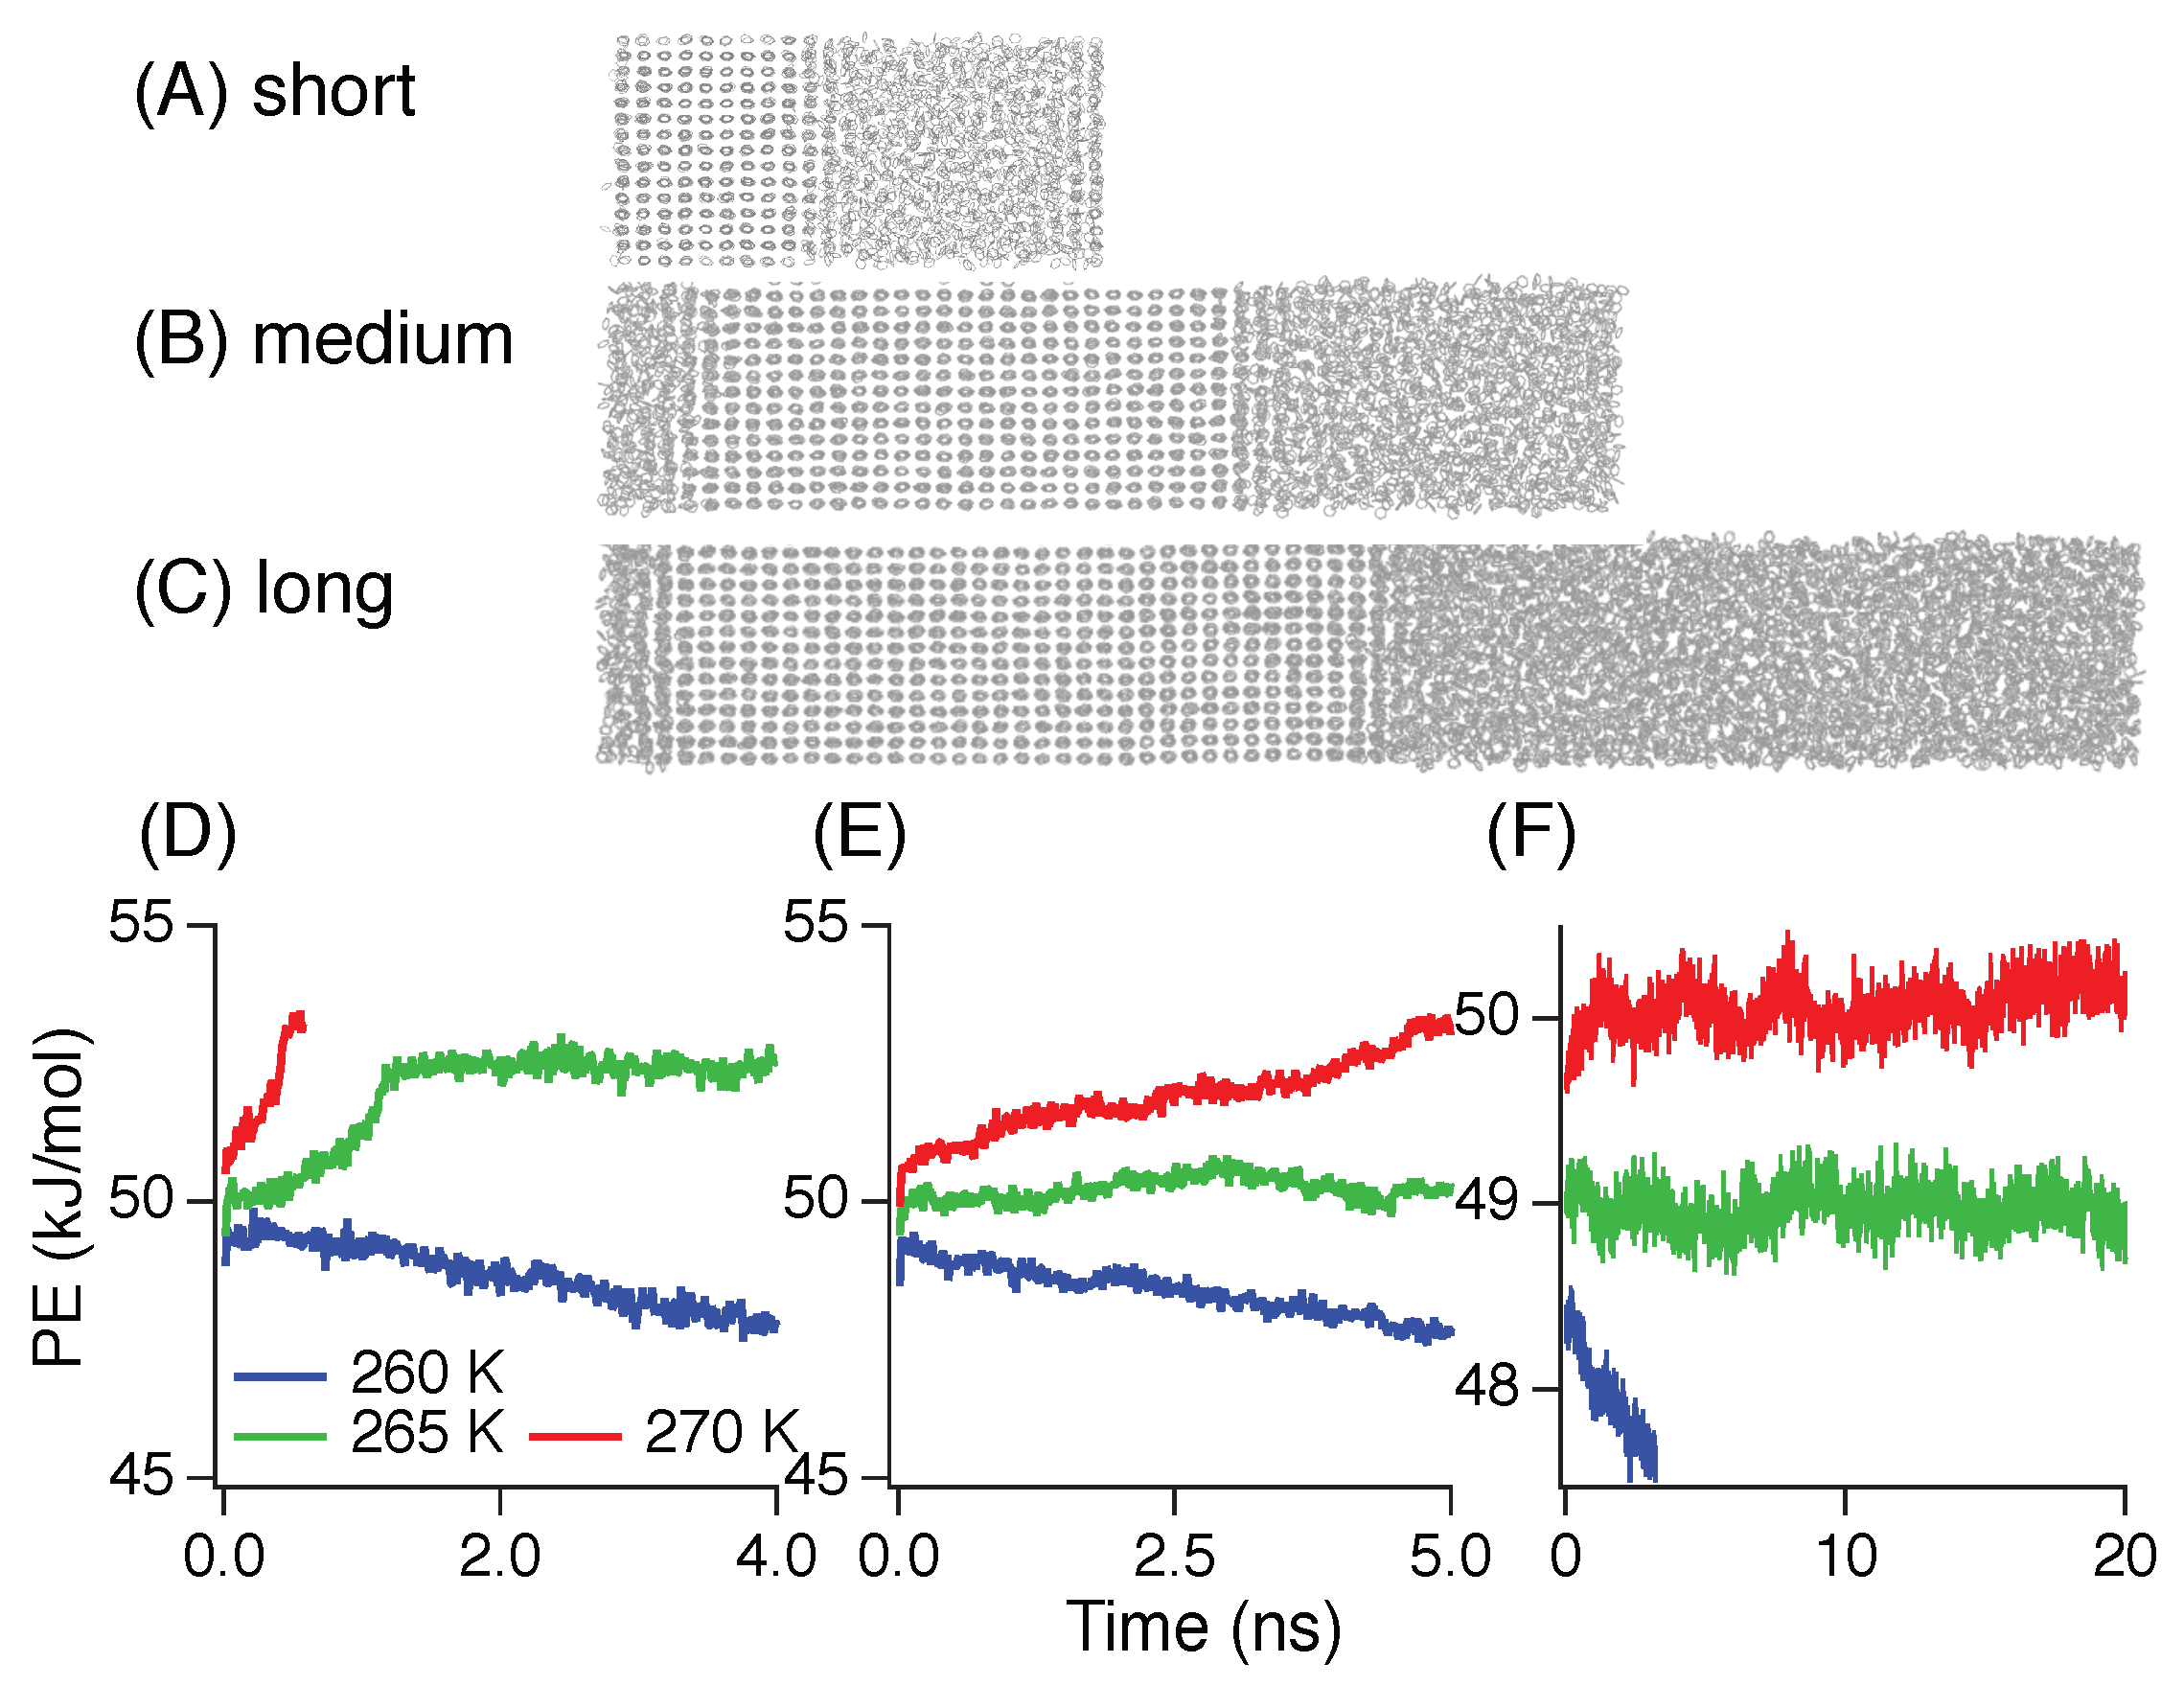
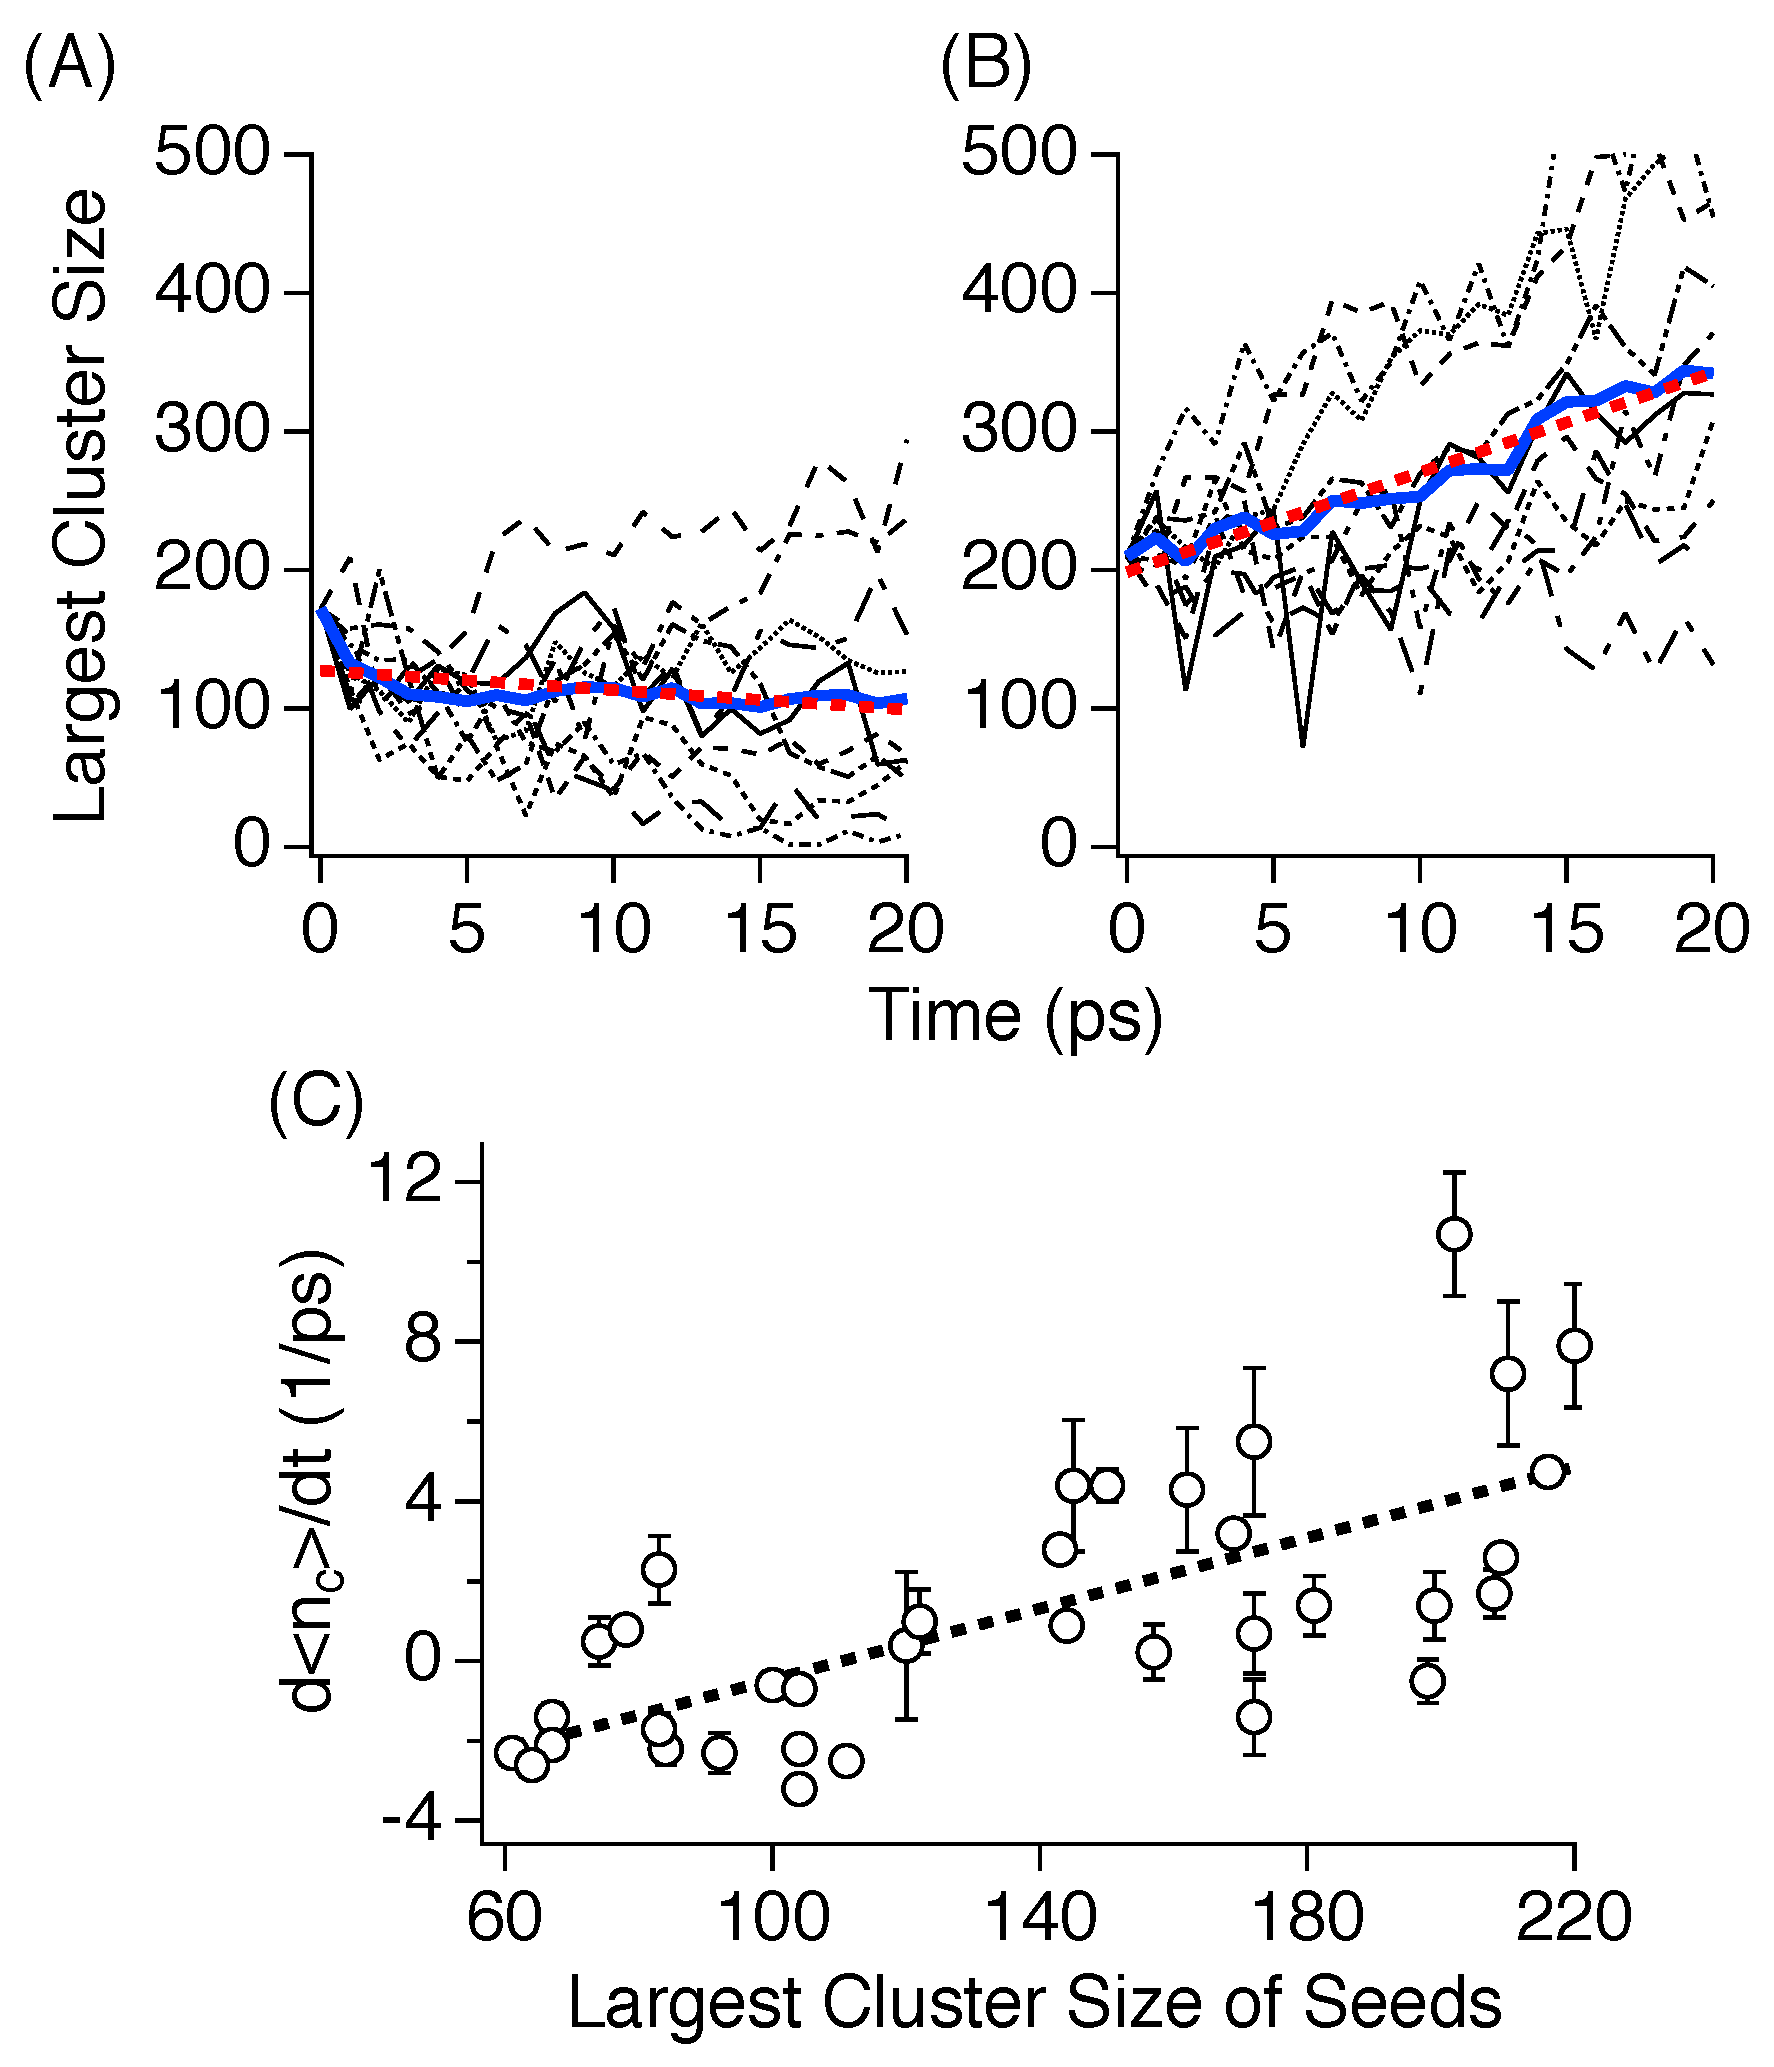
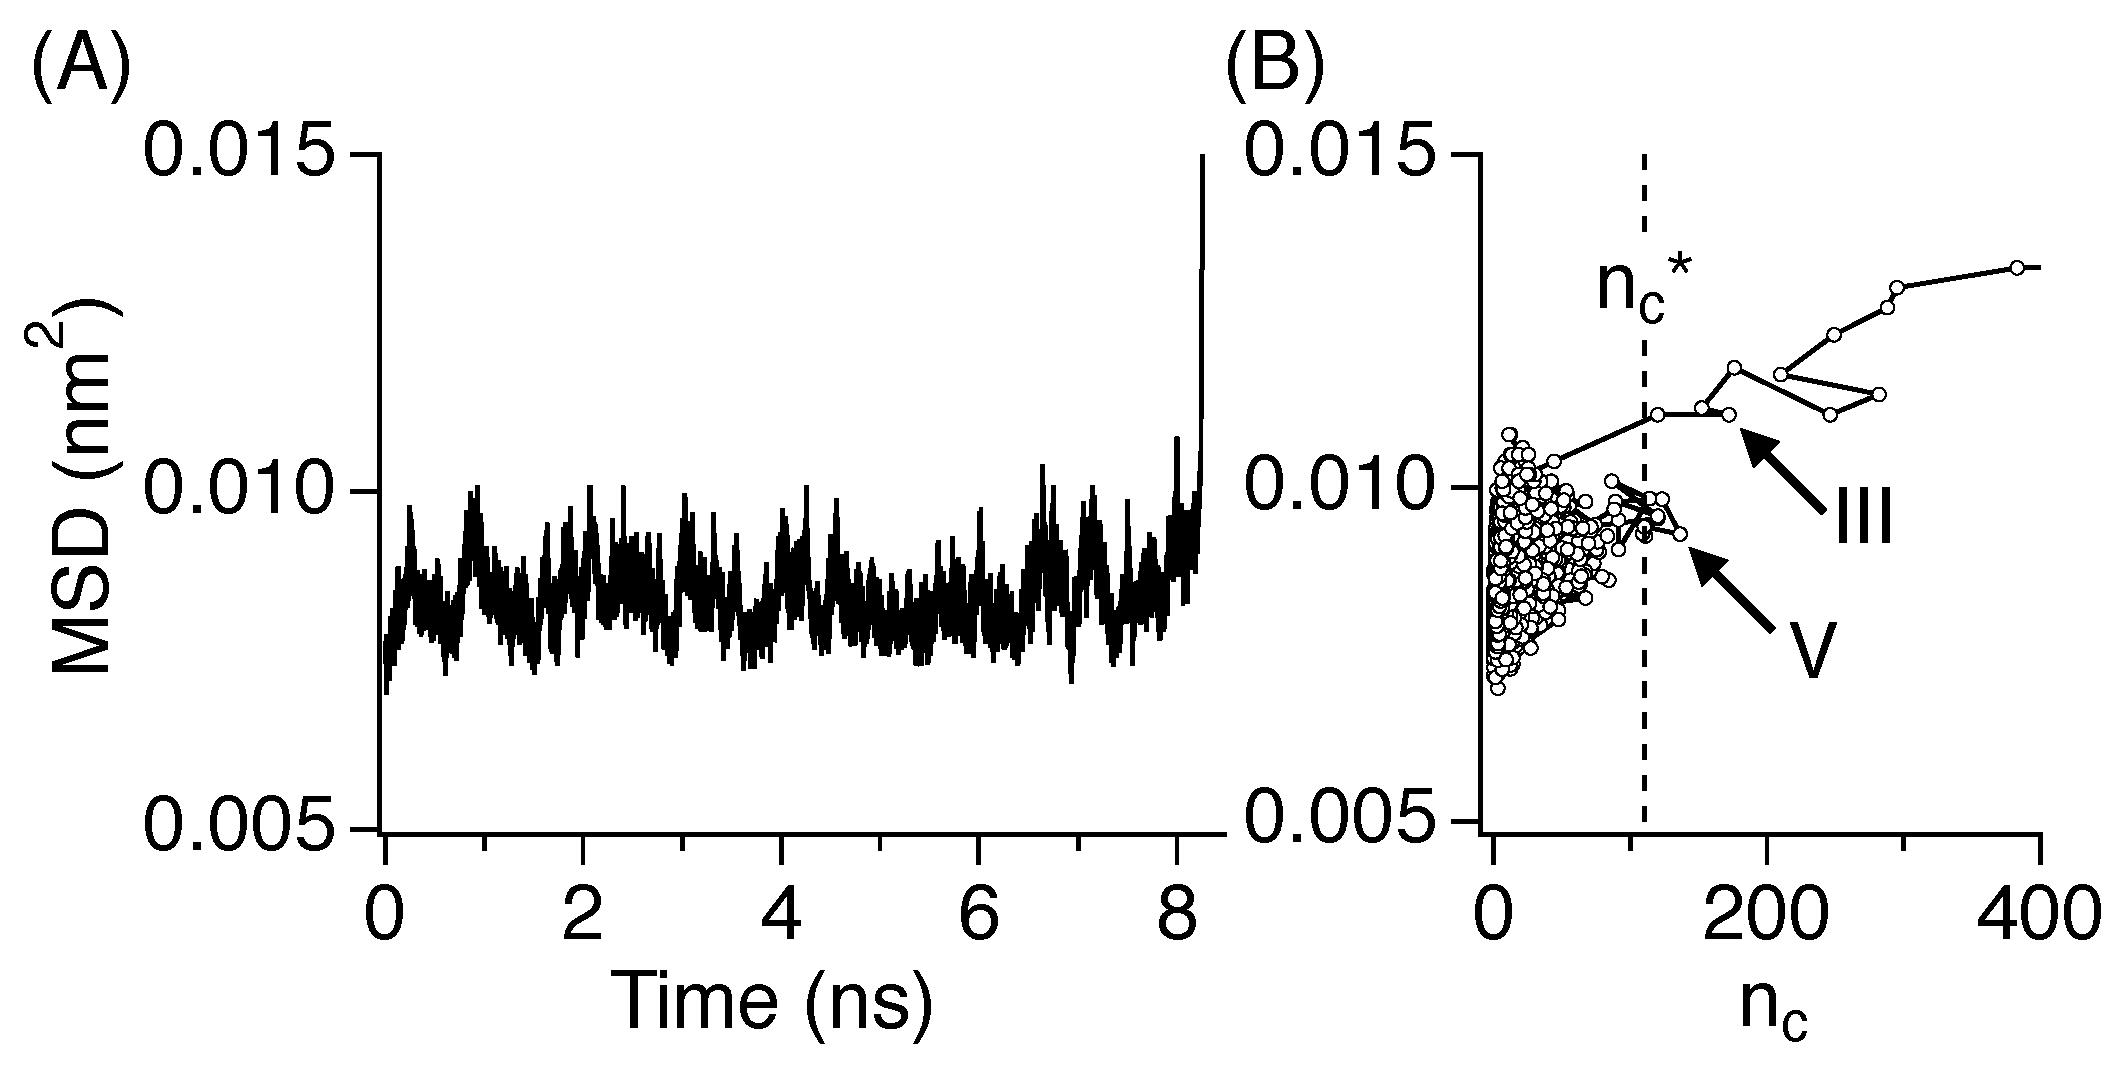
3.4. Critical Nucleus Size
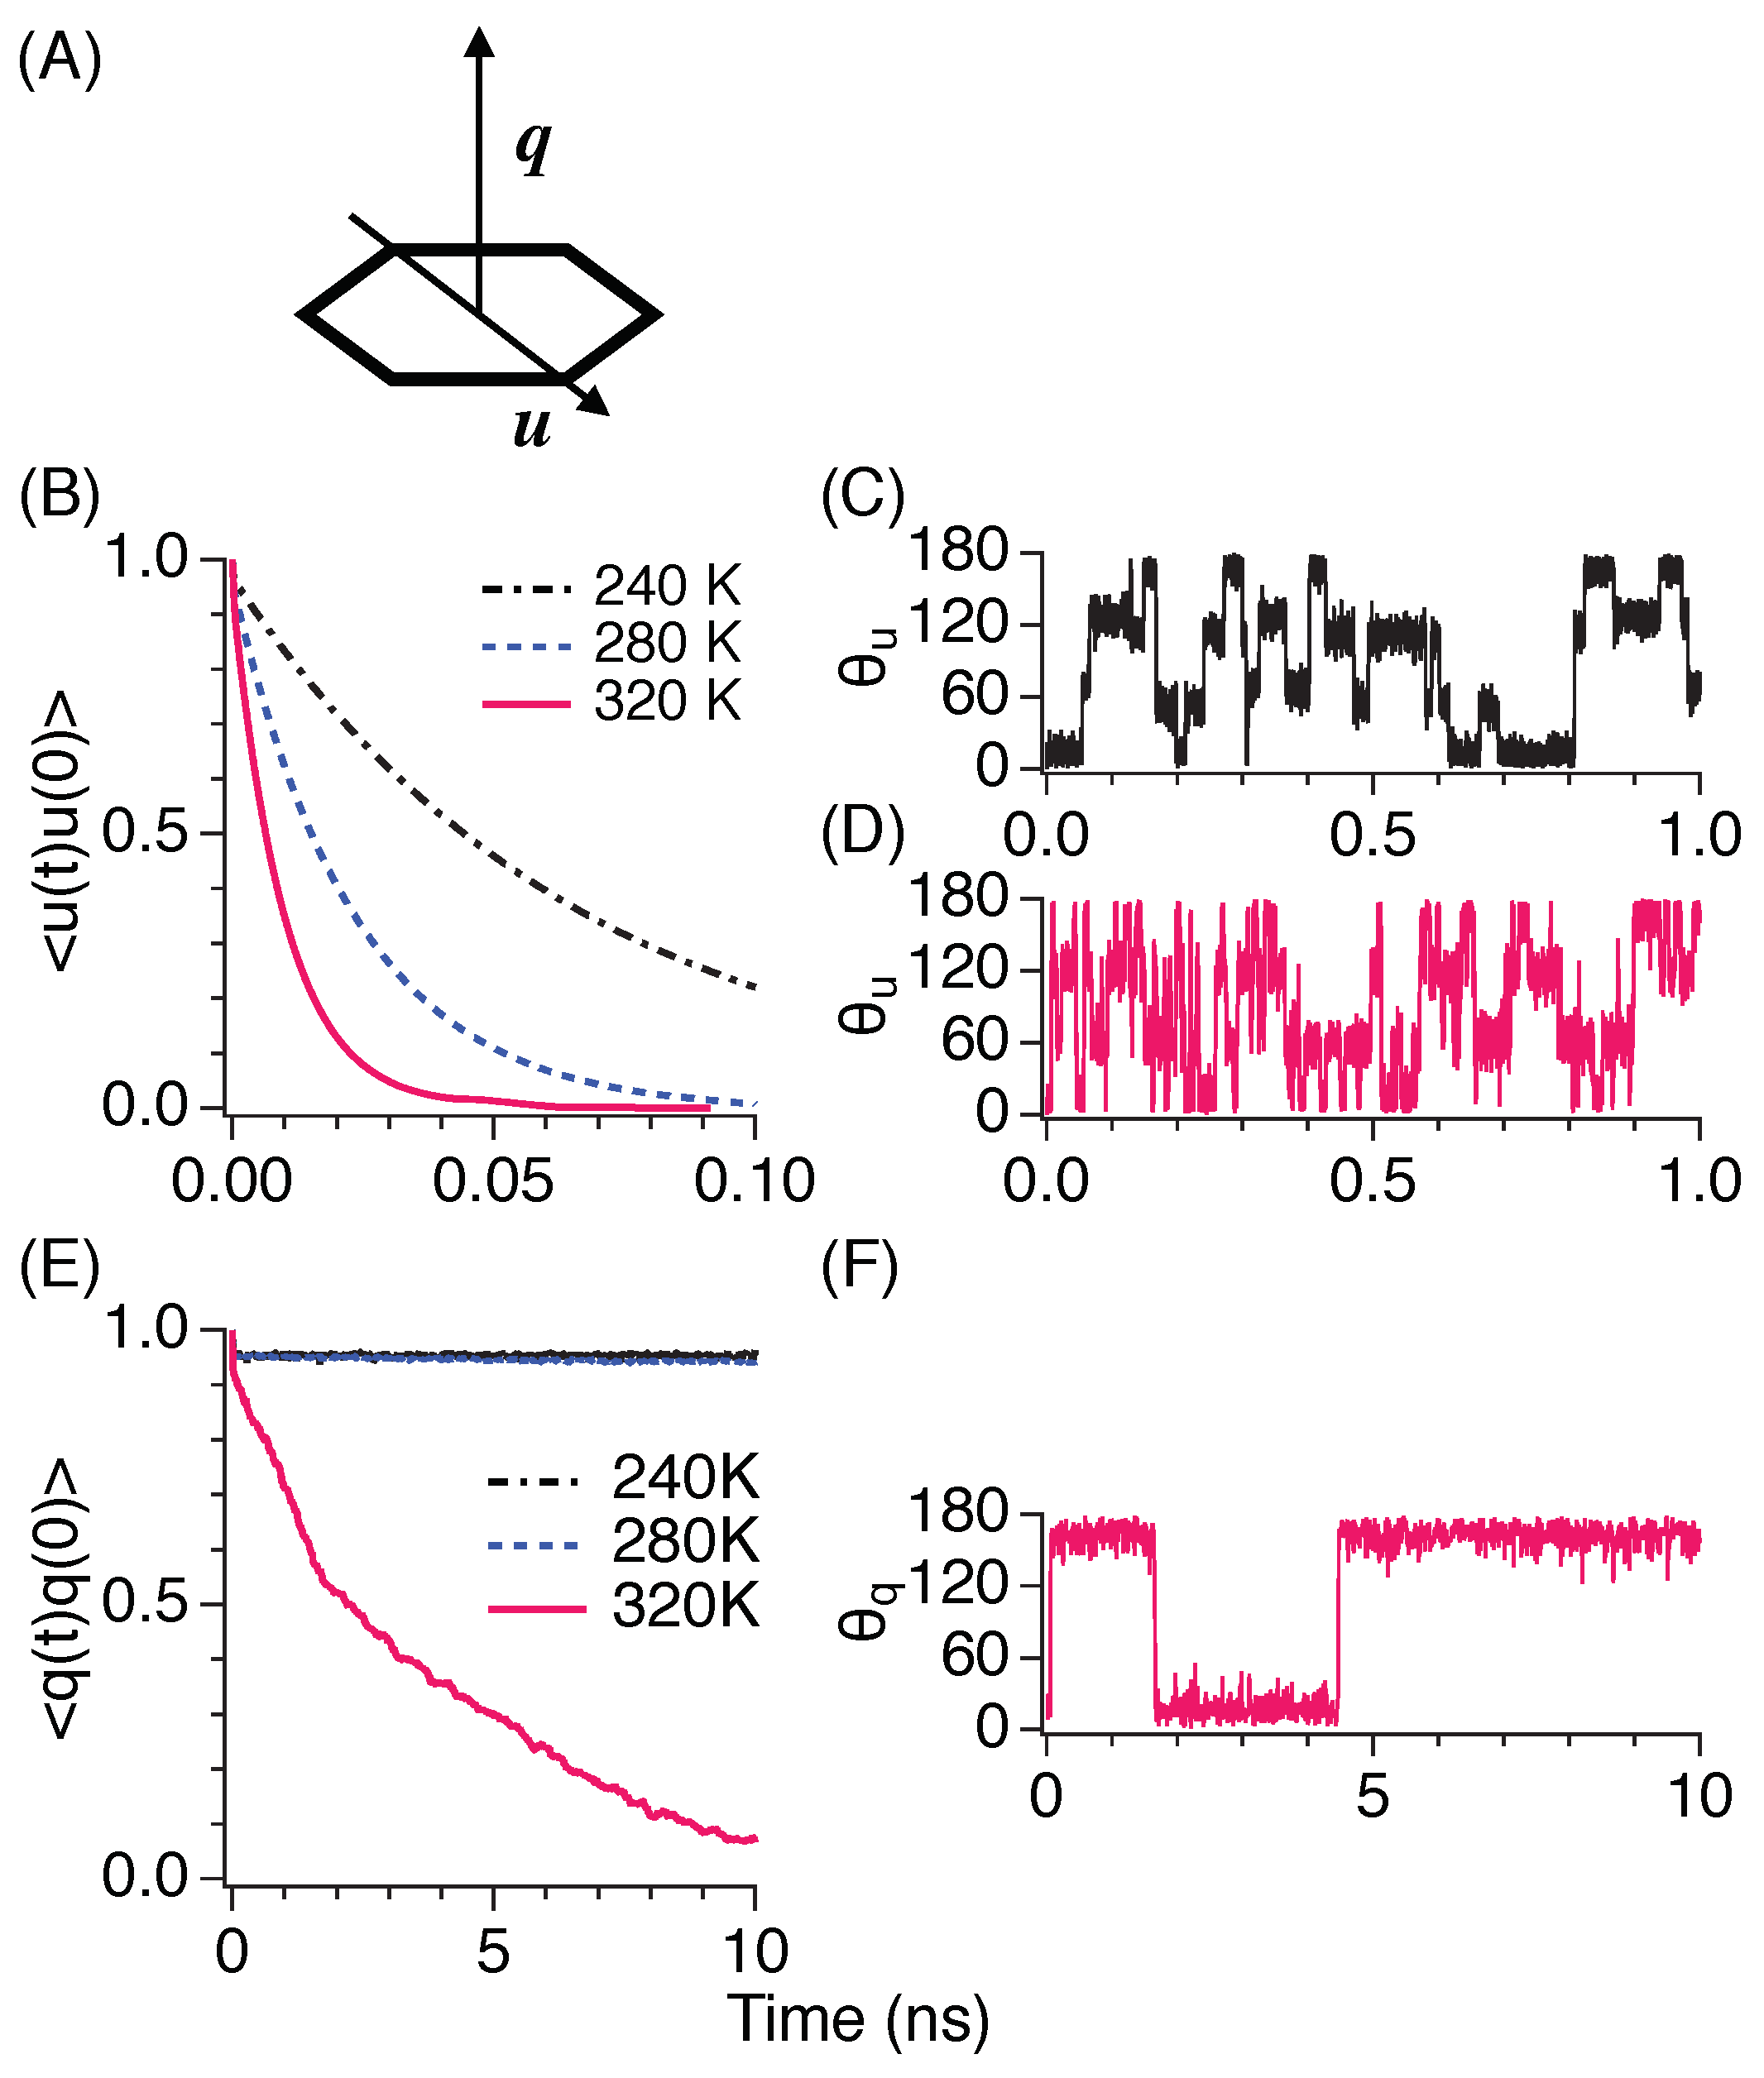
3.5. Diffusive Motion
3.6. Rotational Motion
4. Summary
Author Contributions
Funding
Acknowledgments
Conflicts of Interest
References
- Lindemann, F.A. Ueber die berechnung molekularer eigenfrequenzen. Z. Phys. 1910, 11, 609–612. [Google Scholar]
- Born, M. Thermodynamics of crystals and melting. J. Chem. Phys. 1939, 7, 591–603. [Google Scholar] [CrossRef]
- Murata, K.I.; Asakawa, H.; Nagashima, K.; Furukawa, Y.; Sazaki, G. Thermodynamic origin of surface melting on ice crystals. Proc. Natl. Acad. Sci. USA 2016, 113, E6741–E6748. [Google Scholar] [CrossRef] [PubMed]
- Li, B.; Wang, F.; Zhou, D.; Peng, Y.; Ni, R.; Han, Y. Modes of surface premelting in colloidal crystals composed of attractive particles. Nature 2016, 531, 485–488. [Google Scholar] [CrossRef] [PubMed]
- Banhart, F.; Hernández, E.; Terrones, M. Extreme superheating and supercooling of encapsulated metals in fullerenelike shells. Phys. Rev. Lett. 2003, 90, 185502. [Google Scholar] [CrossRef] [PubMed]
- Daeges, J.; Gleiter, H.; Perepezko, J.H. Superheating of metal crystals. Phys. Lett. A 1986, 119, 79–82. [Google Scholar] [CrossRef]
- Herman, J.W.; Elsayed-Ali, H.E. Superheating of Pb(111). Phys. Rev. Lett. 1992, 69, 1228–1231. [Google Scholar] [CrossRef] [PubMed]
- Siwick, B.J.; Dwyer, J.R.; Jordan, R.E.; Miller, R.J.D. An atomic-level view of melting using femtosecond electron diffraction. Science 2003, 302, 1382–1385. [Google Scholar] [CrossRef]
- Wang, Z.; Wang, F.; Peng, Y.; Zheng, Z.; Han, Y. Imaging the homogeneous nucleation during the melting of superheated colloidal crystals. Science 2012, 338, 87–90. [Google Scholar] [CrossRef]
- Wang, Z.; Wang, F.; Peng, Y.; Han, Y. Direct observation of liquid nucleus growth in homogeneous melting of colloidal crystals. Nat. Commun. 2015, 6, 6942. [Google Scholar] [CrossRef]
- Mo, M.Z.; Chen, Z.; Li, R.K.; Dunning, M.; Witte, B.B.L.; Baldwin, J.K.; Fletcher, L.B.; Kim, J.B.; Ng, A.; Redmer, R.; et al. Heterogeneous to homogeneous melting transition visualized with ultrafast electron diffraction. Science 2018, 360, 1451–1455. [Google Scholar] [CrossRef] [PubMed]
- Iglev, H.; Schmeisser, M.; Simeonidis, K.; Thaller, A.; Laubereau, A. Ultrafast superheating and melting of bulk ice. Nature 2006, 439, 183–186. [Google Scholar] [CrossRef] [PubMed]
- Wang, F.; Zhou, D.; Han, Y. Melting of Colloidal Crystals. Adv. Funct. Mater. 2016, 26, 8903–8919. [Google Scholar] [CrossRef]
- Wang, F.; Wang, Z.; Peng, Y.; Zheng, Z.; Han, Y. Homogeneous melting near the superheat limit of hard-sphere crystals. Soft Matter 2018, 14, 2447–2453. [Google Scholar] [CrossRef]
- Liang, S.; Yi, L.; Liang, D. Molecular Insights into the Homogeneous Melting of Methane Hydrates. J. Phys. Chem. C 2014, 118, 28542–28547. [Google Scholar] [CrossRef]
- Jin, Z.H.; Gumbsch, P.; Lu, K.; Ma, E. Melting mechanisms at the limit of superheating. Phys. Rev. Lett. 2001, 87, 055703. [Google Scholar] [CrossRef] [PubMed]
- Samanta, A.; Tuckerman, M.E.; Yu, T.Q.; Weinan, E. Microscopic mechanisms of equilibrium melting of a solid. Science 2014, 346, 729–732. [Google Scholar] [CrossRef]
- Grishina, N.; Buch, V. Structure and dynamics of orientational defects in ice I. J. Chem. Phys. 2004, 120, 5217–5225. [Google Scholar] [CrossRef]
- Donadio, D.; Raiteri, P.; Parrinello, M. Topological Defects and Bulk Melting of Hexagonal Ice. J. Phys. Chem. B 2005, 109, 5421–5424. [Google Scholar] [CrossRef]
- Mochizuki, K.; Matsumoto, M.; Ohmine, I. Defect pair separation as the controlling step in homogeneous ice melting. Nature 2013, 498, 350–354. [Google Scholar] [CrossRef]
- Forsblom, M.; Grimvall, G. How superheated crystals melt. Nat. Mater. 2005, 4, 388–390. [Google Scholar] [CrossRef] [PubMed]
- Forsblom, M.; Grimvall, G. Homogeneous melting of superheated crystals: Molecular dynamics simulations. Phys. Rev. B 2005, 72, 054107. [Google Scholar] [CrossRef]
- Zhang, H.; Khalkhali, M.; Liu, Q.; Douglas, J.F. String-like cooperative motion in homogeneous melting. J. Chem. Phys. 2013, 138, 12A538. [Google Scholar] [CrossRef]
- Delogu, F. Defect-mediated melting in superheated noble gas crystals. J. Phys. Chem. B 2005, 109, 20295–20302. [Google Scholar] [CrossRef] [PubMed]
- Delogu, F. Cooperative dynamics and self-diffusion in superheated crystals. J. Phys. Chem. B 2005, 109, 15291–15296. [Google Scholar] [CrossRef] [PubMed]
- Gómez, L.; Dobry, A.; Geuting, C.; Diep, H.T.; Burakovsky, L. Dislocation Lines as the Precursor of the Melting of Crystalline Solids Observed in Monte Carlo Simulations. Phys. Rev. Lett. 2003, 90, 095701. [Google Scholar] [CrossRef] [PubMed]
- Bai, X.M.; Li, M. Ring-diffusion mediated homogeneous melting in the superheating regime. Phys. Rev. B 2008, 77, 609–613. [Google Scholar] [CrossRef]
- Cahn, R.W. Melting from within. Nature 2001, 413, 582–583. [Google Scholar] [CrossRef]
- Raiteri, P.; Martoňák, R.; Parrinello, M. Exploring Polymorphism: The Case of Benzene. Angew. Chem. Int. Ed. 2005, 44, 3769–3773. [Google Scholar] [CrossRef]
- Chanyshev, A.D.; Litasov, K.D.; Rashchenko, S.V.; Sano-Furukawa, A.; Kagi, H.; Hattori, T.; Shatskiy, A.F.; Dymshits, A.M.; Sharygin, I.S.; Higo, Y. High-Pressure–High-Temperature Study of Benzene: Refined Crystal Structure and New Phase Diagram up to 8 GPa and 923 K. Cryst. Growth Des. 2018, 18, 3016–3026. [Google Scholar] [CrossRef]
- Wen, X.D.; Hoffmann, R.; Ashcroft, N.W. Benzene under High Pressure: A Story of Molecular Crystals Transforming to Saturated Networks, with a Possible Intermediate Metallic Phase. J. Am. Chem. Soc. 2011, 133, 9023–9035. [Google Scholar] [CrossRef] [PubMed]
- Headen, T.F.; Howard, C.A.; Skipper, N.T.; Wilkinson, M.A.; Bowron, D.T.; Soper, A.K. Structure of pi-pi interactions in aromatic liquids. J. Am. Chem. Soc. 2010, 132, 5735–5742. [Google Scholar] [CrossRef] [PubMed]
- Yoshida, K.; Fukuyama, N.; Yamaguchi, T.; Hosokawa, S.; Uchiyama, H.; Tsutsui, S.; Baron, A.Q.R. Inelastic X-ray scattering on liquid benzene analyzed using a generalized Langevin equation. Chem. Phys. Lett. 2017, 680, 1–5. [Google Scholar] [CrossRef]
- Nagasaka, M.; Yuzawa, H.; Mochizuki, K.; Rühl, E.; Kosugi, N. Temperature-Dependent Structural Changes in Liquid Benzene. J. Phys. Chem. Lett. 2018, 9, 5827–5832. [Google Scholar] [CrossRef] [PubMed]
- Shah, M.; Santiso, E.E.; Trout, B.L. Computer simulations of homogeneous nucleation of benzene from the melt. J. Phys. Chem. B 2011, 115, 10400–10412. [Google Scholar] [CrossRef] [PubMed]
- Tohji, K.; Murata, Y. X-Ray Diffraction Study of the Melting of Benzene. Jpn. J. Appl. Phys. 1982, 21, 1199–1204. [Google Scholar] [CrossRef]
- Craven, C.J.; Hatton, P.D.; Howard, C.J.; Pawley, G.S. The structure and dynamics of solid benzene. I. A neutron powder diffraction study of deuterated benzene from 4 K to the melting point. J. Chem. Phys. 1993, 98, 8236–8243. [Google Scholar] [CrossRef]
- MacKerell, A.D.; Bashford, D.; Bellott, M.; Dunbrack, R.L.; Evanseck, J.D.; Field, M.J.; Fischer, S.; Gao, J.; Guo, H.; Ha, S.; et al. All-atom empirical potential for molecular modeling and dynamics studies of proteins. J. Phys. Chem. B 1998, 102, 3586–3616. [Google Scholar] [CrossRef]
- MacKerell, A.D.; Wiorkiewicz-Kuczera, J.; Karplus, M. An all-atom empirical energy function for the simulation of nucleic acids. J. Am. Chem. Soc. 1995, 117, 11946–11975. [Google Scholar] [CrossRef]
- Nemkevich, A.; Bürgi, H.B.; Spackman, M.A.; Corry, B. Molecular dynamics simulations of structure and dynamics of organic molecular crystals. Phys. Chem. Chem. Phys. 2010, 12, 14916–14929. [Google Scholar] [CrossRef]
- Tsuzuki, S.; Honda, K.; Uchimaru, T.; Mikami, M.; Tanabe, K. Origin of attraction and directionality of the pi/pi interaction: Model chemistry calculations of benzene dimer interaction. J. Am. Chem. Soc. 2002, 124, 104–112. [Google Scholar] [CrossRef] [PubMed]
- Miller, E.D.; Jones, M.L.; Jankowski, E. Enhanced Computational Sampling of Perylene and Perylothiophene Packing with Rigid-Body Models. ACS Omega 2017, 2, 353–362. [Google Scholar] [CrossRef]
- Darden, T.; York, D.; Pedersen, L. Particle mesh Ewald: An N·log(N) method for Ewald sums in large systems. J. Chem. Phys. 1993, 98, 10089–10092. [Google Scholar] [CrossRef]
- Berendsen, H.J.C.; van der Spoel, D.; van Drunen, R. GROMACS: A message-passing parallel molecular dynamics implementation. Comput. Phys. Commun. 1995, 91, 43–56. [Google Scholar] [CrossRef]
- Hoover, W.G. Canonical dynamics: Equilibrium phase-space distributions. Phys. Rev. A 1985, 31, 1695–1697. [Google Scholar] [CrossRef]
- Nosé, S. A molecular dynamics method for simulations in the canonical ensemble. Mol. Phys. 1984, 52, 255–268. [Google Scholar] [CrossRef]
- Berendsen, H.J.C.; Postma, J.P.M.; van Gunsteren, W.F.; DiNola, A.; Haak, J.R. Molecular dynamics with coupling to an external bath. J. Chem. Phys. 1984, 81, 3684–3690. [Google Scholar] [CrossRef]
- Bacon, G.; Curry, N.; Wilson, S. A crystalloraphic study of solid benzene by neutron diffraction. Proc. R. Soc. Lond. A 1964, 279, 98–110. [Google Scholar]
- Cox, E.G.; Cruickshank, D.W.J.; Smith, J.A.S. The Crystal Structure of Benzene at -3Formula C. Proc. R. Soc. Lond. Ser. A 1958, 247, 1–21. [Google Scholar]
- García Fernández, R.; Abascal, J.L.F.; Vega, C. The melting point of ice Ih for common water models calculated from direct coexistence of the solid-liquid interface. J. Chem. Phys. 2006, 124, 144506. [Google Scholar] [CrossRef]
- Yagasaki, T.; Matsumoto, M.; Tanaka, H. Phase Diagrams of TIP4P/2005, SPC/E, and TIP5P Water at High Pressure. J. Phys. Chem. B 2018, 122, 7718–7725. [Google Scholar] [CrossRef]
- Frenkel, D. Simulations: The dark side. Eur. Phys. J. Plus 2013, 128, 10. [Google Scholar] [CrossRef]
- Akella, J.; Kennedy, G.C. Phase Diagram of Benzene to 35 kbar. J. Chem. Phys. 1971, 55, 793–796. [Google Scholar] [CrossRef]
- Mochizuki, K.; Himoto, K.; Matsumoto, M. Diversity of transition pathways in the course of crystallization into ice VII. Phys. Chem. Chem. Phys. 2014, 16, 16419–16425. [Google Scholar] [CrossRef] [PubMed]
- Alfè, D.; Cazorla, C.; Gillan, M.J. The kinetics of homogeneous melting beyond the limit of superheating. J. Chem. Phys. 2011, 135, 024102. [Google Scholar] [CrossRef] [PubMed]
- Knezic, D.; Zaccaro, J.; Myerson, A.S. Nucleation Induction Time in Levitated Droplets. J. Phys. Chem. B 2004, 108, 10672–10677. [Google Scholar] [CrossRef]
- Erdemir, D.; Lee, A.Y.; Myerson, A.S. Nucleation of crystals from solution: Classical and two-step models. Acc. Chem. Res. 2009, 42, 621–629. [Google Scholar] [CrossRef]
- Lechner, W.; Dellago, C. Accurate determination of crystal structures based on averaged local bond order parameters. J. Chem. Phys. 2008, 129, 114707. [Google Scholar] [CrossRef]
- Knott, B.C.; Molinero, V.; Doherty, M.F.; Peters, B. Homogeneous Nucleation of Methane Hydrates: Unrealistic under Realistic Conditions. J. Am. Chem. Soc. 2012, 134, 19544–19547. [Google Scholar] [CrossRef]
- Zimmermann, N.E.R.; Vorselaars, B.; Quigley, D.; Peters, B. Nucleation of NaCl from Aqueous Solution: Critical Sizes, Ion-Attachment Kinetics, and Rates. J. Am. Chem. Soc. 2015, 137, 13352–13361. [Google Scholar] [CrossRef]
- Yago, T.; Tamaki, Y.; Furube, A.; Katoh, R. Growth of β-Perylene Crystal. Chem. Lett. 2007, 36, 370–371. [Google Scholar] [CrossRef]
- Ito, F.; Kogasaka, Y.; Yamamoto, K. Fluorescence spectral changes of perylene in polymer matrices during the solvent evaporation process. J. Phys. Chem. B 2013, 117, 3675–3681. [Google Scholar] [CrossRef] [PubMed]


© 2019 by the author. Licensee MDPI, Basel, Switzerland. This article is an open access article distributed under the terms and conditions of the Creative Commons Attribution (CC BY) license (http://creativecommons.org/licenses/by/4.0/).
Share and Cite
Mochizuki, K. Computational Study on Homogeneous Melting of Benzene Phase I. Crystals 2019, 9, 84. https://doi.org/10.3390/cryst9020084
Mochizuki K. Computational Study on Homogeneous Melting of Benzene Phase I. Crystals. 2019; 9(2):84. https://doi.org/10.3390/cryst9020084
Chicago/Turabian StyleMochizuki, Kenji. 2019. "Computational Study on Homogeneous Melting of Benzene Phase I" Crystals 9, no. 2: 84. https://doi.org/10.3390/cryst9020084
APA StyleMochizuki, K. (2019). Computational Study on Homogeneous Melting of Benzene Phase I. Crystals, 9(2), 84. https://doi.org/10.3390/cryst9020084