Article

DEMAND, a Dimensional Extreme Magnetic Neutron Diffractometer at the High Flux Isotope Reactor

1
Neutron Scattering Division, Oak Ridge National Laboratory, Oak Ridge, TN 37831, USA
2
Neutron Technologies Division, Oak Ridge National Laboratory, Oak Ridge, TN 37831, USA
*
Author to whom correspondence should be addressed.
Crystals 2019, 9(1), 5; https://doi.org/10.3390/cryst9010005
Submission received: 8 December 2018 / Revised: 19 December 2018 / Accepted: 19 December 2018 / Published: 21 December 2018
(This article belongs to the Special Issue Neutron Diffractometers for Single Crystals and Powders)

Abstract

:
A two-dimensional (2D) Anger camera detector has been used at the HB-3A four-circle single-crystal neutron diffractometer at the High Flux Isotope Reactor (HFIR) since 2013. The 2D detector has enabled the capabilities of measuring sub-mm crystals and spin density maps, enhanced the efficiency of data collection and phase transition detection, and improved the signal-to-noise ratio. Recently, the HB-3A four-circle diffractometer has been undergoing a detector upgrade towards a much larger area, magnetic-field-insensitive, Anger camera detector. The instrument will become capable of doing single-crystal neutron diffraction under ultra-low temperatures (50 mK), magnetic fields (up to 8 T), electric fields (up to 11 kV/mm), and hydrostatic high pressures (up to 45 GPa). Furthermore, half-polarized neutron diffraction is also available to measure weak ferromagnetism and local site magnetic susceptibilities. With the new high-resolution 2D detector, the four-circle diffractometer has become more powerful for studying magnetic materials under extreme sample environment conditions; hence, it has been given a new name: DEMAND.

1. Introduction

Single-crystal neutron diffraction is known for characterizing magnetic and nuclear structures. However, it is limited by the availability of intense neutron resources and large crystals. New detector technologies have made high-resolution and high-efficiency large area detectors possible, which can speed up the data collection and enable the capability of measuring more detailed information beyond a structure solution, such as short-range order, strain, and defect studies, by modeling the peak profile. A recently developed two-dimensional (2D) magnetic-field-insensitive detector has been equipped at the HB-3A four-circle diffractometer housed at the High Flux Isotope Reactor (HFIR) at the Oak Ridge National Laboratory (ORNL). The detector uses solid-state silicon photomultipliers (SiPM) [1]. Fast data collection by snapshotting the Bragg peaks and short-range order studies have been introduced. The new Anger camera detector on HB-3A enables the full capability of single-crystal unpolarized/polarized neutron diffraction under a much more diverse set of sample environment equipment, including ultra-low-temperature cryostats (50 mK), high-field cryomagnets (up to 8 T), and high-pressure cells (up to 45 GPa), and extends the capability of single-crystal neutron diffraction for studying unconventional magnetic materials, including low-dimensional magnets, highly frustrated magnets, 4d-5d strong spin–orbital coupled magnets, and molecular magnets. By extending these capabilities, the traditional HB-3A four-circle diffractometer [2] has become an extreme sample environment magnetic single-crystal neutron diffractometer with a high-resolution 2D detector (DEMAND). After fully completing the detector upgrade, DEMAND will be able to expand its capacity for neutron diffraction and support a more advanced single-crystal neutron diffraction community together with other similar types of instruments, including the 6T2 thermal neutron four-circle diffractometer (FCD) at LLB, France [3], the D9 hot neutron FCD [4] and the D10 FCD with three-axis energy analysis [5] at ILL, France, HEiDi [6] and POLI [7] at FRM-II, Germany, the ZEBRA thermal single-crystal diffractometer [8] at PSI, Switzerland, and the SENJU extreme environment single-crystal neutron diffractometer [9] at J-PARC, Japan. This paper is the continuation of the earlier one reported in 2011 [2], and so will focus on the newly available area detector, the new sample environment equipment, polarized neutron diffraction, and related new science areas.

2. Anger Camera Detector

The HB-3A four-circle diffractometer had run with a 3He point detector since 2010 and started to use a 2D Anger camera in 2013. The detector is a scintillator-based 2D Anger camera with a size of 51 mm × 51 mm, in actuality a prototype detector for the instrument TOPAZ at the Spallation Neutron Source (SNS) at ORNL [10]; we call this Camera-I. The new detector is magnetic-field insensitive due to the use of solid SiPM, and it also has a better pixel resolution (0.65 mm) than Camera-I (1 mm pixel resolution). We call the new SiPM model Camera-II, and its prototype with a 2 × 2 array of sensor modules (Figure 1a) has already been commissioned and successfully run for a full reactor cycle. Therefore, a larger 2D Anger camera detector of the Camera-II version will be installed at HB-3A at the beginning of 2019. Its size of 348 (vertical) mm × 116 (horizontal) mm can cover vertical angles of 50° at a 30-cm distance to the sample position, allowing the instrument to run in a two-axis mode with access to a large reciprocal space volume, which allows for effective single-crystal neutron diffraction using extreme sample environments. Soon, the detector will be expanded to the size of 348 × 348 mm2 as shown in Figure 1b. Except for the better pixel resolution, larger size, and tolerance to magnetic fields, the new detector is similar to the current prototype Anger camera using conventional photomultiplier tubes (PMTs) [10]. Here, we will introduce some new capabilities gained from the Anger camera detector compared to the 3He point detector.

2.1. 3He Detector and 2D Anger Camera Detector

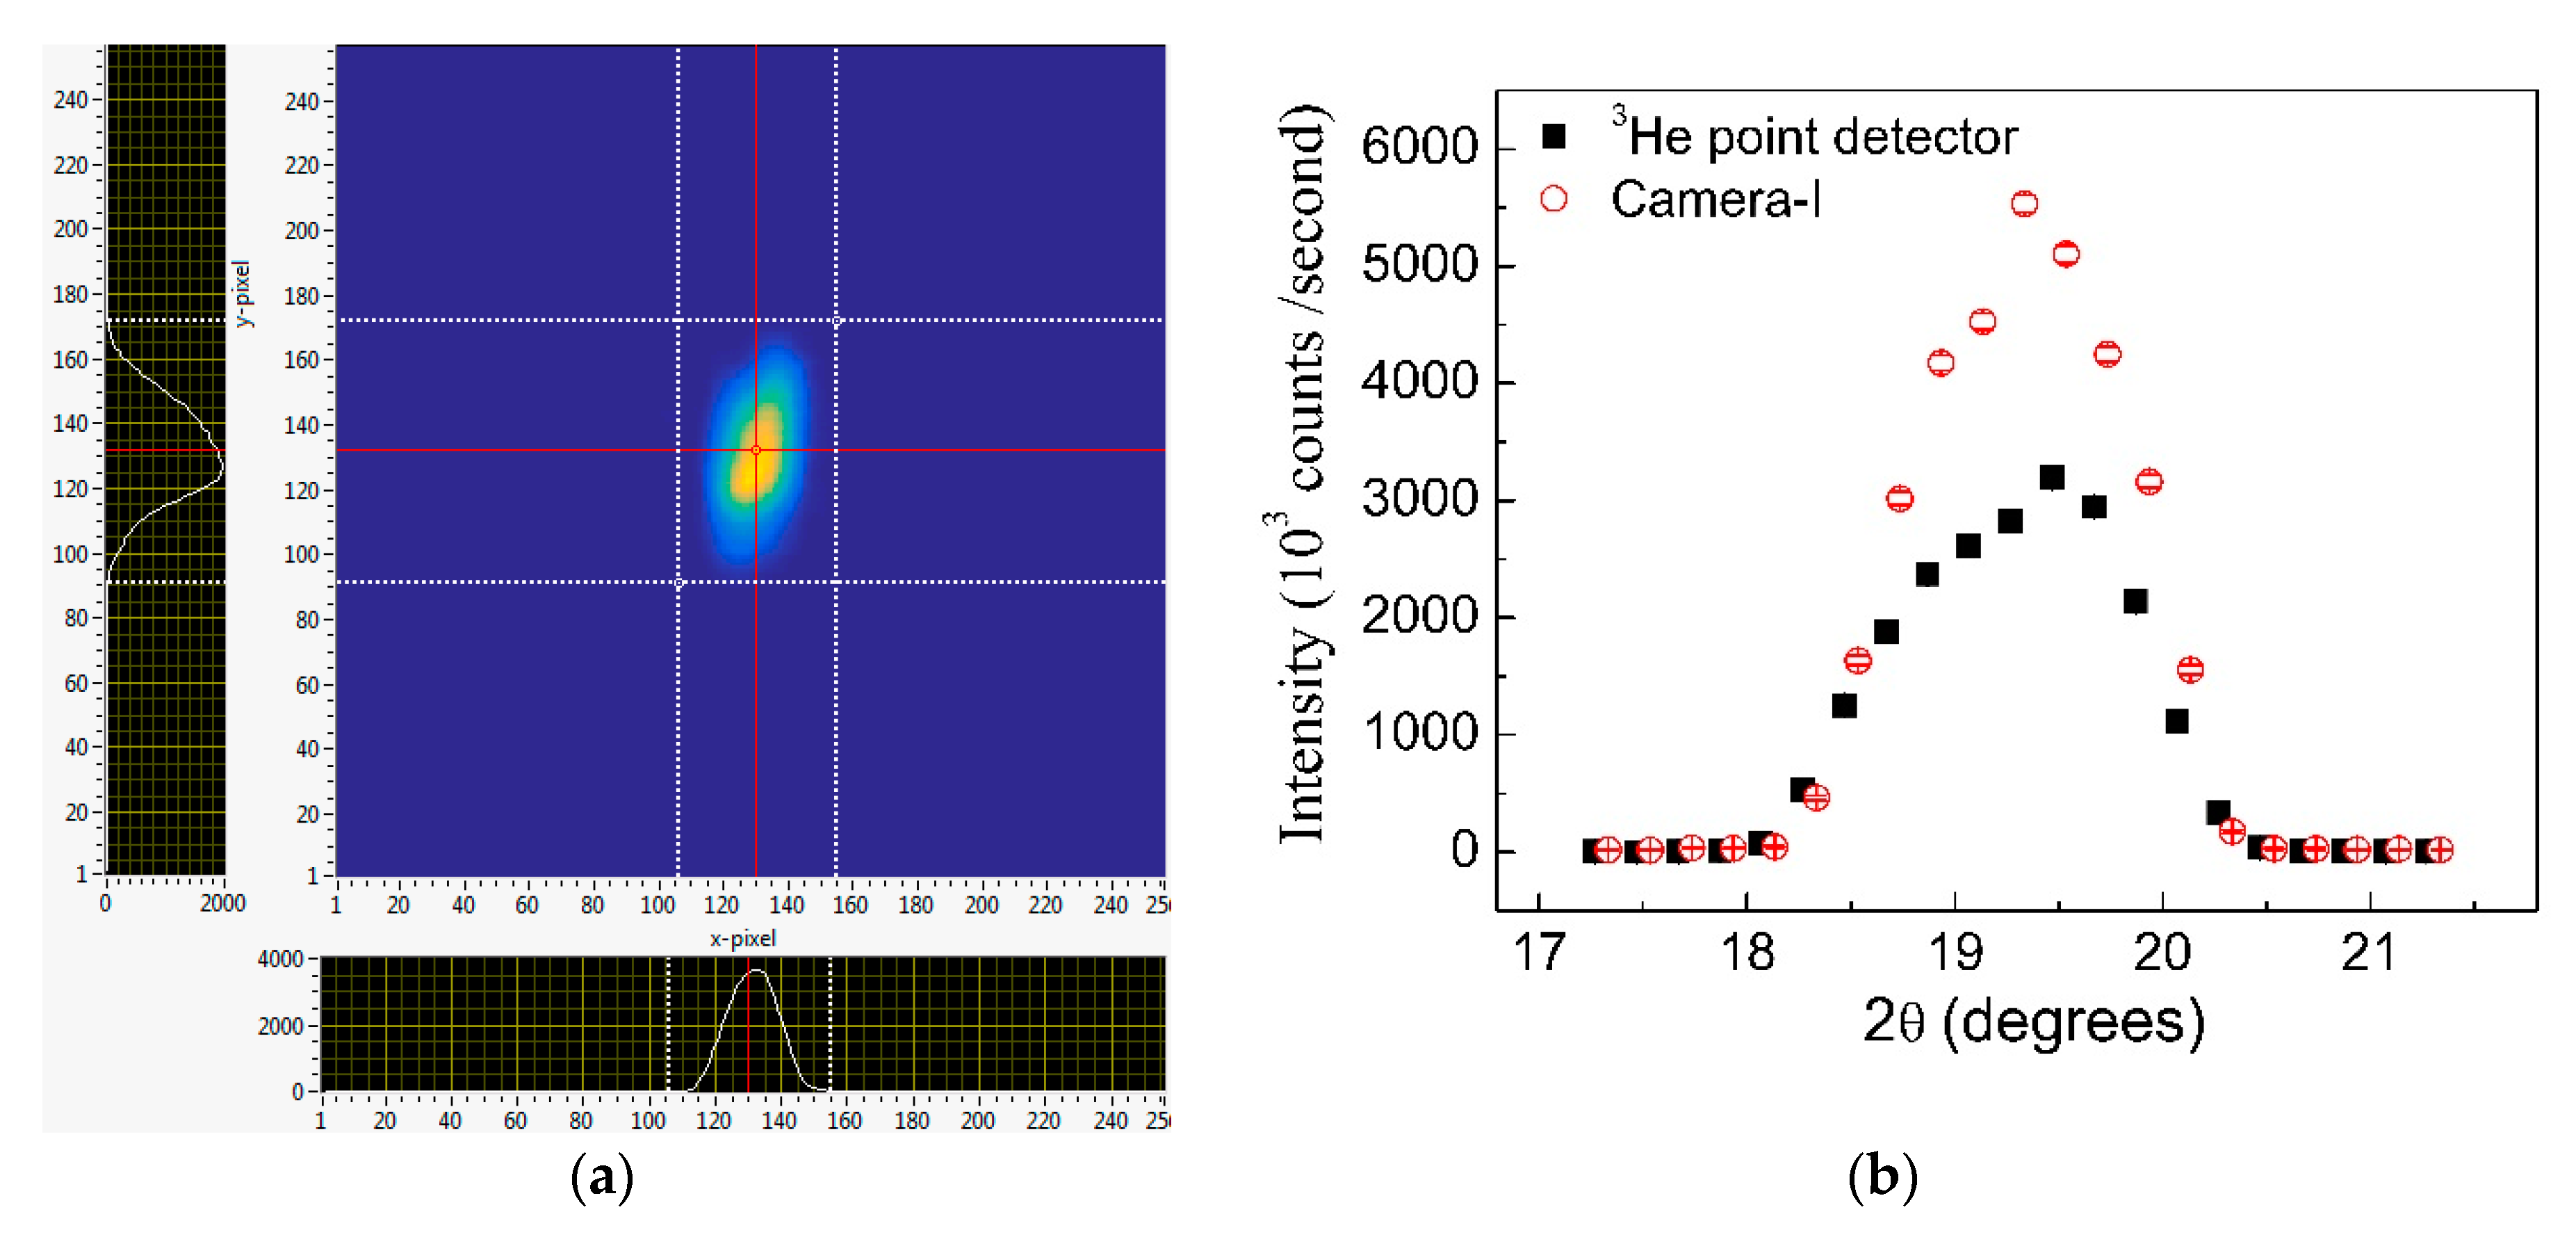
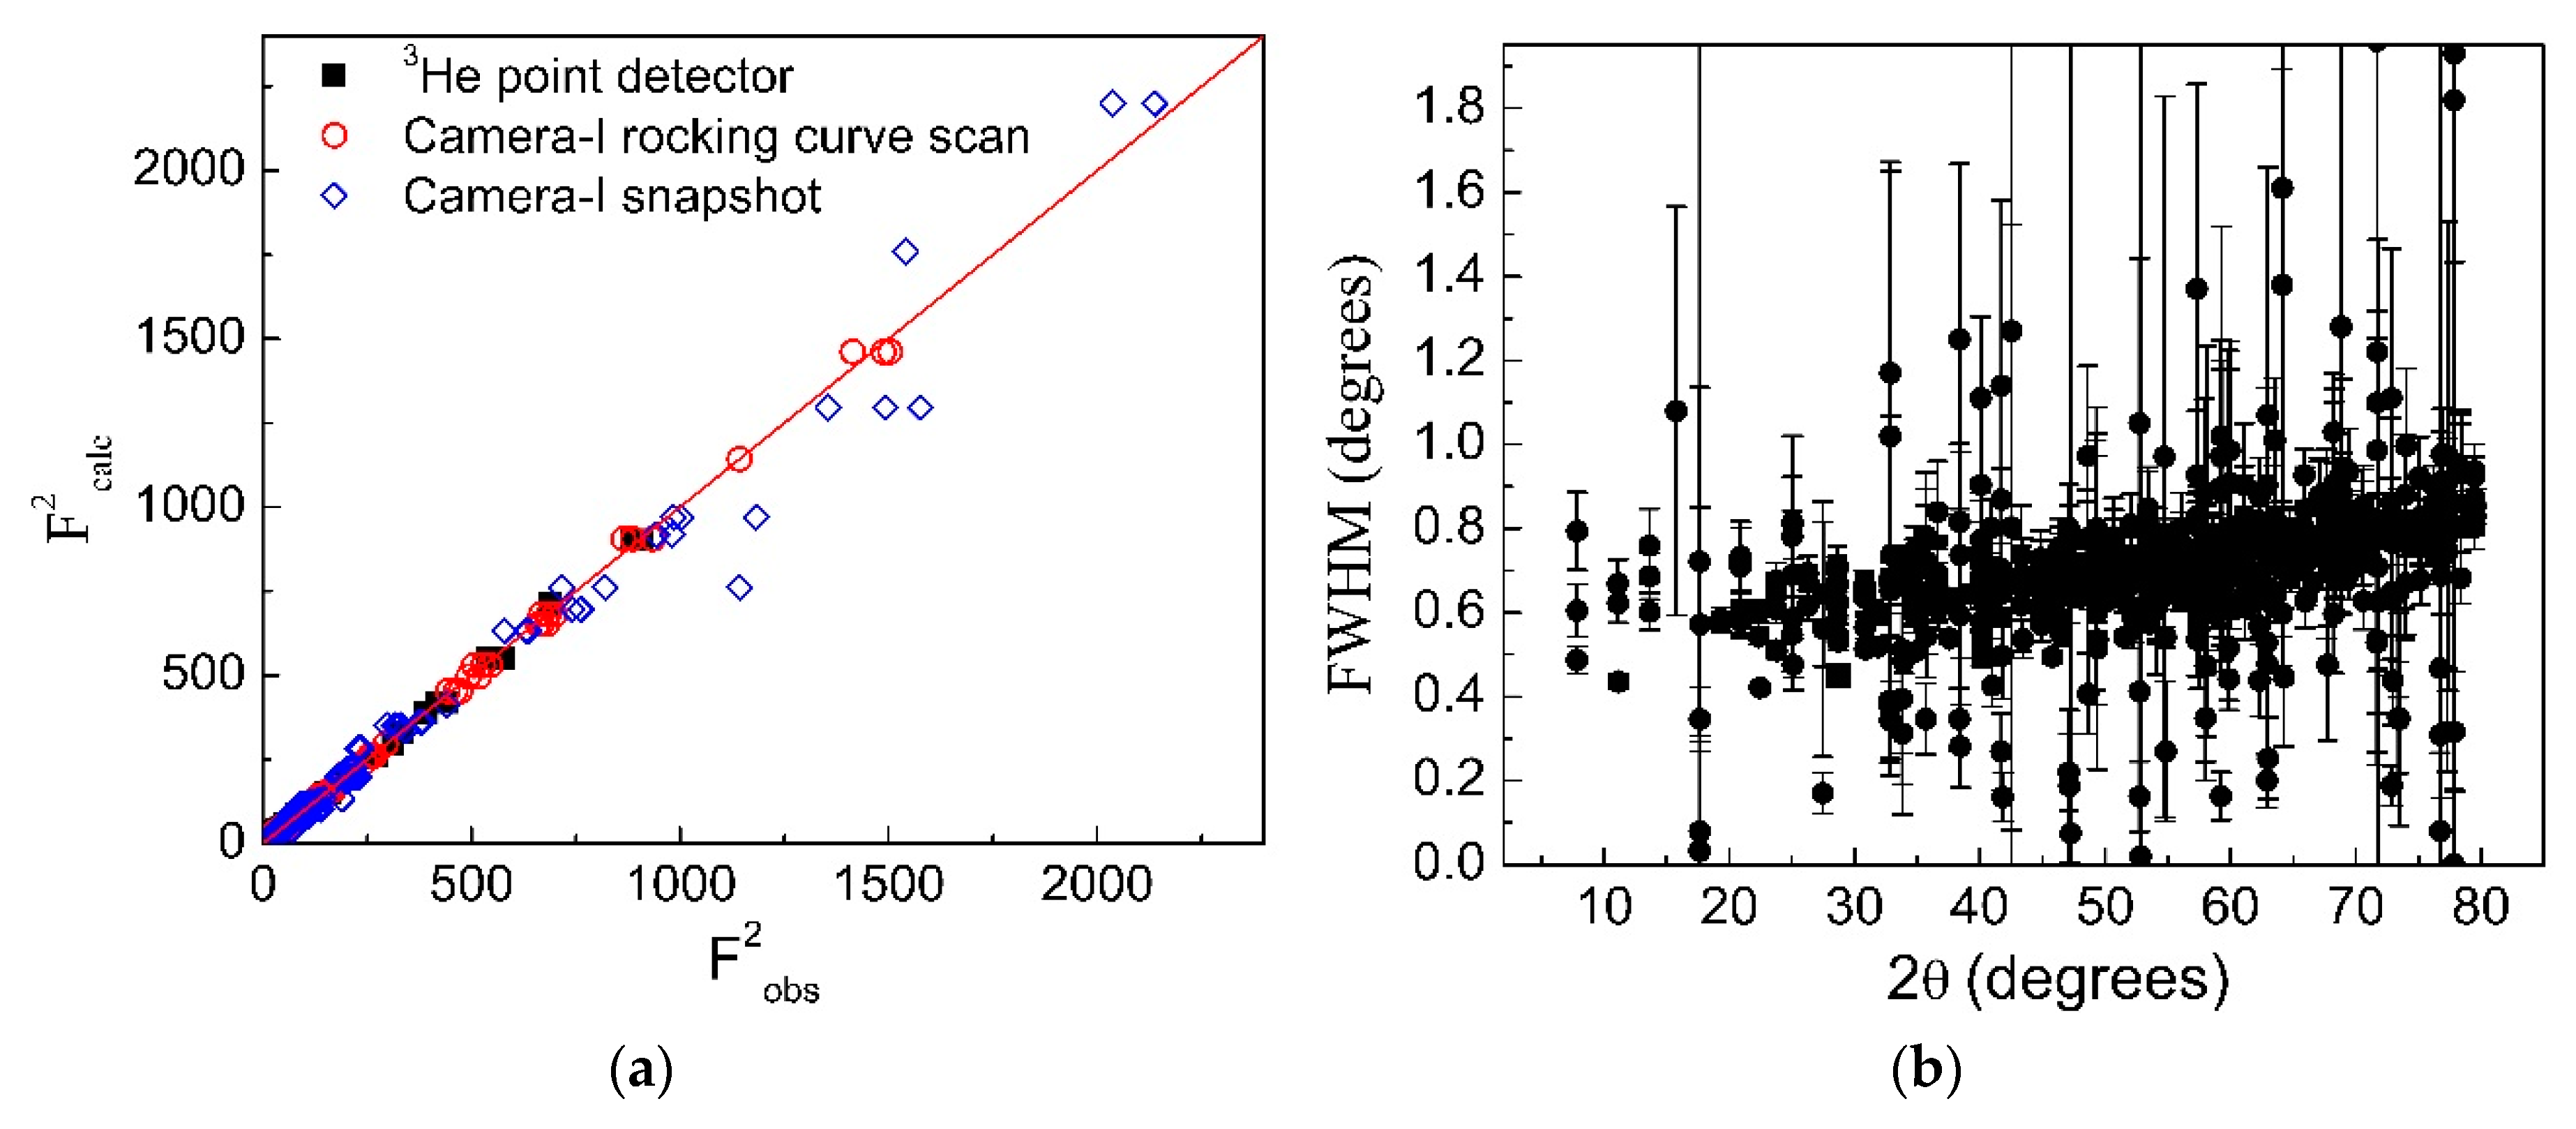
The 3He detector had seven anodes, each with a size of 10 mm in diameter, and only the central anode was used [2]. Camera-I has a size of 51 × 51 mm2. We measured the same crystal, a natural tetrahedrite Cu12Sb4S13, at room temperature in the same mounting orientation with both the 3He detector and the 2D Anger camera detector. The crystal has a spherical shape, and is 3.7 mm in diameter. The neutron wavelength of 1.008 Å from the bent Si-331 [2] was used for the data collection. Figure 2 shows the peak (2 2 2) measured by both detectors. The peak image was observed in Camera-I (Figure 2a). The rocking-curve scans with both detectors are plotted together in Figure 2b. The detector signal is from the predefined region-of-interest (ROI), which has a size of 25 mm in diameter. Camera-I observed 60% extra neutron counts, while the background is about the same at 2 counts/s/cm2 for both detectors. The conversion efficiency of the 3He detector is ~99% for thermal neutrons of 1.008 Å, while the conversion efficiency of Camera-I is estimated to be 80%. The extra intensity gain is due to the Bragg peak size being larger than the aperture of the central anode. Table 1 lists the structural and refinement parameters of Cu12Sb4S13 from the data collected with both detectors for comparison, and Figure 3 shows the plots of the observed structure factors: squared, F2obs, versus the calculated F2cal. The results are consistent with each other within the error bars. By optimizing the ROI, the rocking-curve scans can have a lower background per scanning point, which benefits measurements of small crystals. The ROI can be predefined in the data acquisition program SPICE [11] before starting the data collection or can be redefined in MantidPlot [12] after the experiment. For Camera-I, the rocking-curve scan covers the full peak profile of each Bragg reflection, and the data can be sliced in reciprocal space, which can be used to calibrate dimensionalities of ordering parameters and track structural transitions. The larger the detector gets, the faster new phase searches can run. New phases are usually indicated by peak broadening/splitting, superlattice peaks, magnetic satellite peaks, or/and diffuse scattering. The high pixel resolution ensures that the high instrument resolution is not sacrificed (the closest detector-to-sample distance is ~30 cm for Camera-I without losing the instrument resolution, and it is ~20 cm for Camera-II). The complete DEMAND (with the full 3 × 3 array of detector modules) will advance the data collection speed and the data completeness, enable the access to extreme sample environment conditions that only allow limited or no tilting of sample (Section 3: sample environment), and expand the reciprocal space coverage for half-polarized neutron diffraction to reconstruct magnetization density maps and study atomic magnetic susceptibilities (Section 4: polarized neutron diffraction) under various sample environment conditions.

2.2. Capability for Tiny Crystals

The Anger camera detector enables the capability for rapid data collection by snapshotting Bragg peaks instead of scanning through each reflection (typically 21 points at the minimum are used for step scans). The strong reflections, e.g., over 1000 counts/s, can be measured by rocking-curve scans at 1 second/point, and the mosaic information can be extracted from those strong peaks. The weak peaks that require a long counting time can be measured by snapshotting the peak signal at each Bragg position and corrected by the mosaic distribution and instrument resolution. The data collected on the same tetrahedrite Cu12Sb4S13 were plotted in blue open squares in Figure 3a, and the corresponding F2cal were calculated from the structure parameters listed in Table 1 (the Camera-I detector) except for the scale factor. The discrepancies are because the peak widths are not only Q (or 2θ)-dependent as shown in Figure 3b. The figure plots the peak width versus the detector angle 2θ, which includes the sample mosaic and instrument resolution information. Although, in principle, we should be able to measure a structure by snapshotting the Bragg peaks, the formula of the peak width must be given or modeled. Currently, it only works for tiny high-quality crystals, which is mostly important with this kind of data collection considering that it is not possible to collect a full data set within a reasonable amount of beam time by rocking-curve scanning each reflection. The data collection of 463 reflections with rocking-curve scans takes ~1 min per reflection and 7.7 h in total (including motor motion and data communication time) with 21 points/scan at 1 s/point. Snapshotting 463 reflections with 10 s/point takes 20 s per reflection and 2.6 h in total, including motor motion and data communication time. Snapshotting Bragg peaks is especially important for measuring weak signals or tiny crystals. For tiny crystals with perfect quality (the mosaic is instrument-resolution-limited), all of the reflections can be snapshotted and corrected by the instrument resolution. The smallest crystal that has been measured at HB-3A is an YbFeO3 hexagonal ferrite thin film (5 mm × 5 mm × 50 nm~0.001 mm3), and the ordered Fe-moment size determined was 2 µB [13]. The weak superlattice peaks originating from an Fe/Cu site order in a superconductor material NaCuFeAs were also collected by snapshotting Bragg peaks at HB-3A, and the refinement confirmed that it is a Fe/Cu stripe structure. The counting time for each snapshot was 10 min, and details for that study are reported in [14].

3. Sample Environment

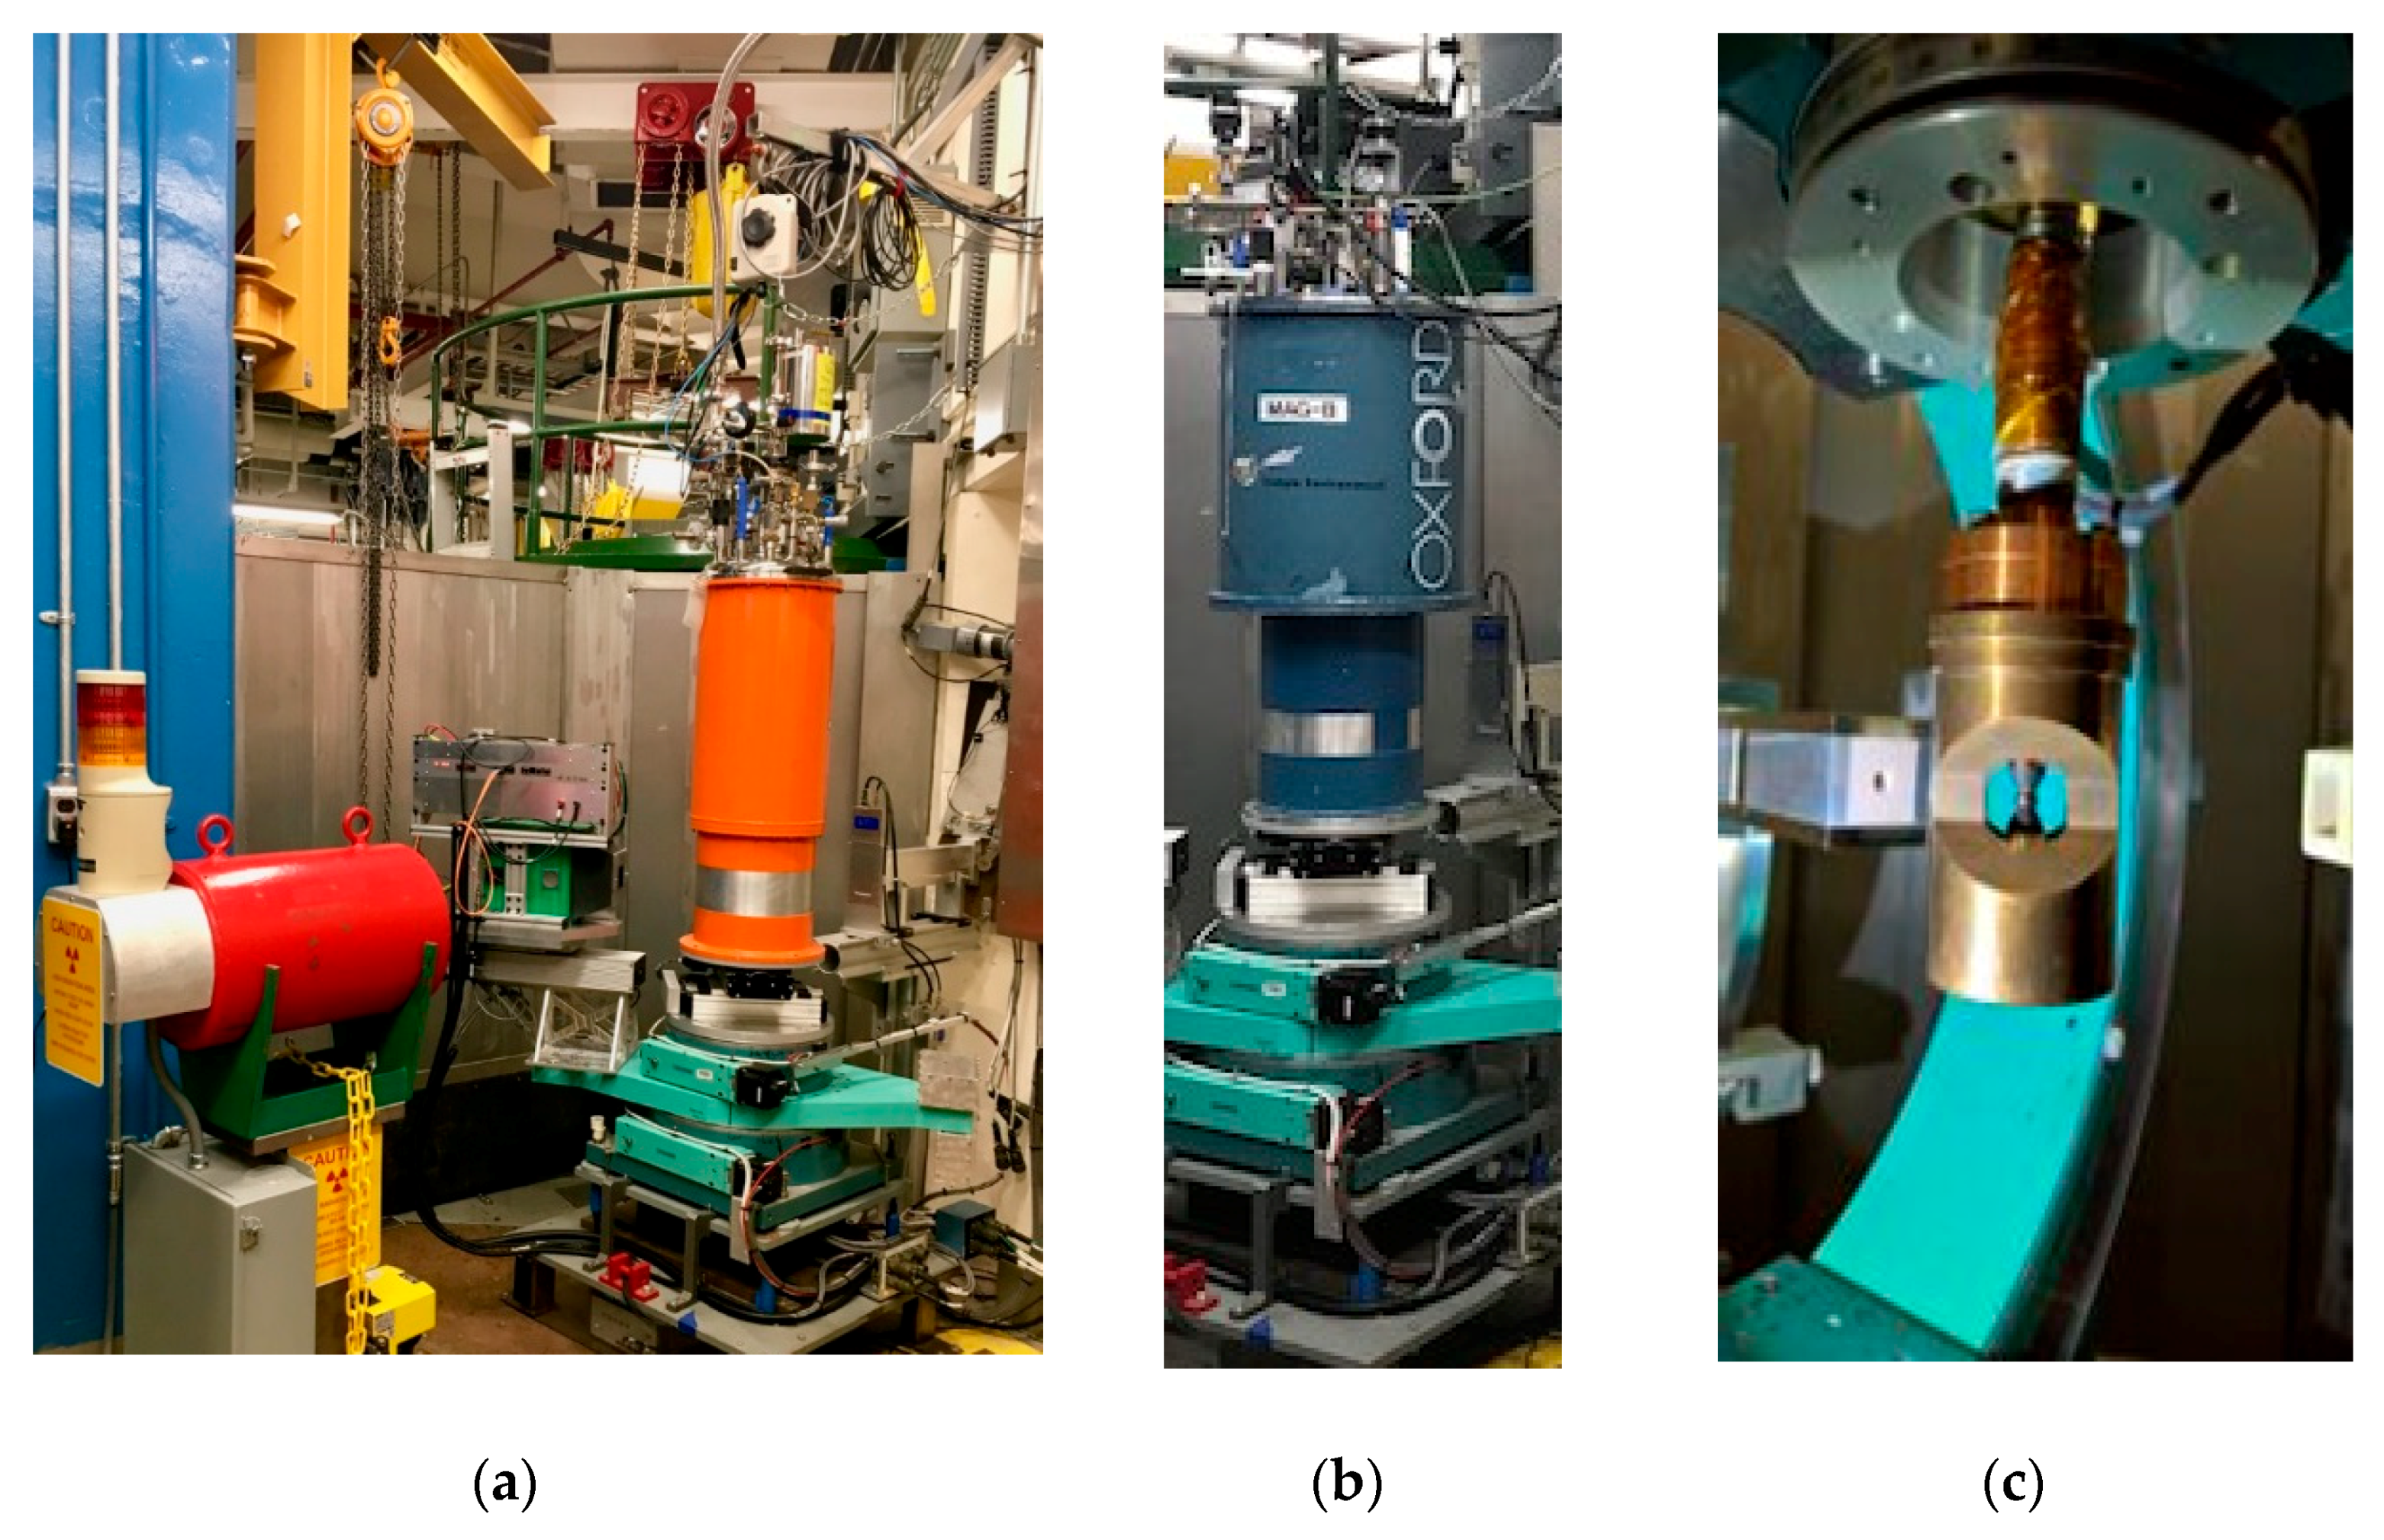
Besides the routine sample environments, such as closed-cycle refrigerators (CCR) for 4–800 K, permanent magnet sets (up to 1 T), electric field options (up to 11 kV/mm), and clamp CuBe pressure cells (up to 2 GPa), that can be run in the four-circle goniometer mode, which enables full access to reciprocal space, the Anger camera detector brings other extreme sample environment equipment (Figure 4) that are only allowed to tilt a few degrees or not allowed to tilt at all, such as ultra-low-temperature down to 50 mK, a high magnetic field up to 8 T, and high pressure up to 45 GPa, for single-crystal neutron diffraction. The large 2D Anger camera detector covers 50° in the vertical and can reach enough out-of-plane reflections to determine structures for these extreme sample environment conditions.
High pressure studies have been performed on a Ba0.4Sr1.6Mg2Fe12O22 hexaferrite crystal that presents a new magnetoelectric coefficient record for single-phase materials [15] by using Diamond Anvil Cells (DACs) that were designed at ORNL [16,17]. Both polycrystalline diamond (Versimax®) and single-crystal diamond anvil cells have been used. While the setup for the Versimax® cell is limited to 10 GPa, the setup used for the single-crystal diamond anvil cell (6 mm anvils, 2 mm culet, steel gasket) is capable of significantly higher pressures and has reached 45 GPa in the past [17]. With the single-crystal DAC, we can precisely calibrate the pressure with the ruby fluorescence method. A thin hexaferrite sample (with a crystal dimension of 0.7 × 0.7 × 0.1 mm3) was loaded inside the gasket chamber (1 mm diameter, 0.2 mm height) with glycerin as the pressure transmission medium. The pressure was calibrated by the ruby fluorescence method at room temperature for each loading step. Figure 5 shows the (220) peak change between the low pressure of 0.2 GPa (i.e., the locking pressure) and the highest pressure of 7.3 GPa. Using glycerin as the pressure medium provides a better hydrostatic pressure on the crystal compared to that using lead as the pressure medium [16], so it enables studies under a higher pressure of 7.3 GPa, the highest pressure that has been reached so far at HB-3A. In principle, higher pressures would be possible; however, in this particular case, the sample did not maintain its single-crystal character upon a further pressure increase, which was likely due to the non-hydrostatic pressure above 7.3 GPa. To reach a higher pressure than 10 GPa, we need to reduce the crystal height to ~0.07 mm (while keeping the lateral dimensions) and using gas pressure transmitting, which in principle allows for ~45 GPa while maintaining detectability on the beamline. So far, the high-pressure experiments are only used for qualitative studies because neutron absorption caused by the gasket and the pressure medium varies with pressure. It requires more calibration with several standard crystals, and various pressure mediums use high-pressure diffraction for crystallographic purposes.

4. Polarized Neutron Diffraction

Besides the high flux (2 × 10⁷ n/cm2/s) and the high-resolution modes (δd/d = 2%) [2] for single-crystal neutron diffraction, HB-3A DEMAND also has added a new capability for half-polarized neutron diffraction with an S-bender supermirror polarizer. Again due to the large high-resolution 2D Anger camera detector, we can easily measure the flipping ratios by snapshotting each reflection with spin up/down neutrons. The extreme sample environments can be used for half-polarized neutron diffraction, too. The resolution of 0.01 µB of a moment size for ferromagnetism is the best we have determined so far. We are still commissioning other polarizers for shorter wavelength neutrons, including a 3He-polarizer and supermirror bender polarizers. The capabilities of measuring spin density maps and local site magnetic susceptibility or atomic magnetic susceptibility are in active development. Further details will be reported in future works.

5. Conclusions

After the full detector and full capability of polarized neutron diffraction are installed, the HB-3A will have migrated away from its traditional four-circle setup and become an extreme sample environment magnetic single-crystal neutron diffractometer, DEMAND, that is fully suitable for studying material science, especially quantum materials, condensed matter physics, solid state chemistry, mineralogy, and other small molecular crystallography and magnetism. Table 2 lists the instrument parameters as a summary for DEMAND.

Author Contributions

Conceptualization, H.C., B.C.C., and K.M.A.; methodology, H.C., B.C.C., K.M.A., Y.W., R.A.R., W.Z., R.G., J.H., B.H., J.M., and G.W.L.; software, W.Z. and R.G.; validation, H.C., B.C.C., and K.M.A.; formal analysis, H.C., B.C.C., and Y.W.; investigation, H.C., B.C.C., K.M.A., Y.W., R.A.R., J.H., B.H., and J.M.; resources, H.C., B.C.C., K.M.A., R.A.R., J.H., B.H., and G.W.L.; writing—original draft preparation, H.C.; writing—review and editing, H.C., B.C.C., K.M.A., Y.W., R.A.R., W.Z., R.G., J.H., B.H., J.M., and G.W.L.; visualization, H.C. and Y.W.; supervision, H.C. and B.C.C.

Funding

The research using polarized neutron diffraction and high pressure is supported by the U.S. Department of Energy (DOE), Office of Science, Office of Basic Energy Sciences, Early Career Research Program Award KC0402010, under Contract DE-AC05-00OR22725. This research used resources at the High Flux Isotope Reactor, a DOE Office of Science User Facility operated by the Oak Ridge National Laboratory.

Acknowledgments

We thank Cornelius Donahue, Christopher Montcalm, and Theodore Visscher for detector development, Van Graves, Jonathan Smith, and Mike Harrington for instrument upgrade support; Matthew Collins, Cory Fletcher, Tyler White, and Christopher M. Redmon for supporting the ultra-low temperature and cryomagnet experiments, Mark J. Loguillo and Gerald M. Rucker for supporting DAC high-pressure loading, Harish Agrawal, Doug Armitage, and John Wenzel for sample environment development, Gary A. Taufer and Larry R. Senesac for SPICE support, and Mike Hittman for machining support.

Conflicts of Interest

The authors declare no conflict of interest.

References

  1. Riedel, R.; Donahue, C.; Visscher, T.; Montcalm, C.; Cao, H.B. A High-Resolution Neutron Anger Camera Using Silicon Photo Multipliers (#2498). IEEE NSS&MIC 2017 N-24-5 Atlanta, USA. Available online: https://www.eventclass.org/contxt_ieee2017/online-program/session?s=N-24 (accessed on 20 December 2018).
  2. Chakoumakos, B.C.; Cao, H.B.; Ye, F.; Stoica, A.D.; Popovici, M.; Sundaram, M.; Zhou, W.; Hicks, J.S.; Lynn, G.W.; Riedel, R.A. Four-circle single-crystal neutron diffractometer at the High Flux Isotope Reactor. J. Appl. Crystallogr. 2011, 44, 655–658. [Google Scholar] [CrossRef]
  3. 6T2, LLB. Available online: http://www-llb.cea.fr/spectros/spectro/6t2.html (accessed on 20 December 2018).
  4. D9, ILL. Available online: https://www.ill.eu/users/instruments/instruments-list/d9/description/instrument-layout/ (accessed on 20 December 2018).
  5. D10, ILL. Available online: https://www.ill.eu/users/instruments/instruments-list/d10/description/instrument-layout/ (accessed on 20 December 2018).
  6. HEiDi, FRM-II. Available online: https://www.mlz-garching.de/heidi (accessed on 20 December 2018).
  7. POLI, FRM-II. Available online: https://www.mlz-garching.de/poli (accessed on 20 December 2018).
  8. ZEBRA, PSI. Available online: https://www.psi.ch/sinq/zebra/ (accessed on 20 December 2018).
  9. BL18, J-PARC. Available online: http://mlfuser.cross-tokai.jp/en/bl18.html (accessed on 20 December 2018).
  10. Riedel, R.; Donahue, C.; Visscher, T.; Montcalm, C. Design and performance of a large area neutron sensitive anger camera. Nucl. Instrum. Methods Phys. Res. A 2015, 794, 224–233. [Google Scholar] [CrossRef] [Green Version]
  11. SPICE–Spectrometer and Instrument Control Environment. Available online: https://neutron.ornl.gov/spice/ (accessed on 20 December 2018).
  12. Arnold, O.; Bilheux, J.C.; Borreguero, J.M.; Buts, A.; Campbell, S.I.; Chapon, L.; Doucet, M.; Draper, N.; Leal, R.F.; Gigg, M.A.; et al. Mantid—Data analysis and visualization package for neutron scattering and μSR experiments. Nucl. Instrum. Methods Phys. Res. A 2014, 764, 156–166. [Google Scholar] [CrossRef]
  13. Sinha, K.; Wang, H.; Wang, X.; Zhou, L.; Yin, Y.; Wang, W.; Cheng, X.; Keavney, D.J.; Cao, H.B.; Liu, Y.; et al. Tuning the Néel temperature of hexagonal ferrites by structural distortion. Phys. Rev. Lett. 2018, 121, 237203. [Google Scholar] [CrossRef]
  14. Song, Y.; Yamani, Z.; Cao, C.; Li, Y.; Zhang, C.; Chen, J.S.; Huang, Q.Z.; Wu, H.; Tao, J.; Zhu, Y.; et al. A Mott insulator continuously connected to iron pnictide superconductors. Nat. Commun. 2016, 7, 13879. [Google Scholar] [CrossRef] [PubMed] [Green Version]
  15. Zhai, K.; Wu, Y.; Shen, S.; Tian, W.; Cao, H.B.; Chai, Y.S.; Chakoumakos, B.C.; Shang, D.; Yan, L.; Wang, F.; et al. Giant magnetoelectric effects achieved by tuning spin cone symmetry in Y-type hexaferrites. Nat. Commun. 2017, 8, 519. [Google Scholar] [CrossRef] [PubMed]
  16. Haberl, B.; Dissanayake, S.; Wu, Y.; Myles, D.A.; Santos, A.M.D.; Loguillo, M.J.; Rucker, G.; Armitage, D.; Cochran, M.J.; Andrews, K.M.; et al. Next-generation diamond cell and applications to single-crystal neutron diffraction. Rev. Sci. Instrum. 2018, 89, 092902. [Google Scholar] [CrossRef] [PubMed]
  17. Boehler, R.; Molaison, J.J.; Haberl, B. Novel diamond cells for neutron diffraction using multi-carat CVD anvils. Rev. Sci. Instrum. 2017, 88, 092902. [Google Scholar] [CrossRef] [PubMed]
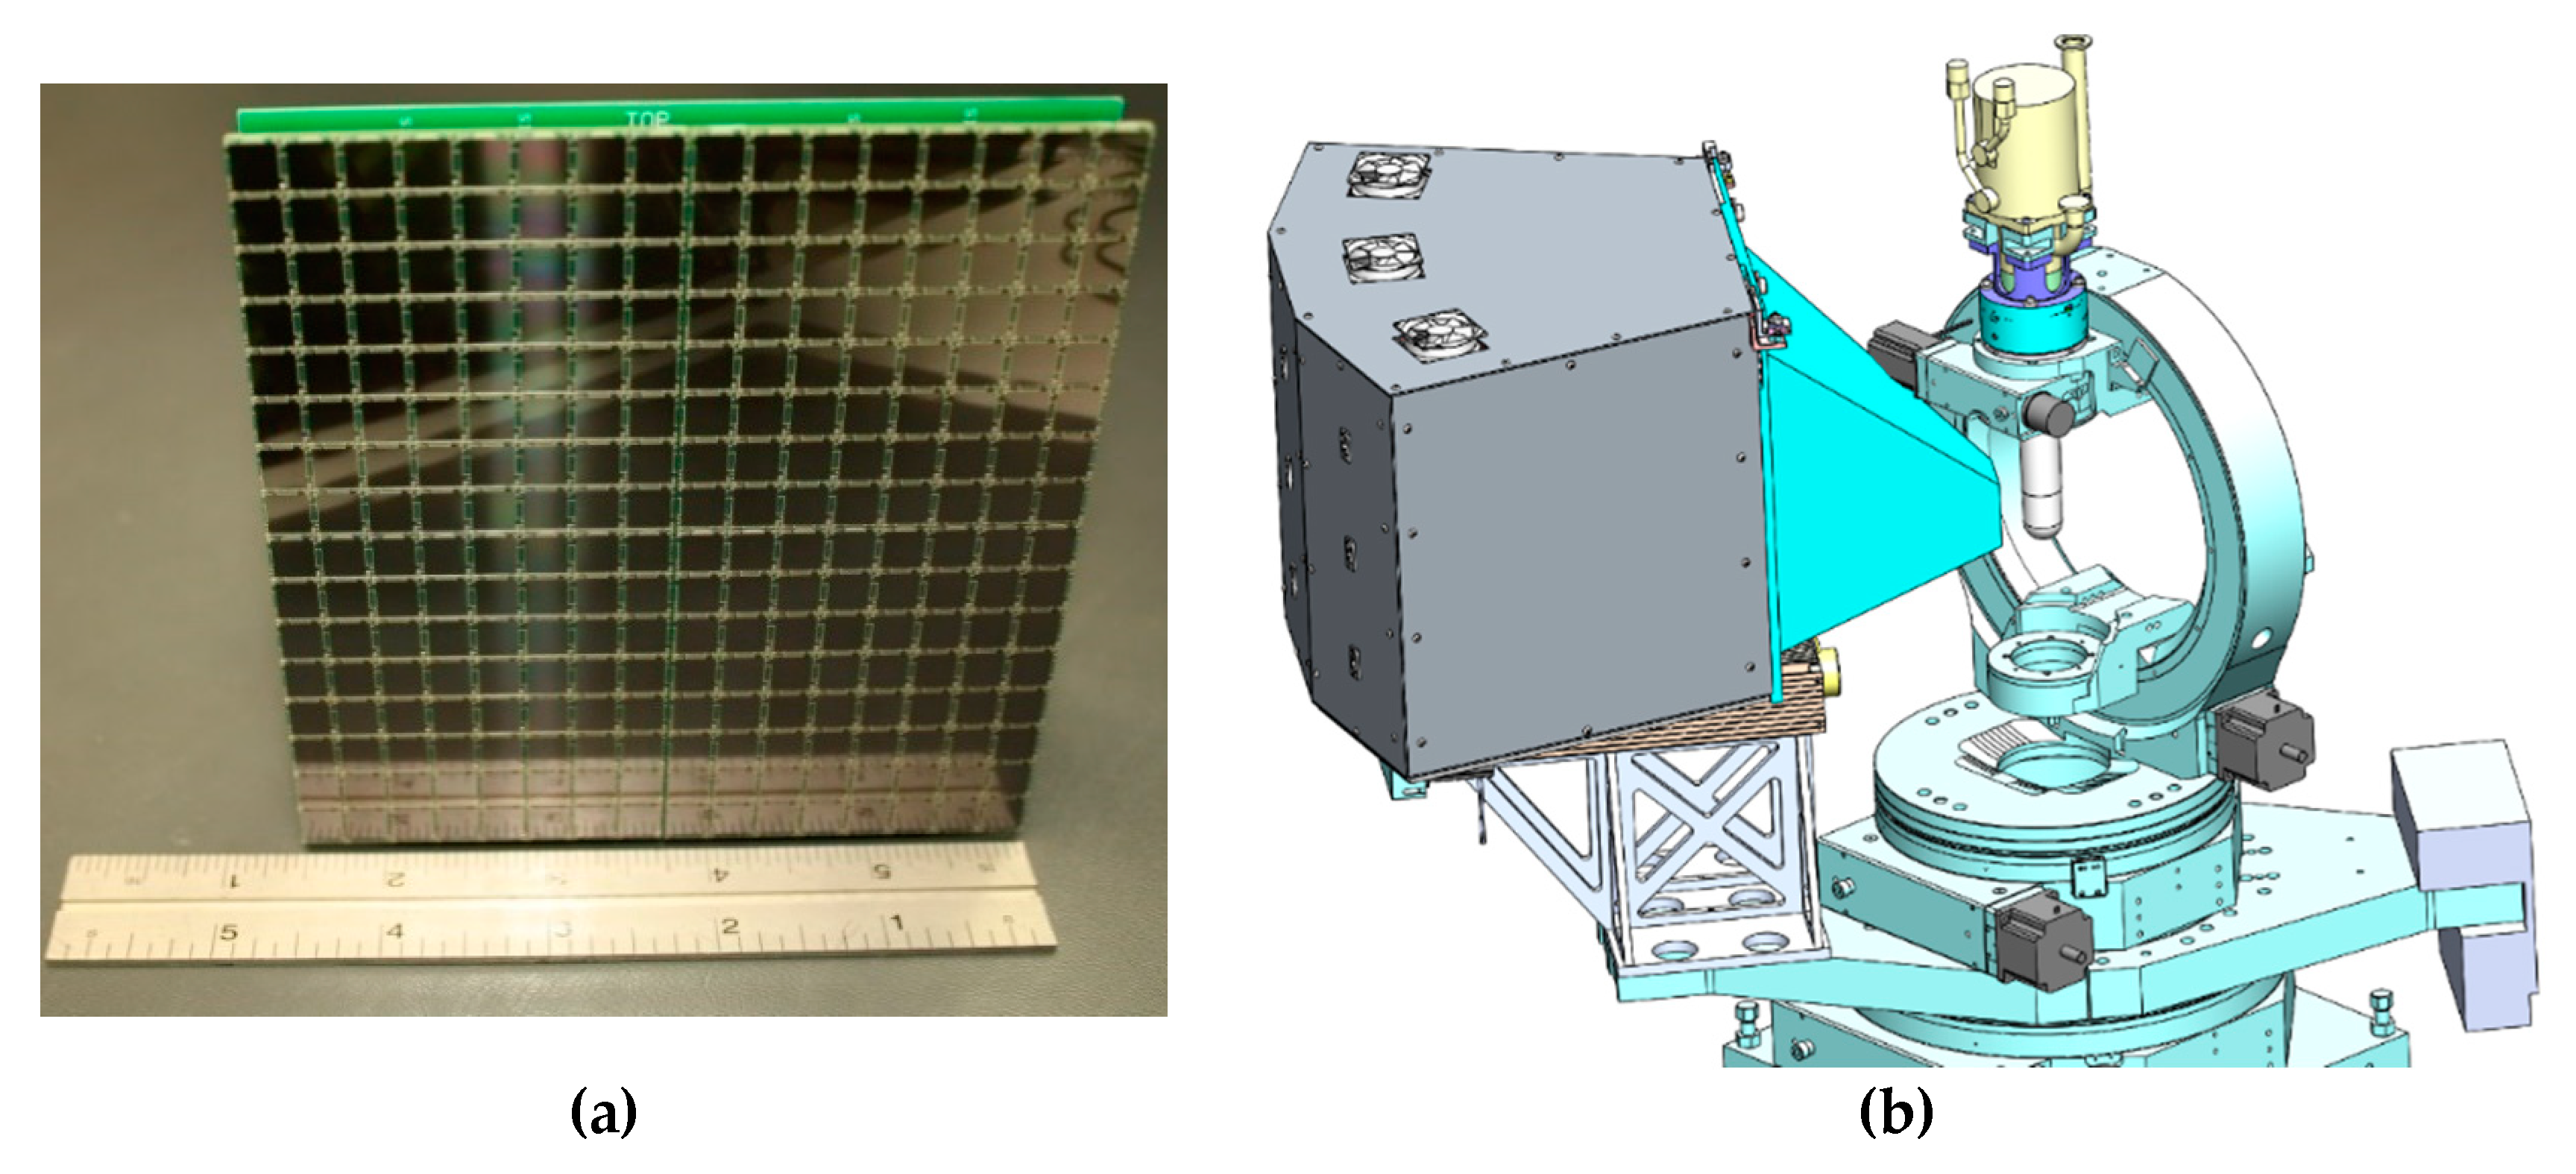
Figure 1. (a) A view of the solid-state silicon photomultiplier (SiPM) made of a 2 × 2 array of sensor modules (116 mm × 116 mm). (b) DEMAND: the future view of the HB-3A single-crystal neutron diffractometer after installing the 3 × 3 SiPM Anger camera detector. The χ/ϕ circles shown are interchangeable with an ultra-low temperature cryostat or a cryomagnet, so the diffractometer can be run in either four-circle mode or two-axis mode, respectively.
Crystals 09 00005 g001
Figure 2. (a) A snapshot of the Bragg peak (2 2 2) of a sphere of a natural tetrahedrite Cu12Sb4S13 crystal recorded by the Camera-I detector. (b) θ-2θ scans of the Bragg peak (2 2 2) recorded by the 3He point detector and the Camera-I detector.
Crystals 09 00005 g002
Figure 3. (a) Observed versus calculated structure factors squared. The data were collected by rocking-curve scans through each reflection with the 3He point detector (black solid squares) and the Camera-I detector (red open circles). The blue open diamonds represent the data collected by snapshotting each Bragg peak with the Camera-I detector (the F2calc were calculated from the same structure parameters that were refined from the data collected by rocking-curve scans with the Camera-I detector). (b) The full-widths-at-half-maximum (FWHMs) of the rocking-curve-scanned peaks versus the detector angle 2θ. The widths were obtained by fitting each peak with a Gaussian function. The larger the error-bar, the weaker is the corresponding peak. The peaks with FWHM error-bars larger than 0.4° are not realistic although they are still plotted.
Crystals 09 00005 g003
Figure 4. (a) A cryostat used for reaching a dilution refrigerator temperature of 50 mK and (b) a cryomagnet used for reaching 0–6 T are installed at HB-3A in two-axis mode to do single-crystal neutron diffraction. (c) The Diamond Anvil Cell (DAC) mounted at the cold head of a closed-cycle refrigerator (CCR) in the four-circle mode.
Crystals 09 00005 g004
Figure 5. High pressure on the hexaferrite crystal with DAC. The peak signal at (2 2 0) captured by the Camera-I detector under pressure: (a) 0.2 GPa and (b) 7.3 GPa. Radial scans at (2 2 0) under a pressure of 0.2 GPa (blue squares) and 7.3 GPa (red dots). The higher background at 7.3 GPa is due to the pressure-induced Bragg peak shift, which now overlaps with a broadened powder peak from the gasket. When the Bragg peak overlaps with powder lines of the sample environment, the peak integration can be done through the rocking-curve scans as shown in (c), where the background caused by the powder scattering is uniform and can be properly subtracted.
Crystals 09 00005 g005
Table 1. The structural parameters of Cu12Sb4S13 measured at room temperature at DEMAND using the Camera-I and 3He point detectors. The space group is I-43m and the lattice parameter a = 10.342(8) Å. The atomic positions are Cu1: Cu (½, 0, ¼); Cu2: Cu (0, 0, z); Sb1: Sb (x, x, x); S1: S (x, x, z); S2: S (0, 0, 0). The atomic displacement parameters U have units of Å2 and only non-zero U elements are listed.
Parameter2D Anger Camera (Camera-I)3He Point Detector
Scale2.88(5)1.81(4)
Extinction0.19(4)0.21(8)
RF24.024.59
RF2w4.8910.8
RF3.495.02
χ20.3091.99
No. of reflections463323
Cu2: z0.2169(3)0.2163(3)
Sb1: x0.2652(2)0.26511(1)
S1: x0.8824(4)0.8828(2)
S1: z0.3598(4)0.3593(2)
Cu1: U11 = U220.0189(8)0.0201(7)
Cu1: U330.023(1)0.026(1)
Cu2: U11 = U220.072(1)0.073(1)
Cu2: U330.014(1)0.013(1)
Cu2: U12−0.054(2)−0.051(2)
Sb1: U11 = U22 = U330.009(1)0.0090(8)
Sb1: U120.001(1)0.0001(9)
S1: U11 = U220.011(1)0.013(1)
S1: U330.011(3)0.010(2)
S1: U12−0.0008(19)−0.002(1)
S1: U13 = U230.001(1)0.001(1)
S2: U11 = U22 = U330.020(3)0.021(3)
Table 2. The DEMAND thermal single-crystal neutron diffractometer.
MonochromatorDouble-Focusing Silicon
Incident wavelengths1.008 Å Si-331; 1.550 Å Si-220; 2.548 Å Si-111;
Detector2D Anger camera (SiPM)
Magnetic-field insensitive (tested at 300 Gauss)
Size: 348 × 348 mm2 (50° × 50°) at SDD = 300 mm;
Pixel resolution: 0.65 mm
Diffractometer anglesFour-circle mode with a CCR:
−27° < 2θ (scattering angle) < 155°; −40° < ω (sample table) < 45°
−110° < χ (tilt) < 110°; −181° < ϕ (sample rotation motor) < 181°
Two-axis mode with cryostat or cryomagnet:
−27° < 2θ < 155°; −177° < ω < 163°
−5° < ν (tilt) < 5°; −181° < ϕ (sample stick motor) < 181°
Sample-Detector distance (SDD)200–400 mm
Maximum flux at sample2.2 × 107 n/cm2/s
Highest resolutionδd/d > 0.3%
PolarizersS-bender supermirror: polarization ratio >95% for λ = 2.548 Å
3He polarizer 90% for λ = 1.550 Å
Sample environmentFour-circle mode with a CCR:
4 K < T < 800 K; 0 < H < 1 T; 0 < P < 40 GPa; 0 < E < 104 V/mm;
Two-axis mode with cryostat or Furnace or cryomagnet:
0.05 K < T < 1800 K; 0 < H < 8 T; 0 < P < 45 GPa; 0 < E < 11 kV/mm;